 Wei Tang
 Mingliang Wang5
 Peixian Li
 Weitao Yan
94% of researchers rate our articles as excellent or good
Learn more about the work of our research integrity team to safeguard the quality of each article we publish.
Find out more
ORIGINAL RESEARCH article
Front. Earth Sci. , 27 July 2023
Sec. Geohazards and Georisks
Volume 11 - 2023 | https://doi.org/10.3389/feart.2023.1132890
This article is part of the Research Topic Geo-information for Geohazard and Georisk View all 11 articles
Ningdong coal base area located in northwestern China is one of the largest coal-producing bases in China. The aim of this work is to investigate a regional-scale mining subsidence over the Ningdong coal base area, by using both conventional and advanced Differential Synthetic Aperture Radar Interferometry (DInSAR) methods. Fifteen L-band SAR images from ALOS-2 satellite and 102 C-band images from Sentinel-1A satellite spanning between November 2014 and July 2019 were used for the analysis. To increase the spatial extent of the displacement signal because of decorrelated effects, we modified the traditional Small Baseline Subset (SBAS) method to incorporate the coherence into the inverse problem, hereafter we call it coherence-based SBAS method. Instead of excluding decorrelated pixels present in the interferograms, we keep all the pixels in the time series analysis and down-weighted the decorrelated pixels with coherence. We performed the coherence-based SBAS method to both the two SAR datasets to obtain the subsidence rate maps and displacement time-series over the mining areas, and compared the results with that from the traditional stacking InSAR method. We evaluated the effectiveness of L-band and C-band DInSAR for monitoring mining subsidence by comparing differential interferograms and displacements derived from SBAS method between ALOS-2 and Sentinel-1A data. Compared to C-band, L-band SAR are less affected by phase aliasing due to large displacement gradients. The most significant subsidence was found at Maliantai mine with −264 mm/year detected by SBAS method from Sentinel-1 data. We validated the InSAR displacement accuracy by comparing both ALOS-2 and Sentinel-1 results with 18 GPS stations above five active mining regions. The average RMSE between InSAR and GPS measurements is 28.4 mm for Sentinel-1 data and 21 mm for ALOS-2 data. Our results demonstrate that the combined exploitation of L-band and C-band SAR data through both conventional and advanced DInSAR methods could be crucial to monitor ground subsidence in mining areas, which provides insights into subsidence dynamics and determine the characteristic surface response to longwall advance.
Land subsidence is one of the most important hazards associated with underground coal mining activities. Surface deformation due to excavation or destruction of mining operations may cause serious damages to urban structures and infrastructures within the mining area. The impacts of surface displacement depend on several factors including the type and size of the mine, the type and size of the structure, and the magnitude of displacement itself. Surface displacement is an indicator of cave development and stress redistribution, and short-period, high-resolution monitoring has the potential to gain insight into displacement dynamics and determine the characteristic surface response to underground mining activities (Wempen, 2020). The northwestern China is rich in coal resources and has good mining conditions, coal production has been transferred to the western region of China (Cai et al., 2022). Longwall mining is a particularly important method of coal production in the western China because coal reserves are deep. When ground subsidence is planned as part of a longwall mining development, a subsidence control plan is required. As a caving method, longwall mining can be used in deep mines with high recovery efficiency. Monitoring the spatial distribution and temporal evolution of land subsidence is critical for mining design, therefore mining activity is implemented to ensure subsidence occurs under predictable and control.
Mining subsidence was traditionally monitored using geodetic methods, including leveling and Global Positioning System (GPS), and occasionally differential analysis using Digital Elevation Model (DEM) derived from Light Detection and Ranging (LiDAR) (Zhu et al., 2020; Liu et al., 2022). Space-borne Differential Synthetic Aperture Radar Interferometry (DInSAR) has been effective to monitor ground surface displacement with the advantages of high accuracy, wide coverage, and independence of weather. Over the mining areas, this technique has proven to be particularly useful to monitor mining subsidence (Wegmuller et al., 2000; Przylucka et al., 2015; Ilieva et al., 2019). However, the traditional DInSAR technique based on a single image pair is vulnerable to decorrelated effects and atmospheric delays. InSAR time series analysis methods have been proposed to exploit the redundancy in InSAR multitemporal stacks to mitigate noise and nuisance signals such as atmospheric effects, residual topography, and decorrelation. While many InSAR time series analysis methods have been developed in the last 2 decades, most of them share similar characteristics which can be categorized into two types of technique (Ferretti et al., 2001; Berardino et al., 2002; Hooper et al., 2007): Persistent Scatterer Interferometry (PSI) and Small Baseline Subset (SBAS).
Subsidence observation to comply with mining regulations is one of the reasons for monitoring subsidence. However, the presence of fast subsidence prevents the InSAR from a robust unwrapping of the interferogram due to phase aliasing and temporal decorrelated effects. A combination of conventional and advanced DInSAR has been proposed to monitor fast evolving mining subsidence over Bytom City, Poland (Przylucka et al., 2015). By comparison of L-band and X-band interferograms over mining areas in central Utah, it is found that L-band data are less affected by phase aliasing effects due to large displacement gradients and by temporal decorrelation due to changes in the surface conditions over time (Wempen and McCarter, 2017). With a short revisit time of 6 days from Sentinel-1 constellation and a prediction model based on the Knothe-Budryk theory, it is possible to track the mining deformation life cycle (Ilieva et al., 2019). A model-assisted phase unwrapping approach was proposed to tackle the phase aliasing problem for the cases when the subsidence gradient exceeds the maximum measurable gradient of DInSAR technique (Dai et al., 2021). Recently, a deep convolutional neural network has been proposed to detect and map localized, rapid mining subsidence from wrapped interferograms, and a phase unwrapping network is designed to unwrap the cropped interferogram patches centered on the detected subsiding locations (Wu et al., 2022).
In this paper, we analyzed 15 L-band SAR images from ALOS-2 satellite and 102 C-band images from Sentinel-1A satellite spanning between November 2014 and July 2019 to investigate land subsidence over a large coal mining area in Ningdong coal base, northwestern China. In order to suppress noise from decorrelated pixels, we modified the traditional Small Baseline Subset (SBAS) method to incorporate the coherence into the inverse problem (we call it coherence-based SBAS method). The signals in the decorrelated pixels over the mining region are down-weighted in the SBAS analysis by using the coherence as weighting matrix. The stacking and coherence-based SBAS InSAR time series analysis methods were applied to analyze the two SAR datasets to obtain the subsidence rate maps and displacement time-series over the mining areas. We evaluated the capability of L-band and C-band SAR data in extracting rapid mining subsidence by comparing the interferograms and displacement time series. We validated the InSAR displacement time-series by comparing both ALOS-2 and Sentinel-1 results with 18 continuous GPS stations above five active mining regions in this coal base. Our results provide insights into subsidence dynamics and determine the characteristic surface response to longwall advance and support the hazard mitigation in the coal base.
InSAR exploits the phase difference between two SAR images taken from slightly different sensor positions and extracts information about the earth’s surface. The computed interferogram contains phase variation
DInSAR attempts to remove the topographic phase
Longer wavelengths tend to have some penetration of vegetation, dry soils, and ice; phase measurements from longer wavelengths tend to be less sensitive to small changes in the surface conditions over time. Additionally, the maximum deformation gradients measurable by DInSAR depend significantly on the radar band and on the ground resolution (pixel size) of the image (Wempen and McCarter, 2017). Longer wavelengths are less sensitive to deformation per pixel than shorter wavelengths, and larger deformation gradients are measurable in higher resolution data.
Besides the interferometric phase, the coherence between the reference and the repeat image is estimated as an indicator for the quality of the phase information. Basically, it shows if the images have strong similarities and are therefore usable for interferometric processing. Coherence can be computed as (Hanssen, 2001):
where
To minimize the impact of atmospheric phase disturbances and unwrapping errors, a series of images can be analyzed to get a more reliable result. This is the stacking method which was originally proposed by Sandwell and Price (1998). By averaging displacements of several dates, the impact of atmospheric disturbances and unwrapping errors is reduced, and the actual displacement patterns become more evident. This assumes that deformation trend is linear between the first and the last image pair, and the phase noises are random in time. However, the assumption of linear deformation behavior might not be true in the mining region, especially over the mines under active excavation. The LOS displacement rate
where
The SBAS algorithm is originally proposed by Berardino et al. (2002), which is based on an appropriate combination of interferometric pairs characterized by small spatial and temporal baselines in order to limit the decorrelation effect. The traditional SBAS method is still less effective over vegetated surfaces due to the loss of coherence; pixels with low coherence are typically excluded from the analysis, leading to the reduced spatial coverage of the final InSAR displacement map. In addition, in areas with significant gradient deformation out of the detection threshold of InSAR technique, such as over the active mining areas, the maximum mining subsidence can be up to several meters; the traditional InSAR time series methods commonly underestimate the magnitude of the large displacement field. Several variants have been developed to improve the performance of SBAS method in extracting surface displacements. One of these variants is using the metrics of phase quality (phase coherence) as a weight of the phase observations in the SBAS analysis (Schmidt and Bürgmann, 2003; Tong and Schmidt, 2016), which we refer to coherence-based SBAS method in our study.
Instead of omitting partly decorrelated pixels in the interferogram, all pixels are kept in the SBAS inverse problem and the phase observations were weighted based on the coherence for each pixel in each differential interferogram. The decorrelated pixels will be down-weighted in the time-series analysis due to their low coherence information. This coherence-based SBAS method is less sensitive to the noise in the input phase data, and it produces a spatially coherent signals with dense coverage. The weighted least squares inversion for each InSAR pixel is (Tong and Schmidt, 2016):
where
The average displacement rates are finally calculated by a linear regression to the InSAR-retrieved displacement time series.
Ningdong Energy and Chemical Industry Base (NECIB) is one of the largest coal mining areas in China. It is located in Ningxia Hui Autonomous Region, northwestern China, which covers an area of 3,484 km2 (Figure 1A). The Ningdong coal base is located in the NECIB, which is one of the largest coal-producing bases in China. This coal base has a coal reserve of 38.6 billion tons, accounting for 84% of the total amount across Ningxia province. With the exploitation of coal resources, the surface deformation due to underground coal extraction has caused damages to the mine facilities and surrounding infrastructures and buildings (Wang et al., 2018; Wang et al., 2021). By 2019, it has been documented that the affected area of mining subsidence in NECIB was up to 22.102 km2 and 191 ground fissures were formed (see some fissures in Figure 1) (Wang et al., 2018). At the same time, mining subsidence has destroyed the natural state of the land, caused water and soil loss, land desertification, and threatened the entire ecological environment in this region. The land cover over this region is shown in Figure 1B. The primary land use is covered by grass, which accounts for 62.3% of the territory inside the NECIB, and the second is cropland, accounting for 20.3%.
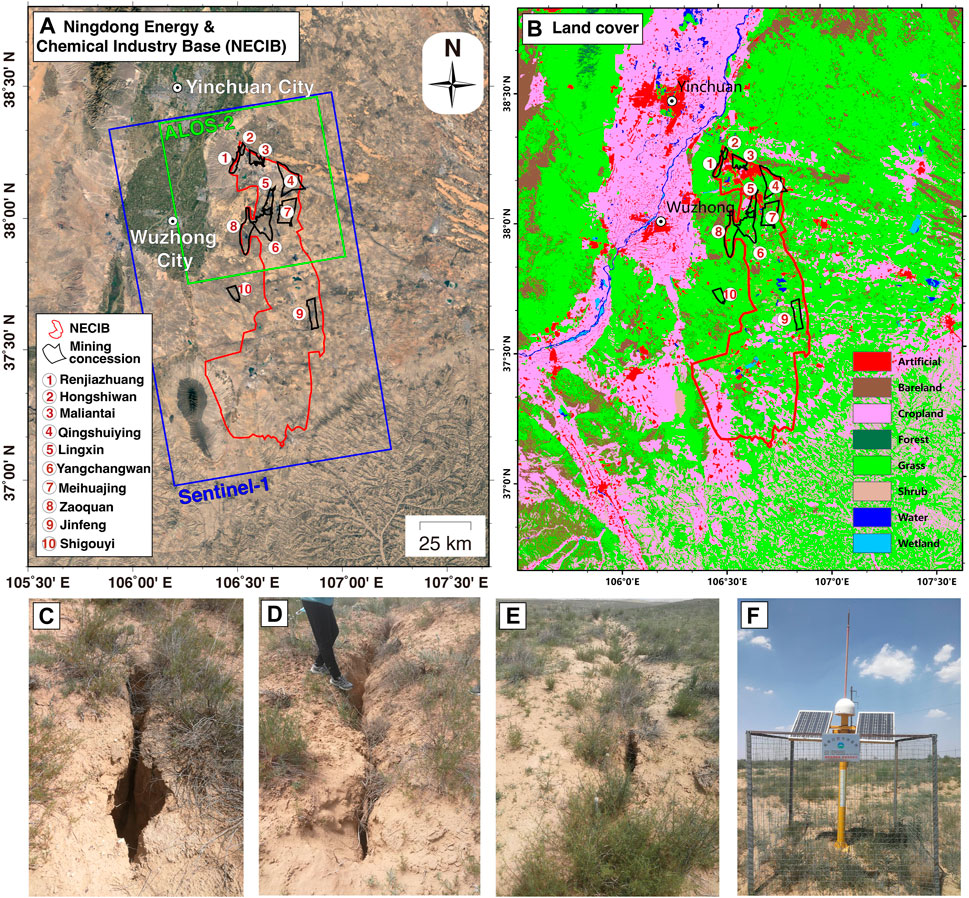
FIGURE 1. (A) Location of the Ningdong Energy and Chemical Industry Base (NECIB), as outlined by the red polygon. The ten mining concessions located in the region are outlined by black polygons and numbered from 1 to 10 in the figure. The names of the corresponding mining concession are marked in the legend. The green rectangle indicates the coverage of the ALOS-2 image and the blue rectangle indicates the processing region of the Sentinel-1 image. (B) The 30-m resolution land cover in the study area, which is obtained from GlobeLand30 (Chen et al., 2014). (C–E) The mining induced ground fissures in the NECIB (F) One of the continuous GPS stations in the NECIB.
The coal mining activities in this region mainly includes 10 coalfields: Renjiazhuang, Hongshiwan, Maliantai, Qingshuiying, Lingxin, Yangchangwan, Meihuajing, Zaoquan, Jinfeng and Shigouyi, as shown in Figure 1. Mining activities started in 2003 and operated till now. Most of the coal mines have adopted the comprehensive mechanized coal mining method with the longwall mining technique, and the caving method is used to manage the roof. A few coal mines adopt the room and pillar mining method. However, it should be noted that some coal mines adopt two or more coal mining methods simultaneously. The production capacity, mining method, and technique of main coal mines in the NECIB are listed in Table 1.
TABLE 1. Production capacity, mining method, and technique of the main coal mines in NECIB [adapted from (Cai et al., 2022)].
Over longer periods (years), the characteristics of subsidence including the angle of draw, displacement, maximum subsidence relative to seam height, depend on both the mining and geological conditions. The mining method, the width of the mined area, the reserve recovery, the rate of mine development, the topography, and the strata thickness, depth, and dip are significant parameters that affect the magnitude, extent, and duration of subsidence. Regional hydrology, geologic structures, and the geotechnical properties of the strata also affect subsidence.
We selected SAR images from ALOS-2 and Sentinel-1 satellites for mining subsidence monitoring. Parameters of SAR data used in this study are listed in Table 2. The coverage of the SAR images can be seen in Figure 1. ALOS-2 satellite works in L band with a wavelength of 24.2 cm, which is conducive to maintaining the interferometric coherence and extracting the large surface deformation in the mining area. We obtained 15 archived acquisitions from ALOS-2 satellite, spanning the period from 29 November 2014 to 6 July 2019. The maximum theoretical detectable displacement between two fringes is 12.1 cm every 10 m (i.e., pixel resolution) for ALOS-2 image. SAR images from Sentinel-1 mission were acquired in C band with a wavelength of 5.6 cm, which is more vulnerable to the decorrelation than L-band data and is more likely to cause phase aliasing due to the rapid surface deformation. The maximum theoretical detectable displacement between two fringes is only 2.8 cm every 30 m for the Sentinel-1 image. However, Sentinel-1 data has a short sampling interval of only 12 days, and data acquisitions are regularly sampled and uniformly distributed in time, which improves the performance of the retrieval of fast deformation over mining areas. A total number of 102 images from Sentinel-1 was used in this study spanning the period from 03 December 2014 to 10 July 2019, which is many more images than that of ALOS-2. These two independent SAR datasets were both acquired in ascending orbit and in similar time spanning which makes it possible to directly compare results between the two SAR datasets.
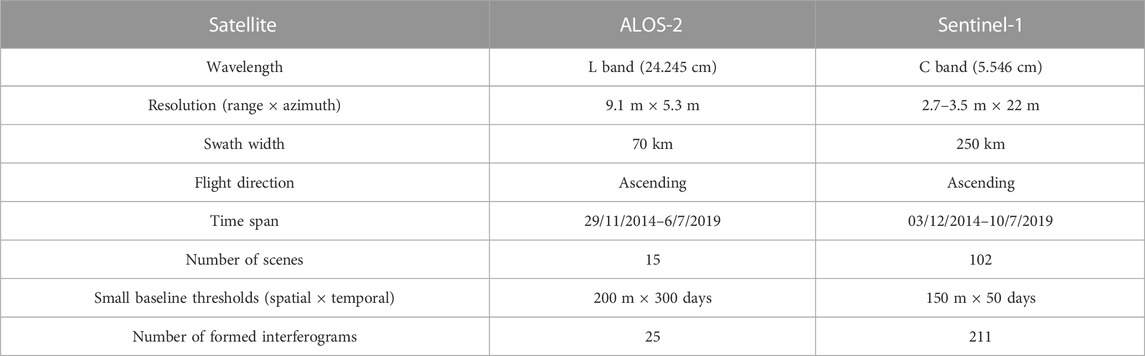
TABLE 2. Parameters of SAR data used in this study.
For the coherence-based SBAS processing, we formed 211 interferograms from Sentinel-1 scenes, with a 50-day temporal baseline threshold and a 150-m perpendicular baseline threshold (Figure 2A). The pairs 20141109–20150603 and 20141203–20150520 were manually connected to avoid an isolated cluster in the interferogram combination due to the large time gap between the first two SAR acquisitions (20141109 and 20141203) and the subsequent acquisitions. C-band data from Sentinel-1 satellite are strongly decorrelated by vegetation or the fast-mining subsidence over this region. The short 50-day temporal baseline threshold was set to mitigate this effect. For the ALOS-2 data with a longer radar wavelength, we set larger thresholds for the spatial (200 m) and temporal (300 days) baselines, and 25 interferograms were constructed (Figure 2B). We also discarded interferograms with strong decorrelation by visual inspection.
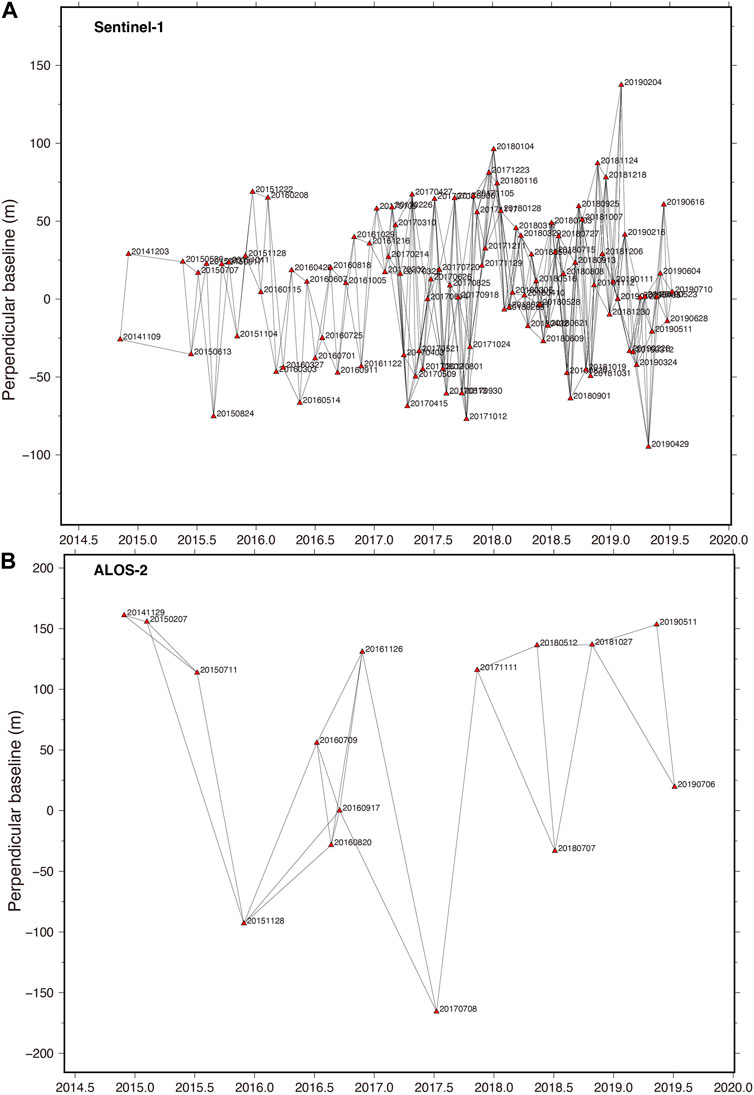
FIGURE 2. Spatial and temporal baselines for Sentinel-1 (A) and ALOS-2 data (B). The red triangles indicate acquisition dates, and the lines represent interferometric pairs. A total number of 211 interferograms were generated from Sentinel-1 data and 25 interferograms were formed from ALOS-2 data.
All the interferograms were produced using the open source InSAR software GMTSAR (Xu et al., 2017). The software is built on a Generic Mapping Tools (GMT) foundation (Wessel et al., 2019). The ALOS-2 data are acquired in the traditional strip-map mode and the image coregistration was implemented based on the standard image cross-correlation method, which achieves sufficient accuracy for the interferometric processing (∼1/10 pixel). While for the Sentinel-1 data, which are the Interferometric Wide Swath (∼250 km) product acquired using the Terrain Observation with Progressive Scans SAR (TOPSAR) mode, the image alignment was implemented with the enhanced spectral diversity (ESD) to achieve the acceptable azimuth registration accuracy (better than 1/200 pixel) (Xu et al., 2017). The topographic phase components were removed using an existing DEM with 30 m spatial resolution from SRTM (Shuttle Radar Topography Mission) (Farr et al., 2007). For the spatial filter, we used a Gaussian filter with a 0.5 gain at a wavelength of 200 m in azimuth and ground range and the decimation factors were set to 8 in range and 2 in azimuth direction. This produces displacement results in geographic coordinate with a grid spacing of ∼50 m. Phase unwrapping is performed by the software SNAPHU (Statistical-Cost, Network-Flow Algorithm for Phase Unwrapping) software (Chen and Zebker, 2001).
In order to monitor the surface movement caused by coal mining, a local surveying institute has deployed high-precision real-time continuous GPS stations in some coal mines in the NECIB (Wang et al., 2018; Wang et al., 2021). At each mine, an independent GPS network was established with a reference station installing on stable ground away from the active mining surface and several monitoring stations installing above the surface of the working panel. In this study, we have access to a total of 18 GPS monitoring stations located in five mining areas, including Renjiazhuang, Maliantai, Lingxin, Yangchangwan and Meihuajing mines (Table 3). Four GPS monitoring stations are available for each mine in Renjiazhuang, Yangchangwan and Meihuajing and three stations are available for each mine in Maliantai and Lingxin. A GPS site photo can be found in Figure 1F. GPS measurements are in three dimensions: East-West (EW), North-South (NS), and Up-Down (UD), often called ENU displacements with respect to a specific reference frame or a few reference points. The GPS antenna’s sampling frequency in time is 1 h. The hourly displacement time series were resampled to a daily sampling interval and were smoothed with a 7-day moving box. The GPS three-dimensional NEU displacement were projected into InSAR LOS direction to validate the accuracy of InSAR-derived displacements in Section 5.3.
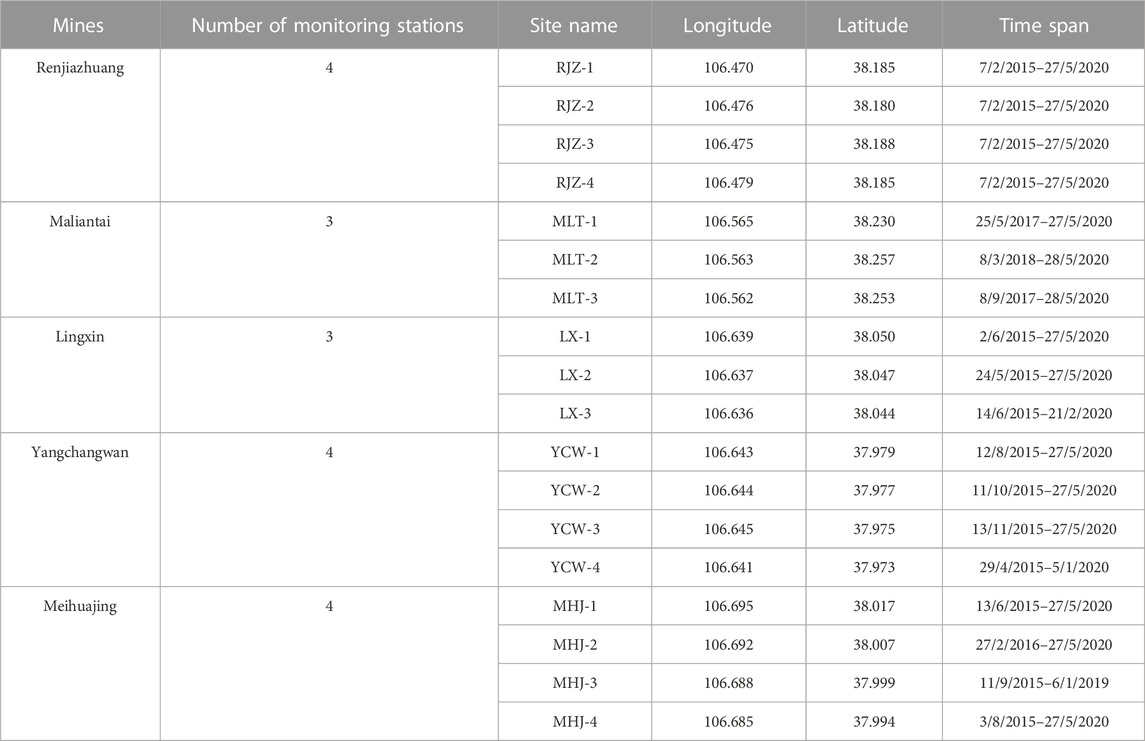
TABLE 3. Available continuous GPS stations in the study.
We applied the stacking InSAR method to the unwrapped differential interferograms formed in Section 3.2 (Figure 2) and the averaged LOS displacement rates is obtained using Eq. 4, as shown in Figure 3. In the results, pixels with temporally averaged coherence values smaller than 0.25 were masked out. The observation of the retrieved results for the two SAR datasets (Figures 3A, B) reveals almost the same spatial distribution and magnitude of the estimated subsidence. Except the Qingshuiying and Jinfeng mines, significant subsidence over these mining areas can be clearly identified in the velocity maps, suggesting a clear relationship between the mining activities and the measured deformation. The zoomed-in view of the averaged LOS subsidence rates from both Sentinel-1 and ALOS-2 datasets and velocity distribution histograms in these active mining areas are shown in Figure 4. The most significant subsidence was identified in Maliantai mine, with a maximum subsidence rate up to 162 mm/year in the LOS direction, which is related to the ongoing mining activities. The least significant subsidence occurred in the mines of Hongshiwan and Shigouyi, with a maximum rate of only ∼50 mm/year, which was probably associated with the residual mining subsidence after mine closure. However, we also found several subsidence features outside of the boundary of the ten mining concessions, such as in the south of Yangchangwan and Meihuajing mines. This might be due to mining activities belonging to another mining concessions which are not included in our study. From Figure 4, we can see that the spatial pattern of the mining subsidence and the distribution of subsidence rates (see histograms in Figure 4) are similar for the results from Sentinel-1 and ALOS-2. Theoretically, the ALOS-2 data with a longer radar wavelength in L band can detect a larger mining subsidence rate than that of Sentinel-1 data, which can be manifested in the observations in mines of Lingxin, Yangchangwan and Meihuajing (see Figure 4).
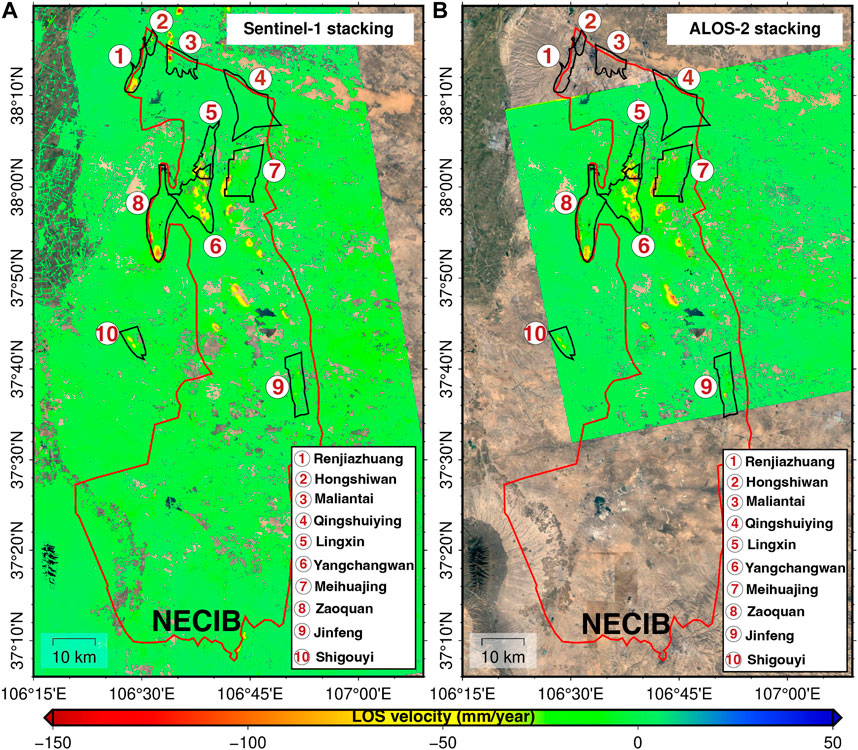
FIGURE 3. Average LOS subsidence rates derived by InSAR stacking method from Sentinel-1 (A) and ALOS-2 (B) images. The ten mining concessions in the NECIB region are outlined by black polygons and numbered from 1 to 10 in the figure.
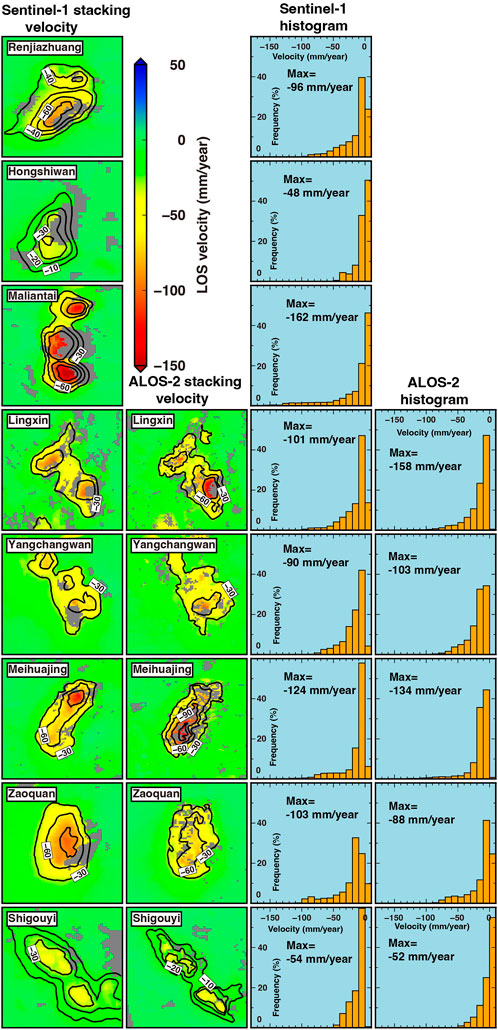
FIGURE 4. Zoomed-in view of the average LOS subsidence rates derived by the stacking InSAR method over the active mining areas. The contours of subsidence rate are superimposed on the map. Note that the contour interval varies for each velocity map. Qingshuiying and Jinfeng mines are not mapped in this figure because no significant displacement patterns were found in these two mines. The first column is velocity derived from Sentinel-1, the second column is velocity from ALOS-2, the third column is the histogram of the Sentinel-1 velocity, and the fourth column is the histogram of the ALOS-2 velocity. The ALOS-2 images do not cover Renjiazhuang, Hongshiwan, and Maliantai. The maximum subsidence rates are indicated in the third and fourth column.
The unwrapped differential interferograms formed in Section 3.2 were also analyzed with the coherence-based SBAS method and the resulting LOS subsidence rate maps are shown in Figure 5. The coherence map of each interferogram were used as the weighting matrix in the computation (see Eq. 6). Generally, the SBAS results in Figure 5 are very similar to the average LOS subsidence rates obtained by the stacking method in Figure 3. We also plotted the zoomed-in view of the average LOS subsidence rates derived from SBAS method and their velocity distribution histograms in the active mining areas, as shown in Figure 6. The maximum subsidence rates and cumulated subsidence over all the ten mines in the NECIB were listed in Table 4. Comparing the results of Sentinel-1 and ALOS-2 data in Figure 6, we found that the Sentinel-1 data detected higher subsidence rates than the ALOS-2 data. We believed that the maximum detectable displacement can be improved by the short revisiting time (12 days) and regularly temporal sampling acquisitions of the Sentinel-1 data. In contrast to Sentinel-1 acquisitions, ALOS-2 images were sparsely and irregularly acquired in time, leading to more severe phase aliasing and decorrelation effects in the interferometric pairs with longer temporal baselines. When comparing the displacement rates between stacking and SBAS methods from the same SAR sensor (Figures 4, 6), we observed that the rates derived from SBAS method are generally larger than that derived from stacking method, especially for the Sentinel-1 results. The largest discrepancy was found at the active mining area of Maliantai that the maximum subsidence rate derived by SBAS method is 264 mm/year from Sentinel-1 data (Figure 6) while the stacking method largely underestimated the subsidence with the maximum rate of only 162 mm/year (Figure 4). This is because the stacking method is assuming a linear behavior of the temporal evolution of surface subsidence and simply averaging the cumulative displacement to obtain the subsidence rates, which does not hold for the mining-induced subsidence, especially during the active mining period. For the coherence-based SBAS method, the estimates of surface motion do not assume a linear model in the analysis. However, we found that over all the ten mines, the SBAS-derived rates from ALOS-2 are not always larger than the stacking-derived rates. This is again most likely due to the sparse sampling and irregular distribution in time domain of the ALOS-2 acquisition.

FIGURE 5. Averaged LOS subsidence rates derived by the coherence-based SBAS method from Sentinel-1 (A) and ALOS-2 (B) images.
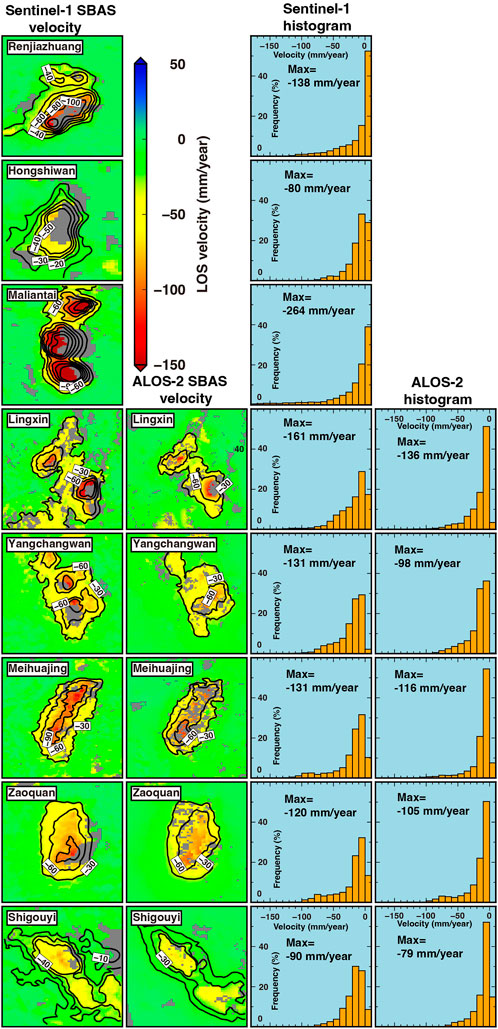
FIGURE 6. Zoomed-in view of the average LOS subsidence rates derived by the coherence-based SBAS method over the active mining areas.
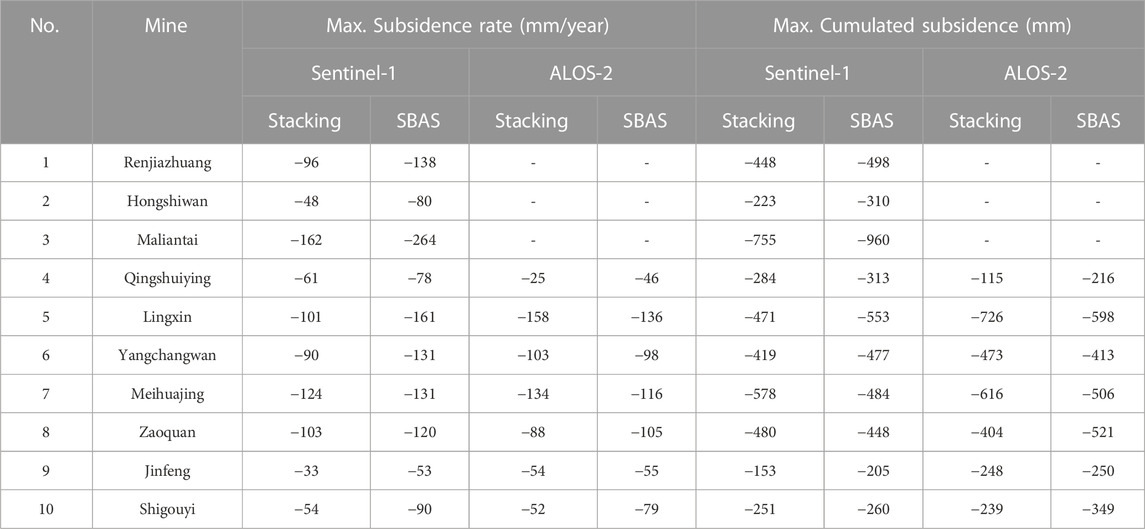
TABLE 4. Maximum subsidence rates and maximum cumulated subsidence from ALOS-2 and Sentinel-1 data over the ten mines in NECIB from stacking and SBAS methods.
In contrast to the stacking InSAR method, which can only retrieve the averaged displacement rate, the SBAS method can obtain displacement time series at each SAR acquisition date. In this section, we show the spatial distribution and temporal evolution of the ground displacements over the active mine of Maliantai in NECIB (Figure 7). Subsidence over the mine of Maliantai shows the largest rate reaching 264 mm/year in the LOS direction from Sentinel-1 data during the time period from December 2014 to July 2019 (Figure 6), indicating an ongoing active mining activities in this mine. The results of the SBAS method help to better understand the kinematics of subsidence over the mine (Figure 7). The results show that three separate subsidence bowls were formed in this mining concession region, of which the southern subsidence bowl has the largest cumulated subsidence up to 960 mm. The middle subsidence bowl also shows a significant subsidence with a maximum cumulated subsidence up to 785 mm. Due to the fast subsidence rates with a large spatial gradient, significant loss of coherence can be observed over these two mines, especially in the east side of the subsidence center (missing coherent pixels). The subsidence bowl in the north shows the mildest subsidence and the maximum cumulated subsidence is 650 mm. More coherent pixels present in this mining area because a better coherence remained.
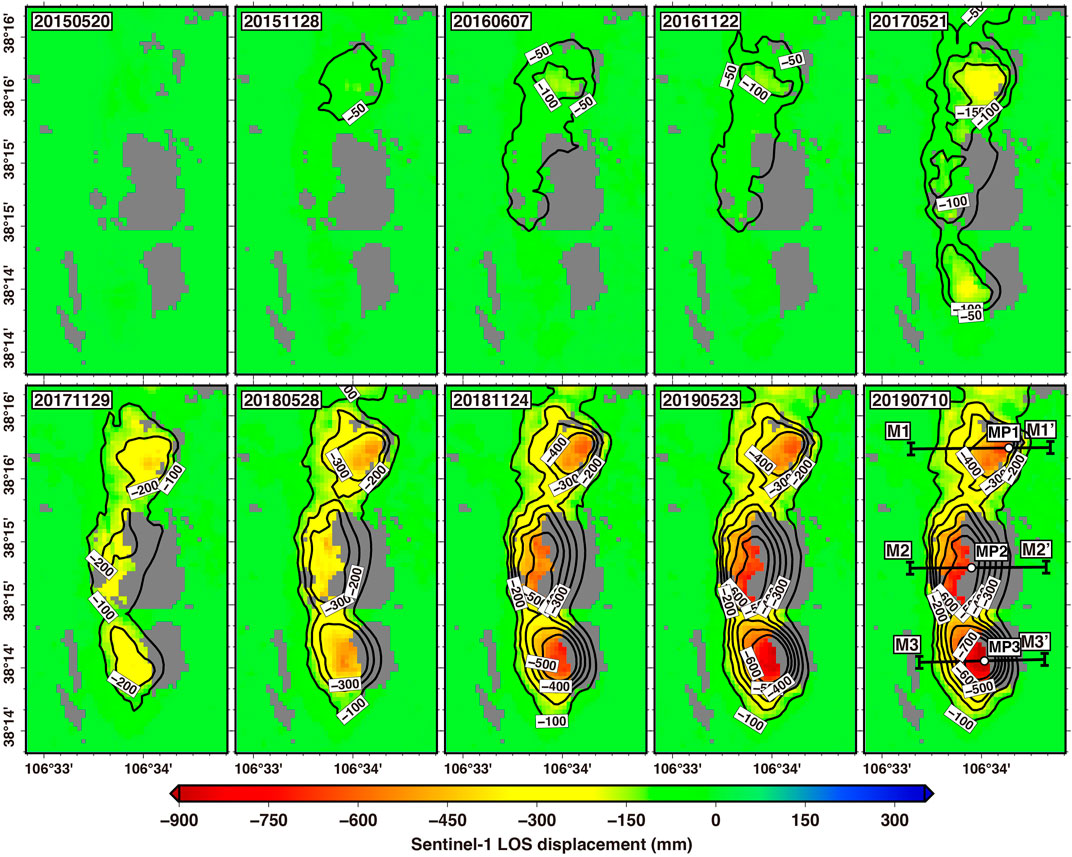
FIGURE 7. The spatial and temporal pattern of ground subsidence over Maliantai mine in NECIB, derived by the coherence-SBAS method from Sentinel-1 data. The subsidence maps are shown at intervals of about 6 months. Three subsidence bowls were formed in this mining concession region. The horizontal black lines on 20190710 (M-M1′, M2-M2′ and M3-M3′) represent the locations of the profiles across the three subsidence bowls, which are shown in Figure 8. The white points (MP1-MP3) on 20190710 marks the location of the displacement time-series shown in Figure 8. These points are located on each profile with the maximum cumulative subsidence. The subsidence contours are superimposed on each map. All the displacements are referenced to the first acquisition date (20141203) of Sentinel-1 data.
Figure 8 provides the progression of subsidence over time along profiles M1-M1′, M2-M2′ and M3-M3′ across the three subsidence bowls, from the 10 Sentinel-1 acquisition dates in Figure 7. For a complete view of the subsidence bowl along these profiles, the decorrelated areas where InSAR pixels are absent were interpolated using an adjustable tension continuous curvature spline (Smith and Wessel, 2012). The maximum measured subsidence during the study period is −600 mm along M-M1′, −687 mm along M-M2′ and 900 mm along M-M3′. Together with the displacement time series at points MP1, MP2 and MP3 (the largest cumulated subsidence point on each profile) in Figure 8, we can track the temporal evolution of the mining subsidence at each mine. Three distinct phases of the surface subsidence induced by mining extraction can be clearly identified on the displacement time series at the location of MP1. The subsidence is slow during the initial phase of mining exploitation from July 2015 to July 2017, with a subsidence rate of −37 mm/year. The subsidence becomes linear over the mining phase during August 2017-July 2018 and the subsidence rate increases to −378 mm/year. Lastly, the subsidence rate decreases through the residual phase with −55 mm/year from August 2018 to the end of our study period (10 July 2019). The residual subsidence can last for decades after the end of the underneath exploitation, which is connected to the visco-plastic responses of the overburden and the compaction of caved zones. The amplitude of the late subsidence is related to the mined thickness (Modeste et al., 2021). Over the middle subsidence bowls, the subsidence rate at the locations of MP2 during the initial phase between January 2016 and October 2017 is −52 mm/year. During the mining phase between November 2017 to the end of our study period, the subsidence rate increases to −343 mm/year at point MP2. The initial phase of the mining subsidence in the south is between July 2016 and October 2017 and the subsidence rate is −95 mm/year at point MP3 during this period. The rate increases to −437 mm/year during the mining phase from November 2017 to the end of our study period. We did not see a decreasing subsidence rate at the two locations MP2 and MP3 during our study period, indicating that underground mining activities were ongoing in the mines. However, we found a pattern of relative stable ground between April 2018 and July 2018 for both MP2 and MP3, which might be due to a stoppage stage of coal mining in this 4-month period.
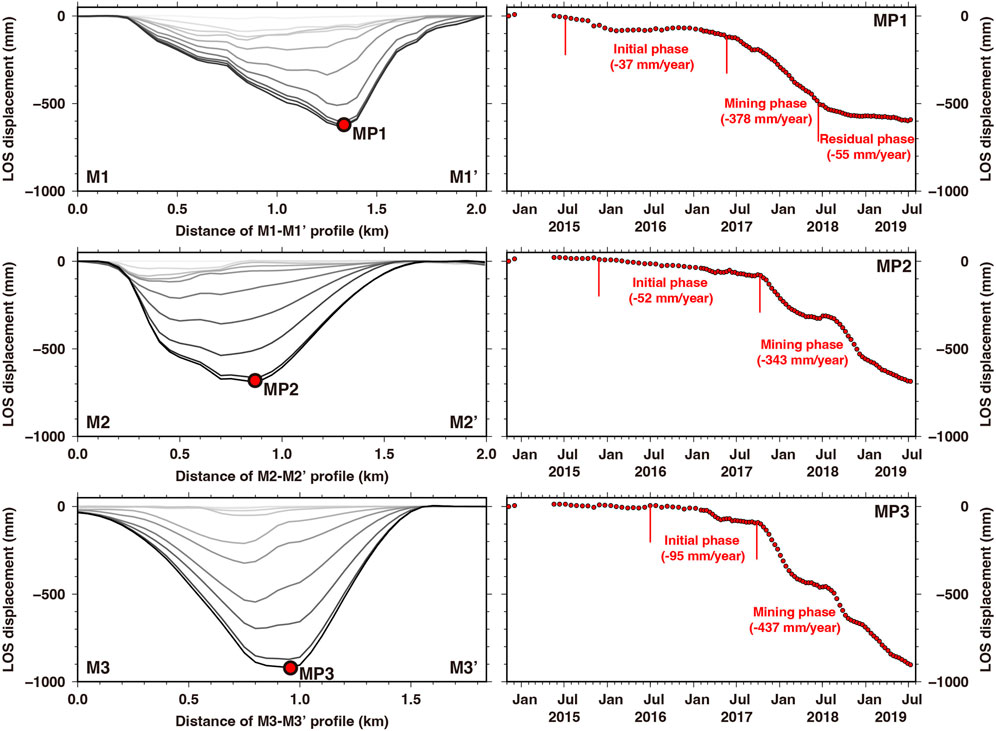
FIGURE 8. Progressively cumulated subsidence along profiles M1-M1′, M2-M2′ and M3-M3′ across the three subsidence bowls over Maliantai mine (left panel). The locations of the three profiles can be found in Figure 7. The red points (MP1-MP3) on each map represent the locations where the maximum cumulated subsidence resides along each profile (see the point locations in Figure 7), and the displacement time-series of each point is shown in the right panel.
To compare subsidence obtained from Sentinle-1 and ALOS-2 dataset, we first show examples of differential interferograms from the two SAR sensors in Figure 9. From this comparison we also illustrate the effects of phase aliasing due to fast subsidence and coherence loss over the active mining areas, which is one of the limitations of the conventional DInSAR technique. The reference and repeated images of the ALOS-2 and Sentinel-1 interferometric pairs have the same acquisition dates (reference acquisition is 20151128 and repeated acquisition is 20170708), so the phase in the two interferograms contains the same magnitude of displacement. Very local circular shaped fringes induced by mining subsidence were clearly identified in the ALOS-2 interferogram (Figure 9A). The locations of these fringes correspond with the locations of coal mining areas, indicating a clear relationship between the mining activities and measured displacement. Most of mining-induced fringes cannot be identified from the Sentinel-1 interferogram (Figure 9C) because the C-band data is more vulnerable to large gradient deformation. Coherence loss (Figures 9B–D) can be observed for both the two interferograms due to the long-time interval (588 days) between the reference and the repeated acquisition. The coherence loss increased over the active mining areas due to the large gradient deformation, causing the surface scattering characteristics change significantly between the two acquisition dates. Obviously, the L-band ALOS-2 interferogram generally remains better coherence than the C-band Sentinel-1 interferogram. Significant atmospheric artifacts were also found in the top left corner of Figure 9C which even obfuscates the deformation fringes in the Sentinel-1 interferogram.
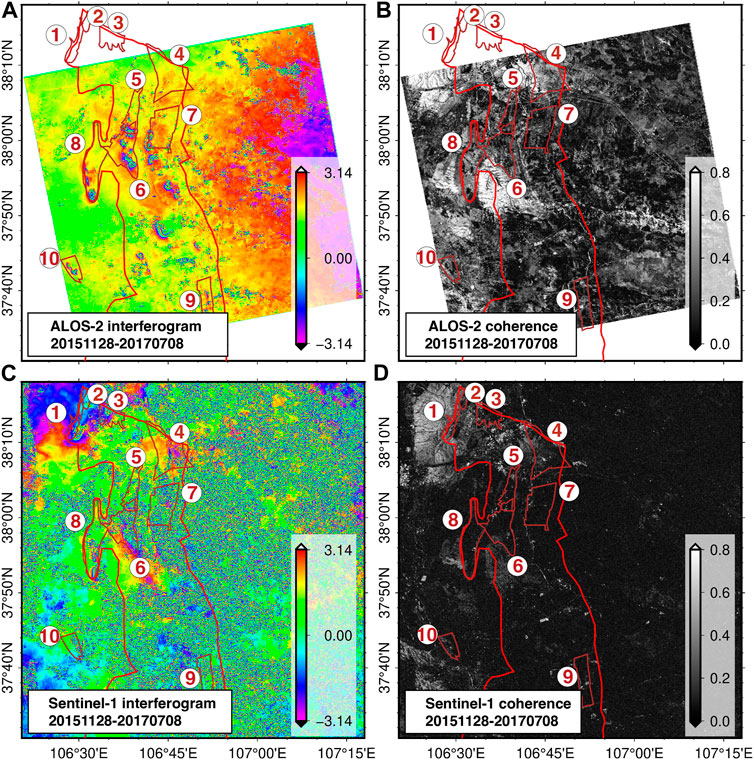
FIGURE 9. Examples of differential interferograms and the corresponding coherence maps from ALOS-2 and Sentinel-1, processed with GMTSAR. The time interval (588 days) of the reference and repeated scene of the interferometric pair is the same for the two interferograms. The coherence map is computed using Eq. 3.
We further show the enlargement of interferograms from ALOS-2 and Sentinel-1 data over one of the active mining areas in the NECIB (Figure 10). This mining area is located in the Meihuajing coal mine. Phase fringes due to mining subsidence can be identified by both L-band and C-band DInSAR interferograms, but in the areas with the largest subsidence magnitude, the fringes are difficult to interpret due to phase decorrelation and phase aliasing effects. Therefore, precise estimation of the maximum subsidence magnitude is not attempted, but in many of the interferograms the subsidence magnitudes can be reasonably estimated. We can observe a clear increasing number of fringes in the ALOS-2 data with the increase of subsidence magnitude, even on the 20170708 interferogram with a time separation of 588 days. However, the fringes became totally blurred on the last Sentinel-1 interferogram. These phenomena highlight a major limitation of the traditional DInSAR technique, which is not suitable to precisely measure large deformation with significant spatial gradients, because the phase aliasing effects prevent reliable unwrapping. The overall phase quality is low; for ALOS-2 data, the average coherence ranges from a high of 0.34 for the first interferogram (224 days interval) to a low of 0.22 for the last interferogram (588 days interval). For the C-band data of Sentinel-1, although the time gaps between interferometric pairs are shorter than the ALOS-2 data, the coherence loss is much more significant than the L-band data of ALOS-2; the average coherence ranges from a high of 0.23 for the first interferogram (only 24 days interval) to a low of 0.09 for the last interferogram (588 days interval). Except changes in the surface characteristics, very large deformation gradients can cause coherence loss, which can be seen in the mining subsidence center. The effectiveness of DInSAR for quantifying displacement is dependent on the radar wavelength. Generally, subsidence magnitudes are measurable in the ALOS-2 data with L radar band, the Sentinel-1 data with C radar band are more affected by temporal decorrelation and phase aliasing effects, and precisely measuring the subsidence magnitudes using C-band data is more difficult.
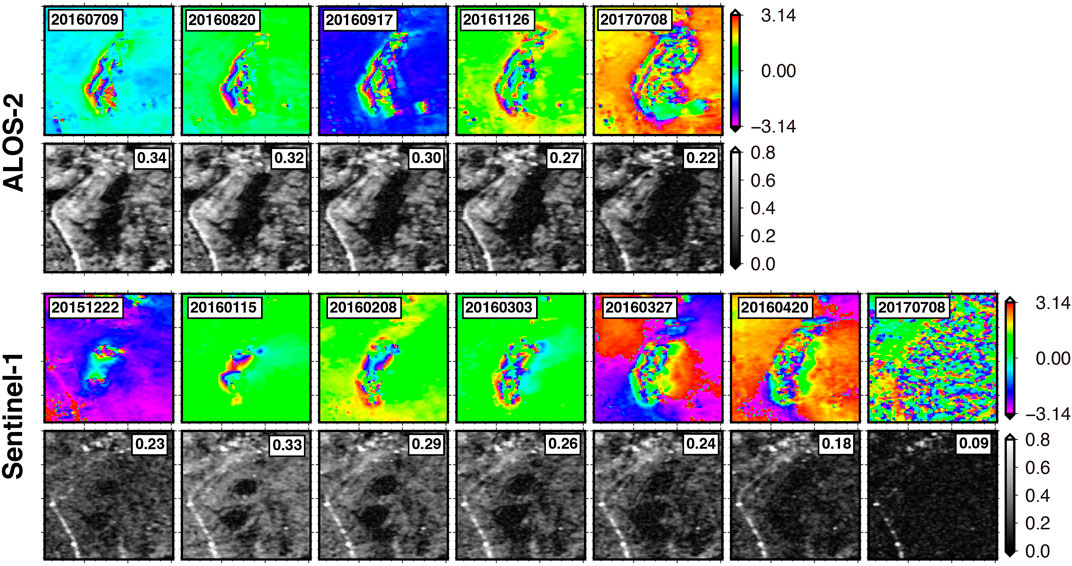
FIGURE 10. Zoomed-in view of differential interferograms and coherence maps of ALOS-2 and Sentinel-1 data over Meihuajing mine in the NECIB. A common reference image for these interferograms is set to 20151128 for both ALOS-2 and Sentinel-1 data. The repeated acquisition dates for each interferogram are marked on each map. The average coherence for each interferogram is indicated in the figure.
In this section, we compare the cumulated subsidence between Sentinel-1 and ALOS-2 data derived by coherence-based SBAS method to further demonstrate the InSAR capability in resolving the large gradient deformation over the active mining areas. In Figures 11, 12, we show the spatial and temporal evolution of subsidence from Sentinel-1 and ALOS-2 data, respectively, over Meihuajing coal mine in the NECIB. Longwall advance is from northeast to southwest. In the figure, we only displayed the cumulated subsidence on the 14 acquisition dates from Sentinel-1 closest to ALOS-2 acquisition dates in order to compare their results. The cumulated subsidence maps from ALOS-2 and Sentinel-1 data were temporally referenced to a common acquisition date—the first acquisition date on 29 November 2014.
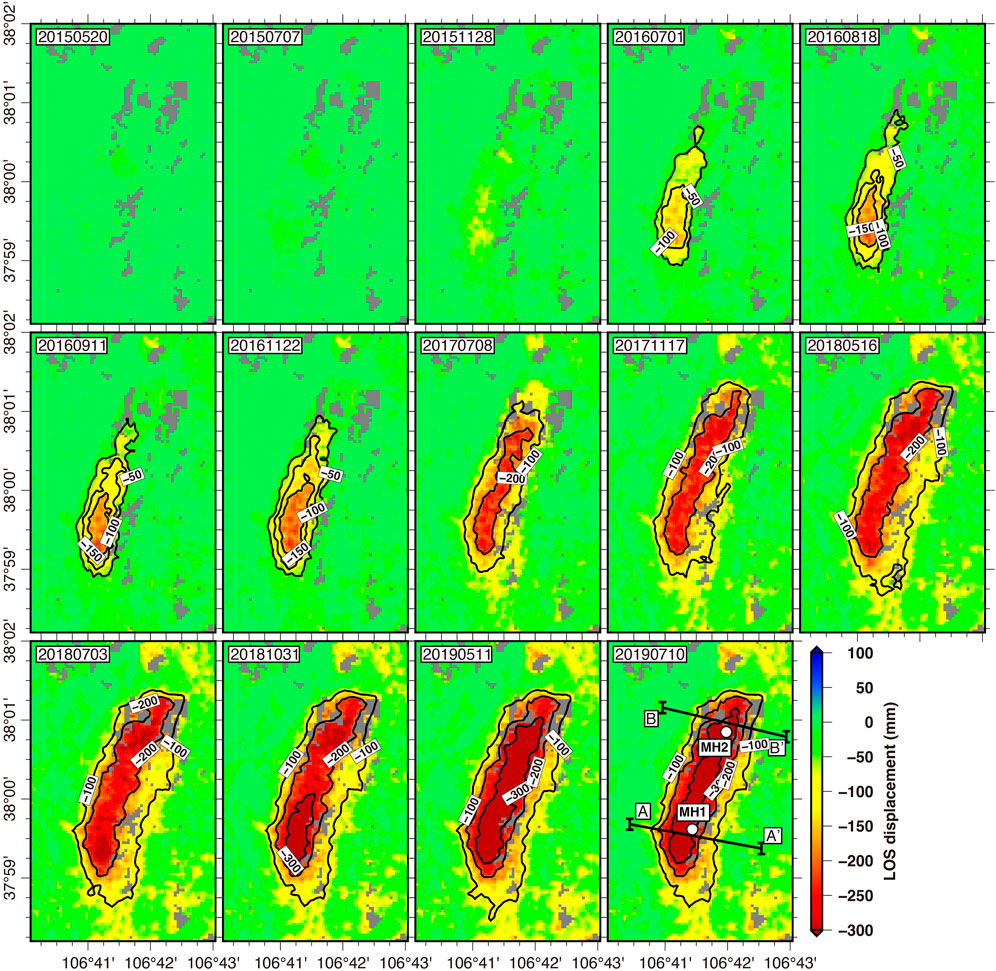
FIGURE 11. The progressive accumulation LOS subsidence over Meihuajing mining area acquired from Sentinel-1 data. For comparison, we only showed the 14 Sentinel-1 acquisition dates closest to ALOS-2 acquisition dates. The black lines on 20190710 (A-A′ and B-B′) are the profiles across the mining subsidence basin, which are shown in Figure 13. The white points (MH1 and MH2) on 20190710 marks the location of the displacement time-series shown in Figure 13.
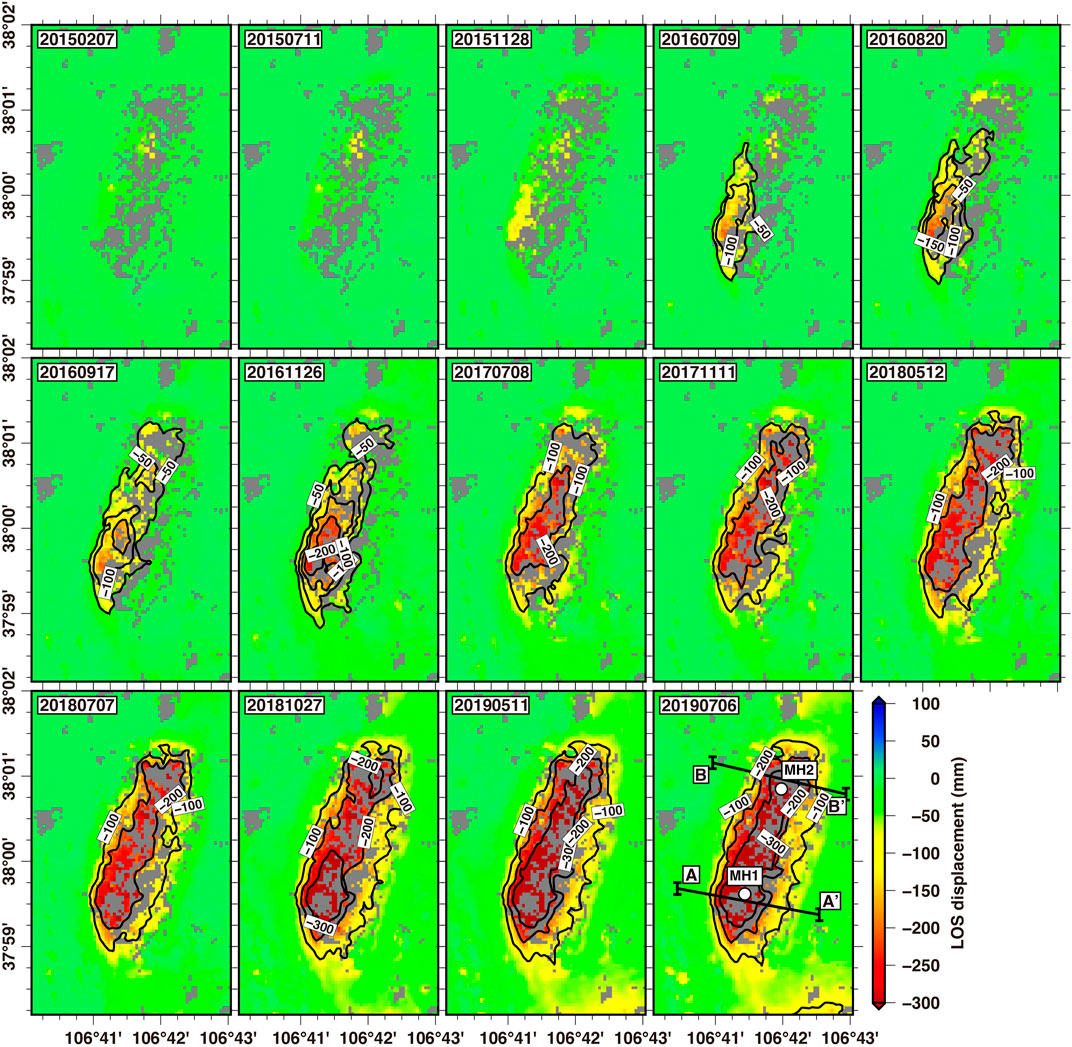
FIGURE 12. The progressive accumulation LOS subsidence over Meihuajing mining area from ALOS-2 data. The black lines on 20190706 (A-A′ and B-B′) are the profiles across the mining subsidence basin, which are shown in Figure 13. The white points (MH1 and MH2) on 20190706 marks the location of the displacement time-series shown in Figure 13.
Generally, from Figures 11, 12, we observed very similar spatial extent and magnitude of the cumulated subsidence between Sentinel-1 and ALOS-2 results, although the acquisition dates of the two datasets were not exactly the same. In Figure 13, we further show the cumulated subsidence along two profiles (A-A′ and B-B’) on three same acquisition dates (20151128, 20170708 and 20190511) for both Sentinel-1 and ALOS-2 data. And the displacement time-series at two points (MH1 and MH2) over this mine are also plotted in Figure 13. Although the general displacement patterns were consistent along the two profiles, discrepancies between the two SAR sensors can be found, especially during active mining phases (on 20170708 and 20190511) with large spatial displacement gradients, where ALOS-2 could extract a larger magnitude of subsidence than Sentinel-1. From the displacement time-series at MP1 and MP2 in Figure 13, we observed that the subsidence evolution from Sentinel-1 is much smoother than that of ALOS-2. We clearly observed two accelerating patterns in the time series at both MH1 and MH2. From the ALOS-2 displacement time series at MH1, we identified the first accelerating phase was between July 2016 and January 2017 and the second was between July 2018 and November 2018, but Sentinel-1 results did not show the accelerating pattern during the first phase. The subsidence magnitude derived from Sentinel-1 is much smaller than that from ALOS-2. It is probably due to the unreliable unwrapping on those interferograms with large displacement gradient during the active mining phase. At MH2, the first accelerating phase was between January 2017 and August 2017 and the second accelerating phase was between March 2019 and July 2019, both the two results can clearly identify the two accelerating patterns. However, the subsidence magnitude from ALOS-2 is slightly less than that of Sentinel-1. From the displacement time-series plots, we can conclude that the Sentinel-1 acquisition periods are shorter than ALOS-2 acquisition periods, the Sentinel-1 data provide a more timely report of the subsidence development.
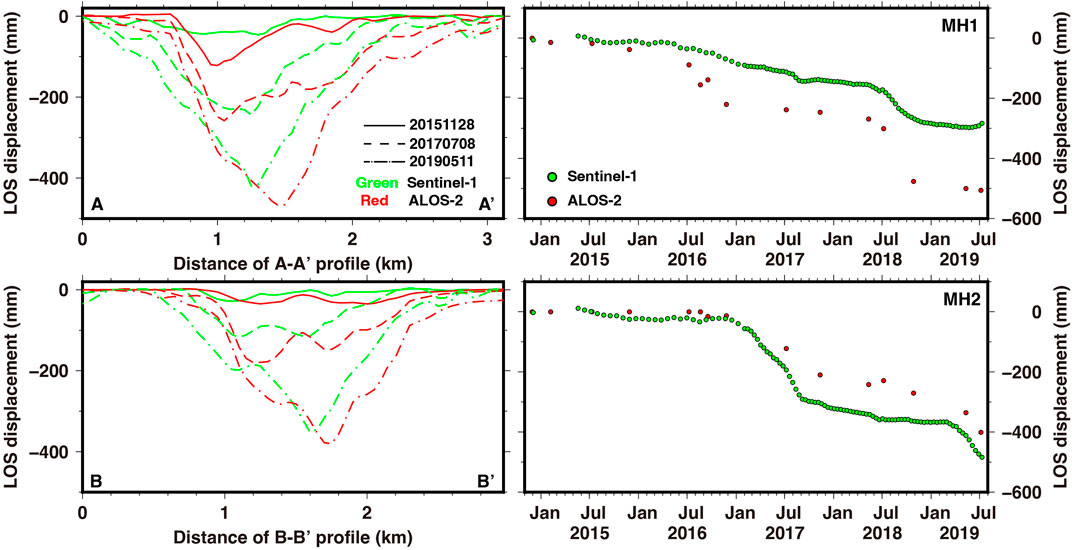
FIGURE 13. Progressively cumulated LOS displacement along profiles A-A′ and B-B′ over Meihuajing mining area from Sentinel-1 and ALOS-2 data (left panel). The LOS displacement time-series at point MP1 and MP2 (right panel). Refer to Figures 11, 12 for the locations of the profiles and points.
In this section, we compare InSAR displacement time series with that of GPS to validate the accuracy of InSAR-derived subsidence. A total of 18 continuous GPS monitoring stations located in five mining areas (Renjiazhuang, Maliantai, Lingxin, Yangchangwan and Meihuajing mines) are available for the comparison (Table 3). The locations of GPS stations are superimposed on the subsidence rate maps, as shown in Figure 14. The comparison of displacement time series between these two techniques is shown in Figure 15. GPS can only obtain displacement at sparse discrete points. To match the InSAR pixels and the continuous GPS stations, we averaged InSAR pixels within a circular area with a radius of 50 m centered on the GPS station for the comparison. The 3D NEU displacement resulting from GPS analysis were first projected into the InSAR LOS direction as:
where
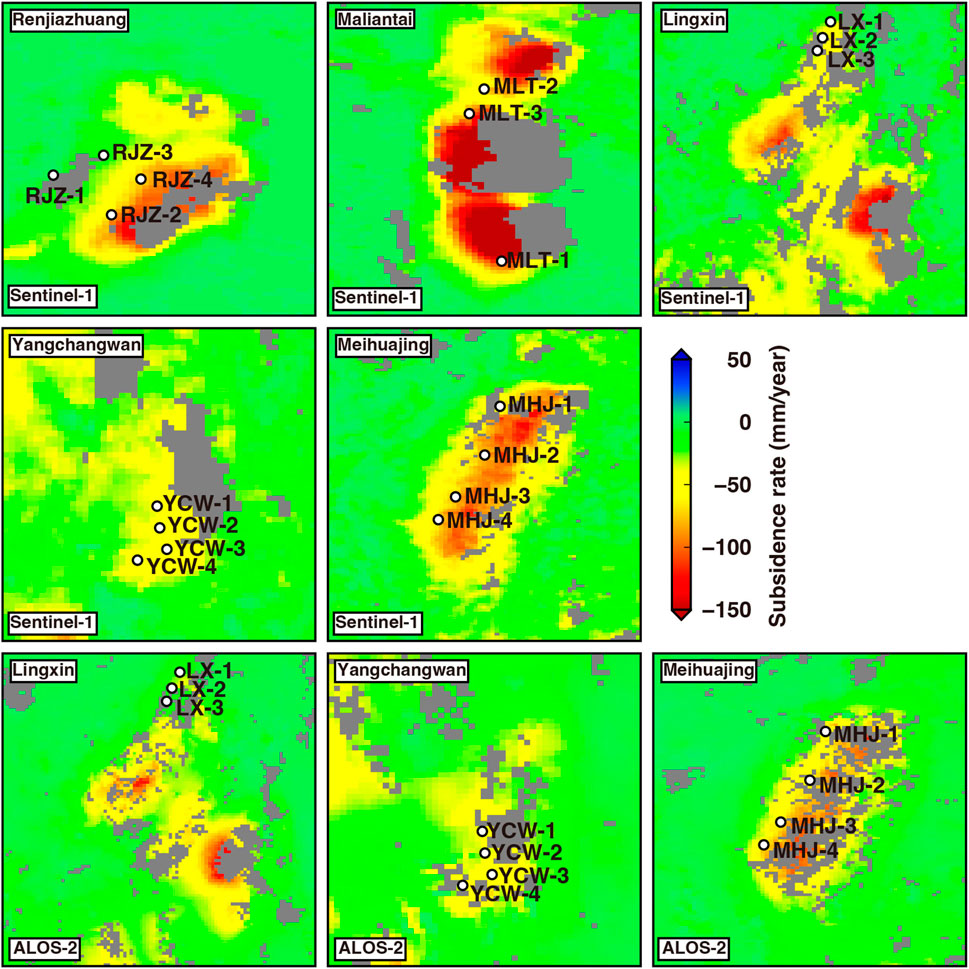
FIGURE 14. The available continuous GPS stations (white circles) overlay on the subsidence rate maps over five mines: Renjiazhuang (RJZ-1, RJZ-2, RJZ-3 and RJZ-4), Maliantai (MLT-1, MLT-2 and MLT-3), Lingxin (LX-1, LX-2 and LX-3), Yangchangwan (YCW-1, YCW-2, YCW-3 and YCW-4) and Meihuajing (MHJ-1, MHJ-2, MHJ-3 and MHJ-4). No ALOS-2 data coverage over Renjiazhuang and Maliantai mines.
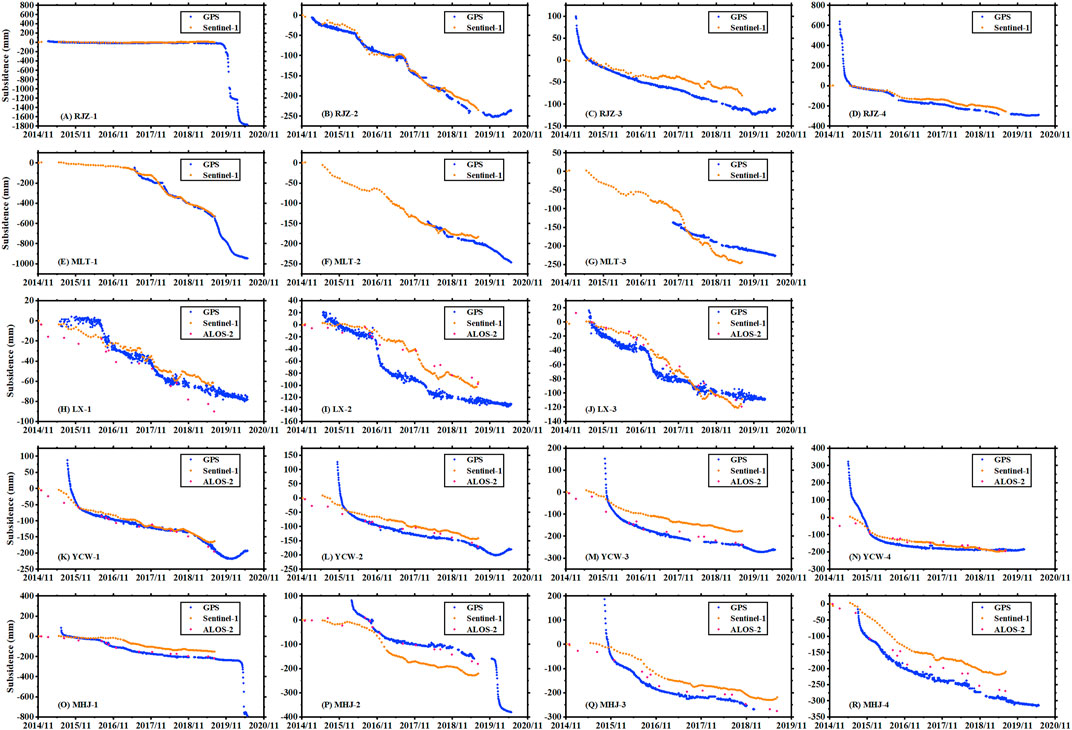
FIGURE 15. Comparison between InSAR- and GPS-derived subsidence time series at five coal mines (A–D) Renjiazhuang (RJZ-1, RJZ-2, RJZ-3 and RJZ-4) (E–G) Maliantai (MLT-1, MLT-2, and MLT-3) (H–J) Lingxin (LX-1, LX-2 and LX-3) (K–N) Yangchangwan (YCW-1, YCW-2, YCW-3 and YCW-4) (O–R) Meihuajing (MHJ-1, MHJ-2, MHJ-3 and MHJ-4). The blue dots indicate GPS observation, the orange dots represent the Sentinel-1 observations, and red dots are ALOS-2 measurements. No ALOS-2 data coverage over Renjiazhuang and Maliantai mines.
In Figure 15, over the Renjiazhuang mine, a very good agreement between the observations between InSAR and GPS can be found at RJZ-1 station (Figure 15A) because the ground at this location was stable during the InSAR time period. This area had an abrupt subsidence in November 2019 as observed from the GPS measurements. We observed a good agreement between the observations between InSAR and GPS at RJZ-1, RJZ-2 and RJZ-4. A good agreement between these two techniques was also found at RJZ-2 station (Figure 15B) because the displacement is not significant in terms of mining subsidence. However, we found an abrupt change between November 2014 and May 2015 from GPS observations at RJZ-3 and RJZ-4 stations (Figures 15C, D) where InSAR measurements cannot capture such large displacement gradient due to phase aliasing effects. These phenomena can also be found at GPS stations over Yangchangwan and Meihuajing mines (Figures 15K–R). Generally, good agreements between InSAR and GPS can be observed if the displacements are continuous. We further show the scatter plot between InSAR and GPS subsidence measurements in Figure 16. For Sentinel-1 data, the average RMSE between InSAR and GPS measurements is 28.4 mm, and for each mine the RMSE is 24.1, 22.9, 15.3, 20.1, 59.5 mm over Renjiazhuang, Maliantai, Lingxin, Yangchangwan, and Meihuajing mine, respectively. For ALOS-2 data, the average RMSE between InSAR and GPS measurements is 21 mm, and for each mine the RMSE is 21.6, 15.8, 25.6 mm at Lingxin, Yangchangwan, and Meihuajing mine, respectively. When comparing the Sentinel-1 and ALOS-2 data over Lingxin mine (Figures 15H–J), a high consistency among Sentinel-1, ALOS-2 and GPS measurements was observed because the stations located in areas experiencing mild deformation. However, at YCW-3 (Figure 15M), MHJ-3 (Figure 15Q) and MHJ-4 (Figure 15R), the ALOS-2 data are closer to the GPS measurements because the significant deformation over these stations that ALOS-2 data has a better performance at capturing rapid subsidence.
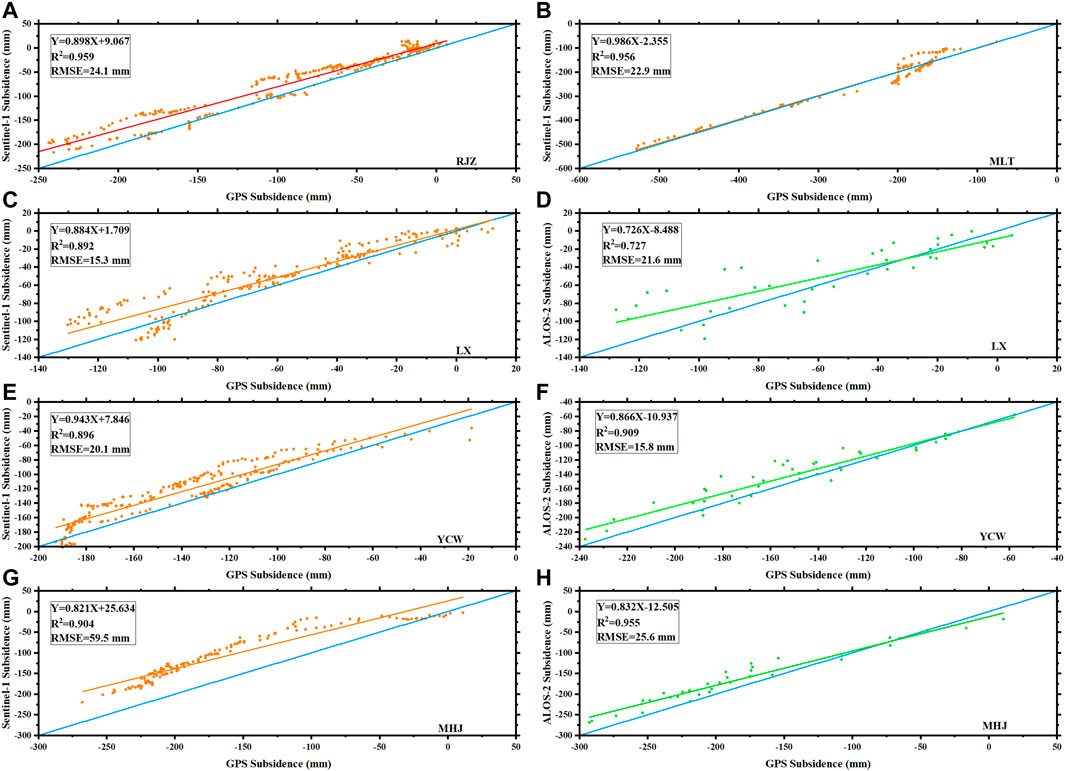
FIGURE 16. The scatter plot between GNSS- and InSAR-derived subsidence.
Differential Synthetic Aperture Radar Interferometry has been used to detect and monitor fast mining-induced subsidence over Ningdong coal base area located in northwestern China. A total of 15 L-band SAR images from ALOS-2 satellite and 102 C-band images from Sentinel-1 satellite spanning between November 2014 and July 2019 have been processed using both stacking and SBAS time series analysis techniques. At a regional scale over a 3,484 km2 area of the coal base, InSAR-derived subsidence maps have been compared with the boundary of ten mining concessions to identify those mining areas generating significant subsidence and to delimit the extent of the area affected by mining subsidence. At a local scale in all the active coal mines, the spatial and temporal evolution of subsidence were obtained to track the subsidence dynamics and determine the characteristic surface response to longwall advance. The most significant subsidence in the study region was found at Maliantai mine with −264 mm/year detected by SBAS method from Sentinel-1 data.
The effectiveness of DInSAR for estimating mining subsidence is dependent on the radar wavelength. Compared to C-band, L-band SAR are less affected by phase aliasing due to large deformation gradients and by temporal decorrelation due to changes in surface scattering characteristics over time. With a shorter imaging period (12 days), the Sentinel-1 data improve the capability in quantifying the fast mining subsidence and provide a more timely report of the subsidence extent.
We validated the InSAR displacement time-series by comparing both ALOS-2 and Sentinel-1 results with 18 continuous GPS stations above five active mining regions in this coal base. When comparing the displacement time series between InSAR and GPS, we found that InSAR time series method cannot capture the abrupt mining subsidence with large displacement gradient due to phase aliasing effects. The GPS measurements with a high sampling rate in time can properly observe such abrupt change. We can combine these two techniques to obtain the full three-dimensional, large displacements due to mining activities in this coal base area.
The original contributions presented in the study are included in the article/Supplementary Material, further inquiries can be directed to the corresponding author.
WT wrote the manuscript, designed its structure, and analyzed the data collected. MW helped in collecting and analyzing the data. PL and GW provided access to the data, support in reviewing and editing the manuscript. YY and WY critically revised the manuscript. All authors contributed to the article and approved the submitted version..
This work is supported by Open Fund of State Key Laboratory of Water Resource Protection and Utilization in Coal Mining (Grant No. WPUKFJJ 2019-17), Open Fund of State Key Laboratory of Coal Resources and Safe Mining (Grant No. SKLCRSM22KFA08), Open Fund of Key Laboratory of Natural Resources Monitoring and Supervision in Southern Hilly Region, Ministry of Natural Resources (Grant No. NRMSSHR 2022Y05). The authors declare that this study received funding from State Key Laboratory of Water Resource Protection and Utilization in Coal Mining, CHN Energy Shendong Coal Group Co., Ltd., Beijing, China, National Institute of Clean-and-Low-Carbon Energy, Beijing, China, and Key Laboratory of Natural Resources Monitoring and Supervision in Southern Hilly Region, Ministry of Natural Resources, Changsha, China. The funders were not involved in the study design, collection, analysis, interpretation of data, the writing of this article, or the decision to submit it for publication.
The authors would like to thank the European Space Agency for providing Sentinel-1 data and the Alaska Satellite Facility for downloading the archived Sentinel-1 data. The authors thank the Japanese Space Exploration Agency (JAXA) for providing ALOS-2 data. The authors would also like to thank the Institute of Land and Resources Investigation and Monitoring, Ningxia Hui Autonomous Region, for technical support during field investigation. The authors are grateful to the reviewers for their constructive comments.
WT was employed by CHN Energy Shendong Coal Group Co., Ltd.
The remaining authors declare that the research was conducted in the absence of any commercial or financial relationships that could be construed as a potential conflict of interest.
All claims expressed in this article are solely those of the authors and do not necessarily represent those of their affiliated organizations, or those of the publisher, the editors and the reviewers. Any product that may be evaluated in this article, or claim that may be made by its manufacturer, is not guaranteed or endorsed by the publisher.
Berardino, P., Fornaro, G., Lanari, R., and Sansosti, E. (2002). A new algorithm for surface deformation monitoring based on small baseline differential SAR interferograms. IEEE Trans. Geoscience Remote Sens. 40, 803792. doi:10.1109/TGRS.2002.803792
Cai, M., Wu, Y., Li, P., Pan, J., Hong, W., and Li, J. (2022). Present situation and ideas of green development of coal resources in Ningxia. Chin. J. Eng. 44, 1–10.
Chen, C. W., and Zebker, H. A. (2001). Two-dimensional phase unwrapping with use of statistical models for cost functions in nonlinear optimization. J. Opt. Soc. Am. A 18, 338–351. doi:10.1364/josaa.18.000338
Chen, J., Ban, Y., and Li, S. (2014). China: Open access to Earth land-cover map. Nature 514, 434. doi:10.1038/514434c
Dai, Y., Ng, A. H. M., Wang, H., Li, L., Ge, L., and Tao, T. (2021). Modeling-assisted InSAR phase-unwrapping method for mapping mine subsidence. IEEE Geoscience Remote Sens. Lett. 18, 1059–1063. doi:10.1109/lgrs.2020.2991687
Farr, T. G., Rosen, P. A., Caro, E., Crippen, R., Duren, R., Hensley, S., et al. (2007). The shuttle radar topography mission. Rev. Geophys. 45, 1–33. doi:10.1029/2005rg000183
Ferretti, A., Prati, C., and Rocca, F. (2001). Permanent scatterers in SAR interferometry. IEEE Trans. Geoscience Remote Sens. 39, 8–20. doi:10.1109/36.898661
Hanssen, R. (2001). Radar Interferometry: Data interpretation and error analysis. New York: Kluwer Academic Publishers. Available at: https://books.google.co.uk/books?hl=en&lr=&id=bqNkJUk4wtMC&oi=fnd&pg=PA4&dq=Radar+Interferometry:+Data+Interpretation+and+Error+Analysis&ots=8NjwnEA1fL&sig=nb9LBEZq7o_lRiB85MPLFRTJyh8.
Hooper, A., Segall, P., and Zebker, H. (2007). Persistent scatterer interferometric synthetic aperture radar for crustal deformation analysis, with application to Volcán Alcedo, Galápagos. J. Geophys. Res. Solid Earth 112, B07407–B07421. doi:10.1029/2006jb004763
Ilieva, M., Polanin, P., Borkowski, A., Gruchlik, P., Smolak, K., Kowalski, A., et al. (2019). Mining deformation life cycle in the light of InSAR and deformation models. Remote Sens. 11, 745. doi:10.3390/rs11070745
Liu, J., Liu, X., Lv, X., Wang, B., and Lian, X. (2022). Novel method for monitoring mining subsidence featuring Co-registration of UAV LiDAR data and photogrammetry. Appl. Sci. 12, 9374. doi:10.3390/app12189374
Modeste, G., Doubre, C., and Masson, F. (2021). Time evolution of mining-related residual subsidence monitored over a 24-year period using InSAR in southern Alsace, France. Int. J. Appl. Earth Observation Geoinformation 102, 102392. doi:10.1016/j.jag.2021.102392
Przylucka, M., Herrera, G., Graniczny, M., Colombo, D., and Bejar-Pizarro, M. (2015). Combination of conventional and advanced DInSAR to monitor very fast mining subsidence with TerraSAR-X data: Bytom City (Poland). Remote Sens. 7, 5300–5328. doi:10.3390/rs70505300
Sandwell, D. T., and Price, E. J. (1998). Phase gradient approach to stacking interferograms. J. Geophys. Res. Solid Earth 103, 30183–30204. doi:10.1029/1998JB900008
Schmidt, D. A., and Bürgmann, R. (2003). Time-dependent land uplift and subsidence in the Santa Clara valley, California, from a large interferometric synthetic aperture radar data set. J. Geophys. Res. Solid Earth 108. doi:10.1029/2002jb002267
Smith, W. H. F., and Wessel, P. (2012). Gridding with continuous curvature splines in tension. Geophysics 55, 293–305. doi:10.1190/1.1442837
Tang, W., Zhao, X., Motagh, M., Bi, G., Li, J., Chen, M., et al. (2022). Land subsidence and rebound in the Taiyuan basin, northern China, in the context of inter-basin water transfer and groundwater management. Remote Sens. Environ. 269, 112792. doi:10.1016/j.rse.2021.112792
Tong, X., and Schmidt, D. (2016). Active movement of the Cascade landslide complex in Washington from a coherence-based InSAR time series method. Remote Sens. Environ. 186, 405–415. doi:10.1016/j.rse.2016.09.008
Tymofyeyeva, E., and Fialko, Y. (2015). Mitigation of atmospheric phase delays in InSAR data, with application to the eastern California shear zone. J. Geophys. Res. Solid Earth 120, 5952–5963. doi:10.1002/2015jb011886
Wang, G., Xu, Y., Cheng, X., and Zhang, J. (2018). A study of GPS ground deformation monitoring of Jinfeng coal mine in Ningdong coal base. Geol. Bull. China 37, 2199–2207.
Wang, G., Wu, Q., Li, P., Cui, X., Gong, Y., Zhang, J., et al. (2021). Mining subsidence prediction parameter inversion by combining GNSS and DInSAR deformation measurements. IEEE Access 9, 89043–89054. doi:10.1109/access.2021.3089820
Wegmuller, U., Strozzi, T., Werner, C., Wiesmann, A., Benecke, N., and Spreckels, V. (2000). Monitoring of mining-induced surface deformation in the Ruhrgebiet (Germany) with SAR interferometry. Int. Geoscience Remote Sens. Symposium 6, 2771–2773. doi:10.1109/IGARSS.2000.859710
Wempen, J. M., and McCarter, M. K. (2017). Comparison of L-band and X-band differential interferometric synthetic aperture radar for mine subsidence monitoring in central Utah. Int. J. Min. Sci. Technol. 27, 159–163. doi:10.1016/j.ijmst.2016.11.012
Wempen, J. M. (2020). Application of DInSAR for short period monitoring of initial subsidence due to longwall mining in the mountain west United States. Int. J. Min. Sci. Technol. 30, 33–37. doi:10.1016/j.ijmst.2019.12.011
Wessel, P., Luis, J., Uieda, L., Scharroo, R., Wobbe, F., Smith, W., et al. (2019). The generic mapping Tools version 6. Geochem. Geophys. Geosystems 20, 5556. doi:10.1029/2019GC008515
Wu, Z., Wang, T., Wang, Y., Wang, R., and Ge, D. (2022). Deep learning for the detection and phase unwrapping of mining-induced deformation in large-scale interferograms. IEEE Trans. Geoscience Remote Sens. 60, 1–18. doi:10.1109/tgrs.2021.3121907
Xu, X., Sandwell, D. T., Tymofyeyeva, E., Gonzalez-Ortega, A., and Tong, X. (2017). Tectonic and anthropogenic deformation at the cerro prieto geothermal step-over revealed by sentinel-1A InSAR. IEEE Trans. Geoscience Remote Sens. 55, 5284–5292. doi:10.1109/tgrs.2017.2704593
Zhang, L., Dai, K., Deng, J., Ge, D., Liang, R., Li, W., et al. (2021). Identifying potential landslides by stacking-InSAR in southwestern China and its performance comparison with SBAS-InSAR. Remote Sens. 13, 3662. doi:10.3390/rs13183662
Keywords: mining subsidence, Ningdong coal base, DInSAR, stacking, SBAS
Citation: Tang W, Wang M, Li P, Wang G, Yan Y and Yan W (2023) Ground subsidence associated with mining activity in the Ningdong coal base area, northwestern China revealed by InSAR time series analysis. Front. Earth Sci. 11:1132890. doi: 10.3389/feart.2023.1132890
Received: 28 December 2022; Accepted: 30 March 2023;
Published: 27 July 2023.
Edited by:
Zefa Yang, Central South University, ChinaReviewed by:
Honglei Yang, China University of Geosciences, ChinaCopyright © 2023 Tang, Wang, Li, Wang, Yan and Yan. This is an open-access article distributed under the terms of the Creative Commons Attribution License (CC BY). The use, distribution or reproduction in other forums is permitted, provided the original author(s) and the copyright owner(s) are credited and that the original publication in this journal is cited, in accordance with accepted academic practice. No use, distribution or reproduction is permitted which does not comply with these terms.
*Correspondence: Peixian Li, bGlweEBjdW10Yi5lZHUuY24=
Disclaimer: All claims expressed in this article are solely those of the authors and do not necessarily represent those of their affiliated organizations, or those of the publisher, the editors and the reviewers. Any product that may be evaluated in this article or claim that may be made by its manufacturer is not guaranteed or endorsed by the publisher.
Research integrity at Frontiers
Learn more about the work of our research integrity team to safeguard the quality of each article we publish.