 Xianmin Wang
 Aiheng Du1
95% of researchers rate our articles as excellent or good
Learn more about the work of our research integrity team to safeguard the quality of each article we publish.
Find out more
ORIGINAL RESEARCH article
Front. Earth Sci. , 30 January 2023
Sec. Geohazards and Georisks
Volume 11 - 2023 | https://doi.org/10.3389/feart.2023.1132722
Disastrous landslides have become a focus of the world’s attention. Landslide susceptibility evaluation (LSE) can predict where landslides may occur and has caught the attention of scientists all over the world. This work establishes integrated criteria of potential landslide recognition and combines the historical landslides and newly-identified potential landslides to improve the accuracy, rationality, and practicability of a LSE map. Moreover, slope units can well reflect the topographic constraint to landslide occurrence and development, and Graph Convolutional Network (GCN) can well portray the topological and feature relation among various slope units. The combination of slope units and GCN is for the first time employed in LSE. This work focuses on Wanzhou District, a famous landslide-serious region in the Three Gorges reservoir area, and employs multisource data to conduct potential landslide recognition and LSE and to reveal the distribution characteristics of high landslide susceptibility. Some new viewpoints are suggested as follows. 1) The established criteria of potential landslide recognition consist of the characteristics of active deformation, stratum and lithology, tectonics, topography, micro-geomorphology, environment, meteorology, earthquakes, and human engineering activity. These criteria can well eliminate 4 types of false alarm regions and is successfully validated by field survey. 2) 34 potential landslides are newly discovered, and the movement of these potential landslides were controlled or induced by the combined action of soft-hard interbedding rock mass, steep topography, frequent tectonic movement, strong fluvial erosion, abundant precipitation, and intensive road and building construction. 3) The GCN algorithm reaches a relatively high accuracy (AUC: 0.941) and outperforms the other representative machine learning algorithms of Convolutional Neural Network (AUC: 0.926), Support Vector Machine (AUC: 0.835), and CART Tree (AUC: 0.762). 4) High landslide susceptibility is caused by the coupled action of weathered rock cavities, soft rock and swelling soil, strong river erosion, abundant rainfall, and intensive human engineering activity.
A great deal of countries around the world, e.g., America, Brazil, Italy, German, India, Norway, Indonesia, Ecuador, and Columbia, suffer from the serious threat of landslides (Reichenbach et al., 2018; Guzzetti et al., 2020; Carrera et al., 2021). Population death, economic loss, urban damage, and infrastructure destruction have frequently occurred during catastrophic landslide events (Haque et al., 2019; Garcia-Delgado et al., 2022). Wanzhou District is the central region in the Three Gorges reservoir area. According to the disaster statistics provided by the Wanzhou Bureau of Planning and Natural Resources, 900 geological hazards occurred, and landslides occupied 73.56%. On 5 September 2004, a massive landslide in Wanzhou District destroyed more than 180 buildings, about 300 acres of farmland, and above 500 telegraph poles (ROWDG Report, 2005). The direct economic loss attained CNY 50 million, and the landslide-affected people reach 1281 (ROWDG Report, 2005). The reason for the enormous loss of catastrophic landslides is that potential (hidden) landslides are quite difficult to be discovered in advance (Xu et al., 2019) and that the regions with high landslide susceptibility are not identified accurately. Therefore, it is of increasing urgency to find potential landslides at their early deformation stage and to exactly evaluate landslide susceptibility, so that prevention and control measures can be adopted accurately and timely.
A large number of potential landslides have not been discovered (Xu et al., 2019), and the early discovery of potential landslides has always been a great challenge worldwide. At present, the characteristics of surface deformation [extracted by Interferometric Synthetic Aperture Radar (InSAR) technique], geomorphology, and/or topography are employed to identify potential (active) landslides across extensive regions (e.g., Wang Y. et al., 2022; Wang Z. et al., 2022; Zhang et al., 2022). These studies have significantly contributed to and facilitated the progress of potential landslide identification. However, due to the inherent limitation of InSAR technique in phase aliasing effect, geometric distortion, and one-dimensional deformation measurement (Xu et al., 2019; Mondini et al., 2021), the integration of deformation, geomorphological, and topographical features has still caused relatively low recognition precision and relatively high false alarm rates in landslide identification via field validation. The Chinese Ministry of Natural Resources organized to implement potential landslide identification in the high susceptibility regions, and the precision was 69.9%, 62.8%, 44%, and 29.8%, respectively in the provinces or municipality of Sichuan, Hubei, Shanxi, and Chongqing (MNR Report, 2020). Actually, landslides are a complex system that is controlled by geology, relief, and environment, induced by meteorology, earthquake, and human engineering activity, and embodied in material movement and particular geomorphology (Xu et al., 2022). Thus, a more comprehensive feature set is necessary, including the disaster-controlling, disaster-triggering, surface deformation, and disaster micro-geomorphology characteristics. This integrated feature set can improve the identification precision of potential landslides, reduce the false alarm, and decrease enormous waste of manpower, financial resources, and time in validating fake landslides.
There have been plenty of excellent works in landslide susceptibility evaluation (LSE, also called as landslide susceptibility mapping, LSM), and a variety of algorithms were suggested or employed in these works. These diverse methods typically consist of logic regression (Shou and Chen, 2021; Ge et al., 2022), weights of evidence (Goyes-Penafiel and Hernandez-Rojas, 2021), fuzzy logic (Nwazelibe et al., 2023), Analytical Hierarchy Process (AHP) (Wadadar and Mukhopadhyay, 2022), Information value (Es-Smairi et al., 2022), statistical index model (Berhane and Tadesse, 2021), support vector machine (SVM) (Daviran et al., 2022), random forest (RF) (Taalab et al., 2018), convolutional neural network (CNN) (Aslam et al., 2022), recurrent neural network (Ngo et al., 2021), and ensemble learning [such as boosted regression tree-random forest (Chowdhuri et al., 2021), random forest-cusp catastrophe model (Sun et al., 2022), CNN with metaheuristic optimization (Hakim et al., 2022), and so on]. Hakim et al. (2022) suggested two ensemble deep learning models including the ensemble of CNN and grey wolf optimizer (GWO) and the complex model of CNN and imperialist competitive algorithm (ICA). The CNN-GWO and CNN-ICA models outperform the standalone CNN model; thus, the deep learning algorithm with optimization algorithms can improve LSE accuracy (Hakim et al., 2022). Ghorbanzadeh et al. (2022a) proposed an integration framework of a deep learning model with rule-based object-based image analysis (OBIA) for landslide detection. The F1-score value of the integrated ResU-Net-OBIA framework was 8% and 22% higher than those of the ResU-Net and OBIA algorithms, respectively (Ghorbanzadeh et al., 2022a). Ghorbanzadeh et al. (2022b) devised a multisource landslide benchmark dataset (Landslide4Sense) and established 11 segmentation models to conduct landslide detection by using the Landslide4Sense dataset. The ResU-Net model outperformed other 10 models of U-Net, PSPNet, ContextNet, DeepLabv2, DeepLab-v3+, FCN-8s, LinkNet, FRRN-A, FRRN-B, and SQNet (Ghorbanzadeh et al., 2022b). Landslide detection and maps are crucial to accurately evaluate landslide susceptibility. Moreover, the comparison among various machine learning algorithms has also attracted scientists’ attention, for example, the comparison among artificial neural network (ANN), SVM, RF, and different CNNs (Ghorbanzadeh et al., 2019), and the comparison among object-based image analysis (OBIA)-multilayer perceptron neural network (MLP-NN), OBIA-RF, OBIA-machine learning stacking, and Dempster-Thafer theory (Tavakkoli Piralilou et al., 2019). Shahabi and Hashim (2015) compared the AHP, weighted linear combination (WLC), and spatial multi-criteria evaluation (SMCE) models in LSE in the Cameron Highlands in Malaysia, and SMCE achieved the highest accuracy. Bui et al. (2018) combined AIRSAR data and GIS technique to conduct LSE in a tropical environment, compared the performance of SVM and index of entropy (IOE) and indicated SVM a promising model in LSE in tropical regions. Ngo et al. (2021) performed national-scale LSE in Iran based on 4069 historical landslides, compared the recurrent neural network (RNN) and CNN algorithms and suggested that RNN achieved a 3.4% higher AUC value than CNN. These studies have made important contributions to LSE technique development.
However, the vast majority of present LSE studies are conducted based on optical images and historical landslides and neglect the risk from potential (hidden) landslides. In recent years, a few studies became to focus on the influence of surface deformation on landslide susceptibility and employed deformation features (derived by InSAR technique) to validate or refine the LSE results acquired from historical landslides (e.g., Xie et al., 2017; Zhao et al., 2019; Hussain et al., 2020; Hussain M.A. et al., 2021; Hussain S. et al., 2021; Lin et al., 2021; Meghanadh et al., 2021; Cao et al., 2022; Meghanadh et al., 2022). These studies actually concerned the known landslides. The overwhelming majority of researches on LSE are in terms of known landslides. Moreover, a handful of studies carried out LSE according to the potential landslides, instead of the historical ones (Nhu et al., 2020; Kouhartsiouk and Perdikou, 2021). These above works involving surface deformation detection have greatly improved the accuracy of LSE. However, both historical landslides and potential landslides reflect landslide generation, movement, risk, and susceptibility. Thus, it can enhance the precision and rationality of LSE to involve both known landslides and potential landslides. At present, very few studies performed LSE by integrating both historical landslides and potential landslides. Deng et al. (2022) recognized the potential landslides according to surface deformation extracted by Small Baseline Subset InSAR (SBAS-InSAR) technique. A landslide inventory composed of historical and potential landslides was constructed, and a hybrid method of information value and random forest was employed to evaluate landslide susceptibility. Kontoes et al. (2021) identified active landslides in terms of the surface deformation (derived by multi-temporal InSAR technique), topographic, geomorphological, and surface cover features. The algorithm of weights of evidence was adopted to carry out LSE based on the known and potential landslides.
Graph Convolutional Network (GCN) is suggested to learn from graph-structured data, i.e., to extract features from non-Euclidean structure data (Kipf and Welling, 2017; Kipf, 2020). GCN features three important advantages (Kipf and Welling, 2017; Kipf, 2020): 1) strong universality, 2) illumination of topological structure, and 3) a low-pass filter. First, GCN can be employed in various unstructured data so long as they can be expressed in graph structures (Kipf, 2020). Second, GCN can well depict the topological structure among data by nodes, sides, weights, in-degree, and out-degree (Kipf and Welling, 2017). The topologically-connected nodes reflect the context information that is very significant and useful to increase the prediction precision. Third, low frequency signals include the most important information and exclude the abnormal information and noises; thus, GCN can learn the most effective feature by convolutional operation (Kipf and Welling, 2017). At present, GCN has been rarely used in the landslide area. Ma et al. (2021) proposed T-GCN to predict slope deformation displacement by considering the spatial correlation among all the monitoring sensors. The predicted displacement values were close to the measured ones in most sensors (Ma et al., 2021). Jiang et al. (2022) suggested a graph convolutional incorporating GRU network to predict the displacement of two typical landslides according to Global Navigation Satellite System (GNSS) observations. At present, GCN has not applied in LSE by previous studies.
Slope units can accurately depict the topographic constraint to landslide occurrence and distribution. Therefore, slope units are employed in this work as evaluation units. However, slope units feature diverse sizes, manifold geometric shapes, and irregular spatial structures, and a suitable LSE method is required to portray the topological relation among various irregular slope units. Thus, the features from the topologically-connected slope units (i.e., the context information) can be aggregated and transferred to the current slope unit to improve its landslide susceptibility prediction accuracy. GCN is an appropriate method. It can exactly depict the topological relation and feature association among various irregular slope units and effectively learn the most significant features from neighbor slope units; thus, it is hopeful to achieve a relatively good LSE result. Therefore, the coupling of slope units and GCN is employed for the first time in this work to conduct LSE.
Therefore, significant advance has been achieved in potential landslide recognition and LSE; however, there are still 2 problems constraining the accuracy. 1) Potential landslides are usually identified according to the characteristics of surface deformation, topography, and/or geomorphology. The indispensable disaster-inducing features are neglected, which to some degree restricts the recognition accuracy and causes relatively high false alarm rates. 2) Landslide susceptibility is dominantly performed according to the historical landslides. The neglection of risks from potential landslides limits the precision, rationality, and practicability of LSE maps. Moreover, GCN can adequately learn feature dependency and non-linear relation within the context and has been successfully applied in various prediction problems (e.g., Lv et al., 2021; Jafari and Haratizadeh., 2022). However, it has not been employed in LSE that is actually a prediction problem of landslide occurrence probability.
This work employs multisource data of geology, topography, meteorology, human engineering activity, optical images, and Synthetic Aperture Radar (SAR) images and adopts time-series InSAR technique and a deep learning algorithm to identify potential landslides and to conduct LSE in Wanzhou District, a famous landslide-severe region in China. There are 4 main contributions in this work. 1) Integrated criteria for potential (active) landslide identification is established. These criteria combine the active deformation, disaster-controlling, and disaster-triggering mechanism and may offer references for a standard of InSAR technique in landslide effective investigation. 2) Both known landslides and potential landslides are involved to evaluate landslide susceptibility; thus, the accuracy and rationality of LSE can be improved. 3) A GCN of 4 layers, combined with slope unit segmentation, is constructed and for the first time applied in LSE to achieve a relatively high accuracy. 4) The distribution characteristics of high landslide susceptibility in the study area is revealed as the common function of lithology, topography, environment, meteorology, and human engineering activity.
The study area (Figure 1), Wanzhou District, covers an area of 3457 km2 and is located at the vital central region in the Three Gorges reservoir area. The area is famous for serious geological disasters, and 662 historical landslides widely occurred there. The exposed strata are dominant in the sedimentary rocks of the Triassic and Jurassic ages, and the strata of the Quaternary and Permian ages also crop out in local regions (1:200,000 Geological map). The prevalent lithology is clastic and carbonate rocks (Luo, 2006), and synclines and anticlines are developed (1:200,000 Geological map). The area is characterized by low mountains and hills and multistage river terraces under the functions of the Yangtze River cutting and crustal uplift (WDGEM Report, 2012).
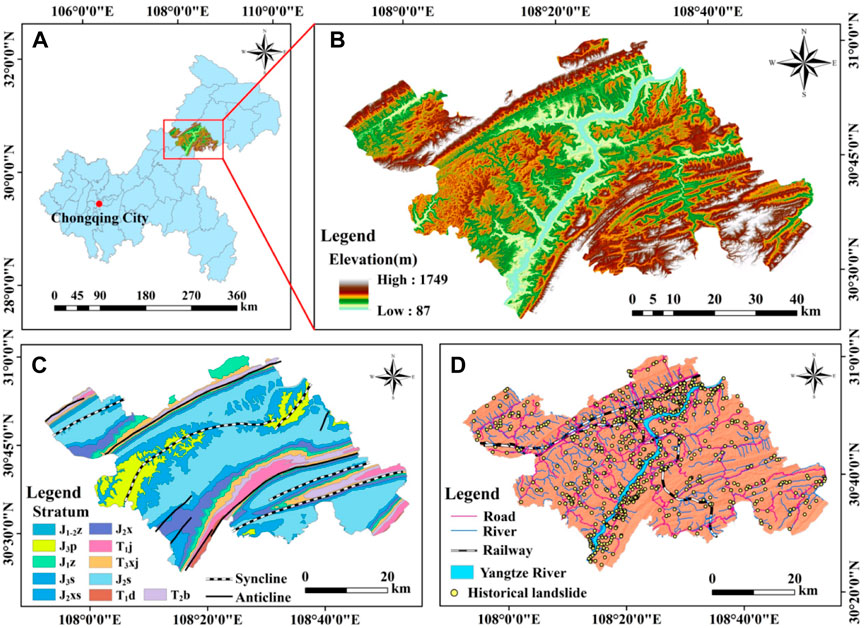
FIGURE 1. Engineering geological setting of the study area. (A) Location of the study area in Chongqing city. (B) Topography variation in Wanzhou district. (C) Strata and fold structures. (D) Abundant river systems, dense transportation networks, and extensively-distributed historical landslides. The symbols include: J1-2z = Ziliujing formation of early and middle Jurassic age; J3p = Penglaizhen formation of late Jurassic age; J1z = Zhenzhuchong formation of early Jurassic age; J3s = Suining formation of late Jurassic age; T3xj = Xujiahe formation of late Triassic age; J2s = upper Shaximiao formation of middle Jurassic age; T1d = Daye formation of early Triassic age; J2x = Xintiangou formation of middle Jurassic age; T1j = Jialingjiang formation of early Triassic age; T2b = Badong formation of middle Triassic age; and J2xs = lower Shaximiao formation of middle Jurassic age. The administrative boundary data are from national catalogue service for geographic information, PRC.
The study area features abundant river valleys and a complex overland runoff network, and the Yangze River runs through the area. Rainfall is generally concentrated from April to October and obviously decreases from November to the next March due to the subtropical warm humid climate (Gao et al., 2005). Wanzhou District was the maximum relocation area of migrants in the Three Gorges hydro-conservation project, and human engineering activity is intensive, including a dense transportation network, rapidly expanded towns, and continual agricultural activities.
Therefore, the study area is depicted by the Jurassic sliding-prone strata (Gui, 2014; 1:200,000 Geological map), softened rock mass (Gui et al., 1998), developed fold structure, intense river cutting and erosion, abundant seasonal rainfall, frequent human engineering activity, and numerous cutting slopes. It has become a densely-populated city accompanied by concentrated geological hazards, especially landslides.
Eight sets of multisource data (Table 1) are employed to extract surface deformation, geoenvironmental factors, and landslide-inducing factors; thus, potential landslide identification and LSE can be implemented. 1) Sentinel-1A SAR images are adopted to extract active deformation by SBAS-InSAR technique. 2) Google Earth images, combined with Setinel-2 images, are employed to interpret road networks and drainage systems. In addition, Google Earth images are also adopted to interpret landslide micro-geomorphological features, e.g., fissures, collapses, gullies, free surfaces, and slide terraces. 3) Landsat-8 multispectral images are used to extract normalized differential vegetation index (NDVI). 4) SRTM digital elevation model (DEM) data are utilized to construct the topographic factors of elevation, aspect, slope angle, plan curvature, profile curvature, topographic wetness index (TWI), and surface roughness (Mohammadi et al., 2020). Moreover, SRTM DEM data are also used to conduct topographic correction of SAR interferograms. 5) A geological map is employed to establish the geological factors of stratum and distance to fold. 6) Land use data are used to analyze the types of human engineering activity. 7) Climate Hazards Group InfraRed Precipitation With Station Data (CHIRPS) rainfall data are adopted to establish the meteorological factor of cumulative rainfall. 8) The data of historical landslides that occurred before 1 May 2020 are used to reflect landslide development characteristics.
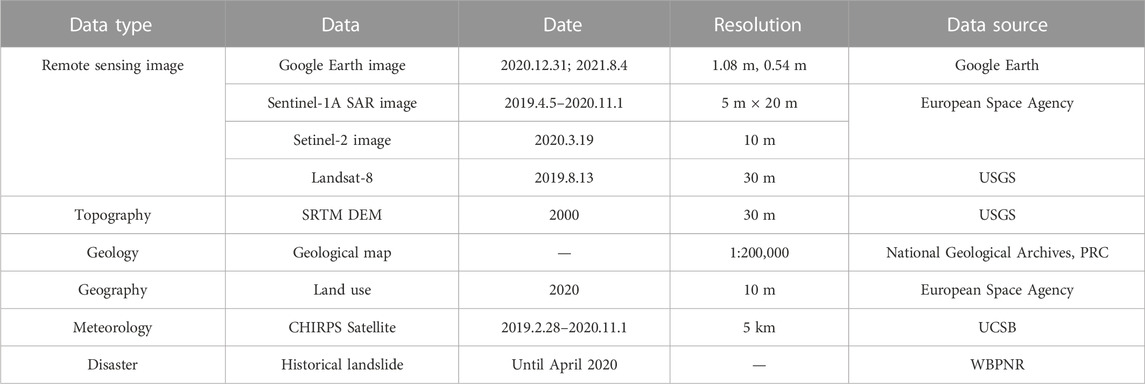
TABLE 1. Multisource data utilized in this work. The abbreviations include: SRTM = shuttle radar topography mission; USGS = United States geological survey; WBPNR = Wanzhou bureau of planning and natural resources; CHIPRS = climate hazards group infrared precipitation with station data; and UCSB = university of california Santa Barbara.
The technical process is shown in Figure 2 and includes 6 procedures. First, active deformation characteristics are extracted by time-series InSAR technique. Second, Geoenvironmental and disaster-triggering factors are established from the multisource data. These factors are composed of two classes of indices: the assessment indices of landslide susceptibility and the identification indices of potential landslides. Third, an integrated criterion set for potential landslide identification is proposed, including the active deformation feature, landslide-controlling geoenvironment, and landslide-inducing mechanism. Fourth, potential landslides are recognized according to the criteria and validated by field survey. Fifth, landslide susceptibility is evaluated according to both historical landslides and potential landslides by slope unit segmentation and a GCN algorithm. Sixth, the distribution features of high landslide susceptibility is revealed, including the common action of lithology, relief, river erosion, rainfall, and human engineering activity.
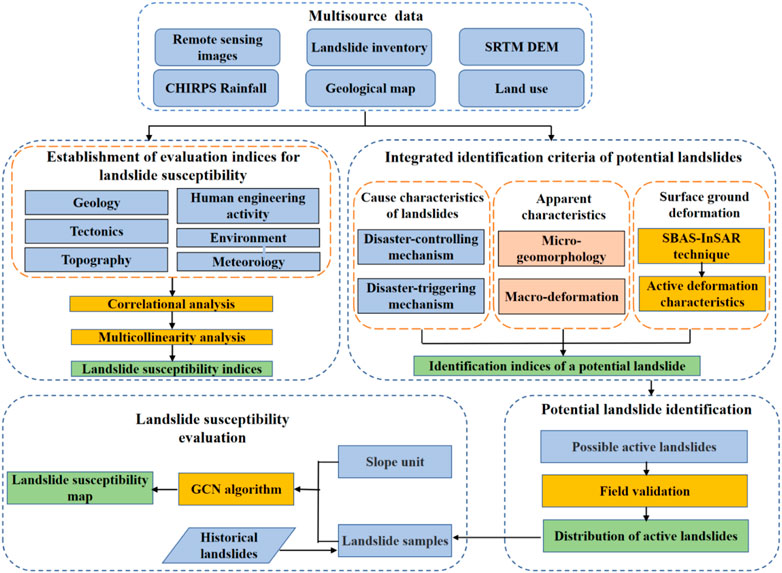
FIGURE 2. Technical process of potential landslide recognition and landslide susceptibility assessment.
SBAS-InSAR technique (Berarino et al., 2002) utilizes the interference pairs with short spatial and time baselines to extract time series of surface deformation. This technique includes five steps: SAR image registration, interferogram filtering, removal of flat-earth and terrain phases, phase unwrapping, and geocoding (Berarino et al., 2002; Ge, 2013). SBAS-InSAR technique has the advantage of good coherence among differential interference image pairs, a high time sampling rate and spatial density of coherence, and minimium errors generated by atmospheric phase delay (Berarino et al., 2002). Thus, it can extract accurate and continuous surface deformation measurement.
The differential interference phase
in which
in which vk is the deformation velocity at the time tk.
Thus, all the unwrapping differential interference phases constitute a matrix form (Eq. 3) (Necsoiu et al., 2014).
The singular value decomposition (SVD) algorithm is employed to calculate the generalized inverse matrix of Matrix B, and then the deformation velocity V can be obtained (Necsoiu et al., 2014). The principle and procedure are specifically illuminated in the literature of Berarino et al. (2002), Necsoiu et al. (2014), and Liao and Wang, (2014).
In this work, 49 ascending SAR images covering 2 flood seasons are employed to monitor active surface deformation. In order to guarantee sufficient interferograms and good coherence, the threshold of the time baseline is set as 60 days. A total of 209 interferograms are generated, and on average, a SAR image participates in constituting 8.53 image pairs. The time baseline varies from 60 days to 12 days and is 35.48 days averagely. The spatial baseline changes from 117 m to 2 m, with an average of 49.73 m. The plots of spatial and temporal baseline connections are shown in Supplementary Figure S1.
There are two types of influencing factors associated with landslide development and occurrence: disaster-controlling (geoenvironmental) factors and disaster-inducing factors. According to the cause mechanism (WDPNRB Program, 2022) and field survey of landslides in Wanzhou District, the associated disaster-controlling and disaster-triggering factors are established (Table 2) and employed as the initial indices of LSE. The indices in Table 2 marked by “#” has passed the multicollinearity inspection (Miles, 2005) (Supplementary Table S1) and Spearman correlation coefficient test (Spearman, 2010) and are used as the final indices of LSE. Moreover, the factors of slope angle, stratum, distance to fold, distance to river, cumulative rainfall, and distance to road cover the characteristics of topography, lithology, tectonics, environment, precipitation, and human engineering activity and are utilized as the identification indices of potential landslides in the study area.
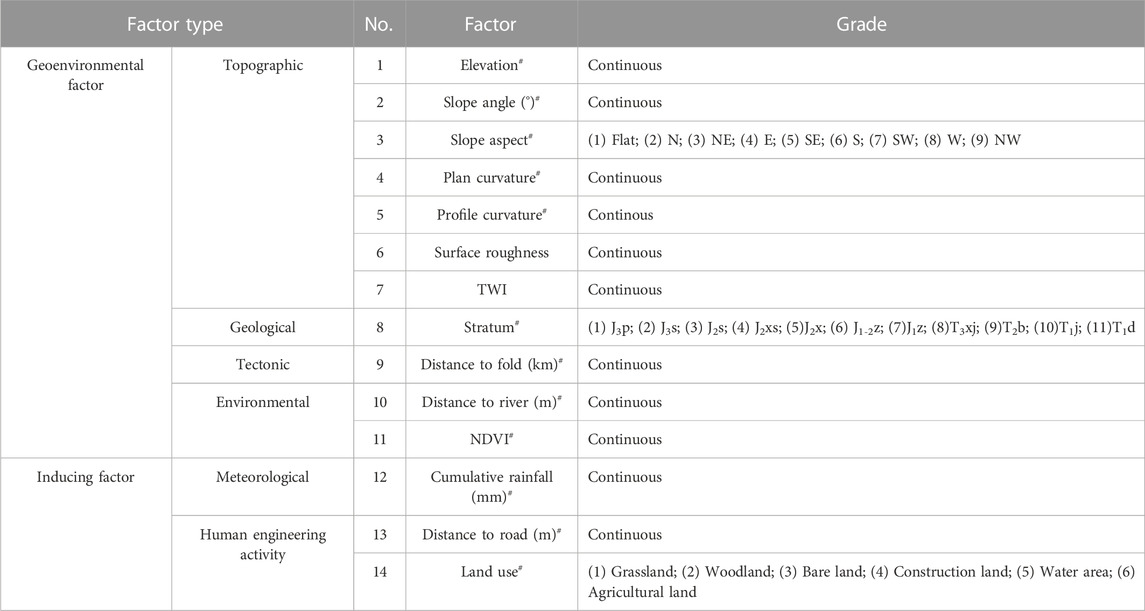
TABLE 2. Geoenvironmental and disaster-triggering factors of landslides. The factors marked by “#” are the evaluation indices of landslide susceptibility that pass the multicollinearity inspection and Spearman correlation coefficient test. The abbreviations include: TWI = Topographic wetness index; and NDVI = Normalized difference vegetation index. See Figure 1 for the meaning of the stratum symbols.
The inherent limitation of InSAR technology causes numerous noises and high false alarm rates in landslide investigation; thus, an integrated criterion set is necessary to improve the identification accuracy. The proposed universal criteria for potential landslide identification are composed of the surface deformation, geoenvironmental (disaster-controlling), and disaster-inducing characteristics (Figure 3). This criterion set is in terms of landslide generation, development, and failure mechanism; thus, it can effectively reduce the false alarm in landslide identification.
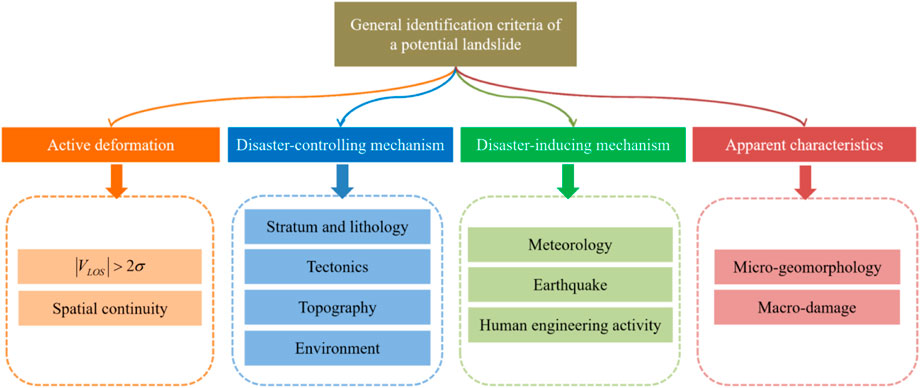
FIGURE 3. Synthetic criteria for potential landslide recognition.
A slope is a potential (active) landslide when it meets the following 7 criteria.
(1) Deformation criteria. A slope is confidently moving when its LOS deformation velocity
(2) Stratum criterion. The slope situated in a facility-sliding stratum is more possible to move. Landslides generally occur in sliding-prone strata featuring soft rocks, soft-hard interbedding rocks, or highly-weathered hard rocks (Liu and Ren, 2008; Li et al., 2017). They seldom occur in the strata composed of slightly-weathered or unweathered hard rocks.
(3) Tectonic criterion. The slope located around faults and folds is more likely to lose stability because of the relaxation and destruction of strong neotectonism to soil and rock mass (Tatard et al., 2010; Ehteshami-Moinabadi, 2022). In the study area, about 40% of historical landslides occurred within 3 km of folds.
(4) Topographic criterion. The slope angle is above 10° because a landslide generally occurs on a hillside with an angle larger than 10° (Zhou et al., 2006). It needs to be illuminated that approximately horizontal landslides are developed in the study area due to the unique lithology of the weak intercalation enriched in montmorillonite (Yin, 2007). The historical landslides in the study area possess slope angles between 6° and 48°. Thus, the slope angle threshold for the study area is set as 5°.
(5) Micro-geomorphological criterion. The slope features landslide micro-geomorphological features, including free surfaces, an exposed back wall, an extrusive front edge, sunken terraces, cracks, and so on.
(6) Environmental criterion. Surface cover damage on a slope is sometimes associated with a landslide, e.g., vegetation damage and bare land expansion (Wang et al., 2022b). Moreover, a slope by a river more possibly evolves into a landslide under the cutting and erosion of river water on the slope foot (Richard et al., 1984). In the study area, 94.86% of historical landslides occurred within 2 km of rivers, and 49.84% are distributed within 400 m of rivers.
(7) Triggering mechanism criterion. The deformation of the slope is explicitly related to some triggering factor, e.g., earthquakes, precipitation, snowmelt, or human engineering activity. The relation is measured according to the Pearson correlation coefficients passing a significance test with the significance value lower than 0.05 (Wang et al., 2022b). The relation to an earthquake is calculated by the Pearson correlation coefficient between deformation velocity and peak ground acceleration (PGA), the relation to precipitation is in terms of the Pearson correlation coefficient between cumulative displacement and cumulative rainfall, the relation to snowmelt is determined by the Pearson correlation coefficient between deformation velocity and temperature in the ice and snow melting season, and the relation to human engineering activity is according to the Pearson correlation coefficient between area proportion of active deformation and distance to road or building (Wang et al., 2022a; Wang et al., 2022b). In Wanzhou District, there is no obvious relation between landslides and the occurrence of snowmelt or earthquakes during the monitoring period; thus, only the criteria in precipitation and road construction are adopted in Wanzhou District.
The principle of spectral-based GCN (Kipf and Welling, 2017; Kipf, 2020) is concisely illuminated as follows. A graph G is depicted as G = (V, E, A, X, D) (Franco et al., 2009), in which V indicates the node set (slope unit set), E is the side set that connects nodes, A is the adjacency matrix that illuminates the geometric and topological relation, i.e., the location adjacency among various slope units, X denotes the feature matrix of nodes, and D is the degree matrix that reflects the number of sides connected to each node. There are mainly two operations on feature extraction involved in a spectral GCN: propagation operation and spectral-based convolution operation.
The propagation operation consists of aggregation and updation procedures. The aggregation model aggregates the features of the neighbor slope units, and the updation model combines the aggregated feature from the neighbors and the feature of the current slope unit itself to update the feature of the current slope unit (Eq. 4) (Franco et al., 2009; Kipf and Welling, 2017).
in which
The spectral-based convolution operation conducts a convolution operation after the Fourier transform on a graph (Bruna et al., 2013). It performs a convolution operation on the singular values of the graph Laplacian matrix (Bruna et al., 2013). The computational formula of graph convolution is shown in Eq. 5 (Kipf and Welling, 2017).
in which H (m) indicates the feature matrix in the mth layer, and H (0)=X;
A GCN of 4 layers is constructed in this work (Figure 4), and the output feature from the GCN is shown in Eq. 6. Moreover, the Dropout function (Hinton et al., 2012) is adopted to randomly abandon neighbor nodes (including the nodes that are 2 hops away) to avoid overfitting, and the Softmax prediction layer is used to transform the output feature from the GCN to probability values associated with landslide susceptibility.
in which

FIGURE 4. GCN structure in this work.
Moreover, in this work, the mean curvature watershed algorithm (Romstad and Etzelmüller, 2009; Hua et al., 2021) is adopted to segment the study area into 625,713 slope units in terms of the DEM data. A total of 14,833 slope units, composed of the landslide and non-landslide units of the same number, are randomly partitioned into 70% for GCN model training and 30% for model accuracy evaluation.
CNN (LeCun et al., 1989; LeCun and Bottou, 1998) is an attractive deep learning algorithm, and CART decision tree (C&T Tree) (Breiman et al., 1984) and SVM (Cortes and Vapnik, 1995) are both representative machine learning algorithms. These three algorithms have been extensively applied in LSE; thus, the LSE map generated by GCN is compared with the ones produced by CNN, C&T Tree, and SVM, respectively.
The key ideas in a CNN mainly include local receptive fields, local connections, shared weights, and pooling (LeCun and Bottou, 1998). Local receptive fields focus on the most relevant and important context features and neglect disrelated and inessential information to improve the prediction accuracy (LeCun and Bottou, 1998). Local connections mean the nodes in the current layer only connect to part of nodes in the last layer; thus, local characteristics are learned to improve the network learning efficiency (Lecun and Bottou, 1998; Goodfellow et al., 2016). Shared weights are to share convolution kernels and filters; thus, the number of network parameters can be effectively reduced to construct a lightweight network and to improve the computing power (Lecun and Bottou, 1998; Lecun and Ranzato, 2013). Pooling operation decreases the dimension of feature maps during feature aggregation and retains most significant features; thus, it can effectively overcome an overfitting problem and enhance the network generalization ability (Lecun and Bottou, 1998; Liu et al., 2016).
The principle of SVM is to calculate an optimal hyperplane, and the indistinguishable samples in a low-dimensional space can be separable by the hyperplane in a high-dimensional space (Cortes and Vapnik, 1995). It has a distinctive advantage in learning from small-size sample sets, and kernel functions can effectively solve linearly inseparable problems, avoid curse of dimensionality and reduce computational complexity (Cortes and Vapnik, 1995). Moreover, slack variables and a penalty coefficient are employed to avoid the influence from abnormal samples, and the model generalization capability can be improved (Cortes and Vapnik, 1995).
C&T Tree is a binary tree, and its core idea is split operations (Breiman et al., 1984). During each iteration of split, the optimal value of the optimal feature is determined according to the minimum error sum of squares (ESS) and is selected as the split condition (Breiman et al., 1984). The smaller is the ESS value, the more pure is the split sample set, and the more optimal is the feature (Breiman et al., 1984). A decision tree is recursively built, and the built process ends when the tree depth meets the threshold condition (Breiman et al., 1984).
Model precision is evaluated by 6 indices: Accuracy, True positive rate (TPR), F1-score, Root mean square error (RMSE), Mean absolute error (MAE), and AUC (area under curve). Their computational formulas are shown in Eqs 7–13.
In which TP, TN, FN, FP, P, and N are the numbers of true positive samples, true negative samples, false negative samples, false positive samples, positive samples, and negative samples, respectively. M is the number of samples, and yi and
AUC is the area under a receiver operating characteristic (ROC) curve, and the x-axis and y-axis of a ROC curve are false positive rate (FPR, i.e., 1-Specificity) (Eq. 13) and TPR (i.e., Sensitivity), respectively.
in which FP is the number of false positive samples.
According to the suggested integrated criteria for potential landslides, thirty-four potential (active) landslides are newly discovered (Figure 5). These landslides feature five main disaster-controlling and disaster-inducing characteristics (Figure 6). 1) 85.29% are situated in the Jurassic strata, a type of well-known sliding-prone stratum (Gui, 2014). This type of stratum is characterized by soft-hard interbedding rocks, e.g., the interbedding of quartz sandstone and mudstone, the interlayered rock mass of mudstone, feldspathic quartz sandstone, and siltstone, the interbedding of quartz sandstone and shale, and the interbedding of feldspathic quartz sandstone, shale, and sandy mudstone (WDGEM Report, 2012). 2) 82.35% feature steep topography, with slope angles larger than 20°. 3) Nine are located within 1 km of the folds, with the minimum distance of 28 m. 4) 41.18% occurred within 500 m of the rivers, with the nearest distance of 141 m. 5) 91.18% were moving under the function of precipitation, in which 8 landslides were deforming under the common action of rainfall and road construction. Moreover, the movement of 3 landslides is triggered by road construction, instead of precipitation. Therefore, the soft-hard interbedding rock mass, steep topography, frequent tectonic movement, and strong fluvial erosion have created a suitable geoenvironment for landslide development, and abundant precipitation and intensive human engineering activity have induced landslide movement.
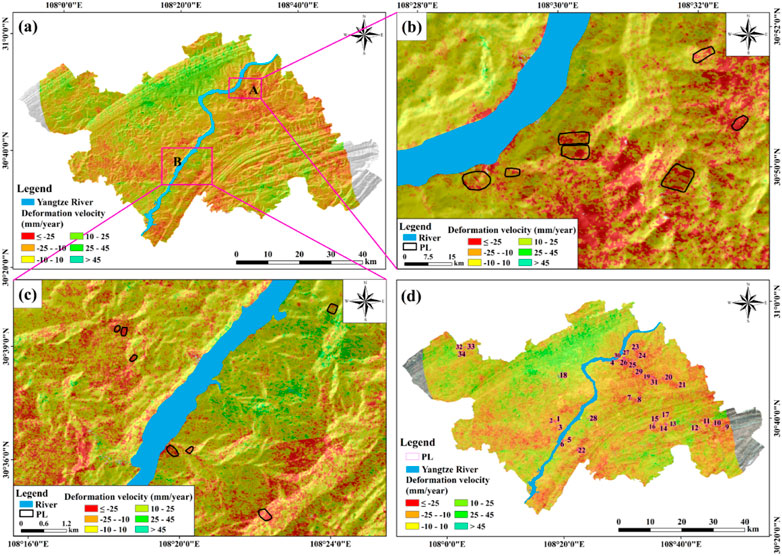
FIGURE 5. Identification of potential landslides. (A) Surface deformation. (B) Active deformation and potential landslides in Sub-region A. (C) Active deformation and potential landslides in Sub-region B. (D) 34 identified potential landslides. The abbreviation PL, potential landslide.
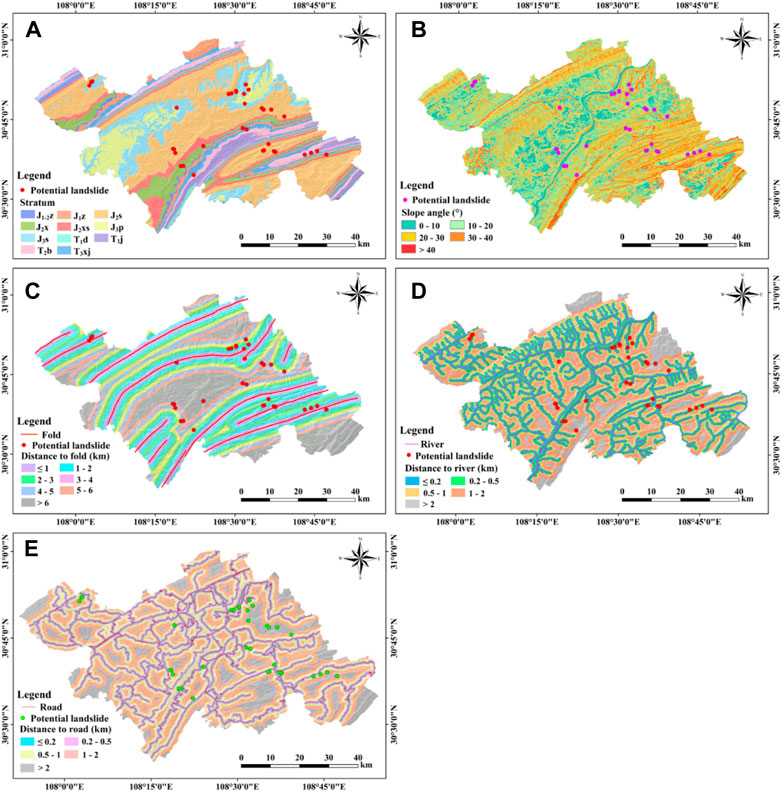
FIGURE 6. Disaster-controlling and disaster-inducing characteristics of 34 newly-discovered potential landslides. (A) Distribution of potential landslides in various strata. (B) Distribution of hidden landslides on steep mountains. (C) Control action of folds on potential landslides. (D) Influence of river cutting on landslides. (E) Relation between landslide distribution and road construction.
Two newly-discovered potential landslides, PL-8 and PL-33, induced by different mechanisms are selected as examples. Regarding PL-8 (Figure 7), it is a typical precipitation-induced landslide. Multiple long and wide gullies spread over the whole slope surface and converge at the slope foot (Figure 7B). Surface runoff scoured along the gullies, eroded the soil and rock mass and deeply cut the slope body. In addition, rainwater infiltrated through the cracks, softened the rock mass, and caused the generation of a weak sliding surface. Thus, the landslide became to move slowly, and the deformation progress was quite consistent with the rainfall variation (Figure 7C). The landslide slid relatively fast from May to November and crept relatively slow from December to the next April. As for PL-33 (Figure 8), its occurrence and development were triggered by both rainfall and road construction. A township road runs across the steep slope (Figure 8A), and road construction relaxed the soil and rock mass, destroyed the stress equilibrium and caused rock mass unloading. Moreover, the lithology features the alternating layers of mudstone, feldspathic quartz sandstone, and siltstone (Figure 6A), and mudstone is inclined to be softened and disintegrated under water-rock interaction (Huang and Che, 2007). Thus, under the coupled function of gravity unloading and rainwater softening, the slope lost stability and slowly moved. Together with the slope movement, the backwall was exposed, and cracks were generated and linked together (Figure 8B). The landslide exhibited intensive deformation near the road (Figures 8A, C) and moved faster in rainy season and slower in dry season (Figure 8D).
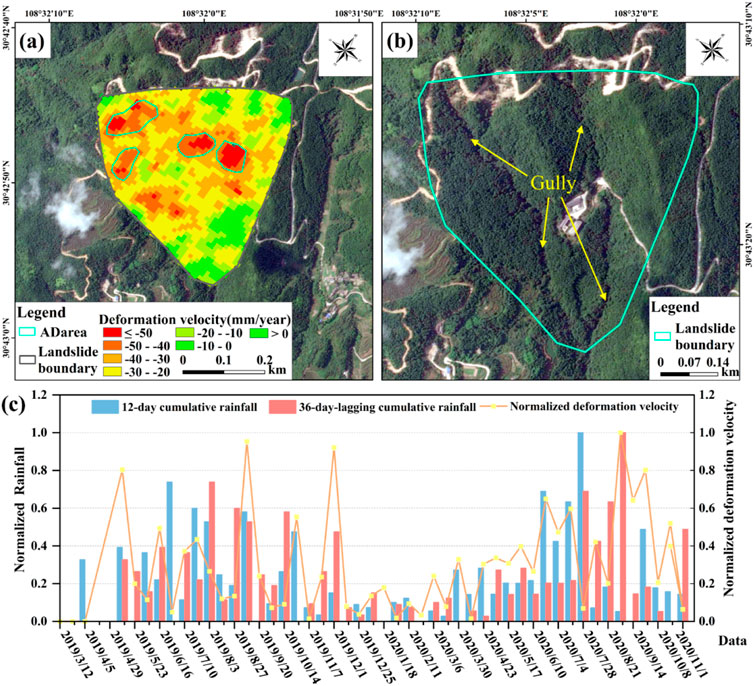
FIGURE 7. Deformation and cause characteristics of the potential landslide PL-8. (A) Active deformation features. (B) Macroscopical deformation signs. (C) Relation between active deformation and precipitation. The abbreviation ADarea = obvious deformation area. The base images are Google Earth images.
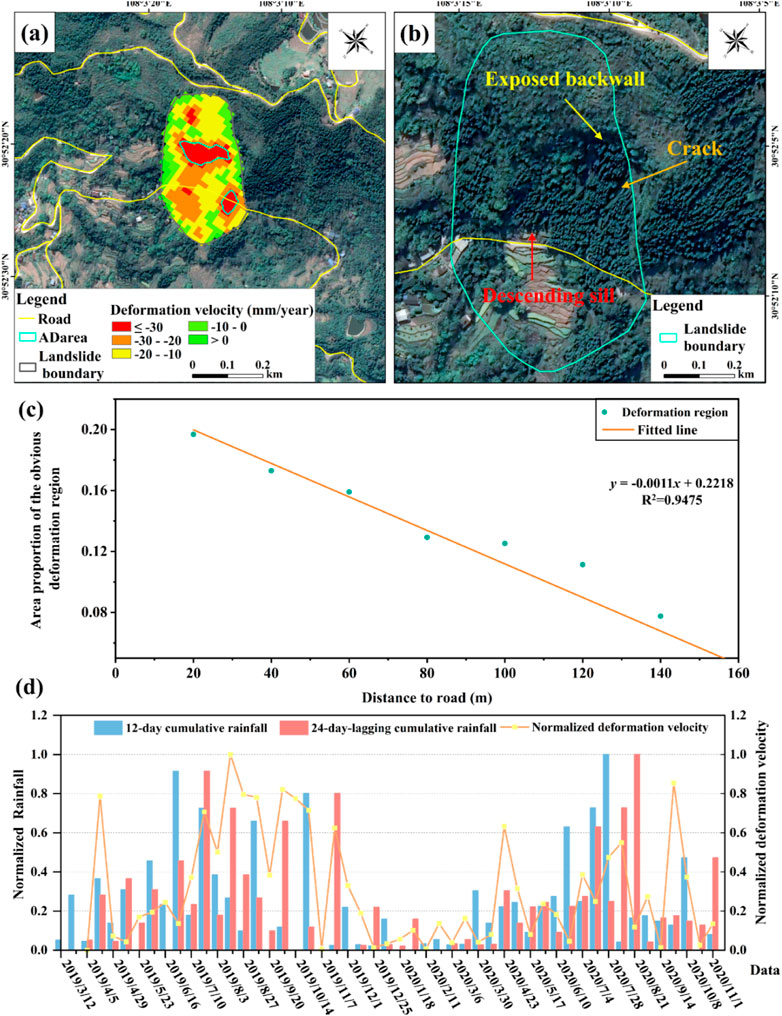
FIGURE 8. Deformation characteristics and inducing mechanism of the potential landslide PL-33. (A) Movement features and line of sight (LOS) deformation velocity. (B) Landslide geomorphological features. (C) Connection between active deformation and road construction. (D) Link between landslide movement and precipitation. The abbreviation ADarea = obvious deformation area. The base images are Google Earth images.
The study area is famous for a mountain city, and mountain roads are rugged, narrow, and difficult to pass over, which have brought great difficulties to field survey. Five identified potential landslide regions, which can be accessible, are selected to conduct field survey and are all successfully validated as landslides (Figure 9). These landslides are located in residential areas and have seriously threatened human lives and properties, including residential buildings, work sheds, roads, farmlands, orchards, woodlands, or fish ponds. One sub-landslide occurred beside an expressway under construction and may cause danger to the safe operation of the highway and to the safety of passing vehicles. Moreover, these landslides all feature obvious deformation signs, consisting of building cracks, road cracks and subsidence, descending sills, collapses, loose deposits, and small sub-landslides. For example, the width and length of a crack on Landslide PL-21 even attained 60 cm and 30 m, respectively. In the Landslide PL-28 region, multiple fish ponds ruptured, and water seeped into the ground due to the slope deformation. The settlement height of the cropland even reached nearly 2 m.
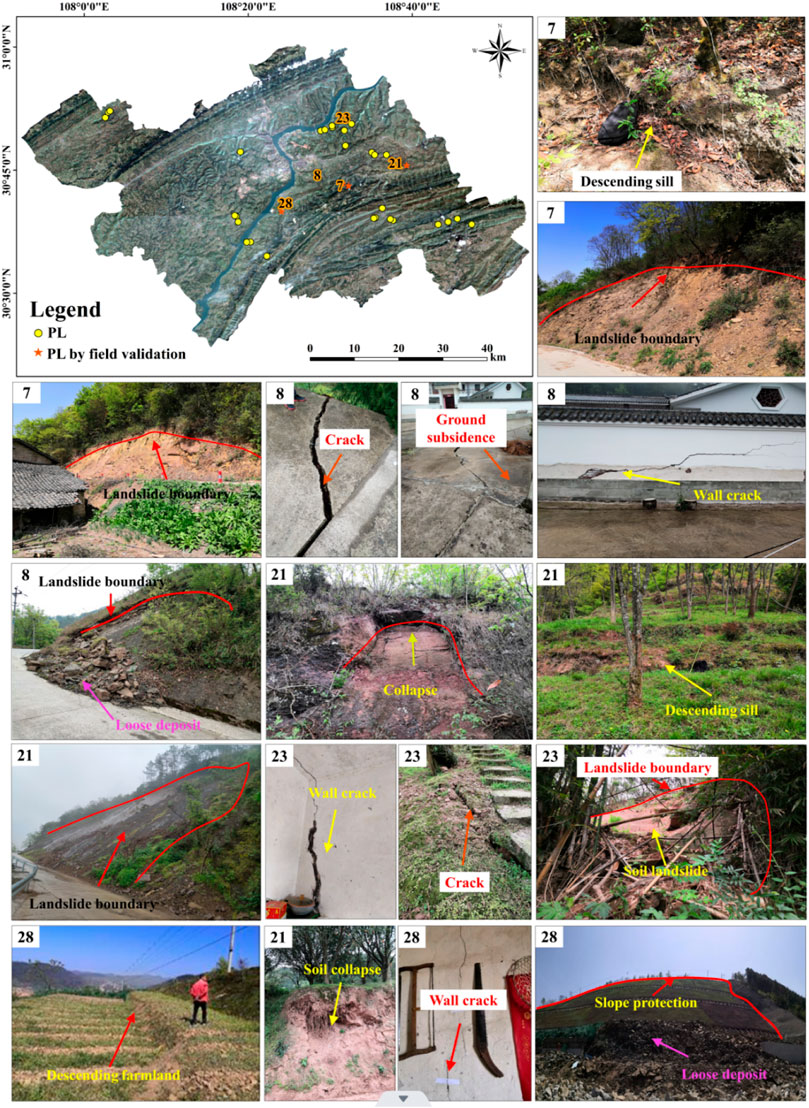
FIGURE 9. Field validation of 5 newly-discovered potential landslide regions. The obvious deformation and damage features are indicated in the photos.
The established evaluation indices are shown in Figure 10. All the 14 indices pass the multicollinearity inspection (Supplementary Table S1); however, the factors of surface roughness and topographic wetness index (TWI) do not pass the Spearman correlation coefficient test. Therefore, only the 12 indices marked by “#” in Table 2 are employed to evaluate landslide susceptibility. The generated LSE map is shown in Figure 11. 74.57% of the historical and potential landslides are situated in the very high and high susceptibility regions that occupy 24.82% of the study area (Table 3). The values of the precision indices are 0.94, 86.22%, 87.91%, and 0.86 for AUC, Accuracy, TPR, and F1-score, respectively (Table 4).
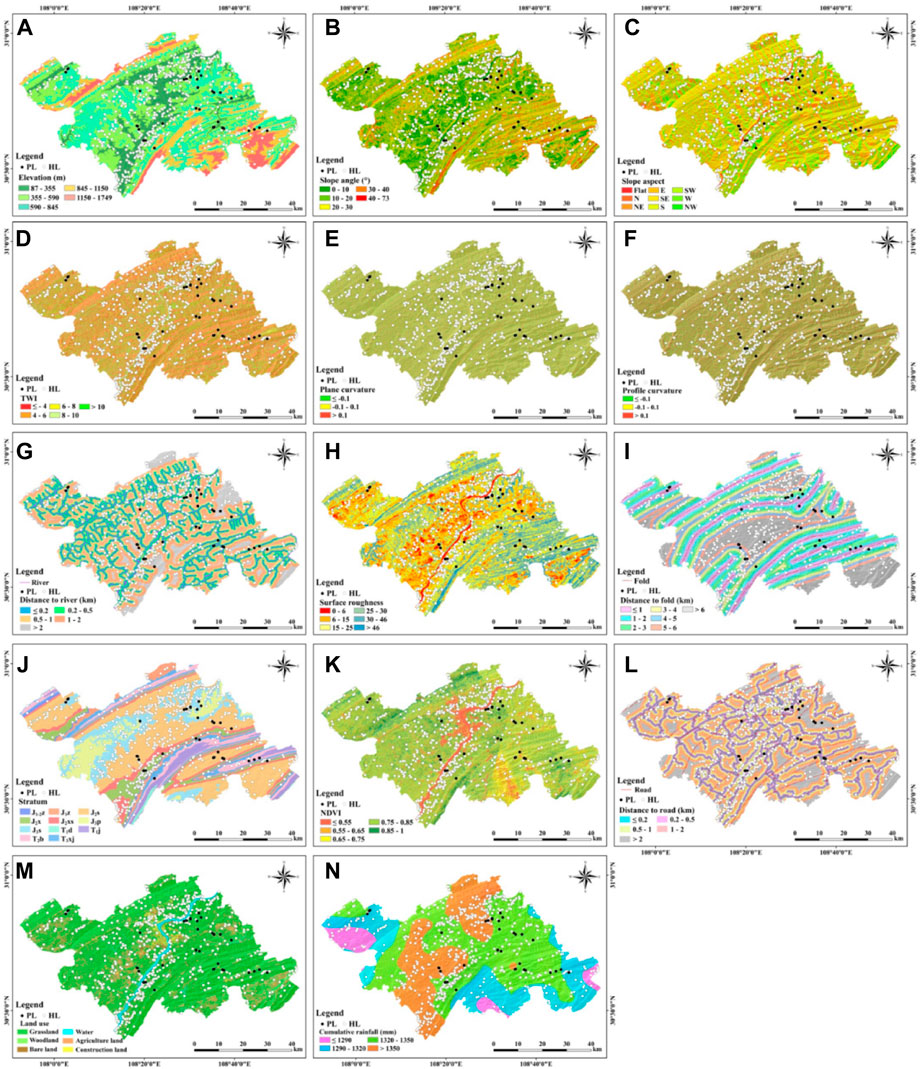
FIGURE 10. Evaluation indices of landslide susceptibility. (A) Elevation. (B) Slope angle. (C) Slope aspect. (D) Topographic wetness index (TWI). (E) Plane curvature. (F) Profile curvature. (G) Distance to river. (H) Surface roughness. (I) Distance to fold. (J) Stratum. (K) Normalized differential vegetation index (NDVI). (L) Distance to road. (M) Land use. (N) Cumulative rainfall. The abbreviations include: HL = Historical landslide; and PL = Potential landslide.
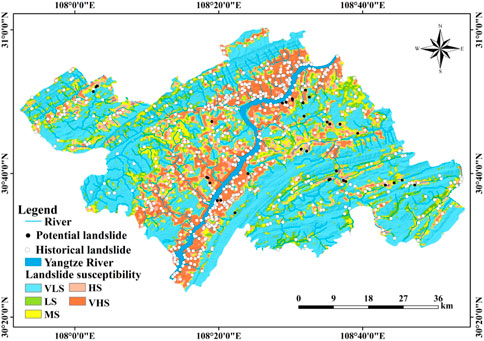
FIGURE 11. Landslide susceptibility map. The abbreviations include: VLS = Very low susceptibility; LS = Low susceptibility; MS = Medium susceptibility; HS = High susceptibility; and VHS = Very high susceptibility.
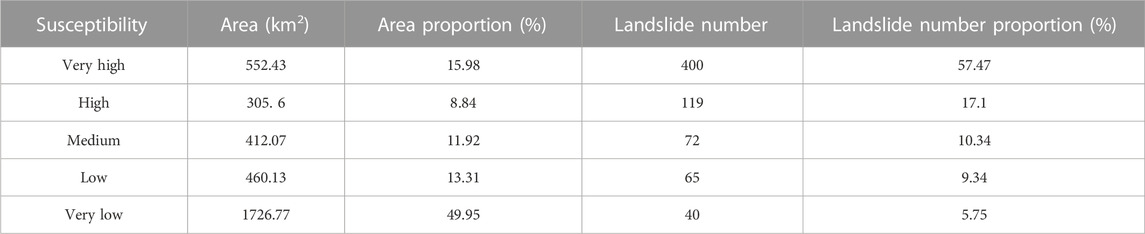
TABLE 3. Statistics of landslide susceptibility assessment.
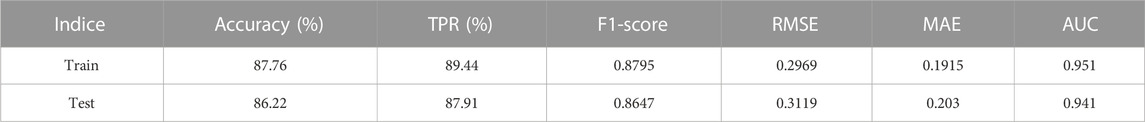
TABLE 4. Precision of landslide susceptibility evaluation.
Due to the intrinsic defect of InSAR technique, e.g., phase noises and decoherence, there are a great number of false alarm regions generated by SBAS-InSAR monitoring. These fake regions are characterized by similar shapes to landslides, obvious deformation features, and steep relief. Thus, they are easily misidentified as potential landslides according to the present commonly-used criteria based on surface deformation and topography: the absolute value of LOS deformation velocity is larger than 10 mm/yr, and the slope angle is above 10°. Eighty-eight representative false alarm regions are shown in Figure 12 and can be partitioned into three types. 1) Fifteen fake regions are originated from phase noises, and the deformation of these regions lacks in inducing mechanism. Thus, these fake regions fail to meet the environmental criteria and triggering mechanism criteria proposed in this work. 2) Forty false regions are embodied as ground subsidence caused by human engineering activity, e.g., road construction, building construction, or farmland cultivation, rather than mass movement along slopes. Four fake regions of this type feature hard rock mass dominant in limestone and dolomite limestone, and no historical landslide occurred in this type of stratum. Therefore, these regions mismatch the micro-geomorphological criterion and stratum criterion. 3) Thirty-three false alarm regions do not exhibit landslide geomorphological characteristics such as free surfaces. Thus, they do not conform to the micro-geomorphological criterion. Three examples of fake regions are shown in Figure 13.
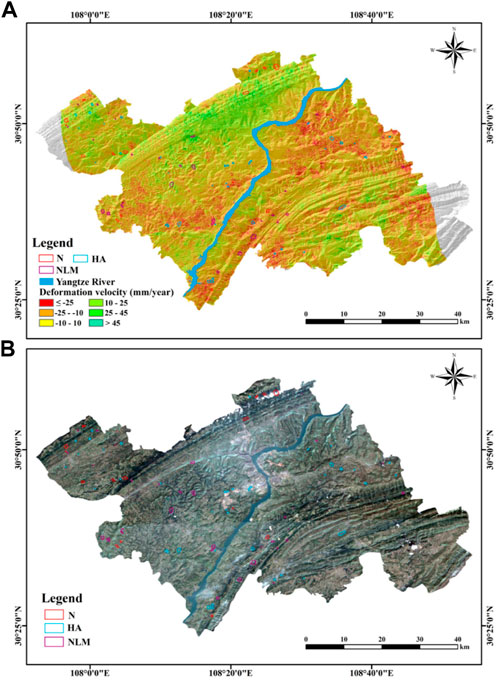
FIGURE 12. Some representative false alarm regions superimposed on (A) LOS deformation velocity extracted by SBAS-InSAR technnique, and (B) Landsat 8 images. N indicates the false alarm regions caused by phase noises, HA represents the false alarm regions produced from human activity, and NLM means the false alarm regions without landslide geomorphological characteristics.
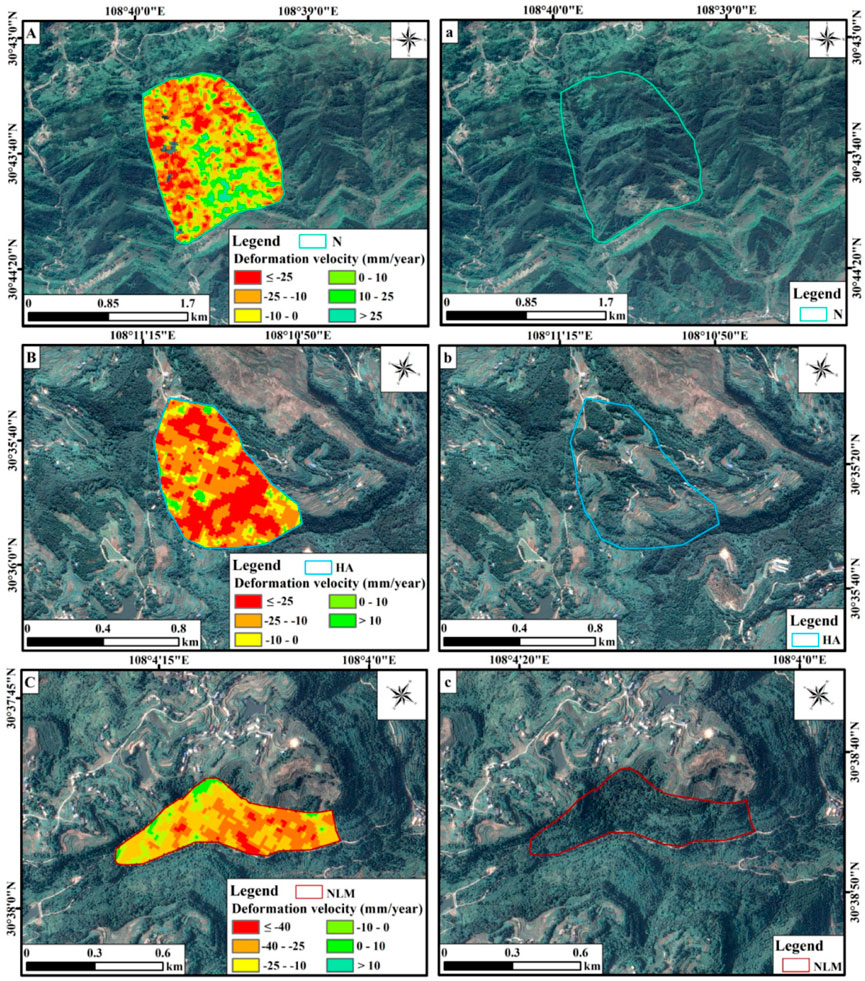
FIGURE 13. Three examples of false alarm regions. (A) Active deformation in a false alarm region sourced from phase noises. (a) Google image of the false alarm region shown in (A). (B) Active deformation in a false alarm region caused by human engineering activity. (b) Google image of the false alarm region shown in (B). (C) Active deformation in a false alarm region without landslide geomorphology. (c) Google image of the false alarm region shown in (C). N indicates the false alarm regions caused by phase noises, HA represents the false alarm regions produced from human activity, and NLM means the false alarm regions without landslide geomorphological characteristics.
The LSE maps of the established GCN, CNN (LeCun et al., 1989; LeCun and Bottou, 1998), SVM (Cortes and Vapnik, 1995), and C&T Tree (Breiman et al., 1984) algorithms are shown in Figure 14. Regarding CNN, the network structure is composed of one input layer, two convolutional layers, two max-pooling layers, and one fully connected layer with the Softmax function. The value of learning rate is set as 0.001, AdamOptimizer is employed to update the network weight values and to speed up the convergence, and a mean squared error is adopted as the loss function. As for SVM, a radial base function is used as the kernel function, and the values of the penalty coefficient C and the parameterγare both set as 0.1. As to C&T Tree, the value of minimum impurity change is set as 0.0001, the minimum record numbers in parent and child branches are both 2%, and the tree depth is 5. The LSE statistics and accuracy assessments are shown in Figures 15, 16. The number proportion of landslides falling in very high and high susceptibility regions are 74.57%, 61.64%, 59.77%, and 36.21%, respectively for the GCN, CNN, SVM, and C&T Tree algorithms. GCN generally possesses the highest LSE accuracy. The AUC values are 0.941, 0.926, 0.835, and 0.762, respectively for the GCN, CNN, SVM, and C&T Tree algorithms. Therefore, GCN is superior to other three machine learning algorithms in the study area.

FIGURE 14. Landslide susceptibility assessment maps. (A) GCN algorithm. (B) CNN algorithm. (C) SVM algorithm. (D) C&T Tree algorithm.
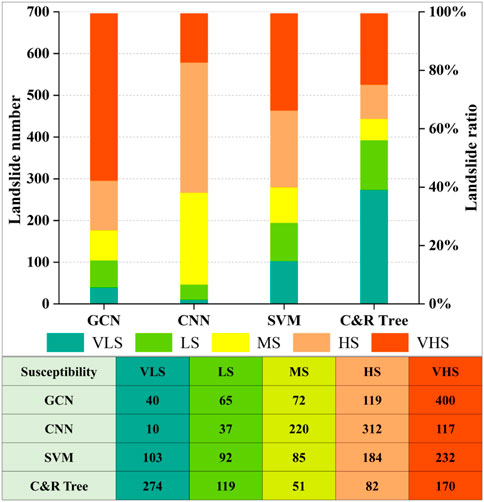
FIGURE 15. Landslide susceptibility statistics of the GCN, CNN, SVM, and C&T Tree algorithms.
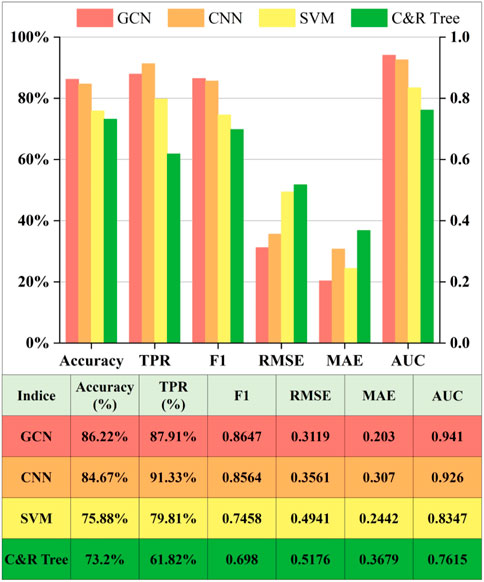
FIGURE 16. Precision comparison of landslide susceptibility evaluation by the GCN, CNN, SVM, and C&T Tree algorithms.
Very low and low susceptibility regions are mainly distributed in the strata of T1d, T1j, T2b, and T3xj, and some areas are dominant in hard rocks of limestone and dolomite limestone and feature high rock strength and good rock structure stability. This type of region is primarily far away from rivers (>2 km), dominated by woodland and grassland, and suffered from low rainfall (<1300 mm/yr). Rainwater flew down a slope rapidly, and it was difficult to generate water storage. Therefore, very low and low susceptibility regions are characterized by relatively good rock stability, dense vegetation, slight influence from river erosion and human engineering activity; thus, the slopes are relatively stable.
Medium susceptibility regions are primarily situated in the strata of J2s, J1-2z, and J3p and feature soft-hard interbeddings that consist of the interbedding of mudstone, feldspathic quartz sandstone, and siltstone, interbedding of shale, limestone, and quartz sandstone, and interbedding of quartz sandstone, lithic sandstone, and shale. Shale and mudstone tend to be softened after absorbing water (Huang and Che, 2007; Teng et al., 2010). Most areas are located 1-2 km away from rivers, and some regions were influenced by agricultural activity. Therefore, under the combined action of river erosion, softened rock mass, groundwater fluctuation, and agricultural irrigation, some slopes became instable and evolved into landslides.
Very high and high susceptibility regions are mainly located along the Yangtze River and its tributaries. Very high susceptibility regions are primarily distributed within 1 km of rivers, and some very high and high susceptibility areas are situated within 2 km of rivers. This type of area is dominated by construction land and agricultural land, and some areas are dominant in woodland. Abundant rainfall (>1320 mm/yr) is a remarkable feature, and the slope degree varies from 10° to 30°. The exposed strata mainly consist of J2s, J2x, J2xs, and J3s, and are characterized by the interbedding of quartz sandstone and siltstone, interbedding of quartz sandstone, shale, and mudstone, and interbedding of sandstone and mudstone. The interbedding of sandstone and mudstone is easily weathered to generate cavities (Jian et al., 2005). Moreover, due to frequent rainfall, mudstone and montmorillonite produced soft swelling soil (Gui, 2014). This kind of soil became saturated when suffering from water action; thus, the shear strength significantly decreased, and the sliding force of soil and rock mass obviously increased (Gui, 2014). Therefore, under the coupled action of weathered rock mass, soft rock and swelling soil, strong river erosion, abundant rainfall, and intensive human engineering activity, the stress balance was destroyed, shear strength sharply reduced, weak sliding surfaces formed, and then landslides occurred and moved down along relatively steep topography (Figure 17).
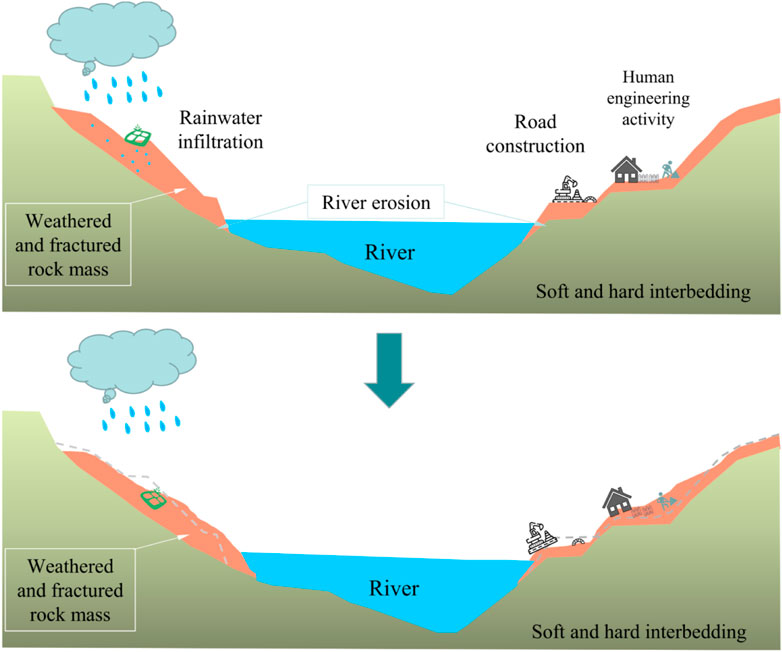
FIGURE 17. Distribution characteristics of high landslide susceptibility in the study area. The symbols are from the website: https://www.iconfont.cn/.
This work establishes integrated criteria for potential landslide recognition, and these criteria can be universally applied in various landslide-affection regions. The criteria cover the slope movement, disaster-controlling, and disaster-triggering mechanism and are composed of the characteristics of active deformation, stratum and lithology, tectonics, topography, micro-geomorphology, environment, meteorology, earthquakes, and human engineering activity. This criterion set obviously decreases the false alarm rate of potential landslide identification and is successfully validated by field survey. In addition, this work combines historical landslides and the newly-identified potential landslides to implement LSE; thus, the accuracy, rationality, and practicability of a LSE map are improved. Moreover, GCN can well portray the topological and feature relation among various slope units, and a GCN of 4 layers is established to conduct LSE. The GCN algorithm reaches a relatively high accuracy and outperforms the other representative machine learning algorithms of CNN, SVM, and C&T Tree. The following conclusions are drawn in this work.
(1) The suggested criteria can well eliminate 4 types of false alarm regions: (a) fake regions sourced from phase noises, (b) fake regions caused by human engineering activity, (c) false areas with stable rock structure, and (d) false areas without landslide micro-geomorphological features. These fake regions are characterized by similar shapes to landslides, obvious deformation features, and steep relief. Thus, they are easily misidentified as potential landslides according to the present commonly-used criteria based on surface deformation and topography.
(2) According to the proposed criteria, 34 potential landslides are newly discovered in the famous landslide-serious region, Wanzhou District. The soft-hard interbedding rock mass, steep topography, frequent tectonic movement, and strong fluvial erosion have created a suitable geoenvironment for potential landslide development. In addition, abundant rainwater infiltrated into the fractured rock mass, softened rock and soil, and caused the generation of a weak sliding surface. Furthermore, intensive human engineering activity, especially road construction and building construction, relaxed the soil and rock mass, destroyed the stress equilibrium, and led to slope toe mass unloading. Therefore, under the combined action of lithology, relief, tectonic movement, river erosion, precipitation, and human engineering activity, a slope gradually lost stability, slowly moved along steep topography, and evolved into an active landslide.
(3) The combination of slope units and GCN is for the first time employed in LSE and achieves a relatively high precision. The values of the precision indices are 0.94, 86.22%, 87.91%, and 0.86 for AUC, Accuracy, TPR, and F1-score, respectively. Moreover, the constructed 4-layer GCN outperforms the classical machine learning algorithms: CNN, SVM, and C&T Tree. The number proportion of landslides falling in very high and high susceptibility regions are 74.57%, 61.64%, 59.77%, and 36.21%, respectively for the GCN, CNN, SVM, and C&T Tree algorithms. The AUC values are 0.941, 0.926, 0.835, and 0.762, respectively for the GCN, CNN, SVM, and C&T Tree algorithms. Therefore, GCN generally possesses the highest LSE accuracy.
(4) The distribution characteristics of high landslide susceptibility are illuminated. The study area features the particular lithology of sandstone and mudstone interbedding that was weathered to generate cavities. In addition, under the influence of abundant rainfall, the unique mudstone and montmorillonite in the facility-sliding strata produced soft swelling soil, and the soil absorbed water, became saturated and led to a decrease in shear strength and an increase in sliding force. Moreover, strong erosion from the Yangtze River and its tributaries, and intensive perturbation from road construction, building construction, and agricultural cultivation facilitated slope instability. Therefore, high landslide susceptibility is caused by the coupled action of weathered rock cavities, soft rock and swelling soil, strong river erosion, abundant rainfall, and intensive human engineering activity.
The original contributions presented in the study are included in the article/Supplementary Material, further inquiries can be directed to the corresponding author.
XW: conceptualization, methodology, formal analysis, writing-original draft, writing-review and editing. AD: formal analysis, software, drawing, writing-original draft. FH: methodology, software, experiment, field survey, writing-original draft. ZL: writing-review and editing. XZ: drawing, writing-review and editing. LW: writing-review and editing. HG: writing-review and editing. All authors have read and approved the final manuscript.
This work is funded by the National Natural Science Foundation of China (U21A2013, 71874165), Opening Fund of Key Laboratory of Geological Survey and Evaluation of Ministry of Education (Grant Nos. GLAB2020ZR02, GLAB2022ZR02), State Key Laboratory of Biogeology and Environmental Geology (Grant No. GBL12107), the Fundamental Research Funds for the Central Universities, China University of Geosciences (Wuhan) (CUG2642022006), and Hunan Provincial Natural Science Foundation of China (2021JC0009).
We are grateful for the Wanzhou Bureau of Planning and Natural Resources for providing the geological disaster data in Wanzhou District.
The authors declare that the research was conducted in the absence of any commercial or financial relationships that could be construed as a potential conflict of interest.
All claims expressed in this article are solely those of the authors and do not necessarily represent those of their affiliated organizations, or those of the publisher, the editors and the reviewers. Any product that may be evaluated in this article, or claim that may be made by its manufacturer, is not guaranteed or endorsed by the publisher.
The Supplementary Material for this article can be found online at: https://www.frontiersin.org/articles/10.3389/feart.2023.1132722/full#supplementary-material
Aslam, B., Zafar, A., and Khalil, U. (2022). Comparative analysis of multiple conventional neural networks for landslide susceptibility mapping. Nat. Hazards 115, 673–707. doi:10.1007/s11069-022-05570-x
Berhane, G., and Tadesse, K. (2021). Landslide susceptibility zonation mapping using statistical index and landslide susceptibility analysis methods: A case study from gindeberet district, oromia regional state, Central Ethiopia. J. Afr. Earth Sci. 180, 104240. doi:10.1016/j.jafrearsci.2021.104240
Breiman, L., Friedman, J. H., and Olshen, R. A. (1984). Classification and regression trees. California: Wad-Sworth International Group, 1–358.
Bruna, J., Zaremba, W., Szlam, A., and LeCun, Y., Spectral networks and locally connected networks on graphs. arXiv preprint arXiv:1312.6203, 2013.
Bui, D. T., Shahabi, H., Shirzadi, A., Chapi, K., Alizadeh, M., Chen, W., et al. (2018). Landslide detection and susceptibility mapping by AIRSAR data using support vector machine and index of entropy models in Cameron Highlands, Malaysia. Remote Sens. 10 (10), 1527. doi:10.3390/rs10101527
Cao, C., Zhu, K., Xu, P., Shan, B., Yang, G., and Song, S. (2022). Refined landslide susceptibility analysis based on InSAR technology and UAV multi-source data. J. Clean. Prod. 368, 133146. doi:10.1016/j.jclepro.2022.133146
Carrera, A. C. V., Mendoza, M. E., Allende, T. C., and Macias, J. L. (2021). A review of recent studies on landslide hazard in Latin America. Phys. Geogr. doi:10.1080/02723646.2021.1978372
Chowdhuri, I., Pal, S. C., Chakrabortty, R., Malik, S., Das, B., and Roy, P. (2021). Torrential rainfall-induced landslide susceptibility assessment using machine learning and statistical methods of eastern Himalaya. Nat. Hazards 107, 697–722. doi:10.1007/s11069-021-04601-3
Cortes, C., and Vapnik, V. (1995). Support-vector networks. Mach. Learn. 20 (3), 273–297. doi:10.1007/bf00994018
Daviran, M., Shamekhi, M., Ghezelbash, R., and Maghsoudi, A. (2022). Landslide susceptibility prediction using artificial neural networks, SVMs and random forest: Hyperparameters tuning by genetic optimization algorithm. Int. J. Environ. Sci. Technol. 20, 259–276. Online. doi:10.1007/s13762-022-04491-3
Deng, H., Wu, X. N., Zhang, W. J., Liu, Y., Li, W., Li, X., et al. (2022). Slope-unit scale landslide susceptibility mapping based on the random forest model in deep valley areas. Remote Sens. 14, 4245. doi:10.3390/rs14174245
Ehteshami-Moinabadi, M. (2022). Properties of fault zones and their influences on rainfall-induced landslides, examples from Alborz and Zagros ranges. Environ. Earth Sci. 81, 168. doi:10.1007/s12665-022-10283-2
Es-Smairi, A., Ei Moutchou, B., Touhami, A. E., Namous, M., and Mir, R. A. (2022). Landslide susceptibility mapping using GIS-based bivariate models in the Rif chain (northernmost Morocco). Geocarto Int., 1–31. doi:10.1080/10106049.2022.2097322
Franco, S., Marco, G., Ah Chung, T., Hagenbuchner, M., and Monfardini, G. (2009). The graph neural network model. IEEE Trans. Neural Netw. 20, 61–80. doi:10.1109/tnn.2008.2005605
Gao, K., Cui, P., Wei, F., Li, Y., and Zhang, Q-Y. (2005). GIS-based assessment of landslide hazards of Wanzhou in Three Gorges region. IEEE Int. Geoscience Remote Sens. Symposium 05, 5227–5230. doi:10.1109/igarss.2005.1526863
Garcia-Delgado, H., Petley, D. N., Bermudez, M. A., and Sepulveda, S. A. (2022). Fatal landslides in Colombia (from historical times to 2020) and their socio-economic impacts. Landslides 19, 1689–1716. doi:10.1007/s10346-022-01870-2
Ge, D. (2013). Research on the key techniques of SAR interferometry for regional land subsidence monitoring. Doctoral dissertation. Beijing): China University of Geosciences.
Ge, R. X., Lv, Y. Q., and Tao, W. H. (2022). A statistical prediction model for healthcare and landslide sensitivity evaluation in coal mining subsidence area. Comput. Intell. Neurosci. 2022, 1805689. doi:10.1155/2022/1805689
Ghorbanzadeh, O., Blaschke, T., Gholamnia, K., Meena, S. R., Tiede, D., and Aryal, J. (2019). Evaluation of different machine learning methods and deep-learning convolutional neural networks for landslide detection. Remote Sens. 11, 196. doi:10.3390/rs11020196
Ghorbanzadeh, O., Shahabi, H., Crivellari, A., Homayouni, S., Blaschke, T., and Ghamisi, P. (2022a). Landslide detection using deep learning and object-based image analysis. Landslides 19, 929–939. doi:10.1007/s10346-021-01843-x
Ghorbanzadeh, O., Xu, Y., Ghamisi, P., Kopp, M., and Landslide4Sense, Kreil D. (2022b). Landslide4Sense: Reference benchmark data and deep learning models for landslide detection. IEEE Trans. Geoscience Remote Sens. 60, 1–17. doi:10.1109/TGRS.2022.3215209
Goyes-Penafiel, P., and Hernandez-Rojas, A. (2021). Landslide susceptibility index based on the integration of logistic regression and weights of evidence: A case study in popayan, Colombia. Eng. Geol. 280, 105958. doi:10.1016/j.enggeo.2020.105958
Gui, L. (2014). Research on landslide displacement regularities and risk in Wanzhou District, three Gorges reservoir. Doctoral dissertation. Wuhan, China): China University of Geosciences.
Guzzetti, F., Gariano, S. L., Peruccacci, S., Brunetti, M. T., Marchesini, I., Rossi, M., et al. (2020). Geographical landslide early warning systems. Earth-Science Rev. 200, 102973. doi:10.1016/j.earscirev.2019.102973
Hakim, W. L., Rezaie, F., Nur, A. S., Panahi, M., Khosravi, K., Lee, C. W., et al. (2022). Convolutional neural network (CNN) with metaheuristic optimization algorithms for landslide susceptibility mapping in Icheon, South Korea. J. Environ. Manag. 305, 114367. doi:10.1016/j.jenvman.2021.114367
Haque, U., da Silva, P. F., Devoli, G., Pilz, J., Zhao, B., Khaloua, A., et al. (2019). The human cost of global warming: Deadly landslides and their triggers (1995-2014). Sci. Total Environ. 682, 673–684. doi:10.1016/j.scitotenv.2019.03.415
Hinton, G. E., Srivastava, N., Krizhevsky, A., Sutskever, I., and Salakhutdinov, R. R. (2012). Improving neural networks by preventing co-adaptation of feature detectors. Comput. Sci. 3 (4), 212–223.
Hua, Y., Wang, X., Li, Y., Xu, P., and Xia, W. (2021). Dynamic development of landslide susceptibility based on slope unit and deep neural networks. Landslides 18 (1), 281–302. doi:10.1007/s10346-020-01444-0
Huang, H., and Che, P. (2007). Research on micro-mechanism of softening and argillitization of mudstone. J. Tongji Univ. Nat. Sci. 35 (7), 866870.
Hussain, M. A., Chen, Z., Wang, R., and Shoaib, M. (2021). PS-InSAR-based validated landslide susceptibility mapping along Karakorum Highway, Pakistan. Remote Sens. 13, 4129. doi:10.3390/rs13204129
Hussain, S., Sun, H., Ali, M., and Ali, M. (2020). PS-InSAR based validated landslide susceptibility modelling: A case study of ghizer valley, northern Pakistan. Geocarto Int. 37 (13), 3941–3962. doi:10.1080/10106049.2020.1870165
Hussain, S., Sun, H., Ali, M., Sajjad, M. M., Ali, M., Afzal, Z., et al. (2021). Optimized landslide susceptibility mapping and modelling using PS-InSAR technique: A case study of chitral valley, northern Pakistan. Geocarto Int. 37, 5227–5248. doi:10.1080/10106049.2021.1914750
Jafari, A., and Haratizadeh, S. (2022). Gcnet: Graph-based prediction of stock price movement using graph convolutional network. Eng. Appl. Artif. Intell. 116, 105452. doi:10.1016/j.engappai.2022.105452
Jian, W., Yin, K., Ma, C., Liu, L-L., and Zhang, C. (2005). Characteristics of incompetent beds in Jurassic red clastic rocks in Wanzhou. Geotechnics (06), 901–905. (in Chinese).
Jiang, Y., Luo, H., Xu, Q., Lu, Z., Liao, L., Li, H., et al. (2022). A graph convolutional incorporating GRU network for landslide displacement forecasting based on spatiotemporal analysis of GNSS observations. Remote Sens. 14, 1016. doi:10.3390/rs14041016
Kipf, T. N. (2020). Deep learning with graph-structured representations. Doctoral dissertation. Amsterdam, Netherlands: University of Amsterdam.
Kipf, T. N., and Welling, M. (2017). Semi-supervised classification with graph convolutional networks. Comput. Sci. 17 (2), 1–14.
Kouhartsiouk, D., and Perdikou, S. (2021). The application of DInSAR and Bayesian statistics for the assessment of landslide susceptibility. Nat. Hazards 105, 2957–2985. doi:10.1007/s11069-020-04433-7
LeCun, Y., Boser, B., Denker, J. S., Henderson, D., Howard, R. E., Hubbard, W., et al. (1989). Backpropagation applied to handwritten zip code recognition. Neural Comput. 1 (4), 541–551. doi:10.1162/neco.1989.1.4.541
Lecun, Y., Bottou, L., Bengio, Y., and Haffner, P. (1998). Gradient-based learning applied to document recognition. Proc. IEEE 86 (11), 2278–2324. doi:10.1109/5.726791
Lecun, Y., and Ranzato, M. (2013). Deep learning tutorial. International conference on machine learning(ICML’13), Google Scholar, 73–100.
Li, C., Wang, X., Tang, H., Lei, G., Yan, J., and Zhang, Y. (2017). A preliminary study on the location of the stabilizing piles for colluvial landslides with interbedding hard and soft bedrocks. Eng. Geol. 224, 15–28. doi:10.1016/j.enggeo.2017.04.020
Lin, Y. T., Chen, Y. K., Yang, K. H., Chen, C. S., and Han, J. Y. (2021). Integrating InSAR observables and multiple geological factors for landslide susceptibility assessement. Appl. Sci. 11, 7289. doi:10.3390/app11167289
Liu, H., and Ren, G. (2008). The study of development character of typical debris in Ragstone. J. Mt. Sci. 3, 372–375.
Liu, R., Meng, G., Yang, B., Sun, C., and Chen, X. (2016). Dislocated time series convolutional neural architecture: An intelligent fault diagnosis approach for electric machine. IEEE Trans. Industrial Inf. 13 (3), 1310–1320. doi:10.1109/tii.2016.2645238
Luo, L. (2006). A study on the geological disaster of Wanzhou District and a solution to it. Master’s thesis. Chongqing City, China: Southwest University.
Lv, M., Hong, Z., Chen, L., Chen, T., Zhu, T., and Ji, S. (2021). Temporal multi-graph convolutional network for traffic flow prediction. IEEE Trans. Intelligent Transp. Syst. 22 (6), 3337–3348. doi:10.1109/tits.2020.2983763
Ma, Z., Prezioso, E., Zhang, Z., and Xu, N. (2021). A deep learning approach using graph convolutional networks for slope deformation prediction based on time-series displacement data. Neural Comput. Appl. 33, 14441–14457. doi:10.1007/s00521-021-06084-6
Meghanadh, D., Ashutosh, T., and Ramji, D. (2021). Landslide susceptibility mapping using MT-InSAR and AHP enabled GIS-based multi-criteria decision analysis. Geomatics, Nat. Hazards Risk 12 (1), 675–693. doi:10.1080/19475705.2021.1887939
Meghanadh, D., Maurya, V. K., Tiwari, A., and Dwivedi, R. (2022). A multi-criteria landslide susceptibility mapping using deep multi-layer perceptron network: A case study of srinagar-rudraprayag region (India). Adv. Space Res. 69, 1883–1893. doi:10.1016/j.asr.2021.10.021
Miles, J. (2005). Tolerance and variance inflation factor. Encycl. Statistics Behav. Sci. doi:10.1002/0470013192.bsa683
MNR Report (2020). Report on satellite remote sensing applications of the Ministry of Natural Resources, PRC. Ministry Nat. Resour. PRC.
Mohammadi, A., Karimzadeh, S., Jalal, S. J., Kamran, K. V., Shahabi, H., Homayouni, S., et al. (2020). A multi-sensor comparative analysis on the suitability of generated DEM from Sentinel-1 SAR interferometry using statistical and hydrological models. Sensors 20 (24), 7214. doi:10.3390/s20247214
Mondini, A. C., Guzzetti, F., Chang, K. T., Monserrat, O., Martha, T. R., and Manconi, A. (2021). Landslide failures detection and mapping using Synthetic Aperture Radar: Past, present, and future. Earth-Science Rev. 216, 103574. doi:10.1016/j.earscirev.2021.103574
Necsoiu, M., Mcginnis, R. N., and Hooper, D. M. (2014). New insights on the Salmon Falls Creek Canyon landslide complex based on geomorphological analysis and multitemporal satellite InSAR techniques. Landslide 11, 1141–1153. doi:10.1007/s10346-014-0523-8
Ngo, P. T. T., Panahi, M., Khosravi, K., Ghorbanzadeh, O., Kariminejad, N., Cerda, A., et al. (2021). Evaluation of deep learning algorithms for national scale landslide susceptibility mapping of Iran. Geosci. Front. 12, 505–519. doi:10.1016/j.gsf.2020.06.013
Nhu, V., Mohammadi, A., Shahabi, H., Ahmad, B. B., Al-Ansari, N., Shirzadi, A., et al. (2020). Landslide detection and susceptibility modeling on Cameron Highlands (Malaysia): A comparison between random forest, logistic regression and logistic model tree algorithms. Forests 11, 830. doi:10.3390/f11080830
Nwazelibe, V. E., Unigwe, C. O., and Egbueri, J. C. (2023). Testing the performances of different fuzzy overlay methods in GIS-based landslide susceptibility mapping of Udi Province, SE Nigeria. Catena 220, 106654. doi:10.1016/j.catena.2022.106654
Reichenbach, P., Rossi, M., Malamud, B. D., Mihir, M., and Guzzetti, F. (2018). A review of statistically-based landslide susceptibility models. Earth-Science Rev. 180, 60–91. doi:10.1016/j.earscirev.2018.03.001
Richard, J. C., Stanley, A. S., and David, E. S. (1984). Geomorphology. Cambridge: Cambridge University Press, 255–275.
Romstad, B., and Etzelmüller, B. (2009). Structuring the digital elevation model into landform elements through watershed segmentation of curvature. Geomorphology 163, 55–60.
ROWDG Report (2005). Research office of Wanzhou district government. Enlightenment on emergency disposal of a massive landslide in Wanzhou on september 5, 2004. New Chongqing 11, 42–43. (In Chinese).
Shahabi, H., and Hashim, M. (2015). Landslide susceptibility mapping using GIS-based statistical models and remote sensing data in tropical environment. Sci. Rep. 5, 9899. doi:10.1038/srep09899
Shou, K. J., and Chen, J. R. (2021). On the rainfall induced deep-seated and shallow landslide hazard in Taiwan. Eng. Geol. 288, 106156. doi:10.1016/j.enggeo.2021.106156
Solari, L., Bianchini, S., Rachele, F., Barra, A., Monserrat, O., Thuegaz, P., et al. (2020). Satellite interferometric data for landslide intensity evaluation in mountainous regions. Int. J. Appl. Earth Observation Geoinformation 87, 102028. doi:10.1016/j.jag.2019.102028
Spearman, C. (2010). The proof and measurement of association between two things. Int. J. Epidemiol. 5 (39), 1137–1150. doi:10.1093/ije/dyq191
Sun, X. F., Yuan, L. G., Tao, S. Q., Liu, M., Li, D. F., Zhou, Y. Z., et al. (2022). A novel landslide susceptibility optimization framework to assess landslide occurrence probability at the regional scale for environmental management. J. Environ. Manag. 322, 116108. doi:10.1016/j.jenvman.2022.116108
Taalab, K., Cheng, T., and Zhang, Y. (2018). Mapping landslide susceptibility and types using random forest. Big Earth Data 2, 159–178. doi:10.1080/20964471.2018.1472392
Tatard, L., Grasso, J. R., Helmstetter, A., and Garambois, S. (2010). Characterization and comparison of landslide triggering in different tectonic and climatic settings. J. Geophys. Research-Earth Surf. 115, F04040. doi:10.1029/2009jf001624
Tavakkoli Piralilou, S., Shahabi, H., Jarihani, B., Ghorbanzadeh, O., Blascheke, T., Gholamnia, K., et al. (2019). Landslide detection using multi-scale image segmentation and different machine learning models in the higher Himalayas. Remote Sens. 11, 2575. doi:10.3390/rs11212575
Teng, H., Ren, S., Jiang, D., and Yang, C. (2010). Experiment study of mechanincal properties of water-satuated weak shale in Gonghe Tunnel. Chin. J. Rock Mech. Eng. 29, 2657–2662.
Wadadar, S., and Mukhopadhyay, B. P. (2022). GIS-based landslide susceptibility zonation and comparative analysis using analytical hierarchy process and conventional weighting-based multivariate statistical methods in the Lachung River Basin, North Sikkim. Nat. Hazards 113, 1199–1236. doi:10.1007/s11069-022-05344-5
Wang, X., Guo, H., Ding, Z., and Wang, L. (2022a). Blind identification of active landslides in urban areas: A new set of comprehensive criteria. Environ. Sci. Pollut. Res. 9. doi:10.1007/s11356-022-22418-w
Wang, X., Zhang, X., Bi, J., Zhang, X., Deng, S., Liu, Z., et al. (2022b). Landslide susceptibility evaluation based on potential disaster identification and ensemble learning. Int. J. Environ. Res. Public Health 19, 14241. doi:10.3390/ijerph192114241
Wang, Y., Dong, J., Lu, Z., Zhang, L., Deng, S., Zhang, G., et al. (2022). Refined InSAR tropospheric delay correction for wide-area landslide identification and monitoring. Remote Sens. Environ. 275, 113013. doi:10.1016/j.rse.2022.113013
Wang, Z., Xu, J., Shi, X., Wang, J., Zhang, B., and Zhang, W. (2022). Landslide inventory in the downstream of the Niulanjiang river with ALOS PALSAR and Sentinel-1 datasets. Remote Sens. 14 (12), 2873. doi:10.3390/rs14122873
WDGEM Report (2012). Investigation report on geological hazards in Wanzhou District, chongqing city in 2012. Chongqing City, China: Wanzhou Department of Geological Environment Monitoring.
WDPNRB Program (2022). Geological hazard prevention and control program in Wanzhou District in 2022. Chongqing City, China: Wanzhou District Planning and Natural Resources Bureau.
Xie, Z., Chen, G., Men, X., Zhang, Y., Qiao, L., and Tan, L. (2017). A comparative study of landslide susceptibility mapping using weight of evidence, logistic regression and support vector machine and evaluated by SBAS-InSAR monitoring: Zhouqu to Wudu segment in Bailong River Basin, China. Environ. Earth Sci. 76, 313. doi:10.1007/s12665-017-6640-7
Xu, Q., Dong, X., and Li, W. (2019). Integrated space-air-ground early detection, monitoring and warning system for potential catastrophic geohazards. Geomatics Inf. Sci. Wuhan Univ. 44 (7), 957–966.
Xu, W., Xu, H., Chen, J., Kang, Y., Pu, Y., Ye, Y., et al. (2022). Combining numerical simulation and deep learning for landslide displacement prediction: An attempt to expand the deep learning dataset. Sustainability 14 (11), 6908. doi:10.3390/su14116908
Yin, K. (2007). Cause mechanism and prevention and control engineering for landslides in approximately horizontal strata in Wanzhou District, Three Gorges reservoir area. Wuhan City, China: China University of Geosciences Press. (in Chinese).
Zhang, C., Li, Z., Yu, C., Chen, B., Ding, M., Zhu, W., et al. (2022). An integrated framework for wide-area active landslide detection with InSAR observations and SAR pixel offsets. Landslides 19, 2905–2923. doi:10.1007/s10346-022-01954-z
Zhao, F., Meng, X., Zhang, Y., Chen, G., Sun, X., and Yue, D. (2019). Landslide susceptibility mapping of Karakorum highway combined with the application of SBAS-InSAR technology. Sensors 19, 2685. doi:10.3390/s19122685
Keywords: landslide susceptibility assessment, graph convolutional network, remote sensing, active landslide, slope movement
Citation: Wang X, Du A, Hu F, Liu Z, Zhang X, Wang L and Guo H (2023) Landslide susceptibility evaluation based on active deformation and graph convolutional network algorithm. Front. Earth Sci. 11:1132722. doi: 10.3389/feart.2023.1132722
Received: 27 December 2022; Accepted: 16 January 2023;
Published: 30 January 2023.
Edited by:
Omid Ghorbanzadeh, (IARAI), AustriaReviewed by:
Khabat Khosravi, Florida International University, United StatesCopyright © 2023 Wang, Du, Hu, Liu, Zhang, Wang and Guo. This is an open-access article distributed under the terms of the Creative Commons Attribution License (CC BY). The use, distribution or reproduction in other forums is permitted, provided the original author(s) and the copyright owner(s) are credited and that the original publication in this journal is cited, in accordance with accepted academic practice. No use, distribution or reproduction is permitted which does not comply with these terms.
*Correspondence: Xianmin Wang, eGlhbm1pbndhbmdAMTYzLmNvbQ==
Disclaimer: All claims expressed in this article are solely those of the authors and do not necessarily represent those of their affiliated organizations, or those of the publisher, the editors and the reviewers. Any product that may be evaluated in this article or claim that may be made by its manufacturer is not guaranteed or endorsed by the publisher.
Research integrity at Frontiers
Learn more about the work of our research integrity team to safeguard the quality of each article we publish.