 Yong Qiao
 Shaohua Li1
 Kangnan Yan
 Yinhui Zuo
- 1School of Geosciences, Yangtze University, Wuhan, Hubei, China
- 2China Renewable Energy Engineering Institute, Beijing, China
- 3State Key Laboratory of Oil and Gas Geology and Exploitation, Chengdu University of Technology, Chengdu, Sichuan, China
The carbonate rock karst thermal reservoir in the Niutuozhen geothermal field is a high-quality geothermal resource with significant development potential. However, due to the strong heterogeneity of karst thermal reservoirs, the connectivity between recharge and production wells is hard to determine, which seriously restricts the sustainable development of the Niutuozhen geothermal field. Therefore, this study revealed the hydraulic connection between the recharge and production well through the tracer test, quantitatively characterized the seepage characteristics of the reservoir combined with the numerical simulation, and proposed the deployment of the recharge well. The results show that the total recovery rate of the tracer is 0.42%, indicating that there are a small number of communication channels with a good hydraulic connection between the recharge and production well in the experimental area, and the recharge will not cause thermal breakthrough within a short time period. The velocity of recharge water can reach 359 m/d at the fastest, and the directions of dominant channels are concentrated in the NW, N, and E directions centered on the recharge well, this is consistent with the characteristics of regional fractures, recharge wells should be avoided to deployed in those directions. The results provide effective information for the prediction of the thermal breakthrough time and the accurate establishment of the thermal reservoir model in the Niutuozhen geothermal field, also provide a scientific basis for the sustainable utilization of the carbonate karst thermal reservoir geothermal resources.
1 Introduction
The development and utilization of geothermal energy have become an effective way to create a new type of smoke-free city, improve the urban atmospheric environment, save energy and reduce emissions (Lu, 2018). China is rich in middle-low temperature geothermal energy, which is mainly hydrothermal type (Cao et al., 2021; Zheng et al., 2022). Geothermal water is the main medium for exploiting geothermal energy. With the large-scale exploitation of geothermal water, the thermal reservoir pressure decreases greatly, resulting in a gradual increase in energy consumption (Wang et al., 2020; Li et al., 2021; Erol et al., 2022). Recharge technology can alleviate the decrease of the pressure of underground thermal reservoirs and the water level, and improve the utilization rate of geothermal resources, which has been widely used in the exploitation of geothermal resources (Chrysikopoulos, 1993; Aydin et al., 2018; Aydin and Akin, 2020).
Located in the central uplift area of the Jizhong Depression, Xiong’an New Area enjoys the best development and utilization conditions of geothermal resources in the central and eastern parts of China (He et al., 2018; Kuang et al., 2018; Zou et al., 2018). This is an extra-large geothermal accumulation system in the Bohai Bay Basin formed on the unique geological structure-thermal background of the North China Craton, which is closely related to the lithospheric thermal structure (Pang et al., 2020; Zuo et al., 2020). The geothermal field covers more than 80% of the New Area, and the Niutuozhen geothermal field is a demonstration area for the exploitation of middle-low temperature convective geothermal system in China (Li, 2018; Liu et al., 2022a). Its deep thermal reservoir type is carbonate rock karst fracture thermal reservoir, which has important characteristics such as large reserves, moderate burial depth, high temperature, excellent water quality, and easy recharge (Li et al., 2013; Wei, 2020; Zhao et al., 2021; Aydin et al., 2022). Although the Niutuozhen geothermal field recharges the condensed geothermal fluid into the thermal reservoir to overcome the reduction of thermal reservoir pressure and maintain the production capacity of the geothermal field. Affected by the development of fractures, karst caves and faults, the connectivity between production and recharge wells is hard to determine (Song et al., 2018; Suzuki et al., 2019; Yan et al., 2019; Liu et al., 2020b). Improper placement of recharge wells may cause cooling of the thermal reservoir, reduce the water temperature or output of production wells. To select and evaluate the quality of recharge wells, it is necessary to study and analyze the seepage characteristics of the recharge water, such as the migration direction, rate, and sweeping situation, which are directly related to the actual operation effect of hot water recharge (Su et al., 2018; Wang et al., 2018; Bender et al., 2020; Wang et al., 2021). The tracer test provides a very good way to quantitatively calculate the migration rate of the recharge water in the thermal reservoir and the hydraulic connection between the production and recharge wells, has been carried out in Japan and Iceland, countries with mature recharge and exploitation technology, which provides important basic parameters for the good deployment scheme of the geothermal field (Kaya et al., 2011; Xu et al., 2018; Wu et al., 2019; Pang et al., 2020; Dong et al., 2021; Wu et al., 2021).
Therefore, in this study, the indoor simulation and the field test were combined. The seepage laws such as the migration direction and rate of the recharged water in the study area were revealed through the tracer test data. Quantitative analysis of tracer recovery in the tracer test in the fractured matrix was made by numerical simulation. The dispersion characteristics, the connectivity between the recharge and production wells, and the thermal breakthrough in the influence area of the test well were determined. This study provides basic parameters for the prediction of thermal breakthrough time and accurate establishment of the thermal reservoir model in the Niutuozhen geothermal field, which has great theoretical and practical significance for protecting geothermal resources, ensuring the sustainable utilization of geothermal resources, prolonging the service life of geothermal fields and constructing environment-friendly society (Zhu et al., 2019).
2 Study area overview
2.1 Geological setting
The Xiong’an New Area, where the Niutuozhen geothermal field is located, is geologically located in the Jizhong Depression in the northwest of the Bohai Bay Basin in the central and eastern part of the North China (Du et al., 2019; Cui et al., 2022). The Xiong’an New Area includes important structural units such as the Niutuozhen uplift, the Rongcheng uplift, and the Gaoyang low uplift in the Jizhong Depression. The whole New Area is distributed in a triangular shape on the plane, with a total area of about 2,000 km2, surrounded by sags, Langgu Sag in the north, Xushui Sag and Baoding Sag in the west and southwest, Raoyang Sag and Baxian Sag in the southeast and east respectively (Figure 1) (Cui et al., 2019; Zhao et al., 2021). Located in the central bedrock uplift of Xiong’an New Area, Niutuozhen geothermal field consists of Niutuozhen uplift and Rongcheng Uplift, etc., with a NE trending distribution and a total area of about 1,500 km2.
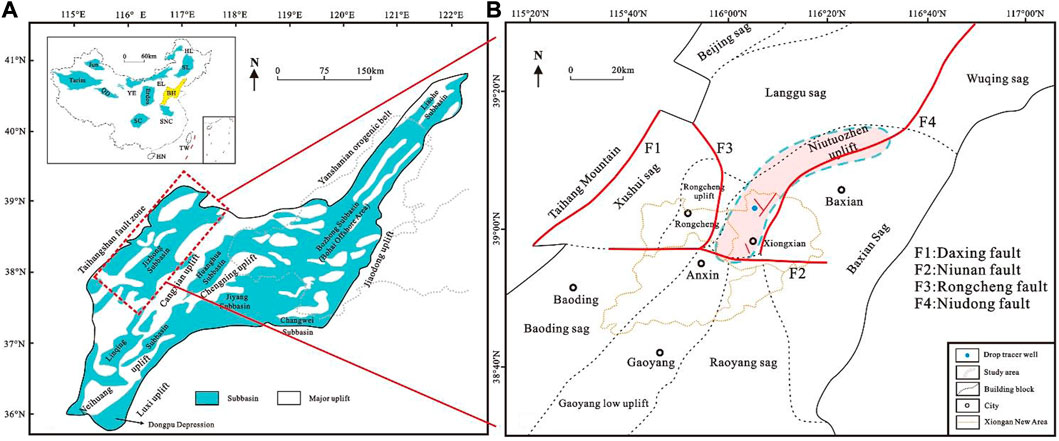
FIGURE 1. Regional tectonic setting of the Niutuozhen geothermal field. (A) Map showing the tectonic location and structural division of China and Bohai Bay Basin; (B) Structural division of the Xiong’an New Area and location of the Niutuozhen geothermal field. BH: Bohai Bay Basin; EL: Erlian Basin; HL: Hailaer Basin; HN: Hainan; Jun: Junggar Basin; QD: Qaidam Basin; SC: Sichuan Basin; SL: Songliao Basin; SNC: Southern part of North China Basin; TW: Taiwan and YE: Yingen-Ejinaqi Basin; (Jiang et al., 2021; Yan et al., 2019; Zhang, 2021).
The Bohai Bay Basin underwent tectonic transformation in the Mesozoic, during which the Niutuozhen uplift was developed. Under the influence of the Indosinian movement, the strata were extruded and uplifted, and the strata of the Lower Jurassic were deposited. In the late Yanshanian movement, under the influence of the North China Plate, the Middle Proterozoic strata were exposed and the Jurassic strata were denuded. In the Paleogene, the Alpine movement developed and the regional tectonic uplift was strengthened, which was also the main formation period of Niutuozhen Uplift. In the Neogene, the tectonic activity changed from tension to compression, and the fault activity weakened. Until the Quaternary, the basin has been dominated by depression, which is the main burial period of the Niutuozhen uplift, the fault no longer developed, and the stratum began to stably deposit.
The strata of the Xiong’an New Area have experienced a complex tectonic evolution process. The upper Cenozoic strata are affected by alternately developed uplifts and sags, showing drape-like deposits, and the Quaternary loose layers and Neogene loose layers show horizontal deposition, the Paleogene stratum dip is relatively gentle; the underlying strata include Cretaceous, Jurassic, Permian, Carboniferous, Ordovician, Cambrian, Qingbaikou, Jixian, Changcheng System, the basement is Archean metamorphic rock (Figure 2) (Pang et al., 2014; He et al., 2018). Among them, the karst thermal reservoir in the Wumishan Formation of the Jixian System is the most important thermal storage in the Niutuozhen geothermal field, which is characterized by wide distribution, large thickness, well-developed karst fractures, and good permeability (Field, 2016; Zhang, 2021).
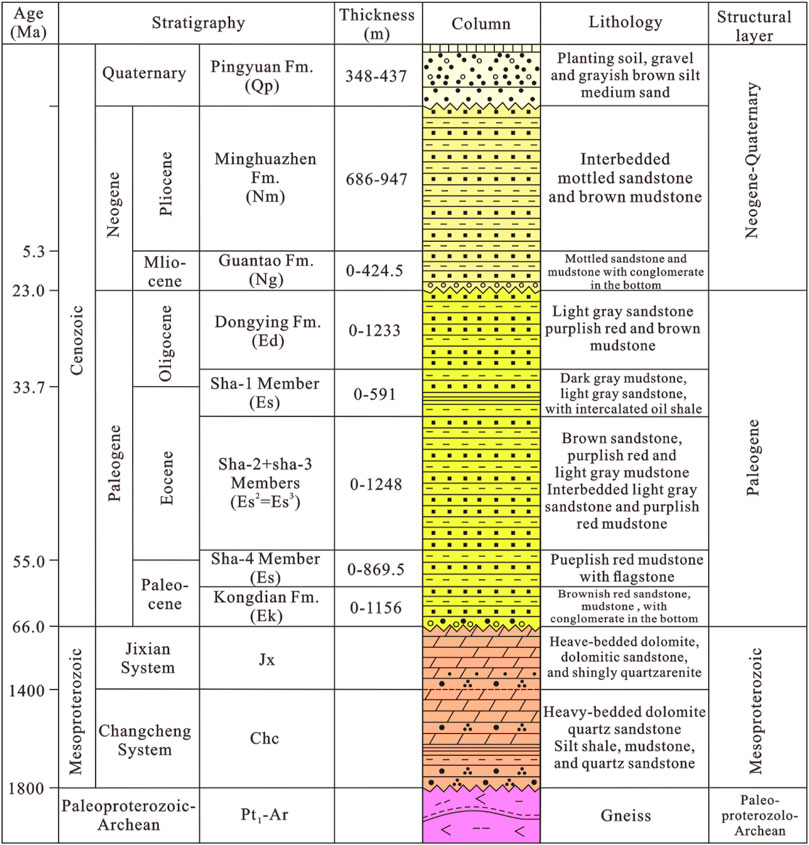
FIGURE 2. Generalized stratigraphic column of the Xiong’an New Area (modified from He et al., 2018).
The differential denudation at the top of Wumishan Formation is more severe in the east than in the west and in the south than in the north. During the period from the late Indosinian Movement to the Himalayan Movement, the strong tectonic action made the carbonate strata in the uplift area suffer from long-term weathering denudation and atmospheric precipitation leaching, forming a large number of dissolved pores, caves and fractures, with obvious weathering crust and unconformable contact with the overlying strata. Drilling records showed obvious blow-out and mud leakage. At this time, the development degree of karst is closely related to the paleo-submersible surface, stratigraphic interface and fault plane in the carbonate rocks. At the same time, magmatic activity is intense and accompanied by hydrothermal dissolution. The supergenetic karst formed at this time is the most conducive to reservoir construction, and the karst types mainly include weathering karst zone, fault karst zone and bedding karst zone (Xing et al., 2022).
The fault structures that have an important influence on Xiong’an New Area are mainly NE trending, followed by EW trending, NNE trending and NW trending, including Niudong fault, Rongcheng fault, Daxing fault and Niunan fault. Among them, the first three faults were formed in Yanshanian movement and intensified in the early Himalayan movement, which are long-term active faults. According to the regional geological data, it is believed that the NE trending fault changes from compressive to tensile. Due to the influence of the above faults, the Wumishan Formation thermal reservoir in the Jixian system in the study area mainly developed two stages of fracture system, in which the upper fracture tendency was mainly about 225° SW direction, and the strike was NW, which was basically similar to that of Niunan fault. The lower fracture has a trend of about 20° and strikes NE, which is similar to that of Rongcheng fault and Niudong fault (Wei et al., 2020; Zhang et al., 2022).
2.2 Geothermal resource conditions
Geothermal resource exploitation in Niutuozhen geothermal field is mainly concentrated in southern Xiongxian county. The total geothermal energy storage of Neogene, Paleogene thermal storage, and Jixian thermal storage shallower than 3,000 m in Xiongxian county is 194.23×10¹⁸ J, the total amount of geothermal water is 821.78×10⁸ m3, the geothermal energy stored in geothermal water is 116.42×10¹⁷ J. The thickness of the quaternary system is generally 400 m, and the average geothermal gradient is 4.57°C/100 m, and the highest is 12.61°C/100 m. The average geothermal gradient of the Neogene reservoir is 3.85°C/100 m and of the Jixian system reservoir is 1.21°C/100 m (Du et al., 2019).
As of 2018, Xiongxian county in Niutuozhen geothermal field has 49 production Wells and 33 recharge Wells in operation, with a ratio of 1.5:1. A total of 39 heat exchange stations were operated in the heating season of 2017-2018, exploiting about 4,842 m³/h of geothermal water and 4,503 m³/h of recharge. The recharge rate was about 93%, the average exploit water temperature was 68.2°C, and the recharge temperature was 37.5°C (Table 1). To further improve the recharge rate, production well temperature, and prolong the service life of the geothermal field, it is necessary to clarify the internal seepage condition of the geothermal reservoir.

TABLE 1. Operation data of Geothermal Tianxiong County, Niutuo Town, 2017-2018 heating season.
3 Methods and principles
The thermal reservoir karst and fissure of Wumishan Formation in Xiong’an New Area are widely developed, which leads to the strong heterogeneity of the reservoir, and the connectivity between production and irrigation wells is difficult to determine. The tracer technology can quantify migration parameters, describe reservoir fluid characteristics well, and predict the cooling of mining wells that may be caused by long-term recharge. It is the most intuitive technology method to study the connectivity between karst thermal reservoir wells. The basic process of geothermal recharge tracer technology is as follows: add appropriate tracers to the recharge wells of the recharge test well group, prepare samples in the surrounding observation wells according to the established sampling system, obtain the tracer content in the samples, draw out the observation well tracer production curves (the change curve of tracer production over time) (Wang et al., 2013; Yan et al., 2019; Song et al., 2020). By comprehensively analyzing the tracer production curve and related data of the test well group, the movement direction, estimated velocity, and sweeping situation of the injected fluid are obtained. Based on this, the hydraulic connection between a recharge well and one or several production wells is studied. Introduce numerical simulation to quantitatively study the geothermal reservoir seepage characteristics such as the fluid flow velocity in the hydrogeological system (Diaz et al., 2016; Wu et al., 2019; Wang et al., 2020; Erol et al., 2022).
3.1 Tracer test
The selection of an appropriate tracer is one of the keys to a successful tracer test. For geothermal recharge, tracers should meet the following requirements: 1) The thermal reservoir should generally not exist, or the concentration is stable and far below the expected concentration at the tracer monitoring site during the test; 2) The selected tracer should not react with or be adsorbed by reservoir rocks; 3) It should still have good stability at high temperature; 4) It should be cost-effective and environmentally benign; 5) It should be easy to place, sample and analyze. Therefore, sodium fluorescein was selected as the tracer in this study, and 50 kg of tracer was placed at one time (Ungemach, 2003; Kaya et al., 2011; Li et al., 2021; Wu et al., 2021).
On 30 January 2013, well WQHY 2 (recharge well) was selected as the tracer injection well, and another 10 production wells within 1 km around the recharge well were used as observation wells and tracer sampling wells for sampling and analysis (Figure 3). The thermal reservoir system was in a steady state during the tracer test. On 15 March 2013, the tracer test ended, and a total of 1,477 samples were taken.
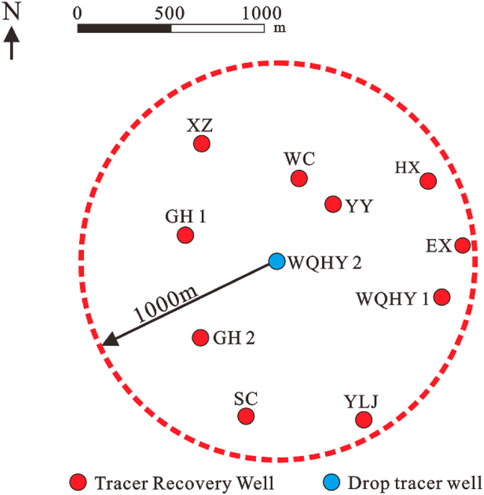
FIGURE 3. Schematic diagram of distribution of the tracer test recharge wells and sampling wells.
3.2 Numerical simulation
Geothermal recharge is carried out in the fissure thermal reservoir. Therefore, the direct channel connecting the recharge well and the mining well can be predicted according to the tracer test results, and the average velocity of recharge water movement can be calculated according to the peak time of the tracer concentration curve (Wang et al., 2018; Guo et al., 2019; Liu et al., 2019; Yue et al., 2019). In the tracer test of fractured thermal storage, we based on the following assumptions: 1) Recharge at a stable flow rate in one well, and produce at a stable flow rate in a nearby well; 2) Recharge water along a channel (such as a fracture zone) Flow from the recharge to the production well, and the flow in the channel is one-dimensional; 3) Ignoring the effect of molecular diffusion, a certain amount of tracer is put into the recharge well at one time, and a part of it goes to the production well along with the channel transport. Then the calculation equation of the tracer concentration at the fracture outlet is:
C, tracer concentration of recharge water at the fracture outlet (kg/m3); A, the cross-sectional area of the cracked passage (m2); φ, the porosity of fracture passage (dimensionless); Mr, tracer dose flowing into the fissure passage (kg); l, length of fissure passage between recharge well and mining well (m); D, dispersion coefficient (m2/s); u, the velocity of recharge water in the fissure (m/s); t, time (s).
Considering the material balance of the mining well, then:
q, recharge water flow to the crack channel (kg/s); c, the concentration of tracer in the production well (kg/m3); Q, the production amount of the mining well during the tracer test (kg/s).
In addition:
ρ, the density of recharge water (kg/m3).
Eq. 1 can be rewritten as:
If there are N channels connecting the two wells, the tracer concentration of the production well is:
Among them:
αL, the longitudinal dispersion degree of crack (m); qin, the recharge volume of the recharge well during the tracer test (kg/s); M, Total amount of tracer (kg); Mi, the tracer dose flowing through channel I (kg).
The software TRINV, developed by Axelsson, can be used to simulate tracer test data of multiple channels connecting production Wells and recharge Wells according to eqs 5–9 and has been applied in several geothermal fields in Iceland and other countries with satisfactory results (Wang et al., 2020). In this paper, the software TRINV is used to fit and analyze the recovery status of the tracer test in each receiving well.
4 Result
Among the 10 tracer receiving well samples, the recovery value of tracer concentration in wells NFC, SC, and YY was low, 0.02 ppb lower than the detection limit, so it was difficult to explain the recovery concentration of the tracer, because these Wells were exploited in small quantities and intermittently. In addition, it may be related to the closure of shallow aquifers by the three Wells. Tracers were recovered from the remaining seven sampling Wells, and the tracer recovery of well WQHY 1 at the representative receiving point was selected for analysis and interpretation (Figure 4).
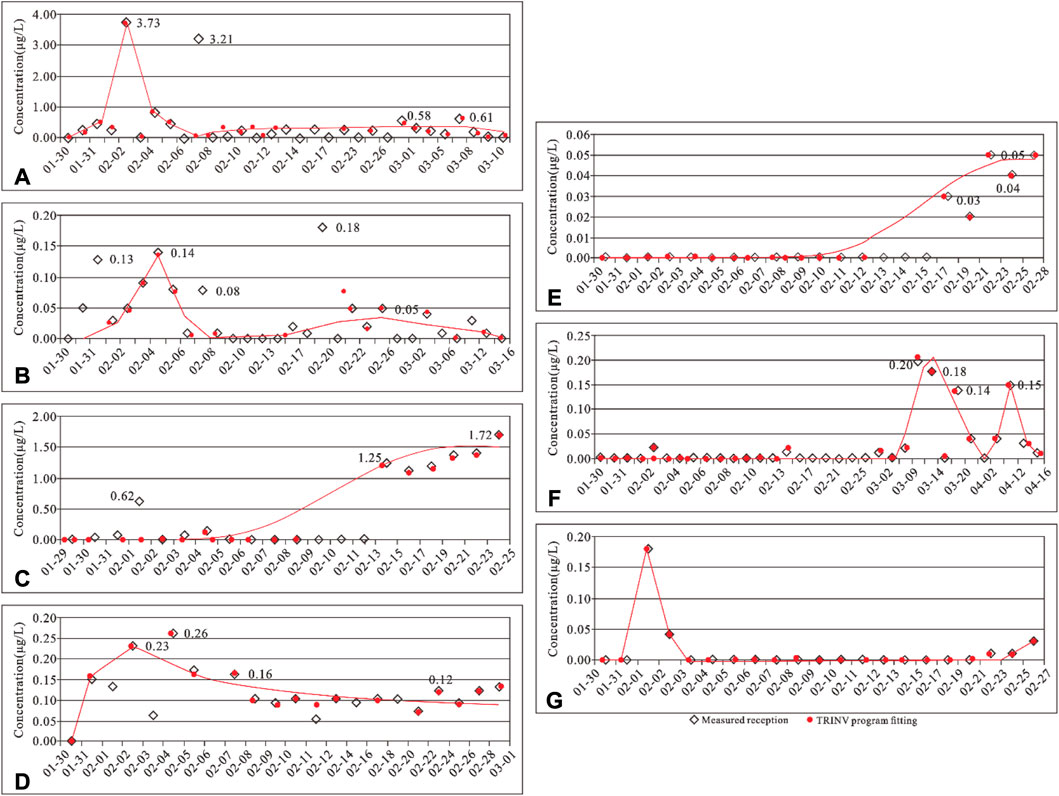
FIGURE 4. Comparison of the actual tracer concentration curve and the tracer concentration curve fitted by the software TRINV at the receiving point. (A) well WQHY 1; (B) well EX; (C) well GH 2; (D) well WC; (E) well HX; (F) well LJ; (G) well XZ.
The tracer breakthrough time at the receiving point of well WQHY 1 was about 3 days, the peak concentration was 3.73 μg/L, and the peak time was short. The tracer concentration dropped to 0.5 μg/L after 4 days and then showed a slightly lower peak. After the first week, due to the dispersion effect of tracer, the fissure thermal reservoir is not likely to have a sharp peak on the tracer recovery profile, but is more likely to have a relatively wide peak with a low peak concentration. And with the increase of time, the lower the peak value, the flatter the peak. To reasonably represent the decay in tracer concentration, the monitoring data affected by sorption needed to be corrected to remove sporadic concentration anomalies. The software TRINV was used to simulate the tracer test data from the well for a variety of scenarios, simulating different numbers of channels and channel lengths to obtain a better concentration fit curve, and the result of channel parameters are shown in Table 2.
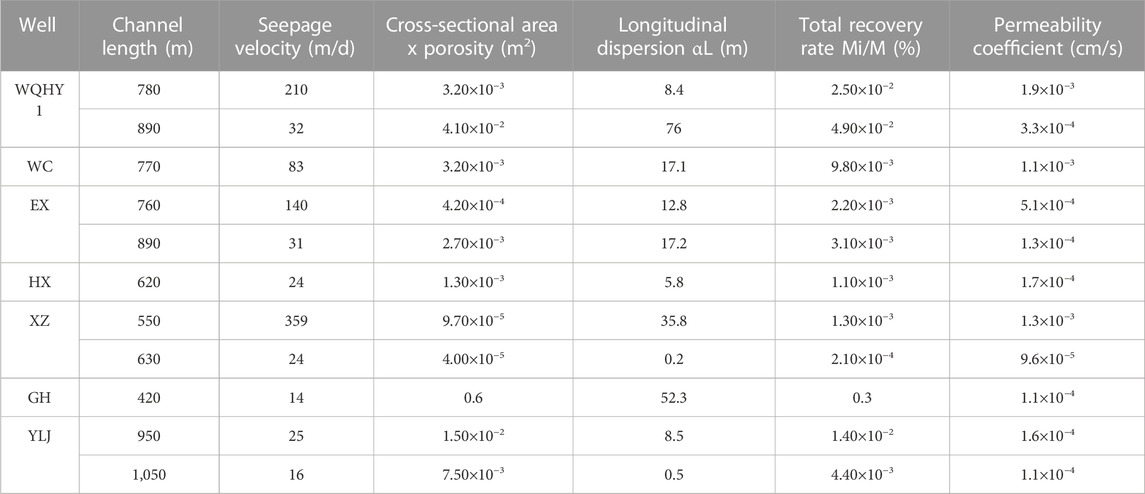
TABLE 2. Summary table of model parameters obtained from each receiving point in tracer test.
The straight-line distance between the wellhead of well WQHY 1 and the recharge well is 190 m, but well WQHY 1 is a directional well with a water level displacement of 530 m at the bottom of the well. According to the good formation report of the borehole and the interpretation of the temperature profile of the logged well, the simulation fit obtained is better when there are two hydraulic channels between the two wells with channel lengths of 750 m and 870 m respectively. The flow rate at the first appearance of the tracer is generally considered to be the maximum flow rate of the groundwater and the flow rate at the peak appearance is the average flow rate. The average flow rate was calculated to be 210 m/d for channel 1 and 31.7 m/d for channel 2 between the well WQHY 1 and the recharge well (Table 2). The product of channel cross-sectional area and porosity is very small. According to the logging interpretation report of well WQHY 1, 6% is taken as the average porosity of well WQHY 1 in the water supply section, so the cross-sectional area of channel 1 is 0.053 m2 and that of channel 2 is 0.683 m2. This indicates that the cross-sectional area of the good passage is very small, and the tracer dose flowing into well WQHY 1 through the fracture is very small. By 10 March 2013, the recovery rate of tracer was only 0.11%.
5 Discussion
The model parameters obtained for each receiving site of the tracer test are shown in Table 2. By 15 March 2013, the total recovery of tracer over the course of the 43-day test was 0.42%. On the one hand, this is due to the limited time period and the low amount of tracer recovery, and on the other hand, it also indicates that there are a limited number of connected channels with relatively good hydraulic connections between the receiving well sites in the experimental area, and that recharge will not cause large changes in production well temperatures in the short term.
The permeability coefficient, also known as the hydraulic conductivity coefficient, indicates the ability of the rock medium to conduct fluids. To quantitatively evaluate the medium permeability of non-homogeneous and anisotropic fractured rock in the test area, and to provide effective information for the accurate establishment of the thermal reservoir model, a simple solution for the permeability coefficient was carried out according to Darcy’s law. In the direction of groundwater flow on the groundwater iso-level map, the hydraulic gradient between two adjacent iso-level lines is obtained, and then the permeability coefficient of groundwater is calculated using the formula K=V/I, where: V is the seepage velocity of groundwater (m/d), K is permeability coefficient (m/d), I is hydraulic gradient. The permeability coefficients in Table 2 are calculated values. Compared with the permeability coefficients in the porous media, the permeability coefficients of the main permeability directions in different locations are several orders of magnitude higher, because of the strong connectivity of the fractured media channels.
When the longitudinal dispersion αL is small, the peak time of the tracer curve of the single strong water channel is inversely proportional to the average groundwater velocity. With the increase of longitudinal dispersion αL, hydrodynamic dispersion will delay the arrival of peak time, and the time of thermal breakthrough will increase accordingly. Therefore, the dispersion coefficient is one of the influencing factors in the prediction analysis of the decrease of thermal reservoir temperature that may be caused by long-term recharge. The numerical simulation results show that the longitudinal dispersion αL ranges from 0.2 m to 76 m, with an average of 21.3 m. The distribution range of permeability coefficient was 9.6×10⁻⁵∼1.9×10⁻³ cm/s.
To better understand the anisotropy of fracture development in the study area of the tracer test, the maximum seepage velocity in the tracer transport channel of this test was plotted by radar chart (Figure 5). The results show that the average tracer flow in the channel is 87.09 m/d, the maximum flow rate is 359 m/d, and the flow direction is NW direction centered on the recharge well. From the velocity radar chart of the fast passage at each receiving point, it can be seen that the dominant direction of the passage is concentrated in the NW, N, and E directions centered on the recharge well. The dominant direction of percolation velocity and recovery is inconsistent because the tracer diffuses more into the pores of the thermal reservoir rock due to hydrodynamic dispersion during the test.
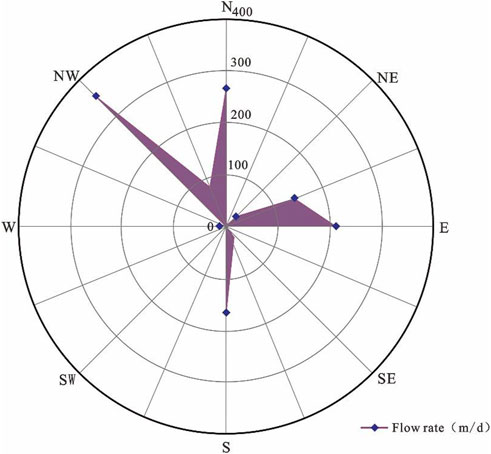
FIGURE 5. Statistical radar chart of the maximum velocity of the connected channel between each receiving well point in the tracer test area.
The research results on the origin and evolution of geothermal water show that the geothermal water flow direction in Niutuozhen geothermal field is NE-SW direction (Wang et al., 2016), which is consistent with the secondary flow direction of the tracer. On the other hand, the thermal reservoir of Wumishan Formation of Jixian System in the study area mainly developed two-stage fracture system, in which the upper fracture struck NW, while the lower fracture struck NE, which was consistent with the main flow direction of tracer. This indicates that the dominant migration direction of recharge water is mainly controlled by the fracture system, but less influenced by the flow direction of geothermal water in the geothermal field.
6 Conclusion
(1) In the 43-day recharge tracer test, the recovery rate of a single well with a tracer is up to 0.3%, and the total recovery rate is 0.42%, indicating that a relatively good hydraulic connection exists between the recharge and production wells in the experimental area, but on a limited scale, and that recharge will not cause large changes in production well temperatures in the short term.
(2) The maximum seepage velocity of tracer in the channel was 359 m/d, and the seepage velocity statistics radar chart showed that the dominant flow direction of recharge water was mainly NW, N, and E directions centered on the recharge well. To avoid the occurrence of immature thermal breakthrough, the placement of recharge Wells in the direction of good connectivity should be avoided.
(3) The main flow direction of the tracer is affected by the superposition of the flow direction of geothermal water in the geothermal field and the characteristics of regional fractures, of which the latter is more controlled.
Data availability statement
The original contributions presented in the study are included in the article/supplementary material, further inquiries can be directed to the corresponding author.
Author contributions
YQ: Data curation, validation, and writing—original draft. SL: Supervision, funding acquisition, and writing—review and editing. KY: Methodology, test, and writing—review and editing. YZ: Numerical simulation. TZ: Test. LT: Investigation. YS: Data curation.
Funding
This work was funded by the National Natural Science Foundation of China (Grant No. 42172172), the 2022 Open Fund of Key Laboratory of Tectonics and Petroleum Resources Ministry of Education, China (Grant No. TPR-2022-01), and Chengdu University of Technology Postgraduate Innovative Cultivation Program: Lithospheric thermal structure and geothermal resource effect in the Southern Sichuan Basin, China (CDUT2022BJCX003).
Acknowledgments
The authors would like to thank all of the people who participated in the studies.
Conflict of interest
The authors declare that the research was conducted in the absence of any commercial or financial relationships that could be construed as a potential conflict of interest.
Publisher’s note
All claims expressed in this article are solely those of the authors and do not necessarily represent those of their affiliated organizations, or those of the publisher, the editors and the reviewers. Any product that may be evaluated in this article, or claim that may be made by its manufacturer, is not guaranteed or endorsed by the publisher.
References
Aydin, H., and Akin, S. (2020). Analysis of a comprehensive tracer test in alaşehir geothermal field. Proceedings of the Turkey IV. Scientific and Technical Petroleum Congress, 18-20 November 2020, Ankara, Turkey.
Aydin, H., Akin, S., and Mustafa, S. (2018). Application of fluorescent micro particles as geothermal tracers. Proceedings of the 43rd Workshop on Geothermal Reservoir Engineering. February 12-14, 2018, California.
Aydin, H., Balaban, T. Ö., Bülbül, A., Merey, S., Tarcan, G., and Transfer, M. (2022). Determining the most representative reservoir model for the shallow depth salihli geothermal reservoir in Turkey using tracer test. Heat Mass Transf 58, 1105–1118. doi:10.1007/s00231-021-03166-y
Bender, J. T., Hawkins, A. J., Grooms, R. D., Schissel, C. J., and Tester, J. W. (2020). Heterogeneous hydrolysis of a thermally degrading tracer. Proc. Workshop Geotherm. Reserv. Eng. 45 (1), 202–210.
Cao, H., Wu, B., Long, Z., Wang, D., Huang, G., and Ma, X. (2021). Key technologies involved in karstic geothermal reservoir drilling in the beijing-tianjin-hebei region. Pet. Drill. Tech. 49 (2), 42–47. doi:10.11911/syztjs.2020105
Chrysikopoulos, C. V. (1993). Artificial tracers for geothermal reservoir studies. Environ. Geol. 22, 60–70. doi:10.1007/BF00775286
Cui, Y., Zhu, C., Qiu, N., Tang, B., Guo, S., and Lu, Z. (2022). The heat source origin of geothermal resources in xiong’an new area, north China, in view of the influence of igneous rocks. Front. Earth Sci. 10, 58. doi:10.3389/feart.2022.818129
Cui, Y., Zhu, C., Qiu, N., Tang, B., and Guo, S. (2019). Radioactive heat production and terrestrial heat flow in the xiong'an area, north China. ENERGIES 12 (24), 4608. doi:10.3390/en12244608
Diaz, A. R., Eylem, K., and Sadiq, J. Z. (2016). Reinjection in geothermal fields-A worldwide review update. Renew. Sustain. Energy Rev. 53, 105–162. doi:10.1016/j.rser.2015.07.151
Dong, Y., Huang, H., Ren, L., Li, H., Du, Z., E, J., et al. (2021). Geology and development of geothermal field in Neogene guantao Formation in norrthern Bohai Bay Basin: A case of the caofeidian geothermal heating project in tangshan, China. Adv. Pet. Explor. Dev. 48 (3), 666–676. doi:10.1016/S1876-3804(21)60063-0
Du, L., Zhao, L., Qiao, Y., Nie, F., and Liu, H. (2019). Study on the influence of fracture orientation and injection velocity on the micro seepage law of reinjection water in fracture geothermal reservior. Shandong Chem. Ind. 48 (20), 139–141. doi:10.19319/j.cnki.issn.1008-021x.2019.20.052
Erol, S., Bayer, P., Akın, T., and Akin, S. (2022). Advanced workflow for multi-well tracer test analysis in a geothermal reservoir. Geothermics 101, 102375. doi:10.1016/j.geothermics.2022.102375
Field, G. (2016). Heibei province. Urban Geol. 11 (3), 59–64. doi:10.3969/j.issn.1007-1903.2016.03.011
Guo, S., Zhu, C., Qiu, N., Tang, B., Cui, Y., Zhang, J., et al. (2019). Present geothermal characteristics and influencing factors in the xiong’an new area, north China. ENERGIES 12 (20), 3884. doi:10.3390/en12203884
He, D., Shan, S., Zhang, Y., Lu, R., Zhang, R., and Cui, Y. (2018). 3-D geologic architecture of Xiong’an New Area: Constraints from seismic reflection data. Sci. China Earth Sci. 61 (8), 1007–1022. doi:10.1007/s11430-017-9188-4
Jiang, S., Zuo, Y., Yang, M., and Feng, R. (2021). Reconstruction of the Cenozoic tectono-thermal history of the Dongpu Depression, Bohai Bay Basin, China: Constraints from apatite fission track and vitrinite reflectance data. J. Petrol. Sci. Eng. 205, 108809. doi:10.1016/j.petrol.2021.108809
Kaya, E., Zarrouk, S. J., and O'Sullivan, M. J. (2011). Reinjection in geothermal fields: A review of worldwide experience. Renew. Sust. ENERG Rev. 15, 47–68. doi:10.1016/j.rser.2010.07.032
Kuang, W., Yang, T., and Yan, F. (2018). Examining urban land-cover characteristics and ecological regulation during the construction of Xiong’an New District, Hebei Province, China. J. Geogr. 28 (1), 109–123. doi:10.1007/s11442-018-1462-4
Li, H., Wang, P., Liu, B., Zhang, X., Guo, S., Xiao, H., et al. (2021). Study on optimization of geothermal tail water reinjection process in moderately deep sandstone. Geofluids 2021, 1–9. doi:10.1155/2021/6617547
Li, J., Jia, Z., Zhang, F., Tian, G., Jin, B., and Liu, D. (2013). Research on the change and trend prediction of the water level of wumishan geothermal reservoir in jixian system, tianjin. Geosci. Res. Rep. 36 (3), 221–225. doi:10.3969/j.issn.1672-4135.2013.03.011
Li, K. (2018). Reaction to news in the Chinese stock market: A study on xiong’an new area strategy. J. Behav. Financ. 19, 36–38. doi:10.1016/j.jbef.2018.03.004
Liu, Y., Guo, L., Wang, Y., Liao, Y., and Zhao, G. (2022a). Numerical simulation and design optimization of large-scale geothermal production based on a multiwell layout in xianxian geothermal field. Lithosphere 2021 (5), 1–18. doi:10.2113/2022/2929551
Liu, Y., Huang, Z., Wang, Y., Wang, W., and Wang, J. (2022b). Thermo-hydro-mechanical coupling processes in carbonate geothermal reservoirs and their numerical simulation. Lithosphere 2021 (5), 9466388. doi:10.2113/2022/9466388
Liu, Y., Liu, G., Zhao, Z., and Zhao, Z. (2019). Theoretical model of geothermal tail water reinjection based on an equivalent flow channel model: A case study in xianxian, north China plain. Energy explor. 37 (2), 849–864. doi:10.1177/0144598718822401
Lu, S. (2018). A global review of enhanced geothermal system (EGS). Renew. Sust. ENERG Rev. 81, 2902–2921. doi:10.1016/j.rser.2017.06.097
Pang, J., Pang, Z., Kong, Y., and Wang, Y. (2014). Application of tracer experiment in connectivity study of karst heat storage Wells. Annu. Conf. China Earth Sci. Assoc. 453.
Pang, Z., Pang, J., Kong, Y., Guo, S., Wang, S., Huang, Y., et al. (2020). Identification method of large karst heat reservoir and large-scale sustainable mining technology. Innovation China 16 (3-4), 299–306. doi:10.11842/chips.20200516001
Song, C., Ke, L., Pan, H., Zhan, S., Liu, K., and Ma, R. (2018). Long-term surface water changes and driving cause in Xiong’an, China: From dense Landsat time series images and synthetic analysis. Sci. Bull. 63 (11), 708–716. doi:10.1016/j.scib.2018.05.002
Song, W., Liu, X., Zheng, T., and Yang, J. (2020). A review of recharge and clogging in sandstone aquifer. Geothermics 87, 101857. doi:10.1016/j.geothermics.2020.101857
Su, Y., Yang, F., Wang, B., Jia, Z., and Duan, Z. (2018). Reinjection of cooled water into sandstone geothermal reservoirs in China: A review. Geol. J. 22 (1), 199–207. doi:10.1007/s12303-017-0019-3
Suzuki, A., Ikhwanda, F., Yamaguchi, A., and Hashida, T. (2019). Estimations of fracture surface area using tracer and temperature data in geothermal fields. Geosciences 9 (10), 425. doi:10.3390/geosciences9100425
Ungemach, P. (2003). Reinjection of cooled geothermal brines into sandstone reservoirs. Geothermics 32 (4-6), 743–761. doi:10.1016/S0375-6505(03)00074-9
Wang, L., Zuo, L., and Zhu, C. (2020). Tracer test and streamline simulation for geothermal resources in cuona of tibet. Fluids 5 (3), 128. doi:10.3390/fluids5030128
Wang, S., Liu, J., Lin, P., Li, H., Yin, M., Pang, J., et al. (2013). Study on karst heat storage recharge experiment and tracer experiment. Q. J. Eng. Geol. 40 (6), 129–133. doi:10.16030/j.cnki.issn.1000-3665.2013.06.025
Wang, W., Wang, G., Liu, C., and Čypaitė, V. (2018). Modeling and prediction of tracer tests in dongli lake area in tianjin, China. J. Clean. Energy Technol. 6 (3), 209–212. doi:10.18178/jocet.2018.6.3.461
Wang, Y., Ding, W., Tian, Y., Wang, J., and Ding, R. (2016). Genetic analysis on high-temperature geothermal water in Niutuo geothermal field, Heibei Province. Urban Geol. 11 (3), 59–64.
Wang, Y., Liu, Y., Bian, K., Zhang, H., Wang, X., Zhang, H., et al. (2021). Influence of low temperature tail water reinjection on seepage and heat transfer of carbonate reservoirs. Energy explor. 39 (6), 2062–2079. doi:10.1177/01445987211020416
Wei, G. (2020). Study on the development regularity of karst thermal fracturecave reservoirs in Jixian System, Xiongan New Area. Sci. Manag. 8, 248–249.
Wu, H., Fu, P., Hawkins, A. J., Tang, H., and Morris, J. P. (2021). Predicting thermal performance of an enhanced geothermal system from tracer tests in a data assimilation framework. WRR 57 (12), 1–24. doi:10.1029/2021WR030987
Wu, H., Fu, P., Morris, J. P., Mattson, E. D., Hawkins, A. J., Zhang, Y., et al. (2019). Characterizing fracture flow in EGS Collab experiment based on stochastic modeling of tracer recovery. 44th Workshop Geotherm. Reserv. Eng. 44 (2), 1452–1459.
Xing, Y., Yu, H., Liu, Z., Li, J., Liu, S., Han, S., et al. (2022). Study on chemical genesis of deep geothermal fluid in Gaoyang geothermal field. Front. Earth Sci. 9, 1321. doi:10.3389/feart.2021.787222
Xu, H., Shi, T., Wang, M., Fang, C., and Lin, Z. (2018). Predicting effect of forthcoming population growth–induced impervious surface increase on regional thermal environment: Xiong'an New Area, North China. Build. Environ. 136, 98–106. doi:10.1016/j.buildenv.2018.03.035
Yan, K., Zuo, Y., Yang, M., Zhou, Y., Zhang, Y., Wang, C., et al. (2019). Kerogen pyrolysis experiment and hydrocarbon generation kinetics in the Dongpu depression, Bohai Bay Basin, China. Energy fuels. 33 (9), 8511–8521. doi:10.1021/acs.energyfuels.9b02159
Yue, G., Wang, G., Ma, F., Zhang, W., and Yang, Z. (2019). The thermal state and geothermal energy accumulation mechanism in the Xiong’an New Area, China. Energy explor. 37 (3), 1039–1052. doi:10.1177/0144598719840741
Zhang, B., Wang, S., Kang, F., Li, Y., Zhuo, L., Gao, J., et al. (2022). Flow path of the carbonate geothermal water in xiong’an new area, north China: Constraints from 14C dating and H-O isotopes. Front. Earth Sci. 10, 782273. doi:10.3389/feart.2022.782273
Zhang, H. (2021). Development and application of geothermal resources in xiong'an new area. Energy Environ. Sci. 3, 147–148. doi:10.3969/j.issn.2096-4137.2021.03.066
Zhao, Z., Dou, Z., Liu, G., Chen, S., and Tan, X. (2021). Equivalent flow channel model for doublets in heterogeneous porous geothermal reservoirs. Renew. Energy 172, 100–111. doi:10.1016/j.renene.2021.03.024
Zheng, Z., Zuo, Y., Wen, H., Zhang, J., Zhou, G., Xu, L., et al. (2022). Natural gas characteristics and gas-source comparisons of the lower triassic jialingjiang formation, eastern Sichuan Basin. J. Pet. Sci. Eng. 221, 111165. (In press). doi:10.1016/j.petrol.2022.111165
Zhu, M., Wang, S., Kong, X., Zheng, W., Feng, W., Zhang, X., et al. (2019). Interaction of surface water and groundwater influenced by groundwater over-extraction, waste water discharge and water transfer in Xiong’an New Area, China. Water 11 (3), 539. doi:10.3390/w11030539
Zou, Y., and Zhao, W. (2018). Making a new area in xiong’an: Incentives and challenges of China’s “millennium plan”. Geoforum 88, 45–48. doi:10.1016/j.geoforum.2017.11.007
Keywords: tracer test, numerical simulation, seepage characteristic, Niutuozhen geothermal field, sustainable utilization
Citation: Qiao Y, Li S, Yan K, Zuo Y, Zhang T, Tian L and Sun Y (2023) Karst thermal reservoir tracer test and seepage characteristics analysis in Niutuozhen geothermal field in Xiong’an New Area. Front. Earth Sci. 11:1132095. doi: 10.3389/feart.2023.1132095
Received: 26 December 2022; Accepted: 22 February 2023;
Published: 02 March 2023.
Edited by:
Ali Abedini, Urmia University, IranReviewed by:
Chuanqing Zhu, China University of Petroleum, Beijing, ChinaGaofan Yue, Chinese Academy of Geological Sciences, China
Copyright © 2023 Qiao, Li, Yan, Zuo, Zhang, Tian and Sun. This is an open-access article distributed under the terms of the Creative Commons Attribution License (CC BY). The use, distribution or reproduction in other forums is permitted, provided the original author(s) and the copyright owner(s) are credited and that the original publication in this journal is cited, in accordance with accepted academic practice. No use, distribution or reproduction is permitted which does not comply with these terms.
*Correspondence: Yong Qiao, 18982695663@163.com