 Min Ma
 Liancun Xiu1
- 1Chinese Academy of Geological Sciences, Beijing, China
- 2School of Earth Sciences and Resources, China University of Geosciences, Beijing, China
- 3Hohhot General Survey of Natural Resources Center, China Geological Survey, Hohhot, China
Reduction of aeromagnetic noise and extraction of mineralization-related residual anomalies are critical for aeromagnetic data processing in mineral exploration. This study introduced a multifractal singular value decomposition (MSVD) method to remove the noise and improved the bi-dimensional empirical mode decomposition (BEMD) algorithm to extract residual magnetic anomalies. It is shown that MSVD and improved BEMD could effectively reduce the noise and extract residual magnetic anomalies. Then, a wavenumber–domain iterative approach is applied in 3D imaging of magnetic anomalies and gradients with depth constraints, which is a rapid tool for qualitative and quantitative interpretation of magnetic data and is suitable for rapidly imaging large-scale data. The 3D inversion result is verified by four geological sections along the regional tectonic directions and some drilling holes on the deposits. It is revealed that this proposed approach is practical and effective in dealing with aeromagnetic data interpretation and inversion for mineral exploration.
1 Introduction
Aeromagnetic exploration is a powerful and fast, convenient and economical technique enabling the delineation of geological structures and exploration of mineral resources. It has been applied in the exploration of geotectonics, faults, igneous rocks, craters, magnetic-related polymetallic deposits, and extraction of hydrothermal alterations (Muundjua et al., 2007; Ortiz-Alemán and Urrutia-Fucugauchi, 2010; Gao et al., 2016; Elkhateeb and Abdellatif, 2018; Sridhar et al., 2018; Eldosouky et al., 2020; Shebl et al., 2021; Xiong, 2021; Bencharef et al., 2022; Ekpe et al., 2022; ElGalladi et al., 2022; Mahdi et al., 2022; Mamouch et al., 2023). Hereinto, two factors have to be taken into account before interpretation or inversion.
The first one is the noise in the aeromagnetic data, which is usually random or fringe-pattern alike. The noise could be generated not only by the ground objects such as the power transmission lines and transmission substations but also by the ferromagnet in the aircraft itself. In addition, the differences between the aircraft airlines and the processing of reduction to the magnetic pole could also cause fringe-pattern noise aligned along the declination direction (Li and Nabighian, 2015). The noise is usually very small in quantity but will make the aeromagnetic data artificial and aliasing (Ma et al., 2019). The commonly used denoising methods are mainly focused on low-pass filter algorithms like moving average (Liu et al., 2015), Wiener filter (Lee and Lee, 2021), maximum likelihood filter (Bouhrara et al., 2019), and wavelet transform (Lin et al., 2022). The method of upward continuation to a certain height (Zhu and Lu, 2021; Tazi et al., 2022; Zhu et al., 2022) could also suppress the noise to some extent while enhancing the deep anomalies. However, the drawback of a low-pass filter is that it will filter out some useful high-frequency information while denoising. Fortunately, the method of MSVD (multiscale or multi-fractal singular value decomposition) is especially sensitive to noise and is practical in denoising when the noise level is low (Di Pietro Paolo et al., 2006; Little et al., 2017). It could decompose the aeromagnetic data into a series of singular values from high to low frequencies, in which the high-frequency noise could be separated by selecting the corresponding singular values and usually without filtering out the useful high-frequency information. The second one is anomaly separation or extraction of residual anomalies. Separation of regional and residual aeromagnetic anomalies is considered very essential before any qualitative and quantitative interpretation process. The reason is that the observed aeromagnetic anomalies represent the combined effects of sources under different depth, density, or magnetic variation, especially for metallic deposits (Abdelrahman and Sharafeldin, 1996; Al-Rahim, 2016; Zahra and Nakhla, 2016). What really needs to be inversed is the mineralization-targeted or residual anomalies after removing the regional (background) anomalies and the neighboring interferences. There are some filtering techniques that have been applied to deal with this regional–residual separation issue, such as graphical separation (Gupta and Ramani, 1980), radial power spectrum analysis (Zahra and Nakhla, 2016; Elkhateeb and Abdellatif, 2018), match filter (Spector and Grant, 1970), preferential filtering method (Guo et al., 2013), polynomial fitting (Martínez-Moreno et al., 2015; Gabtni and Jallouli, 2017; Innocent et al., 2019), fast Fourier transform (Saada et al., 2022), and upward continuation (Eldosouky et al., 2022). However, there are no unique and absolute solutions for regional–residual anomaly separation. Some of the separation techniques are not suitable for handling data characterized by both the non-linear and non-stationary nature (Mandal and Niyogi, 2018). All separation techniques hypothesize about source distribution. The general assumption is that the observed field is the sum of the effect of shallow and deep sources (Keating and Pinet, 2011). Fortunately, BEMD (bi-dimensional empirical mode decomposition) is an additive, independent, and self-adaptive algorithm that could exactly separate the anomalies into different components from the high-pass to the low-pass, showing the anomalies from the local to the regional scale. The best factor of all is that the original magnetic field is the summation of the decomposed components called BIMFs (bi-dimensional intrinsic mode functions). Some improvements of this algorithm are made in this study by ordinary kriging interpolation and self-adaptive sifting process to overcome its mode mixing problem. After removing the noise and regional anomalies, the mineralization-related residual anomalies could be embodied for 3D inversion. The Euler deconvolution method, tilt depth method, and 3D inversion by Geosoft’s VOXI Earth Modeling are commonly used methods in tracing the position and depth of the origins of magnetic anomalies and estimating the 3D magnetic susceptibility distribution (Eldosouky et al., 2021; Kharbish et al., 2022). In this study, a method of wavenumber-domain iterative approach for 3D imaging of magnetic anomalies and gradients with depth constraints is applied for 3D inversion, which is especially suitable for rapidly imaging large-scale data and for showing the 3D magnetic susceptibility distribution volumetrically (Cui and Guo, 2019).
The paper is organized as follows: Section 1 introduces the approach. Section 2 explains the principles of MSVD and improvements of BEMD and makes a brief introduction of MagFInv3D for inversion. Section 3 applies the approach to denoising, regional–residual anomaly separation, and 3D inversion and delineates the results. Section 4 validates the result by verification of four geology sections that are regional faults along the tectonic directions and by revelation of some drilling holes, and compares the proposed MSVD-BEMD-MagFInv3D approach and directly applying MagFInv3D for inversion without removing the noise and the regional anomalies. At last, Section 5 gives some conclusions. The algorithms are programmed by MATLAB 2022b.
2 Methodology
2.1 Denoising by multifractal singular value decomposition (MSVD)
The aeromagnetic data A can be decomposed into a unitary matrix U, a diagonal matrix S with σi=
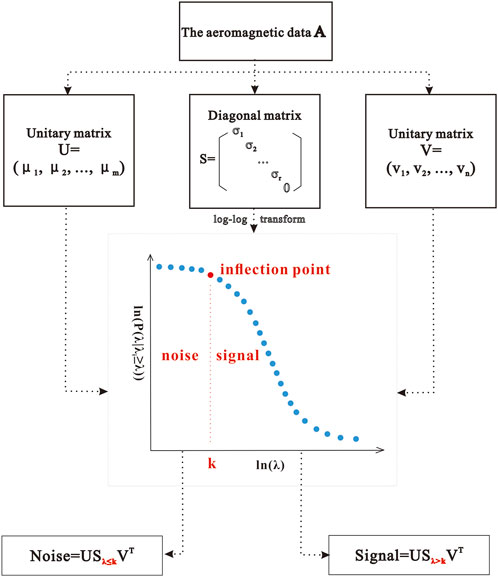
FIGURE 1. Flow chart of MSVD.
2.2 Improved bi-dimensional empirical mode decomposition (improved BEMD)
The BEMD algorithm is an additive, orthogonal, self-adaptive, and multiscale decomposition method that could separate the aeromagnetic fields into different components from high to low frequencies. It has already widely been used in geochemical and geophysical anomaly mapping for these advantages (Chen et al., 2019; Zhang et al., 2020). Regional anomalies characterize geological backgrounds, and local anomalies characterize geological anomalies. As a matter of fact, some specific BIMF components that represent geological anomalies could be chosen to interpret geological features (Huang et al., 2010; Hou et al., 2012; Xu et al., 2016; Zhao et al., 2016). However, during the decomposition process, there is usually a mode mixing problem that is multifactor-induced (i.e., the noise in the data, interpolation method, and sifting process). For this reason, the improvements are made by ordinary kriging interpolation and self-adaptive sifting processes (Ma et al., 2019). The improvement by ordinary kriging interpolation could make the BEMD algorithm converge in the decomposition process whether the original data are linear or non-linear because there are no outliers interpolated by ordinary kriging. However, other interpolation methods like RBF (radial basis function) and polynomial regression may generate outliers while interpolating in some cases. It is especially distinct while extrapolation and that may induce the mode mixing problem, and the algorithm cannot converge in this way. The improvement of the sifting process is on the condition that when the number of extrema is less than 4 or the upper–lower envelopes are colinear, then all BIMFs and a Residue are screened out. The mode mixing and excessive or incomplete decomposition could also be restrained in this way. The schematic diagram of the improved BEMD algorithm is shown in Figure 2. The aeromagnetic data set A is divided into some BIMFs and a Residue (Eq. 2), which could be grouped into a high-pass (FHP), a band-pass (FBP), and a low-pass (FLP) filter (Eq. 3–5). A is the summation of these filters that are independent of one another.
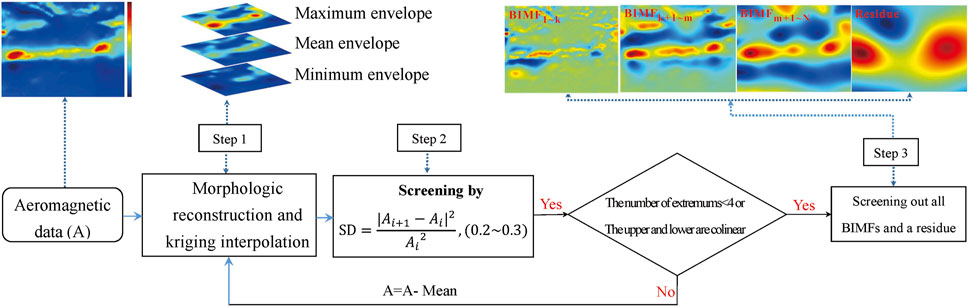
FIGURE 2. Schematic diagram of the improved BEMD algorithm.
2.3 3D inversion by MagFInv3D
MagFInv3D is a package programmed by MATLAB, a wavenumber–domain iterative approach for 3D imaging of magnetic anomalies and gradients with depth constraints, proposed by Cui and Guo in 2019, which could be downloaded from https://github.com/earthman131/MagFInv3D. The method is especially suitable and applicable for rapidly imaging large-scale or regionally large-area-covered data. First, supposing that the underground 3D magnetic field is composed of many horizontal layers from the top to bottom, the magnetic multi-parameters (including the total magnetic anomaly, three magnetic components, magnetic gradients, and magnetic full-tensor gradients) of each horizontal layer could be calculated by applying 2D fast Fourier transform (FFT). Second, a depth-scale factor and interface constraint are applied to enhance the depth resolution. At last, the imaging accuracy is improved by iteration when the error measured by the root mean square between the inversed theoretical magnetic data
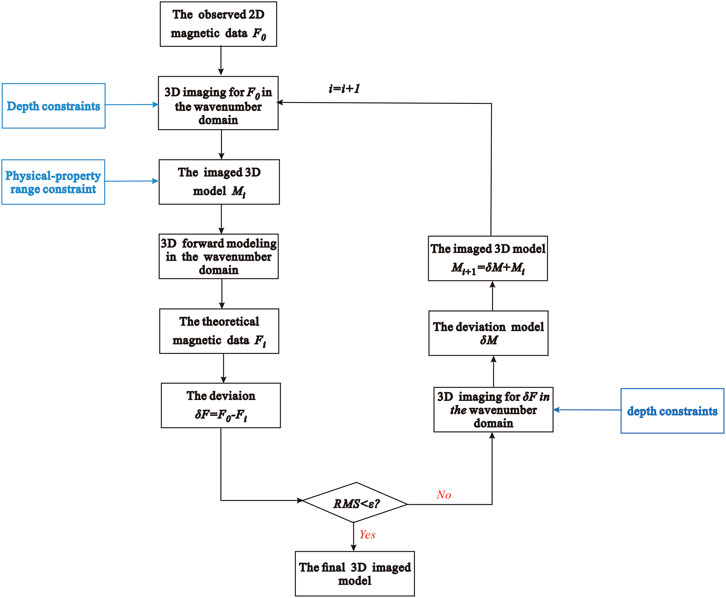
FIGURE 3. Flowchart of wave number–domain iterative approach (Cui and Gao, 2019).
3 Application and results
3.1 The study area and aeromagnetic data
The study area is in a polymetallic ore field in Inner Mongolia, northwest China, longitude [101°0′E, 101°30′E] and latitude [39°20′N, 39°40′N]. The aeromagnetic data are surveyed at a scale of 1:50,000 and processed by reduction to the magnetic pole via standardized polar transform with a declination value of −1.81° and an inclination value of 59.48°, which is shown in Figure 4 of the aeromagnetic map of the study area. Four geological sections are made along the geotectonic directions in Figure 5 of the geological mapping of the study area to interpret the magnetic anomalies and are investigated at the field to delineate their geological and mineralization characteristics.

FIGURE 4. Aeromagnetic map after reduction to pole of the study area.
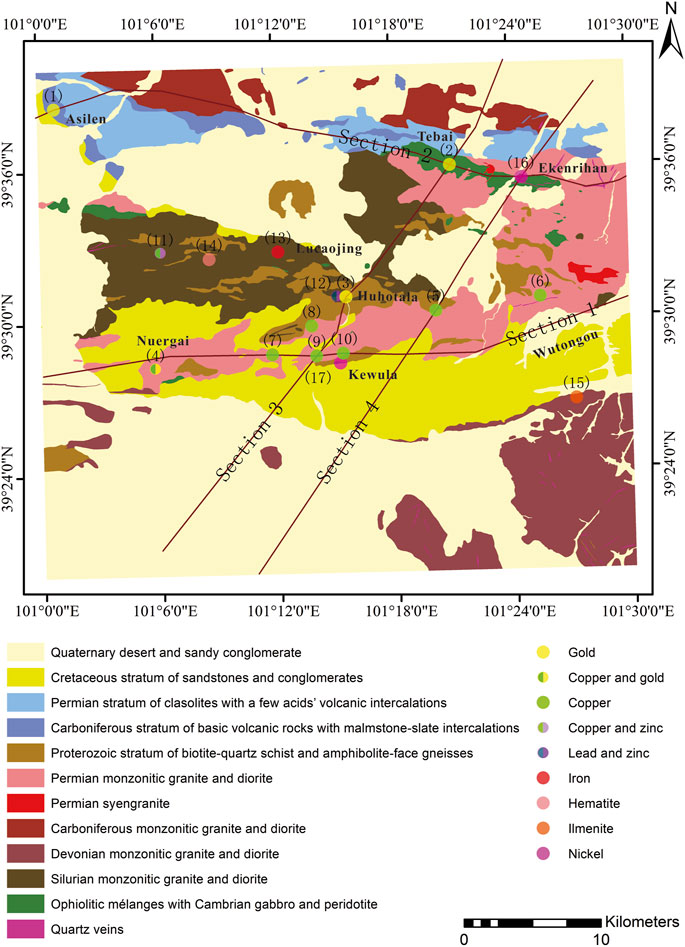
FIGURE 5. Geological mapping of the study area.
The anomalies in the study area are mainly distributed along the Nuergai–Kewula–Wutongou reverse fault along Section 1, northeast-oriented and inclined to north about 60°, which are closely related to the outcropped geological bodies along this fault (including the Proterozoic stratum that consists of biotite–quartz schist and amphibolite face gneisses, Silurian and Permian quartz diorite, and Cambrian gabbro and serpentinized peridotite). The magnetic intensity along this fault is between 50 nT and 500 nT, along which two regions with anomalies in the east and west of it could reach more than 820 nT.
Another aeromagnetic anomaly region is along the fault of Section 2, and the anomalies are closely related to the outcropped Carboniferous stratum that is mainly composed of basic volcanic rocks in a mid-oceanic-ridge volcanic environment, the Permian stratum that is composed of a set of clasolites with a few acids’ volcanic intercalations, Carboniferous–Permian quartz diorite, and Cambrian gabbro and serpentinized peridotite. The magnetic intensity along this fault is between 100 nT and 300 nT. Forty-five samples are collected along Section 1 and Section 2 from the peridotites to measure their magnetism, and the magnetic susceptibility of these peridotite rocks could reach 4500 SI. Meanwhile, the regions in the southwest and north of the study area are covered by the Cretaceous stratum, which is a set of sandstones and conglomerates, and the Quaternary stratum, which is a set of migratory dunes and flood alluvial layers, are characteristic of low magnetism. The magnetic intensity in these regions is between −50 nT and −200 nT. Therefore, it is apparent that there is a magnetic interface in the deep region of the underground, and the high anomalies are mainly from the deep peridotite crystalline basement. It could also be inferred that the deep peridotite crystalline basement provided resources for the deposits listed in Table 1 in the study area, and these regional faults created a good environment for their formation. Most of the deposits along Section 1 are tectonic–hydrothermal-related, while the deposits along Section 2 are mainly tectonic-controlled. A tectonic–volcanogenic gold deposit in Asilen, a post-magmatic hydrothermal alteration-related gold deposit in Tebai, and a magmatic-liquated nickel deposit in Ekenrihan are located along Section 2. The structured fracture zones with mylonites could be commonly seen along Section 1 and Section 2, especially around the gold deposits. Both Section 3 and Section 4 partially pass through Section 1 and Section 2 to show regional geotectonic characteristics and verify the inversed deep magnetic anomalies. Some drilling holes are set on these deposits for the discovery of mineralization and the verification of deep magnetic anomalies.
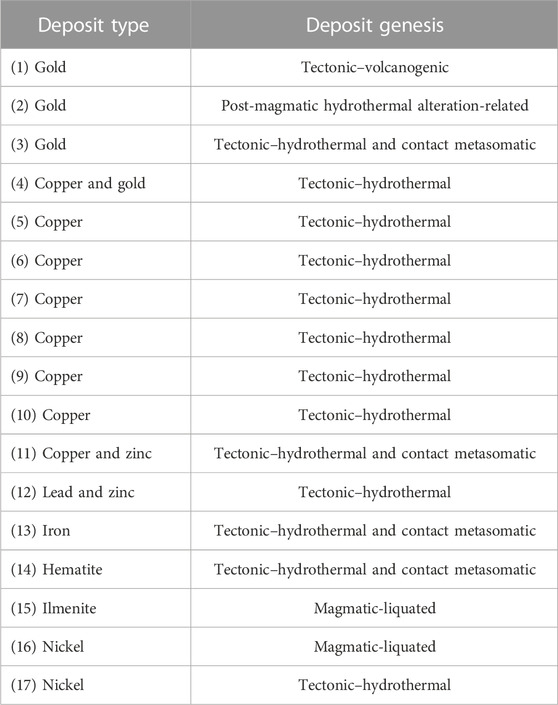
TABLE 1. Mineral deposits in the study area.
3.2 Aeromagnetic denoising by MSVD
In this study, it is found that the value of aeromagnetic noise is often very low, which is usually concealed and hard to detect visually. However, it can be extracted by MSVD due to its sensitivity to weak noise. As is shown in Figure 6A of aeromagnetic noise detection by MSVD, the eigenvalues are automatically fitted into six straight lines by the weighted least square method in log–log coordination according to the turning points that can make the fitting errors of all lines reach minimum synchronously. Every straight line means some kind of noise or signal, of which the noise is reconstructed by the first and second lines, where the turning points are −7.23 and −0.84, as shown in Figure 6A. The detected noise by MSVD is visualized in Figures 6B,C. It is mainly fringe and random noise distributed in the south of the study area. The percent measured by the variance of such useless noise is just about 0.03%, but it induces the mode mixing problem, which has to be taken into consideration, especially when the percent of the fringe and random noise is high. In addition, it will also affect the accuracy of 3D inversion. Therefore, it is removed by subtracting it from the aeromagnetic data.
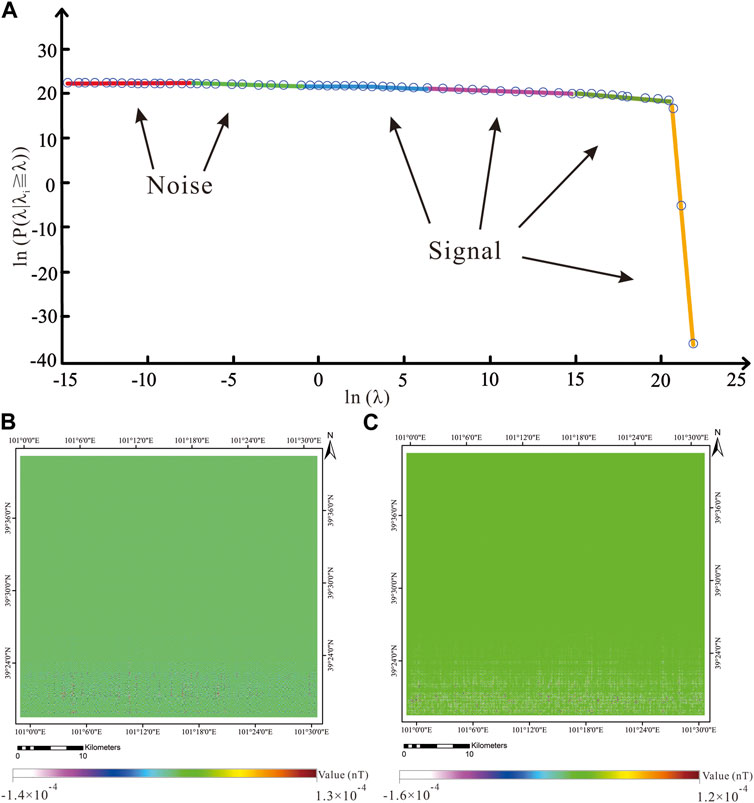
FIGURE 6. Aeromagnetic noise detection by MSVD. (A) Log–log transform of the singular values of the aeromagnetic data. (B) Noise component of the first line. (C) Noise component of the second line.
3.3 Residual anomalies extraction by improved BEMD
The parameter of SD and the termination condition of the error to measure colinearity is set as 0.3 and 0.0001, respectively. The decomposed results obtained by improved BEMD are shown in Figure 7, in which BIMF 1 in Figure 7A is a high-pass filter. The anomalies that are string–bead alike in BIMF 1 indicate the shallow–subsurface magnetism where regional faults and the tectonic–hydrothermal polymetallic deposits are often distributed along them. BIMF 2 in Figure 7B is a band-pass filter that shows the deeper or mantle-crustal anomalies, in which the deposits are distributed along two ore-prospecting directions. The first one is along the Asilen–Tebai reverse fault and is associated with the subduction movement where the anomalies are induced by Carboniferous basic volcanic rocks of a mid-oceanic ridge and Carboniferous–Permian magnetic quartz diorites. The second one is along the Nuergai–Kewula–Wutongou reverse fault, which is strictly associated with tectonic–hydrothermal and contact-metasomatic deposits that were mainly formed between late Carboniferous and early Permian. There is also a famous big magnetite iron deposit named Kexiutata of skarn type on the east of this belt outside of this study area at a distance of about 10 km, which is within the intersection between Asilen–Tebai reverse fault and Nuergai–Kewula–Wutongou reverse fault, and was formed in the early Permian. Therefore, BIMF 1 and BIMF 2 are the local target anomalies we need. BIMF 3 in Figure 7C and Residue in Figure 7D are low-pass filters that show the deep mantle crystalline basement. The sum of BIMF 3 and Residue could be taken as regional anomalies to be subtracted from the denoised aeromagnetic data. Meanwhile, the residual anomalies could be extracted for 3D inversion.
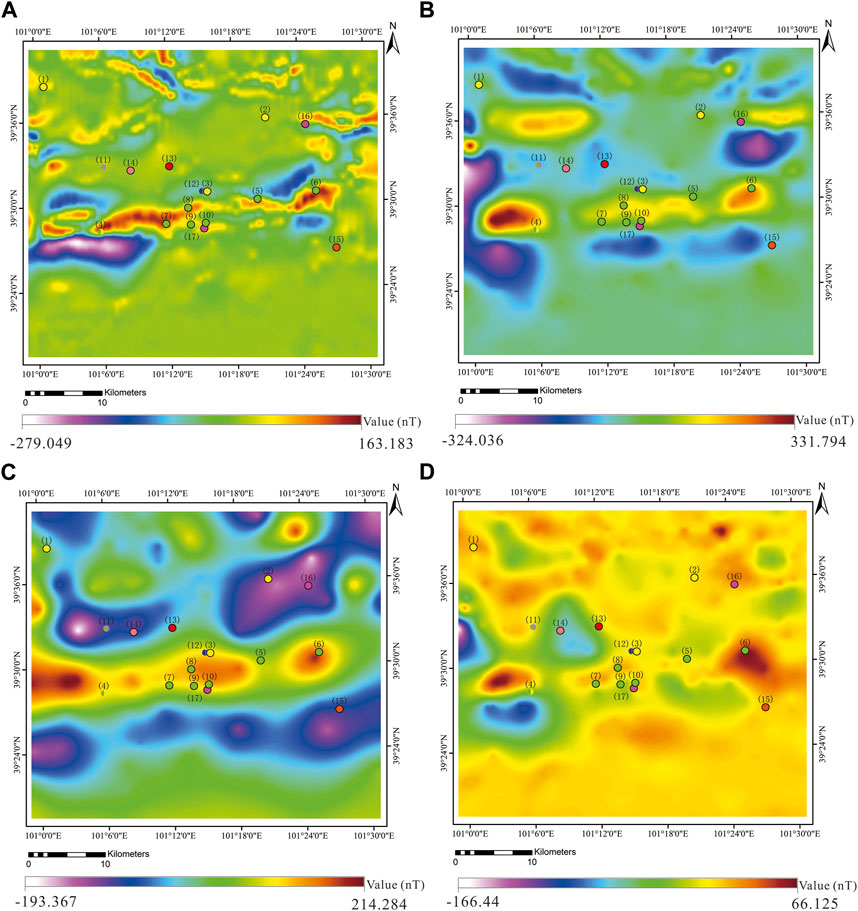
FIGURE 7. Components obtained by improved BEMD. (A) BIMF I, (B) BIMF 2, (C) BIMF 3, and (D) residue.
3.4 3D inversion by MagFInv3D
A wavenumber-domain iterative 3D imaging method with MagFInv3D is applied to inverse the local target magnetic anomalies for interpretation and mineral exploration. The parameter of iteration is set as five times, and the inversion depth is set as 10 km and 2 km to show the deep magnetic characteristics of different depths. The inversed 3D cube of the residual anomalies after MSVD denoising is shown in Figure 8A.
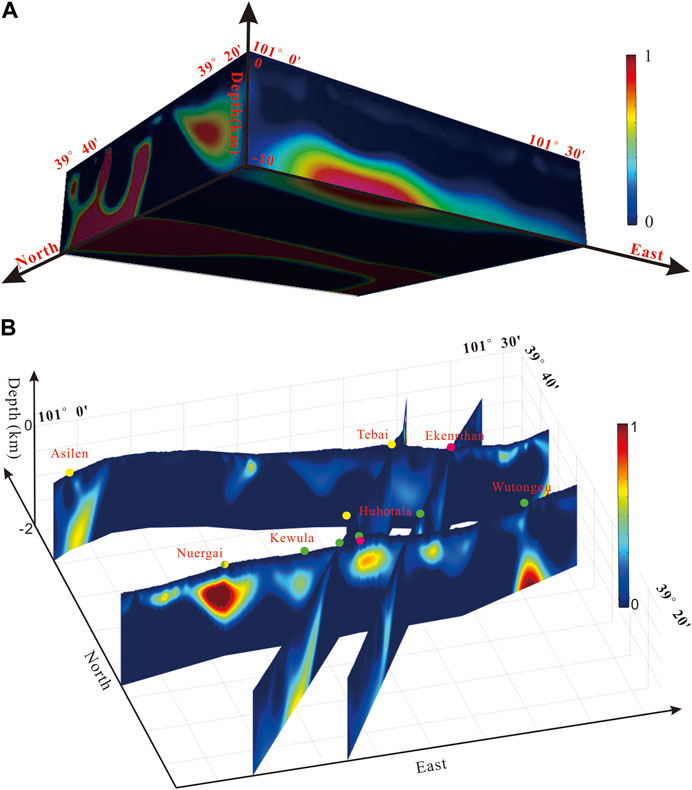
FIGURE 8. 3D inversion result by MSVD–BEMD–MagFInv3D. (A) Inversed 3D cube of residual anomalies after denoising. (B) Mineral deposits and magnetic anomalies along the regional tectonic faults (or geological sections).
4 Validation and comparison
In order to show the relationship among regional tectonic structures, deposits, and targeted underground magnetic anomalies, four sections are sliced from the 3D inversion cube along the regional faults’ directions (geological sections). The inversed cube is of the depth of 2 km and has 401 rows, 456 columns, and 200 layers. The geological sections and the mineral deposits along these regional faults are integrated by MATLAB 2022b and shown in Figure 8B, in which the deposits are strictly controlled by these regional faults.
There is a magnetic anomaly in Figure 9 of Section 1 where the Nuergai Cu–Au deposit is located and is of tectonic–hydrothermal genesis. It is verified by a drilling hole of ZK 01 that the underground rocks are mainly Permian quartz diorite that is composed of anorthose, hornblende, and quartz, with a little biotite. Two ore bodies were found within the depth between 141 m and 142 m and 573 m and 576 m, respectively. The measured content of copper is 0.251% and 0.408%, and that of gold is 8.12 g/t and 4.46 g/t, respectively, in these two locations. In addition, both of them contained large amount of magnetic iron pyrite with copper pyrite disseminated around or in it, which corresponds to the high magnetic anomalies.
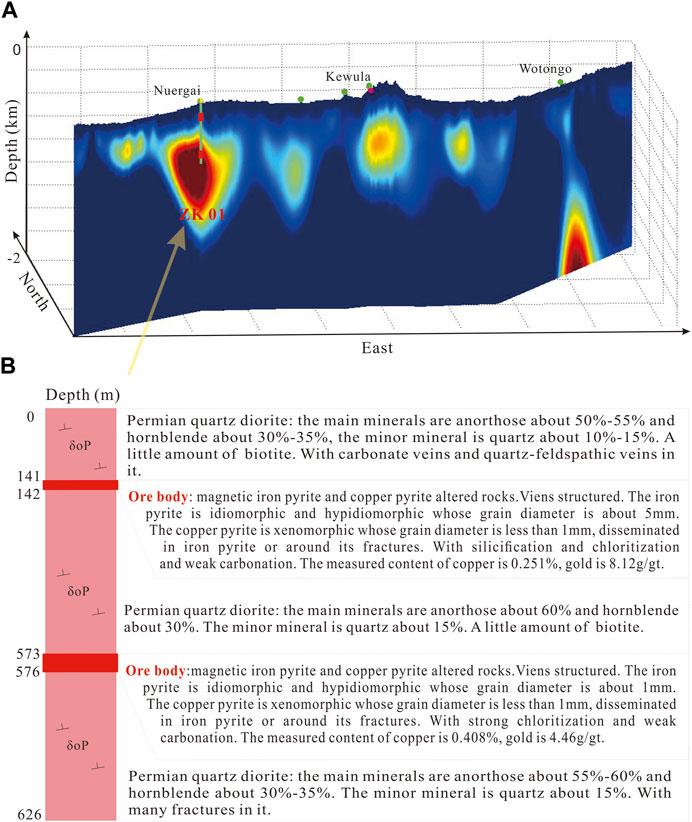
FIGURE 9. Section 1. (A) Section 1 from the inversed cube of 2 km depth by the proposed approach. (B) Detailed information of ZK 01 to verify the magnetic anomalies of the Au deposit in Nuergai.
The high magnetic anomaly under the Asilen volcanogenic gold deposit along Section 2 in Figure 10 is verified by a drilling hole of ZK 02 of the depth of 355 m that it is induced by lower–middle Carboniferous volcanic andesites, rhyolites, and tuffs with sandy slate interlayers, which are enriched with structured fracture zones with mylonites. The measured Au, Ag, and Cu is 0.02%–0.04%, 0.70%–1.00%, and 0.0016%–0.0086%, respectively, within the depth of 20 m–22 m, 30 m–31 m, 291 m–292 m, and 296 m–297 m. The high magnetic anomaly under the Tebai gold deposit, a famous medium-sized deposit that is on the intersection point between Section 2 in Figure 10 and Section 3 in Figure 11, is uncovered by drilling explorations of ZK 241, ZK 242, ZK 244, ZK 245, and ZK 246 that are exactly overlapped with the ore bodies. Structured fracture zones with mylonites could be seen on the ground surface and in the drilling holes, which created a good environment for the formation of the ore bodies, and the underground Carboniferous–Permian quartz diorites provided material resources for the ore bodies. It could be inferred by these drilling holes and field exploration that the high magnetic anomalies under Tebai and Ekenrihan are mainly induced by the Carboniferous quartz diorites and magnetic andesites. Meanwhile, the deposits around Kewula, Huhotala, and Ekenrihan are also controlled by the regional faults and are closely related to the underground magnetic anomalies induced by Permian monzonitic granite and quartz diorite in Figure 12 of Section 4.
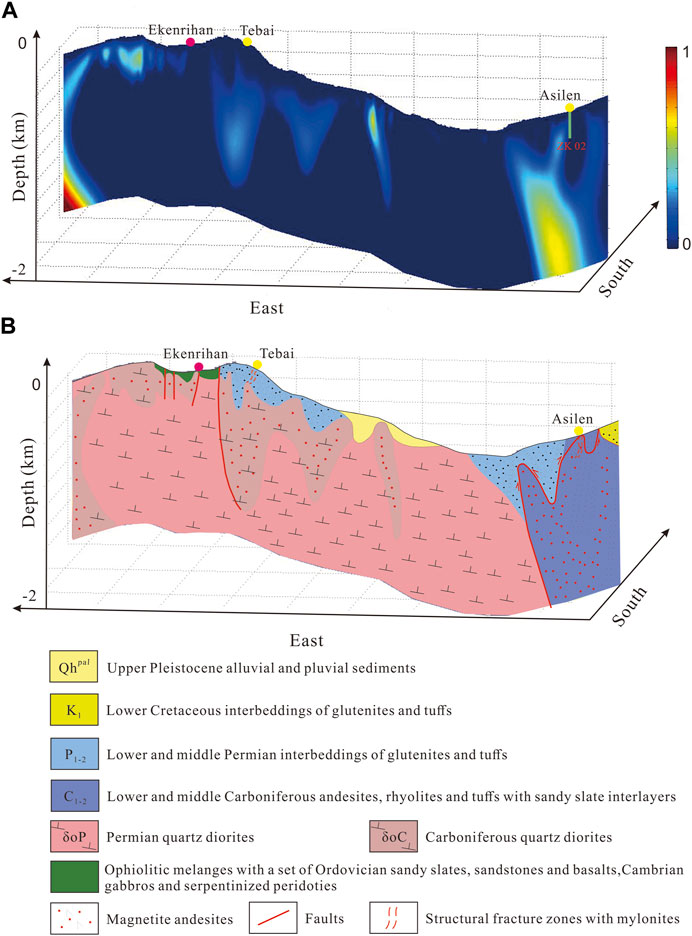
FIGURE 10. Section 2. (A) Section 2 from the inversed cube of 2 km depth by the proposed approach. (B) Geological descriptions of section 2 by field investigation.
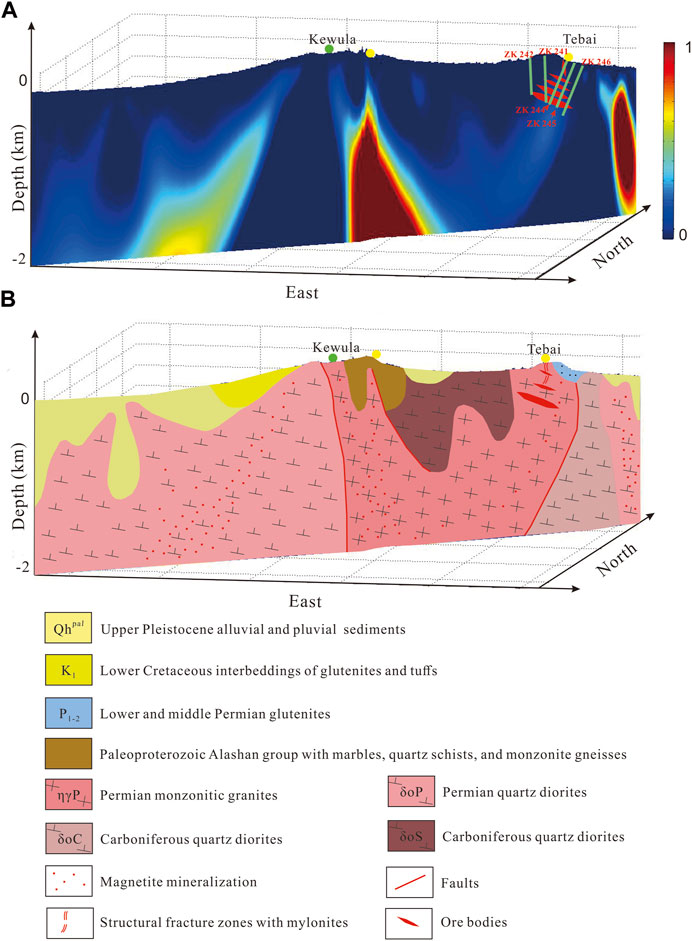
FIGURE 11. Section 3. (A) Section 3 from the inversed cube of 2 km depth by the proposed approach. (B) Geological descriptions of section 3 by field investigation.
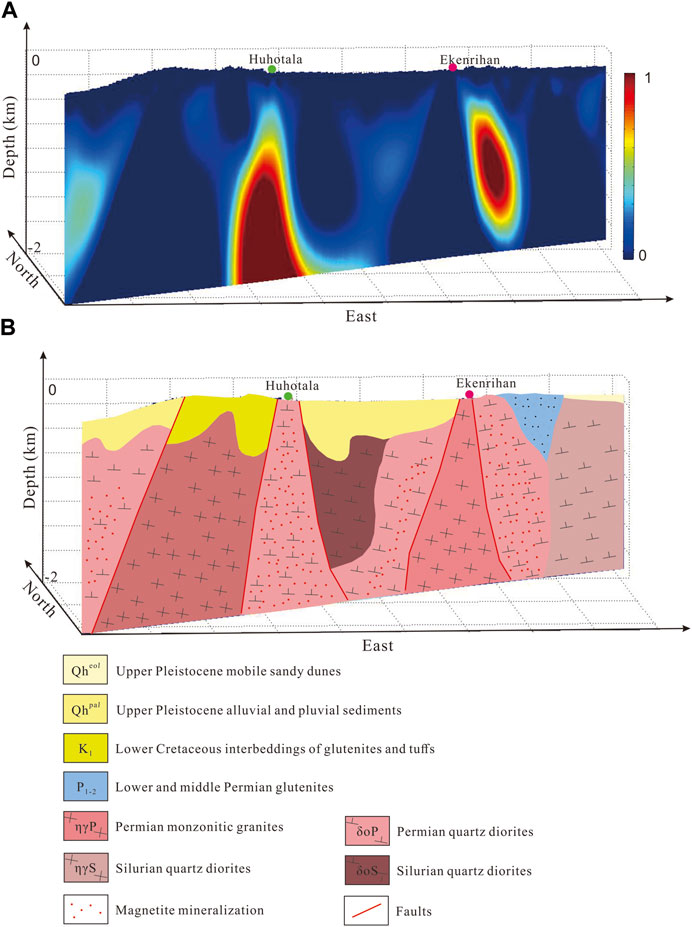
FIGURE 12. Section 4. (A) Section 4 from the inversed cube of 2 km depth by the proposed approach. (B) Geological descriptions of section 4 by field investigation.
Therefore, the inversed underground 3D magnetic anomalies could be taken as a sign of mineralization for targeting the deposits; further exploration could be conducted on the high-anomaly regions, especially around the known and verified deposits. The inversed result by the proposed approach of MSVD–BEMD–MagFInv3D in Figure 8 is compared with the one that is without removing the noise and regional anomalies in Figure 13. It could be seen that the local anomalies are more enhanced and embodied in the former. The magnetic anomalies emerge shallower to the surface after removing the regional (background) anomalies, and more importantly, they are more exactly in accordance with the regional faults and the deposits. While the magnetic anomalies in the latter one, that is, without removing the noise and regional anomalies, are deeper underground, their shape and distribution of do not fit in properly with the regional faults and the known deposits, which are verified by field exploration of geological sections and delineated in Figures 9–12.
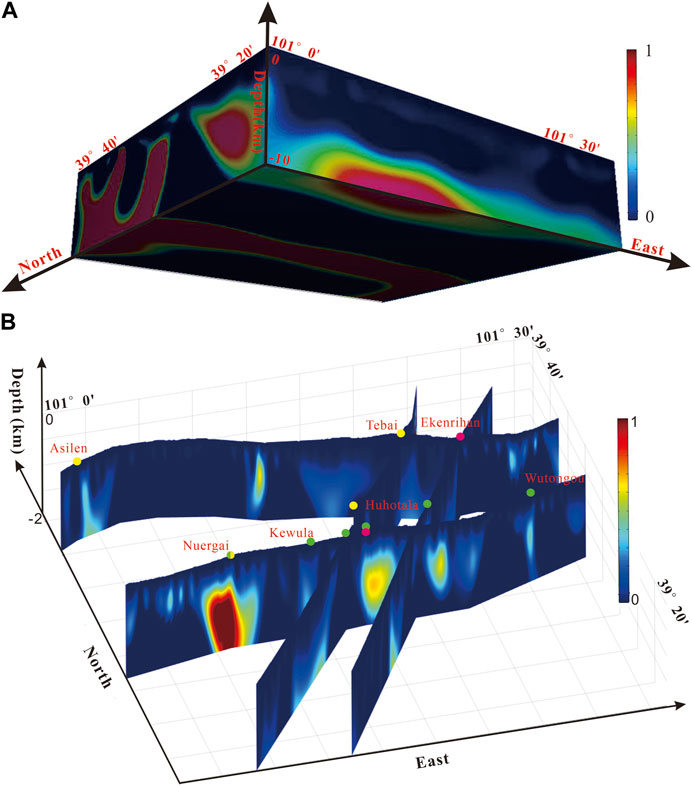
FIGURE 13. 3D inversion result without removing the noise and regional anomalies. (A) Inversed 3D cube. (B) Mineral deposits and magnetic anomalies along the regional tectonic faults (or geological sections).
As for our future work, the inversed high-magnetic anomalies, especially around the known deposits and along the regional tectonic faults, should be explored further for finding more mineral deposits. The other denoising methods, regional–residual anomaly separation methods, and 3D inversion methods should be studied further with a comparison of the proposed approach and its effectiveness.
5 Conclusion
First, the pre-process of MSVD is efficient in aeromagnetic denoising. It could automatically detect the noise in it and effectively subtract it in this way. Thus, it could alleviate the mode mixing problem and improve the accuracy of 3D magnetic inversion.
Second, the improved BEMD is an effective method in separating local targeted anomalies from the regional background, data-driven and self-adaptive, orthogonal, and additive. As a dyadic self-adaptive filter bank, BIMF 1 is a high-pass filter applicable to interpreting the tectonic structures and is an indirect indicator to tectonic–hydrothermal-related polymetallic deposits. BIMF 2 is a band-pass filter applicable to prospecting metallogenic areas. BIMF 3+ residue is a low-pass filter and can be taken as regional anomalies. These filters are independent of one another, and residual anomalies could be extracted from them.
Third, the wavenumber–domain iterative approach for 3D imaging of magnetic anomalies and gradients with depth constraints is an effective and efficient way of dealing with magnetic 3D inversion. With the verification of four geological sections and some drilling holes, the genesis of the mineral deposits could be clearly revealed and more regional mineralization prospects could be delineated.
Generally speaking, the approach proposed by this study is an effective way of aeromagnetic denoising, residual anomaly extraction, and 3D inversion for mineral exploration. It is especially effective in exploring polymetallic deposits of high magnetism with tectonic and hydrothermal genesis.
Data availability statement
The datasets presented in this article are not readily available because the original aeromagnetic data of high resolution are confidential files defined by our country. Requests to access the datasets should be directed to the first author MM (E-mail: bW1pbkBtYWlsLmNncy5nb3YuY24=).
Author contributions
MM programmed the algorithm and wrote this paper. WZ, LX, and QG guided this research. YL, WW, and HX drew some of the figures in the paper. All authors contributed to the article and approved the submitted version.
Funding
The research was supported by the China Geological Survey (Project no. 12120114062001).
Acknowledgments
The authors greatly appreciate the many constructive comments by Dr. Zhiqiang Zhang and the reviewers that helped to significantly improve our paper.
Conflict of interest
The authors declare that the research was conducted in the absence of any commercial or financial relationships that could be construed as a potential conflict of interest.
The reviewer LG declared a shared affiliation with the author MM to the handling editor at the time of review.
Publisher’s note
All claims expressed in this article are solely those of the authors and do not necessarily represent those of their affiliated organizations, or those of the publisher, the editors, and the reviewers. Any product that may be evaluated in this article, or claim that may be made by its manufacturer, is not guaranteed or endorsed by the publisher.
References
Abdelrahman, E. M., and Sharafeldin, S. M. (1996). An iterative least-squares approach to depth determination from residual magnetic anomalies due to thin dikes. J. Appl. Geophys. 34, 213–220. doi:10.1016/0926-9851(95)00017-8
Al-Rahim, A. M. (2016). Separating the gravity field of Iraq by using bidimensional empirical mode decomposition technique. Arabian J. Geosciences 9 (1), 43–49. doi:10.1007/s12517-015-2118-7
Bencharef, M. H., Eldosouky, A. M., Zamzam, S., and Boubaya, D. (2022). Polymetallic mineralization prospectivity modelling using multi-geospatial data in logistic regression: The Diapiric Zone, Northeastern Algeria. Geocarto Int. 37 (27), 15392–15427. doi:10.1080/10106049.2022.2097481
Bouhrara, M., Maring, M. C., and Spencer, R. G. (2019). A simple and fast adaptive nonlocal multispectral filtering algorithm for efficient noise reduction in magnetic resonance imaging. Magn. Reson. Imaging 55, 133–139. doi:10.1016/j.mri.2018.08.011
Chen, Y., Zhang, L., and Zhao, B. (2019). Identification of the anomaly component using BEMD combined with PCA from element concentrations in the Tengchong tin belt, SW China. Geosci. Front. 10 (4), 1561–1576. doi:10.1016/j.gsf.2018.09.015
Cheng, Q. (2005). Multifractal distribution of eigenvalues and eigenvectors from 2D multiplicative cascade multifractal fields. Math. Geol. 37 (8), 915–927. doi:10.1007/s11004-005-9223-1
Cheng, Q., Xu, Y., and Grunsky, E. (2000). Integrated spatial and spectrum method for geochemical anomaly separation. Nat. Resour. Res. 9 (1), 43–52. doi:10.1023/A:1010109829861
Cui, Y., and Guo, L. (2019). A wavenumber-domain iterative approach for 3D imaging of magnetic anomalies and gradients with depth constraints. J. Geophys. Eng. 16 (6), 1032–1047. doi:10.1093/jge/gxz064
Di Pietro Paolo, D., Müller, H. P., Nolte, G., and Erné, S. N. (2006). Noise reduction in magnetocardiography by singular value decomposition and independent component analysis. Med. Biol. Eng. Comput. 44 (6), 489–499. doi:10.1007/s11517-006-0055-z
Ekpe, E. E., Ben, U. C., Ekwok, S. E., Ebong, E. D., Akpan, A. E., Eldosouky, A. M., et al. (2022). Assessment of natural radionuclide distribution pattern and radiological risk from rocks in precambrian oban massif, southeastern Nigeria. Minerals 12 (312), 1–19. doi:10.3390/min12030312
Eldosouky, A. M., El-qassas, R. A. Y., Pham, L. T., Abdelrahman, K., Alhumimidi, M. S., Bahrawy, A., et al. (2022). Mapping main structures and related mineralization of the arabian shield (Saudi arabia) using sharp edge detector of transformed gravity data. Minerals 12 (71), 71–20. doi:10.3390/min12010071
Eldosouky, A. M., El-Qassas, R. A. Y., Pour, A. B., Mohamed, H., and Sekandari, M. (2021). Integration of ASTER satellite imagery and 3D inversion of aeromagnetic data for deep mineral exploration. Adv. Space Res. 68 (9), 3641–3662. doi:10.1016/j.asr.2021.07.016
Eldosouky, A. M., Sehsah, H., Elkhateeb, S. O., and Pour, A. B. (2020). Integrating aeromagnetic data and Landsat-8 imagery for detection of post-accretionary shear zones controlling hydrothermal alterations: The Allaqi-Heiani Suture zone, South Eastern Desert, Egypt. Adv. Space Res. 65 (3), 1008–1024. doi:10.1016/j.asr.2019.10.030
ElGalladi, A., Araffa, S., Mekkawi, M., and Abd-AlHai, M. (2022). Exploring mineralization zones using remote sensing and aeromagnetic data, West Allaqi Area, Eastern-Desert, Egypt. Egypt. J. Remote Sens. Space Sci. 25 (2), 417–433. doi:10.1016/j.ejrs.2022.03.007
Elkhateeb, S. O., and Abdellatif, M. A. G. (2018). Delineation potential gold mineralization zones in a part of Central Eastern Desert, Egypt using Airborne Magnetic and Radiometric data. NRIAG J. Astronomy Geophys. 7 (2), 361–376. doi:10.1016/j.nrjag.2018.05.010
Gabtni, H., and Jallouli, C. (2017). Regional-residual separation of potential field: An example from Tunisia. J. Appl. Geophys. 137, 8–24. doi:10.1016/j.jappgeo.2016.12.011
Gao, Y., Zhang, Z., Xiong, Y., and Zuo, R. (2016). Mapping mineral prospectivity for Cu polymetallic mineralization in southwest Fujian Province, China. Ore Geol. Rev. 75, 16–28. doi:10.1016/j.oregeorev.2015.12.005
Guo, L., Meng, X., Chen, Z., Li, S., and Zheng, Y. (2013). Preferential filtering for gravity anomaly separation. Comput. Geosciences 51, 247–254. doi:10.1016/j.cageo.2012.09.012
Gupta, V. K., and Ramani, N. (1980). Some aspects of regional-residual separation of gravity anomalies in a precambrian terrain. Geophysics 45 (9), 1412–1426. doi:10.1190/1.1441130
Hou, W., Yang, Z., Zhou, Y., Zhang, L., and Wu, W. (2012). Extracting magnetic anomalies based on an improved BEMD method: A case study in the pangxidong area, south China. Comput. Geosciences 48, 1–8. doi:10.1016/j.cageo.2012.05.006
Huang, J., Zhao, B., Chen, Y., and Zhao, P. (2010). Bidimensional empirical mode decomposition (BEMD) for extraction of gravity anomalies associated with gold mineralization in the Tongshi gold field, Western Shandong Uplifted Block, Eastern China. Comput. Geosciences 36 (7), 987–995. doi:10.1016/j.cageo.2009.12.007
Innocent, A. J., Chidubem, E. O., and Chibuzor, N. A. (2019). Analysis of aeromagnetic anomalies and structural lineaments for mineral and hydrocarbon exploration in Ikom and its environs southeastern Nigeria. J. Afr. Earth Sci. 151, 274–285. doi:10.1016/j.jafrearsci.2018.12.011
Keating, P., and Pinet, N. (2011). Use of non-linear filtering for the regional-residual separation of potential field data. J. Appl. Geophys. 73 (4), 315–322. doi:10.1016/j.jappgeo.2011.02.002
Kharbish, S., Eldosouky, A. M., and Amer, O. (2022). Integrating mineralogy, geochemistry and aeromagnetic data for detecting Fe–Ti ore deposits bearing layered mafic intrusion, Akab El-Negum, Eastern Desert, Egypt. Sci. Rep. 12 (15474), 15474–15519. doi:10.1038/s41598-022-19760-x
Lee, S., and Lee, Y. (2021). Performance evaluation of median-modified Wiener filter algorithm in high-resolution complementary metal–oxide–semiconductor radio-magnetic X-ray imaging system: An experimental study. Nucl. Instrum. Methods Phys. Res. Sect. A Accel. Spectrom. Detect. Assoc. Equip. 1010 (165509), 165509–165516. doi:10.1016/j.nima.2021.165509
Li, Y., and Nabighian, M. (2015). “Tools and techniques: Magnetic methods of exploration - principles and algorithms,” in Treatise on geophysics (Berlin, Germany: Springer), 11. doi:10.1016/B978-0-444-53802-4.00196-2
Lin, T., Yu, S., Zhao, H., Zhang, Y., and Sun, H. (2022). Harmonic noise cancellation of magnetic resonance sounding signal based on wavelet modulus maximum. J. Appl. Geophys. 207 (104839), 104839–9. doi:10.1016/j.jappgeo.2022.104839
Little, A. V., Maggioni, M., and Rosasco, L. (2017). Multiscale geometric methods for data sets I: Multiscale SVD, noise and curvature. Appl. Comput. Harmon. Analysis 43, 504–567. doi:10.1016/j.acha.2015.09.009
Liu, B., Sang, X., Xing, S., and Wang, B. (2015). Noise suppression in brain magnetic resonance imaging based on non-local means filter and fuzzy cluster. Optik 126 (21), 2955–2959. doi:10.1016/j.ijleo.2015.07.056
Ma, M., Wang, C. H., Li, X., Gao, Q., Gong, W. G., and Shi, S. X. (2019). Aeromagnetic anomalies interpretation based on improved bi-dimensional empirical mode decomposition (BEMD) and RGB composition. IOP Conf. Ser. Earth Envi-ronmental Sci. 237 (5), 052002–052011. doi:10.1088/1755-1315/237/5/052002
Mahdi, A. M., Eldosouky, A. M., el Khateeb, S. O., Youssef, A. M., and Saad, A. A. (2022). Integration of remote sensing and geophysical data for the extraction of hydrothermal alteration zones and lineaments; Gabal Shilman basement area, Southeastern Desert, Egypt. J. Afr. Earth Sci. 194 (104640), 104640–104711. doi:10.1016/j.jafrearsci.2022.104640
Mamouch, Y., Attou, A., Miftah, A., Ouchchen, M., Dadi, B., Moussaid, A., et al. (2023). Aeromagnetic data of the kelâat M’gouna inlier (jbel saghro, eastern anti-atlas, Morocco): Geotectonic and mining implications. J. Afr. Earth Sci. 197 (104744), 104744–104812. doi:10.1016/j.jafrearsci.2022.104744
Mandal, A., and Niyogi, S. (2018). Filter assisted bi-dimensional empirical mode decomposition: A hybrid approach for regional-residual separation of gravity anomaly. J. Appl. Geophys. 159, 218–227. doi:10.1016/j.jappgeo.2018.09.003
Martínez-Moreno, F. J., Galindo-Zaldívar, J., Pedrera, A., Teixidó, T., Peña, J. A., and González-Castillo, L. (2015). Regional and residual anomaly separation in microgravity maps for cave detection: The case study of Gruta de las Maravillas (SW Spain). J. Appl. Geophys. 114, 1–11. doi:10.1016/j.jappgeo.2015.01.001
Muundjua, M., Hart, R. J., Gilder, S. A., Carporzen, L., and Galdeano, A. (2007). Magnetic imaging of the Vredefort impact crater, South Africa. Earth Planet. Sci. Lett. 261, 456–468. doi:10.1016/j.epsl.2007.07.044
Ortiz-Alemán, C., and Urrutia-Fucugauchi, J. (2010). Aeromagnetic anomaly modeling of central zone structure and magnetic sources in the Chicxulub crater. Phys. Earth Planet. Interiors 179, 127–138. doi:10.1016/j.pepi.2010.01.007
Saada, S. A., Eldosouky, A. M., Kamel, M., Khadragy, A., Abdelrahman, K., Fnais, M. S., et al. (2022). Understanding the structural framework controlling the sedimentary basins from the integration of gravity and magnetic data: A case study from the east of the qattara depression area, Egypt. J. King Saud Univ. - Sci. 34 (101808), 101808–101812. doi:10.1016/j.jksus.2021.101808
Shebl, A., Abdellatif, M., Elkhateeb, S. O., and Csámer, Á. (2021). Multisource data analysis for gold potentiality mapping of atalla area and its environs, central eastern desert, Egypt. Minerals 11 (641), 641–719. doi:10.3390/min11060641
Spector, A., and Grant, F. S. (1970). Statistical models for interpreting aeromagnetic data. Geophysics 35 (2), 293–302. doi:10.1190/1.1440092
Sridhar, M., Markandeyulu, A., Chawla, A. S., and Chaturvedi, A. K. (2018). Analyses of aeromagnetic data to delineate basement structures and reveal buried igneous bodies in kaladgi basin, Karnataka. J. Geol. Soc. India 91 (2), 165–173. doi:10.1007/s12594-018-0830-0
Tazi, M. J., Azzab, D. el, Charroud, M., Jabrane, O., Ouahzizi, Y., Zahour, R., et al. (2022). Identification of potential mineral exploration targets from the interpretation of aeromagnetic data covering the Sirwa region (Central Anti-Atlas, Morocco). Sci. Afr. 17 (01351), 013511–e1413. doi:10.1016/j.sciaf.2022.e01351
Wang, G., Zhang, S., Yan, C., Xu, G., Ma, M., Li, K., et al. (2012). Application of the multifractal singular value decomposition for delineating geophysical anomalies associated with molybdenum occurrences in the Luanchuan ore field (China). J. Appl. Geophys. 86, 109–119. doi:10.1016/j.jappgeo.2012.07.013
Xiong, S. (2021). Research achievements of the Qinghai-Tibet Plateau based on 60 years of aeromagnetic surveys. China Geol. 4 (1), 1–31. doi:10.31035/cg2021029
Xu, G., Cheng, Q., Zuo, R., and Wang, H. (2016). Application of improved bi-dimensional empirical mode decomposition (BEMD) based on Perona-Malik to identify copper anomaly association in the southwestern Fujian (China). J. Geochem. Explor. 164, 65–74. doi:10.1016/j.gexplo.2015.09.013
Zahra, H. S., and Nakhla, A. M. (2016). Tectonic and structural setting of the northeastern central Gulf of Suez area using aeromagnetic data. J. Afr. Earth Sci. 115, 1–16. doi:10.1016/j.jafrearsci.2015.12.012
Zhang, Z., Wang, G., Ma, Z., Carranza, E. J. M., Jia, W., Du, J., et al. (2020). Batholith-stock scale exploration targeting based on multi-source geological and geophysical datasets in the Luanchuan Mo polymetallic district, China. Ore Geol. Rev. 118 (103225), 103225–103320. doi:10.1016/j.oregeorev.2019.103225
Zhao, B. B., and Chen, Y. Q. (2011). Singular value decomposition (SVD) for extraction of gravity anomaly associated with gold mineralization in Tongshi gold field, Western Shandong Uplifted Block, Eastern China. Nonlinear Process. Geophys. 18 (1), 103–109. doi:10.5194/npg-18-103-2011
Zhao, J., Zhao, P., and Chen, Y. (2016). Using an improved BEMD method to analyse the characteristic scale of aeromagnetic data in the Gejiu region of Yunnan, China. Comput. Geosciences 88, 132–141. doi:10.1016/j.cageo.2015.12.016
Zhu, X., and Lu, M. (2021). Fault structures and magmatic intrusions inferred from magnetic data for the Southern Great Xing’an Range, northern China. Ore Geol. Rev. 135 (104206), 104206–104216. doi:10.1016/j.oregeorev.2021.104206
Keywords: aeromagnetic denoising, MSVD, residual anomaly extraction, improved BEMD, 3D inversion, mineral exploration
Citation: Ma M, Xiu L, Gao Q, Li Y, Wang W, Xu H and Zhou W (2023) An aeromagnetic denoising-decomposition-3D inversion approach for mineral exploration. Front. Earth Sci. 11:1132093. doi: 10.3389/feart.2023.1132093
Received: 26 December 2022; Accepted: 01 June 2023;
Published: 26 June 2023.
Edited by:
Zhiqiang Zhang, Hebei GEO University, ChinaReviewed by:
Lianghui Guo, China University of Geosciences, ChinaAhmed M. Eldosouky, Suez University, Egypt
Copyright © 2023 Ma, Xiu, Gao, Li, Wang, Xu and Zhou. This is an open-access article distributed under the terms of the Creative Commons Attribution License (CC BY). The use, distribution or reproduction in other forums is permitted, provided the original author(s) and the copyright owner(s) are credited and that the original publication in this journal is cited, in accordance with accepted academic practice. No use, distribution or reproduction is permitted which does not comply with these terms.
*Correspondence: Wenhui Zhou, emhvdXdlbmh1aTgwMDVAMTYzLmNvbQ==