 Ruizhe Wang
 Zhaofeng Li
 Mo Xu1,2
 Qiang Zhang
 Walter A. Illman
- 1State Key Laboratory of Geohazard Prevention and Geoenvironment Protection, Chengdu University of Technology, Chengdu, China
- 2College of Environment and Civil Engineering, Chengdu University of Technology, Chengdu, China
- 3Department of Earth and Environmental Sciences, University of Waterloo, Waterloo, ON, Canada
The consolidation of clay layers is of great significance for groundwater environmental protection, groundwater storage utilization, and land subsidence. In this study, the governing equation for the excess pore water pressure during the non-linear consolidation process of clay layers under load conditions is obtained based on the one-dimensional non-linear consolidation theory. Analytical solutions are then derived for clay layers with single or double drainage caused by the dissipation of the excess pore water pressure. With these analytical solutions, the groundwater dynamics and deformation of the clay layer are analyzed. Correspondingly, a type curve method is proposed to calculate the hydraulic parameters of the clay layer through laboratory experiments, which verifies the reliability of the analytical solutions. The study results show that the deformation of the clay layer predicted by the non-linear consolidation theory is smaller than that predicted by the linear consolidation theory. The deformation of the clay layer increases with the increase in the thickness of the clay layer, the compressive index, and the overburden load, while it decreases with the increase in the initial void ratio and the initial effective stress. The stable time, at which the consolidation of the clay layer is completed, increases with the increase in the compression index and the thickness of the clay layer, while it decreases with the increase in the initial void ratio, the initial effective stress, and the initial hydraulic conductivity. It does not vary with the load pressure. Conclusively, the deformation prediction based on the non-linear consolidation theory is more accurate and applicable to further load pressures.
Highlights
• Analytical solutions of deformation for clay layer(s) undergoing nonlinear consolidation are derived.
• A type curve method is proposed to determine the hydraulic parameters of clay layers.
• The deformation of the clay layer increases with the increase in the compression index, thickness, and overburden load, and with the decrease in the initial void ratio and initial effective stress.
1 Introduction
With global population growth and economic development, groundwater pollution and geological disasters induced by human activities are becoming increasingly serious, threatening the sustainable development of human society (Gorelick and Zheng, 2015; Jia et al., 2020; Luo et al., 2020; Shu et al., 2022; Zhang et al., 2023). Clayey soils widely cover the surface of basins, plains, seabed, and groundwater aquifer systems, such as the Yangtze Delta in China and the Virginia coastal plain aquifer system in the U.S. (Konikow and Neuzil, 2007; Guo and Li, 2015). Clay and silt are the main components of aquitards, and the hydraulic characteristics of aquitards are closely related to groundwater environmental protection, groundwater storage utilization, and land subsidence (Li et al., 2017; Li et al., 2019; Guo et al., 2022). In addition, clay soil is a significant component of the liner systems installed at hazardous waste disposal sites (e.g., municipal solid waste landfills and nuclear waste disposal sites), thus it has a positive effect on the protection of the water and soil environment around the site, and is an important component of building foundations, dam seepage control systems, mine tailings dams, etc. (Neuzil, 1986; Xue et al., 2005; Zhou et al., 2013; Nicholls et al., 2021; Yan et al., 2021; Zhu et al., 2021). Therefore, it is important to determine the deformation of the clay layer and its hydraulic parameters for groundwater environmental protection and geological disaster prevention.
Many studies have been conducted on the consolidation and drainage of aquitards (Zhuang et al., 2020; Zhuang et al., 2021). Zhou et al. (2013) derived an analytical solution to describe the change of excess pore water pressure in an aquitard based on Terzaghi’s one-dimensional consolidation theory. The drawdown was considered to be a constant in an adjacent aquifer and was verified by laboratory tests. Li et al. (2016) proposed a method for estimating the water release from an aquitard during the entire mining history or a limited period, then applied the method to the aquifer system in the Su-Xi-Chang area, but the groundwater level data were insufficient in the study. In addition, Li et al. (2018) proposed a governing equation of drawdown variation to describe the one-dimensional large-strain consolidation behavior of an aquitard without creep effects and derived an analytical solution for the deformation of a large-strain aquitard under a sudden drawdown in an adjacent aquifer.
In addition, many scholars in soil mechanics and hydrogeology have studied the consolidation and deformation of clay layers (Chen et al., 2021; Liu et al., 2021; Wang et al., 2021). Xie and Leo, (2004) derived a completely explicit analytical solution for one-dimensional large-strain consolidation in thick and thin soil layers and compared it with the classical small-strain theory. They also extensively studied the non-linear consolidation properties of clays. Davis and Raymond, (1965) pointed out that Terzaghi’s one-dimensional linear consolidation theory cannot accurately predict the dissipation rate of pore pressure. Gibson et al. (1981) proposed a consistent theory for finite-strain consolidation of thick and uniform clay layers under load and found that the traditional consolidation theories may seriously underestimate excess pore water pressure in soft soil layers. Considering the complex non-linearity of materials and the geometric characteristics of the soil consolidation process, Wu et al. (2010) derived an analytical solution and obtained the variation law of soil effective stress and void ratio under different conditions through finite element numerical analysis. Ma et al. (2021) established a settlement calculation model for soft soil foundations, developed a method to determine the deformation modulus of the soil before and after damage under load, and proposed a non-linear settlement calculation method considering the structural characteristics of soft clay. The effect of temperature and chemical properties of pore water on the seepage and compression of cohesive soils was also analyzed (Abdullah et al., 1999; Romero et al., 2001; Deng et al., 2014).
Moreover, research on soil permeability is also in full swing. Zhou et al. (2020) and Zhao et al. (2020) proposed a novel double threshold segmentation algorithm to segment cracks, pores, and grains, and pore-scale variables are defined and extracted from these X-ray CT images to study the geometric characteristics of microstructures of porous geomaterials. Zhao and Zhou, (2020a), Zhao and Zhou, (2020b), Zhao and Zhou, (2022); Zhao, et al. (2022); Zhou and Zhao, (2019) successfully predicted the permeability of soil by establishing a model through X-ray CT imaging test, analyzed the internal microstructures of FC and their effects on the compressive strength and permeability, and studied the hydraulic transport properties and fluid flow in single fractures from different projection directions. Zhao et al. (2021) established a digital quantum mechanism-based neural network (DQNN) to study the permeability using digital porosity, coordination number, and pore network size.
The prediction accuracy of consolidation and deformation processes for an aquitard is obviously affected by the uncertainties and errors in the values of hydraulic properties of the clay layer. Based on laboratory testing data, Gregory et al. (2006) proposed several methods to calculate the compressive index and precompression stress from soil compressive test data. An analytical method was proposed to determine the hydrogeological parameters using the data of deformation for a large-strain aquitard (Li et al., 2018). Given that previous analytical solutions were limited by the assumption of a constant head of an overlying unpressurized aquifer, Zhuang et al. (2015) proposed a type curve method for linear drawdown and deformation cases to estimate the hydrogeological parameters of an aquitard in an aquifer system.
Terzaghi’s one-dimensional linear consolidation (Terzaghi, 1943) problem is a classic problem in soil mechanics and is the most generally used theory for the consolidation of saturated soils. However, saturated clay soils have obvious non-linear trends during consolidation (Gibson et al., 1967; Gibson et al., 1981; Xie and Leo, 2004). Under the condition that the drawdown of adjacent aquifers is constant, Luo et al. (2020) derived an analytical solution to calculate the drawdown and water release of an aquitard undergoing non-linear consolidation described by Gibson et al. (1967) and proposed a type curve approach to determine the hydraulic parameters of the aquitard. Moreover, many researchers have studied the non-linear consolidation properties of clay by means of analytical solutions or combined analytical solutions with laboratory experiments under the premise that the reduction of permeability is proportional to the reduction of compressibility (
Based on the one-dimensional non-linear consolidation theory developed by (Gibson et al., 1967; Gibson et al., 1981), this study first derived the analytical solutions of the excess pore water pressure and the deformation in accordance with Darcy’s law under constant overburden load. Next, the deformation of clay layers with single or double drainage, i.e., singly (SDCL) or doubly draining clay layer (DDCL), was analyzed, and the factors for the deformation were explored by analyzing the sensitivity of multiple parameters. In addition, through a laboratory single and double drainage consolidation test, a type curve approach based on the analytical solutions of non-linear consolidation theory was developed to determine the hydraulic parameters of clay layers and to verify the theoretical research presented in this study.
2 Mathematical model and analytical solutions
2.1 Governing equation for the consolidation of clay layers
The schematic diagram of the one-dimensional non-linear consolidation of a clay layer under an overlying load condition is shown in Figure 1, in which the thickness of the clay layer is
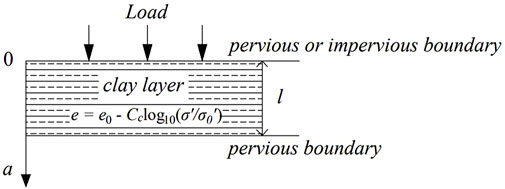
FIGURE 1. Schematic diagram of 1-D non-linear consolidation of a clay layer under an overlying load.
Gibson et al. (1967); Gibson et al. (1981) gave a governing equation for the non-linear consolidation of large-deformed soil layers (one-dimensional non-linear consolidation theory) governed by the void ratio
where
The one-dimensional non-linear consolidation theory is assumed here (Luo et al., 2020): 1) the water flow in the clay layer obeys Darcy’s law while one-dimensional consolidation of the saturated clay layer occurs; 2) the compression of the clay layer equals the cumulative water release from the clay layer per unit area, because the compressibility of soil particles and pore water is significantly less than that of soil skeleton, and the soil particles and pore water are assumed to be incompressible; 3)
where
where
Furthermore, the principle of effective stress is observed in the clay layer,
where
It is assumed that the volumetric compressibility and hydraulic conductivity of the clay layer decrease proportionally (i.e.,
Eq. 6 uses excess pore water pressure
which is closely related to the coefficient of consolidation (
2.2 Analytical solutions
Under the conditions of SDCL and DDCL,
The variations of excess pore water pressure
where
The void ratio
Similarly, the hydraulic conductivity
Based on Darcy’s law of seepage, the dimensionless flow velocity
where
According to the water balance principle, the dimensionless rate of water release for the SDCL and DDCL per unit horizontal area
By integrating Eqs 17, 18 over time, the cumulative water fluxes per unit horizontal area of SDCL and DDCL can be obtained, respectively.
Owing to the above assumption about the incompressibility of soil particles, the accumulated released water per unit area of SDCL and DDCL
where
2.3 Dimensionless analysis
Figure 2A shows that the evolution of
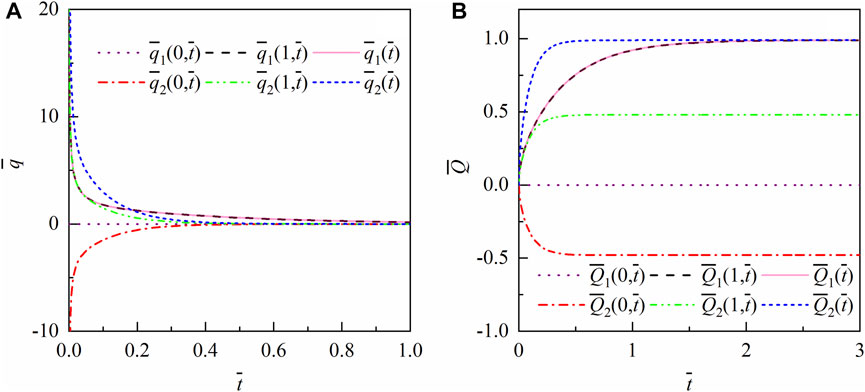
FIGURE 2. (A)
Figure 2B shows the deformation in SDCL and DDCL. Obviously, the
3 Results and discussion
In order to evaluate the above analytical solutions, the values of
The values of
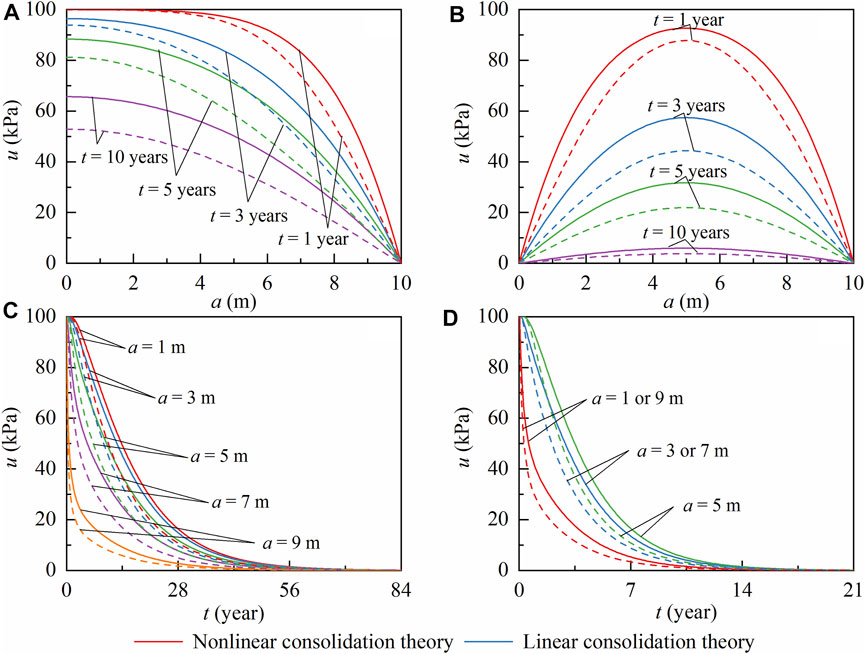
FIGURE 3. The
The values of
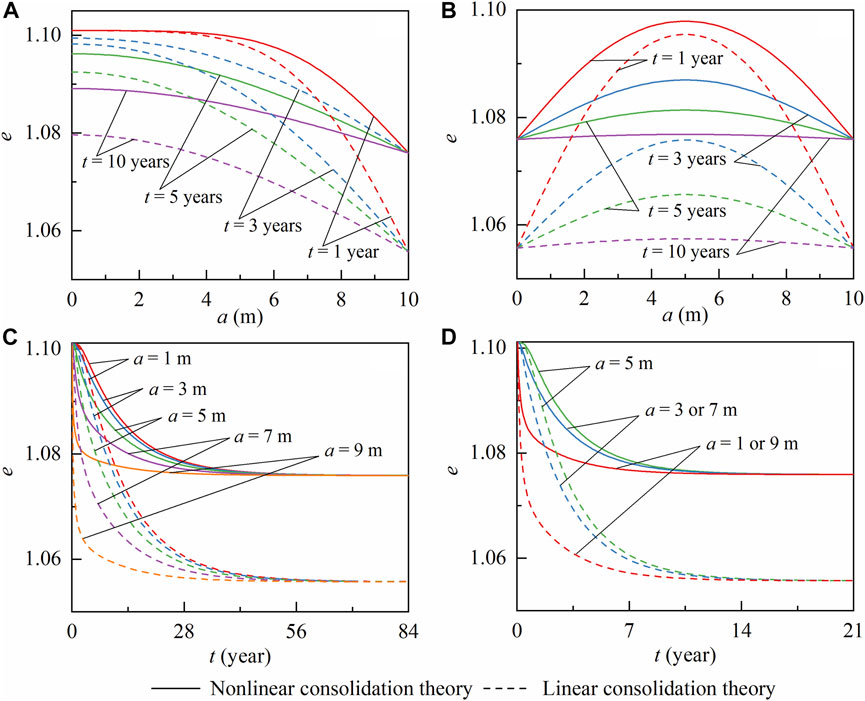
FIGURE 4. The
The spatial and temporal distributions of
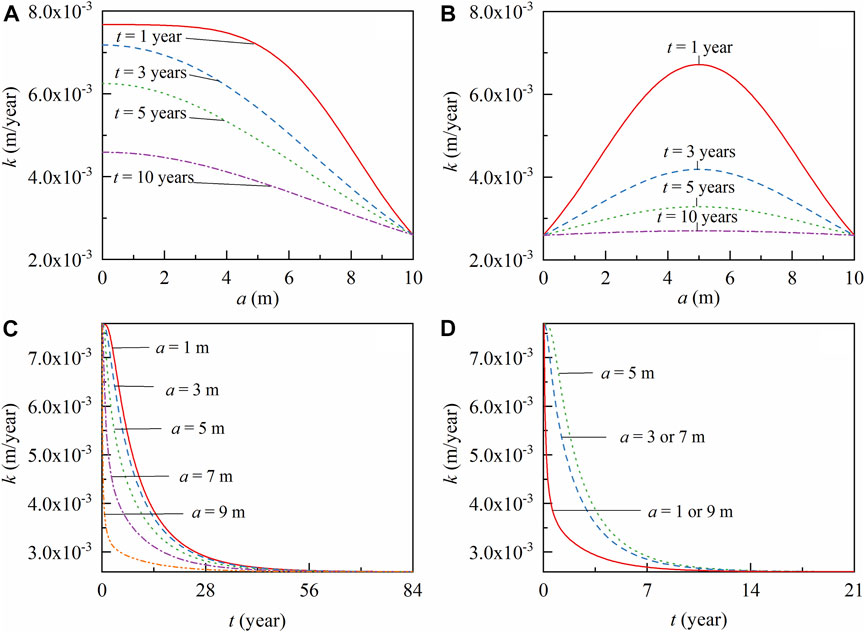
FIGURE 5. The
The values of
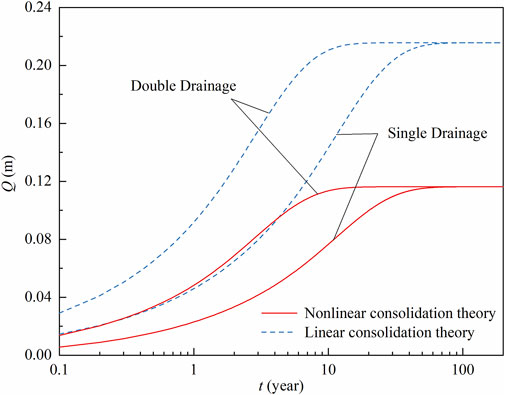
FIGURE 6. Predicted
4 Parametric sensitivity analysis
Under overlying load conditions, the deformation [
Figure 7 shows that the value of
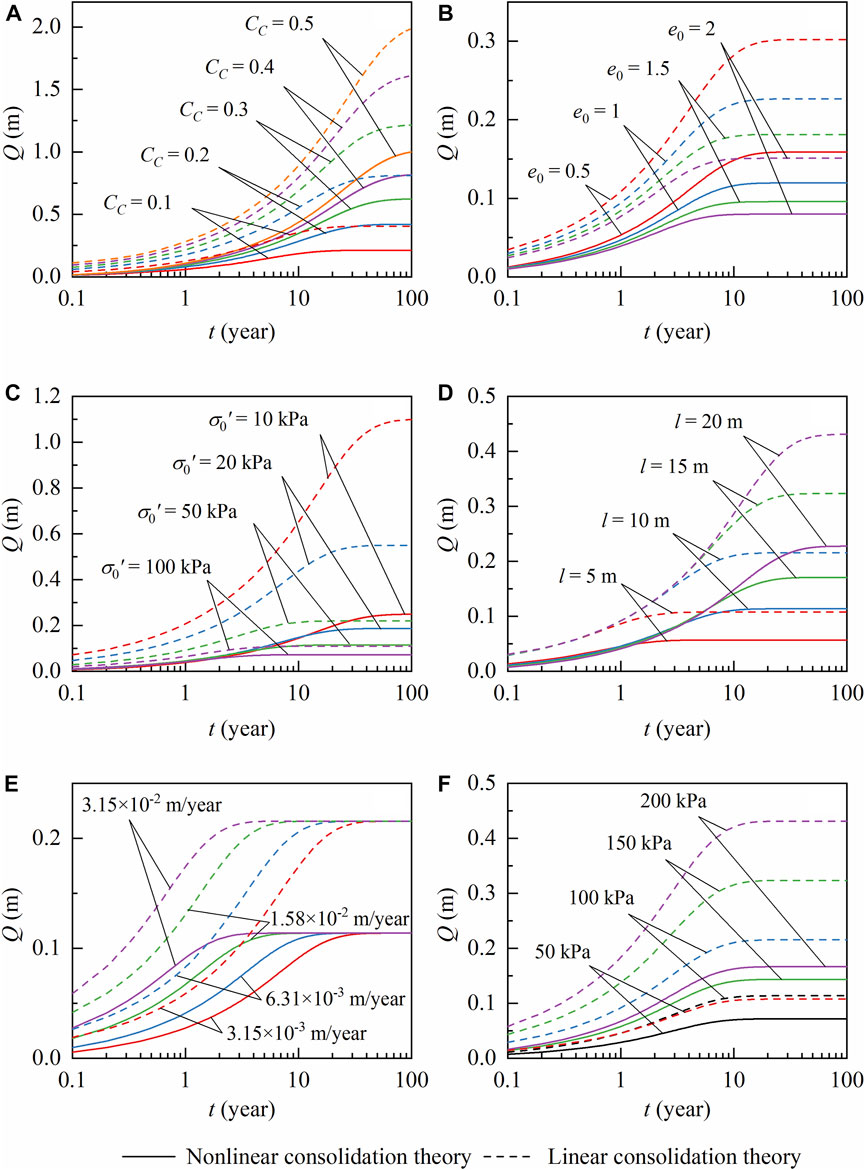
FIGURE 7. The
The impact of
The effect of
The impact of
The impact of
The impact of
5 Laboratory experimental studies
In order to validate the analytical solutions proposed in this study, two laboratory experimental studies were performed for SDCL and DDCL. Besides, a type curve approach was developed to determine the clay layer parameters based on the experimental results.
5.1 Determination of clay layer parameters through type curve analysis
According to Eqs 23, 24, the deformation of the clay layer can be expressed as:
where
By changing Eq. 25 and dimensionless time (
Eq.(26) and (27) are both decomposed into modes, where the corresponding variable and constant terms are added. Therefore, in the double logarithmic coordinate system, the shapes of the curves presented by the deformation
5.2 Results of the SDCL experiment
The single-sided drainage experiment carried out by Zhuo et al. (2022) was designed to test the one-dimensional consolidation of the aquitard under load. The thickness of the clay layer was 20 cm, the initial void ratio was 1.28, the load stage was 0–50–100–200 kPa, and the deformations of the clay layer corresponding to the three stages were 6.9, 6.2, and 6.6 mm, respectively.
In this study, the second-level load condition (50–100 kPa) was taken as an example to determine the hydraulic parameters of SDCL with
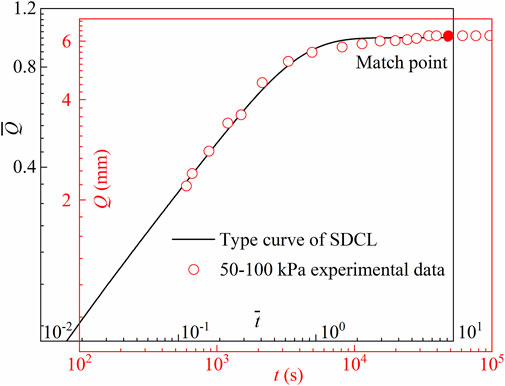
FIGURE 8. Determination of parameters of SDCL by the type curve approach.
Using the hydraulic parameters determined by the proposed type curve approach, the predicted and measured deformations of SDCL were compared under two load stages (50–100–200 kPa), as shown in Figure 9. From Figure 9, when the load is in the range of 50–100 kPa, the
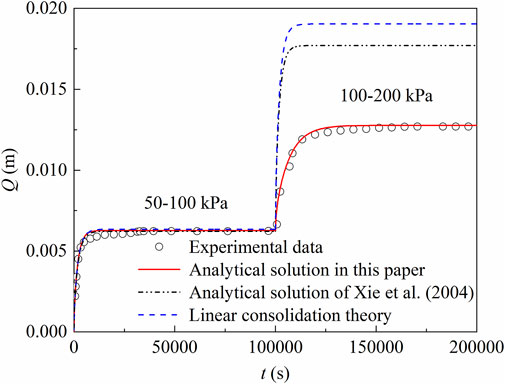
FIGURE 9. Comparison of predicted and measured deformation of SDCL.
The
5.3 Results of the doubly draining clay layer experiment
The consolidation deformation characteristics of DDCL under overlying load conditions were studied by laboratory tests. The steps of the test were as follows: (a) The inner walls of the consolidation vessel were cleaned. The cohesive soil was air-dried, crushed, screened, milled, and dried. After cooling to room temperature, the soil sample was weighed with an electronic balance and put into a consolidation container (20 mm high). The soil sample was compacted in three layers with the corresponding heights of 6.67mm, 13.33mm, and 20mm, respectively (Figures 10A–C). (b) The sample (Figure 10D) was put into the rock vacuum saturated water test device (DP SJA, institute for Beijing Yaou Depeng Technology Co., Ltd., Beijing, China), the saturated water pressure was set to 20 kPa, the saturated pressure time was set to 300 min, the saturated water time was set to 240 min, and the immersion time was set to 2,440 min. After the soil saturation test was complete, the container of soil samples was removed and the soil samples were taken out (Figure 10E). (c) The double-sided drainage consolidation test was performed on the saturated soil samples. A single-lever arm oedometer (Institute for Nanjing Ningxi Soil Instrument Co., Ltd., Nanjing, China), which met the requirements of the standard consolidation test, was used in the test (Figure 10F). The load in the consolidation vessel was gradually increased through the following pressure sequence (e.g., 50, 100, and 200 kPa). The dial indicator reading was recorded during the test until the deflection stabilized. The initial thickness of the test soil sample was 2 cm, and the initial void ratio was 0.63. In order to avoid the influence of the stress state in the early stage caused by the difference in the previous sample preparation, the first load stage (0–50 kPa) was used as the pre-load stage in this test. Therefore, the characteristics of the clay layer,
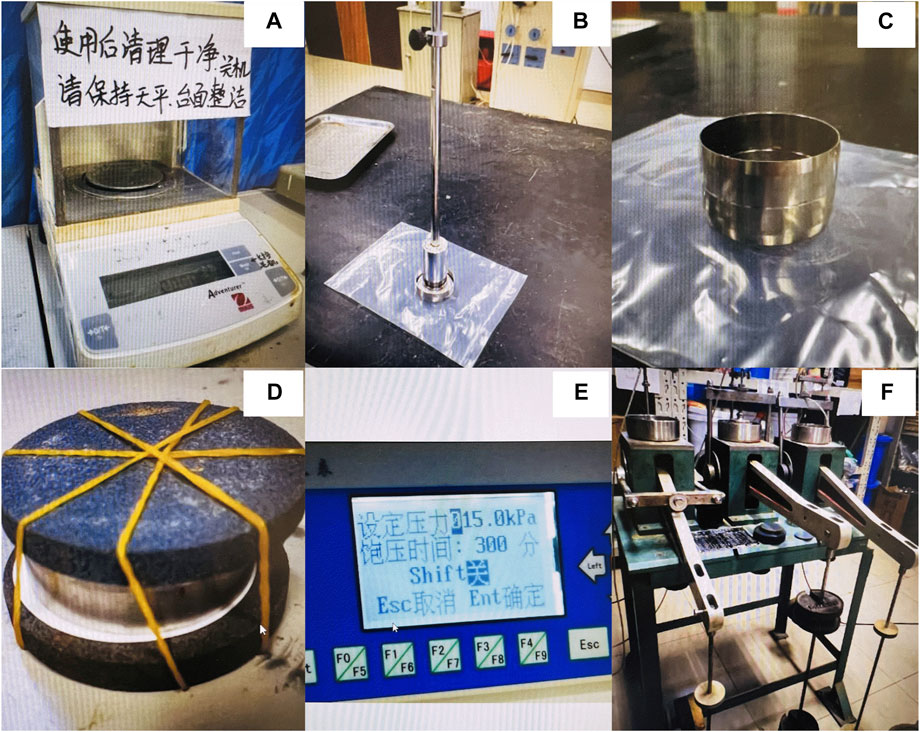
FIGURE 10. DDCL experiment equipment (A) electronic balance, (B) compacter, (C) consolidation container, (D) soil sample to be saturated, (E) rock vacuum saturated water test device, and (F) single-lever arm oedometer.
The deformation of DDCL and the dimensionless deformation curve with time are plotted in Figure 11. The coordinates of the matching point for DDCL are
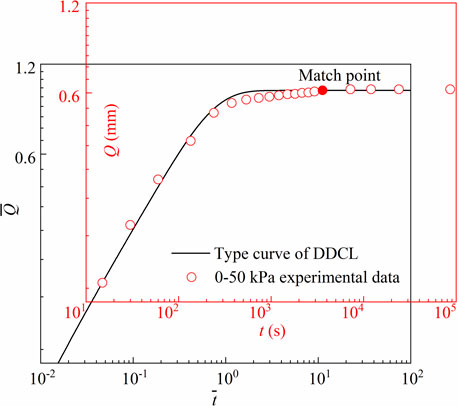
FIGURE 11. Determination of parameters of DDCL by the type curve approach.
Figure 12 compares the deformations of DDCL under two load stages (50–100–200 kPa) by using the hydraulic parameters determined by the type curve approach. Similar to the performance of the SDCL, when the load stage is 50–100 kPa, the calculated
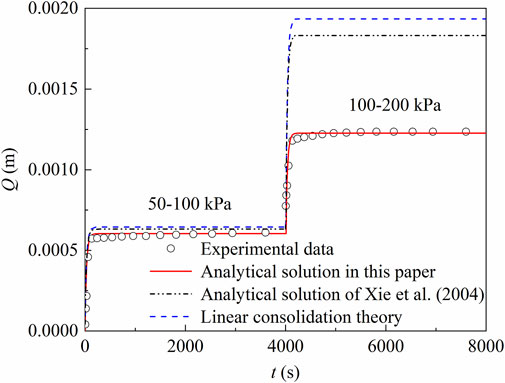
FIGURE 12. Comparison of predicted and measured deformation of DDCL.
6 Conclusion
In this study, analytical solutions (ignoring creep effects) for SDCL and DDCL undergoing non-linear consolidation, excess pore water pressure, and deformation under overlying load conditions were derived. Combined with the case analysis based on the analytical solution presented in this paper, it is found that under the condition of an overlying load, the deformation in SDCL is equal to that in DDCL. There is a lag in
7 Open research
Parameter values in Sections 2, 3, and 4 are available through Wu et al. (2010) (https://doi.org/10.16285/j.rsm.2010.01.045) and Li et al. (2017) (https://doi.org/10.1002/hyp.11373). The test data in Section 5.2 are available through Zhuo et al. (2022) (https://doi.org/10.1016/j.jhydrol.2022.127994). The test data in Section 5.3 are available through the repository of Dryad (https://datadryad.org/stash/share/frvva1Jd1ETIo-VSViK4-ChOTT6hW9i9EjP2Foj1ExA) and the supporting information files.
Data availability statement
The datasets presented in this study can be found in online repositories. The names of the repository/repositories and accession number(s) can be found in the article/Supplementary Material.
Author contributions
RW is responsible for manuscript preparation and data collection; ZL is responsible for the preparation, data correction and approval of manuscripts, as well as providing fund support; MX, QZ, WI, and HL are responsible for the correction and approval of manuscripts.
Funding
This study was financed by the Open Fund of State Key Laboratory of Geohazard Prevention and Geoenvironment Protection (Chengdu University of Technology) (SKLGP2021K023), Sichuan Provincial Science and Technology Department Youth Fund (2023NSFSC0802), the National Natural Science Foundation of China (41702253) and the China Scholarship Council for working at the University of Waterloo as a visiting scholar. WA. I appreciates the support of the Discovery Grant from the Natural Sciences and Engineering Research Council of Canada (NSERC), which made this collaboration possible.
Conflict of interest
The authors declare that the research was conducted in the absence of any commercial or financial relationships that could be construed as a potential conflict of interest.
Publisher’s note
All claims expressed in this article are solely those of the authors and do not necessarily represent those of their affiliated organizations, or those of the publisher, the editors and the reviewers. Any product that may be evaluated in this article, or claim that may be made by its manufacturer, is not guaranteed or endorsed by the publisher.
Supplementary material
The Supplementary Material for this article can be found online at: https://www.frontiersin.org/articles/10.3389/feart.2023.1131128/full#supplementary-material
References
Abdullah, W. S., Alshibli, K. A., and Al-Zou'bi, M. S. (1999). Influence of pore water chemistry on the swelling behavior of compacted clays. Appl. Clay Sci. 15 (5-6), 447–462. doi:10.1016/S0169-1317(99)00034-4
Chen, P. S., Li, J. C., Huang, M. H., and Li, D. J. (2021). Consolidation of viscoelastic soil with vertical drains for continuous drainage boundary conditions incorporating a fractional derivative model. Front. Mater. 8, 670150. doi:10.3389/fmats.2021.670150
Davis, E. H., and Raymond, G. P. (1965). A non-linear theory of consolidation. Geotechnique 15 (2), 161–173. doi:10.1680/geot.1965.15.2.161
Deng, Y. F., Yue, X. B., Cui, Y. J., Shao, G. H., Liu, S. Y., and Zhang, D. W. (2014). Effect of pore water chemistry on the hydro-mechanical behaviour of Lianyungang soft marine clay. Appl. Clay Sci. 95, 167–175. doi:10.1016/j.clay.2014.04.007
Gibson, R. E., England, G. L., and Hussey, M. J. L. (1967). The theory of one-dimensional consolidation of saturated clays. Geotechnique 17 (3), 261–273. doi:10.1680/geot.1967.17.3.261
Gibson, R. E., Schiffman, R. L., and Cargill, K. W. (1981). The theory of one-dimensional consolidation of saturated clays. II. Finite nonlinear consolidation of thick homogeneous layers. Geotechnique 18, 280–293. doi:10.1139/t81-030
Gorelick, S. M., and Zheng, C. (2015). Global change and the groundwater management challenge. Water Resour. Res. 51 (5), 3031–3051. doi:10.1002/2014wr016825
Gregory, A. S., Whalley, W. R., Watts, C. W., Bird, N. R. A., Hallett, P. D., and Whitmore, A. P. (2006). Calculation of the compression index and precompression stress from soil compression test data. Soil Tillage Res. 89 (1), 45–57. doi:10.1016/j.still.2005.06.012
Guo, H. P., Hao, A. B., Li, W. P., Zang, X. S., Wang, Y. L., Zhu, J. Y., et al. (2022). Land subsidence and its affecting factors in cangzhou, north China plain. Front. Environ. Sci. 10. doi:10.3389/fenvs.2022.1053362
Guo, Q. N., and Li, H. L. (2015). Terrestrial-originated submarine groundwater discharge through deep multilayered aquifer systems beneath the seafloor. Hydrol. Process. 29 (4), 295–309. doi:10.1002/hyp.10163
Jia, X. Y., Hou, D. Y., Wang, L. W., O'Commor, D., and Luo, J. (2020). The development of groundwater research in the past 40 years: A burgeoning trend in groundwater depletion and sustainable management. J. Hydrology 587, 125006. doi:10.1016/j.jhydrol.2020.125006
Konikow, L. F., and Neuzil, C. E. (2007). A method to estimate groundwater depletion from confining layers. Water Resour. Res. 43 (7), W07417. doi:10.1029/2006wr005597
Li, Z. F., Zhou, Z. F., Chen, Z., Liu, G. Q., and Zhou, C. Y. (2016). An analytical method to estimate groundwater depletion from a confining layer. Nat. Hazards 85 (2), 887–901. doi:10.1007/s11069-016-2609-1
Li, Z. F., Zhou, Z. F., Dai, Y. F., and Dai, B. B. (2019). Contaminant transport in a largely-deformed aquitard affected by delayed drainage. J. Contam. Hydrology 221, 118–126. doi:10.1016/j.jconhyd.2019.02.002
Li, Z. F., Zhou, Z. F., Dai, Y. F., Huang, Y., Guo, Q. N., and Zhou, C. Y. (2017). Contaminant transport in a small deformation aquitard affected by the delayed drainage phenomenon. Hydrol. Process. 31 (24), 4429–4439. doi:10.1002/hyp.11373
Li, Z. F., Zhou, Z. F., Li, M. Y., Zhang, B. R., and Dai, B. B. (2018). Delayed drainage of a largely deformed aquitard due to abrupt water head decline in adjacent aquifer. Geofluids 2018, 1–12. doi:10.1155/2018/2326491
Liu, C., Shi, B., Gu, K., Zhang, T. S., Tang, C. S., Wang, Y., et al. (2021). Negative pore water pressure in aquitard enhances land subsidence: Field, laboratory, and numerical evidence. Water Resour. Res. 58 (1), e2021WR030085. doi:10.1029/2021wr030085
Luo, H., Li, Z. F., Luo, M. L., Zhang, Q., and Illman, W. A. (2020). An analytical method to calculate groundwater released from an aquitard undergoing nonlinear consolidation. Water Resour. Res. 56 (9), e2020WR027320. doi:10.1029/2020wr027320
Ma, B. H., Li, Z., Cai, K., Hu, Z. Y., Zhao, M. H., He, C. B., et al. (2021). An improved nonlinear settlement calculation method for soft clay considering structural characteristics. Geofluids 2021, 1–7. doi:10.1155/2021/8837889
Neuzil, C. E. (1986). Groundwater flow in low-permeability environments. Water Resour. Res. 22 (8), 1163–1195. doi:10.1029/wr022i008p01163
Nicholls, R. J., Beaven, R. P., Stringfellow, A., Monfort, D., Le Cozannet, G., Wahl, T., et al. (2021). Coastal landfills and rising sea levels: A challenge for the 21st century. Front. Mar. Sci. 8. doi:10.3389/fmars.2021.710342
Romero, E., Gens, A., and Lloret, A. (2001). Temperature effects on the hydraulic behaviour of an unsaturated clay. Geotechnical Geol. Eng. 19, 311–332. doi:10.1023/A:1013133809333
Shu, B., Chen, Y., Amani-Beni, M., and Zhang, R. Z. (2022). Spatial distribution and influencing factors of mountainous geological disasters in southwest China: A fine-scale multi-type assessment. Front. Environ. Sci. 10, 1049333. doi:10.3389/fenvs.2022.1049333
Toufigh, M. M., and Ouria, A. (2009). Consolidation of inelastic clays under rectangular cyclic loading. Soil Dyn. Earthq. Eng. 29 (2), 356–363. doi:10.1016/j.soildyn.2008.03.006
Wang, F. Y., Huang, H. W., Yin, Z. Y., and Huang, Q. (2021). Probabilistic characteristics analysis for the time-dependent deformation of clay soils due to spatial variability. Eur. J. Environ. Civ. Eng. 26, 6096–6114. doi:10.1080/19648189.2021.1933604
Wu, J., Xie, X. Y., and Zhu, X. R. (2010). Study of properties of 1-D complex nonlinear consolidation of saturated soils (in Chinese). Rock Soil Mech. 31 (1), 81–86. doi:10.16285/j.rsm.2010.01.045
Xie, K. H., and Leo, C. J. (2004). Analytical solutions of one-dimensional large strain consolidation of saturated and homogeneous clays. Comput. Geotechnics 31 (4), 301–314. doi:10.1016/j.compgeo.2004.02.006
Xie, K. H., Xie, X. Y., and Jiang, W. (2002). A study on one-dimensional nonlinear consolidation of double-layered soil. Comput. Geotechnics 29 (2), 151–168. doi:10.1016/s0266-352x(01)00017-9
Xue, Y. Q., Zhang, Y., Ye, S. J., Wu, J. C., and Li, Q. F. (2005). Land subsidence in China. Environ. Geol. 48 (6), 713–720. doi:10.1007/s00254-005-0010-6
Yan, H. X., Xie, H. J., Wu, J. W., Ding, H., Qiu, Z. H., and Sun, Z. L. (2021). Analytical model for transient coupled consolidation and contaminant transport in landfill liner system. Comput. Geotechnics 138, 104345. doi:10.1016/j.compgeo.2021.104345
Zhang, Y. H., Huo, X. F., and Luo, Y. (2023). Prediction of groundwater pollution diffusion path based on multi-source data fusion. Front. Environ. Sci. 10, 1116309. doi:10.3389/fenvs.2022.1116309
Zhao, Z., Zhou, X. P., and Chen, J. W. (2022). Pore-scale hydraulic properties of virtual sandstone microstructures: Spatial variations and voxel scale effects. Archives Civ. Mech. Eng. 23 (1), 22. doi:10.1007/s43452-022-00566-7
Zhao, Z., and Zhou, X. P. (2022). Digital analysis for pore-scale compressive strength and permeability of foamed cement with realistic microstructures by X-ray-μCT imaging. Constr. Build. Mater. 346, 128456. doi:10.1016/j.conbuildmat.2022.128456
Zhao, Z., and Zhou, X. P. (2020a). Digital voxel-based fracture extraction: Insights to characterization of single fracture flow and anisotropy permeability. J. Nat. Gas Sci. Eng. 84, 103635. doi:10.1016/j.jngse.2020.103635
Zhao, Z., and Zhou, X. P. (2020b). Pore-scale effect on the hydrate variation and flow behaviors in microstructures using X-ray CT imaging. J. Hydrology 584, 124678. doi:10.1016/j.jhydrol.2020.124678
Zhao, Z., Zhou, X. P., and Qian, Q. H. (2021). Dqnn: Pore-scale variables-based digital permeability assessment of carbonates using quantum mechanism-based machine-learning. Sci. China Technol. Sci. 65 (2), 458–469. doi:10.1007/s11431-021-1906-1
Zhao, Z., Zhou, X. P., and Qian, Q. H. (2020). Fracture characterization and permeability prediction by pore scale variables extracted from X-ray CT images of porous geomaterials. Sci. China Technol. Sci. 63 (5), 755–767. doi:10.1007/s11431-019-1449-4
Zhou, X. P., and Zhao, Z. (2019). Digital evaluation of nanoscale-pore shale fractal dimension with microstructural insights into shale permeability. J. Nat. Gas Sci. Eng. 75, 103137. doi:10.1016/j.jngse.2019.103137
Zhou, X. P., Zhao, Z., and Li, Z. (2020). Cracking behaviors and hydraulic properties evaluation based on fractural microstructure models in geomaterials. Int. J. Rock Mech. Min. Sci. 130, 104304. doi:10.1016/j.ijrmms.2020.104304
Zhou, Z. F., Guo, Q. N., and Dou, Z. (2013). Delayed drainage of aquitard in response to sudden change in groundwater level in adjacent confined aquifer: Analytical and experimental studies. Chin. Sci. Bull. 58 (25), 3060–3069. doi:10.1007/s11434-013-5730-5
Zhu, W., Yang, X., He, J., Wang, X., Lu, R., and Zhang, Z. (2021). Investigation and systematic risk assessment in a typical contaminated site of hazardous waste treatment and disposal. Front. Public Health 9, 764788. doi:10.3389/fpubh.2021.764788
Zhuang, C., Yan, L., Zhou, Z. F., Wang, J. G., and Dou, Z. (2021). Estimation of aquitard hydraulic conductivity and skeletal specific storage considering non-Darcy flow. Water Sci. Eng. 14 (4), 269–276. doi:10.1016/j.wse.2021.09.003
Zhuang, C., Zhou, Z. F., Illman, W. A., Dou, Z., and Wang, J. G. (2020). Parameter estimation of an overconsolidated aquitard subjected to periodic hydraulic head variations within adjacent aquifers. J. Hydrology 583, 124555. doi:10.1016/j.jhydrol.2020.124555
Zhuang, C., Zhou, Z. F., Zhan, H. B., and Wang, G. Y. (2015). A new type curve method for estimating aquitard hydraulic parameters in a multi-layered aquifer system. J. Hydrology 527, 212–220. doi:10.1016/j.jhydrol.2015.04.062
Appendix A Derivation of Eq.11
Using the substitution method:
Substituting Eq. A-1 into –Eq.10, can simplify the original equation to
By applying the boundary subordination processing to Eq. A-5:
The governing equations and boundary conditions for
Using the separation of variables method, the solution to Eq. A-8–Eq. A-11 can be derived as:
Combining Eq. A-7 with Eq. A-12, the solution to Eq. A-2 can be given,
Finally, the solution to Eq. 11 is obtained by combining Eq. A-1 and Eq. A-13.
Appendix B Derivation of Eq. 12
As the variable passing method in Appendix A, the independent variable
The corresponding solution procedure is the same as given in Appendix A, and the solution to Eq. B-1–Eq. B-4 can be obtained as:
Finally, the solution to Eq. 12 is obtained by combining Eq. A-1 and Eq. B-5.
Keywords: non-linear consolidation clay layer, analytical solution, deformation, hydraulic parameters, type curve method
Citation: Wang R, Li Z, Xu M, Zhang Q, Illman WA and Li H (2023) Determination of hydraulic parameters of non-linear consolidation clay layers by type curve method. Front. Earth Sci. 11:1131128. doi: 10.3389/feart.2023.1131128
Received: 24 December 2022; Accepted: 13 February 2023;
Published: 07 March 2023.
Edited by:
Xiaoping Zhou, Chongqing University, ChinaReviewed by:
Nan Xiao, Changsha University of Science and Technology, ChinaJinguo Wang, Hohai University, China
Yundong Shou, Wuhan University, China
Copyright © 2023 Wang, Li, Xu, Zhang, Illman and Li. This is an open-access article distributed under the terms of the Creative Commons Attribution License (CC BY). The use, distribution or reproduction in other forums is permitted, provided the original author(s) and the copyright owner(s) are credited and that the original publication in this journal is cited, in accordance with accepted academic practice. No use, distribution or reproduction is permitted which does not comply with these terms.
*Correspondence: Zhaofeng Li, bGl6aGFvZmVuZzE3QGNkdXQuZWR1LmNu