
95% of researchers rate our articles as excellent or good
Learn more about the work of our research integrity team to safeguard the quality of each article we publish.
Find out more
ORIGINAL RESEARCH article
Front. Earth Sci. , 09 February 2023
Sec. Environmental Informatics and Remote Sensing
Volume 11 - 2023 | https://doi.org/10.3389/feart.2023.1130294
This article is part of the Research Topic Coal and Rock Dynamic Disasters: Advances of Physical and Numerical Simulation in Monitoring, Early Warning, and Prevention View all 15 articles
 Caihua Li
 Xuepeng Li*
Due to its faster implementation and potential cost savings for estimating the bearing capacity of PHC pipe piles, the High Strain Dynamic Test (HSDT) offers an alternative approach to Static Load Test (SLT). The report presents a bearing capacity study via those methods with a sliding micrometer. And a Pile Driving Analyzer (PDA) imported from the United States is employed, to determine the design parameters of pile foundation engineering and provide the error sources of bearing capacity. Sliding micrometers with cone-shaped rings are embedded in the inner side of the pile piles every 1 m for measuring the strain. The law of stress and strain at various depths during loading is presented in this paper. As a new concept, the “inflection point” is proposed by the relationship between shaft resistance and relative displacement of pile-soil. By comparing the SLT and HSDT, the relationship between toe resistance and settlement of pile is demonstrated. This paper analyses the reliability and precision, and explore the error source so as to provide theoretical evidence for trail-pile testing in future. And the error of bearing capacity between SLT and HSDT with CAPWAP studies shows that the HSDT could provide adequate results for assessing the bearing capacity of PHC pipe piles.
At present, static load test (SLT) and high strain dynamic test (HSDT) are two methods to determine the bearing capacity of base piles (Rausche et al., 1985; Alawneh et al., 2001). Static load test is the most commonly employed technology as the more accurately determination, but it is time-consuming and may be costly for engineering geology (Smith, 1960; Aghayarzadeh et al., 2020; Alwalan and Naggar, 2020). As a relatively new developed technology, high strain dynamic testing has the advantages of fast, convenient and inexpensive (Heins et al., 2020). In recent years, compared with the traditional static load test, the practice of engineering shows that the error of high strain dynamic test with high strain curve match method (CMM) is within ±20% (Choe et al., 2002; Long, 2007; Svinkin, 2019). Therefore, it is a widely acknowledged testing technique for pile detection, and is frequently referenced in the ASTM D4945 (ASTM D4945, 2000) as a most basic of test need (Briaud and Tucker, 1984; ASTM D4945, 2000).
Interpretation of HSDT can be accomplished using direct or indirect methods (Chen et al., 2022). The case method adopted by pile driving analyzer (PDA) is an example of the direct method. The PDA is used with the HSDT. It contains a computer-based program for data acquisition and analysis at the field from the case method (Zhao, 2005). The Case Wave Analysis Program (CAPWAP) is applied for an analysis to correlate the dynamic to static capacity of the piles (Ding et al., 2013). It executes the analysis based on the concept of stress wave propagation with signal matching method to find a reasonable solution (Green and Kightley, 2005a).
Li and Gao (Li and Gao, 2012) tested 56 piles with high strain dynamic test. However, the calculation model of pile-soil was assumed and simplified with the case method (Rajagopal et al., 2012). Considering the pile was an elastic rod with one-dimensional uniform impedance, only the damping of the soil at the toe of pile was taken into account, so the dynamic resistance of the soil at the shaft resistance of pile was disregarded (Likins et al., 1996; Livneh and EL Naggar, 2008). The curve match method not only assumes the rigid soil adjacent to pile but also considers the damping attenuation and deficiency of pile shaft factors (Meyerhof and Murdock, 1953; Gates, 1957; Smith, 1960; Salgado et al., 2017). Mohammed (Mohammed, 2013) examined the difference between high strain dynamic and static load tests of helical piles in cohesive soils. Heins and Grabe (Heins and Grabe, 2019) proposed a new technique based on the finite element method, which accurately captured the key aspects for HSDT results and was capable of deriving the pile bearing capacity. Green and Kightley (Green and Kightley, 2005b) studied the CAPWAP by the theory and engineering application.
For the widespread use of PHC pipe piles in the Chancheng distruct in China, it is crucial to verify the dependability and applicability of HSDT. This paper presents the development and applications of bearing capacity of PHC pipe piles based on HSDT, SLT with sliding micrometer. This paper also presents a new concept of “inflection point” through the curve between shaft resistance and relative displacement of pile-soil. By comparing the error in bearing capacity between SLT and HSDT, the reliability and surveying precision of the curve match method is analyzed, to reasonably determine the design parameters of pile foundation engineering in Chancheng distrust in China.
The Chancheng test site is located in Foshan City, Guangdong Province, China. The soil layers consist of plain fill, silty, muddy soil, medium coarse sand, silty, and strongly weathered mudstone from top to bottom. Table 1 gives the soil properties of test site. And the results of standard penetration test (SPT) of various soil layers are depicted in Figure 1.
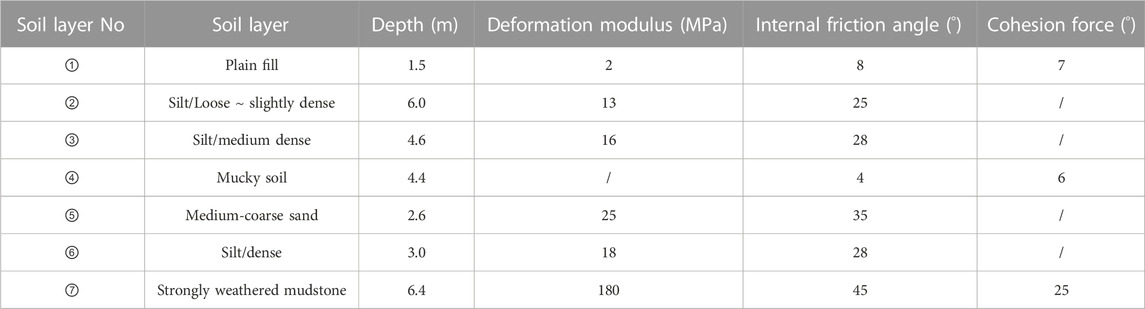
TABLE 1. Soil properties of test site.
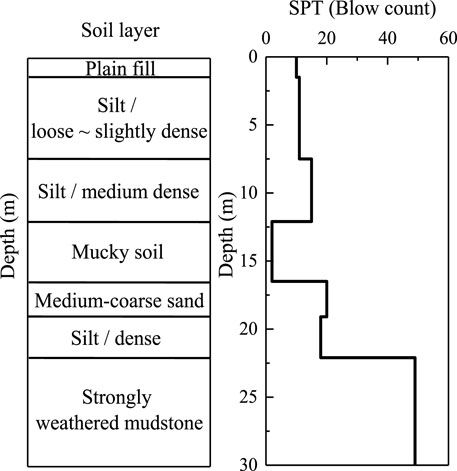
FIGURE 1. The standard penetration test results of different soil layers.
The test contains eight pipe piles with 400 mm or 500 mm diameter. Figure 2 depicts the ground plan of the test piles. The spacing between each pile is 5 m. High strain dynamic tests and static load tests are carried out on piles 1# to 8# piles. For the purpose of analyzing the variation law of the axial force and deformation of pile during the study of static load test, slide micrometers are embedded into the 1#, 3#, 5#, 6#, and 7# piles, and parallel embedded in symmetrical parts.
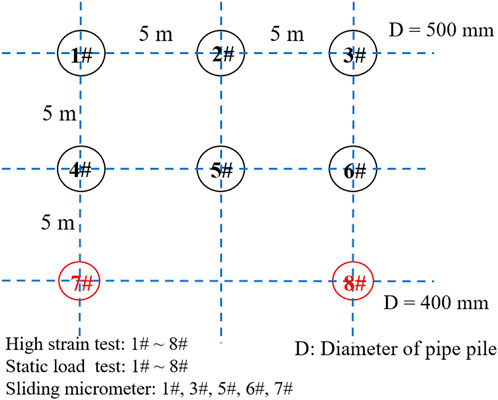
FIGURE 2. Ground plan of the test piles.
The 1# and 2# pile length is 23 m, 3# pile length is 24 m, and 4#, 5#, 6#, 7#, and 8# pile length is 25 m. The test piles were driven by D50 diesel hammer pile driver. The construction parameters are shown in Table 2. The hammering can be terminated when the final three hammer penetrations fulfill the specification of the design.
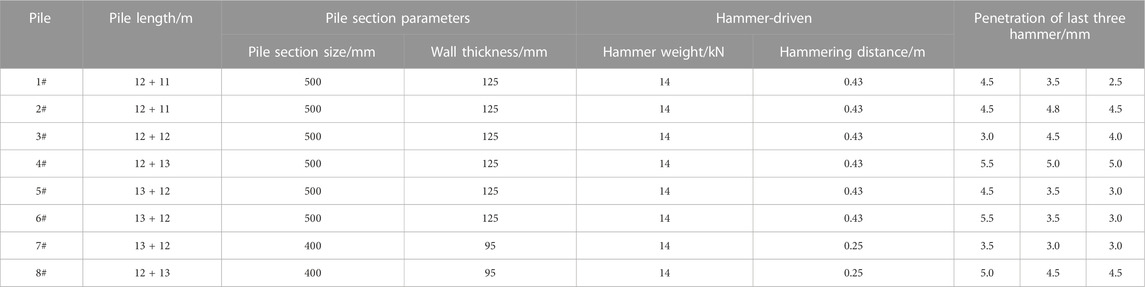
TABLE 2. Construction parameters of test piles.
The high strain dynamic test is done several months after pile installation. The high strain dynamic test employs the eighth generation American-made Pile Driving Analyzer (PDA), free fall hammer hammering, and theodolite testing penetration (Figure 3). Each pile was hammered with an 80 kN hammer at a drop distance of 0.8 m–2.0 m, and four to five times. The hammering distance starts from 0.8 m and gradually increases until the pile end resistance is fully developed. The data sampling time is 200 m and sampling frequency is 10 kHz. According the JGJ106-2003 of Chinese technical code for testing of building foundation piles (JGJ106 –2003, 2003), two full-bridge strain sensors and two accelerometer sensors are affixed externally at diametrically opposite direction on the pile near ground surface about 1.0 m.
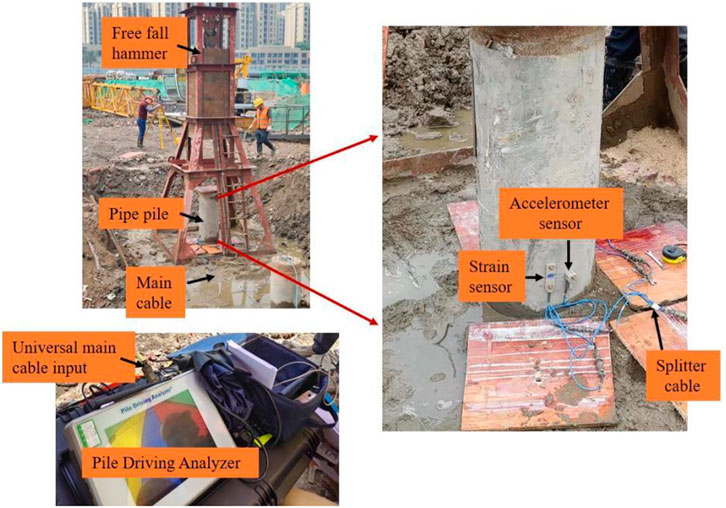
FIGURE 3. The test site of HSDT with PDA.
To perform CAPWAP automatic signal matching analysis, good quality high strain dynamic test data are required. An assumption of unknown soil parameters is made and tested by performing an analysis with one of the measured quantities as a top boundary condition. If there is disagreement between the other measurement and its calculated counterpart, the calculation is repeated with a corrected set of soil model parameters.
The static load test is conducted 30 days after the high strain dynamic test. The static load test utilizes the conventional platform stacking method and the slow maintenance load method to measure the settlement of the pile cap via the displacement sensor located on the pile top. The initial stage of loading is 800 kN, and then each subsequent load is raised by 400 kN until the termination loading condition of experiment is reached, and each unloaded stage has a force of 800 kN. After each level of load is applied, the settlement of pile top shall be measured and read according to the 5th, 10th, 20th, 35th, 50th, and 65th minutes, and then measured every 30 min.
Through the incorporated sliding micrometer on the inner side of the pile body (1#、3#、5#、6#, and 7# pile), a cone-shaped measuring ring is mounted on the HPVC measuring pipe every 1 m. The strain of the pile body under various loads of static load test is measured, and the axial force of the pile body of each test section is computed so that friction, end resistance, and pile-soil relative displacement may be determined. Figure 4 depicts the borehole instrumentation with line measurement instruments (measuring mark and casing).
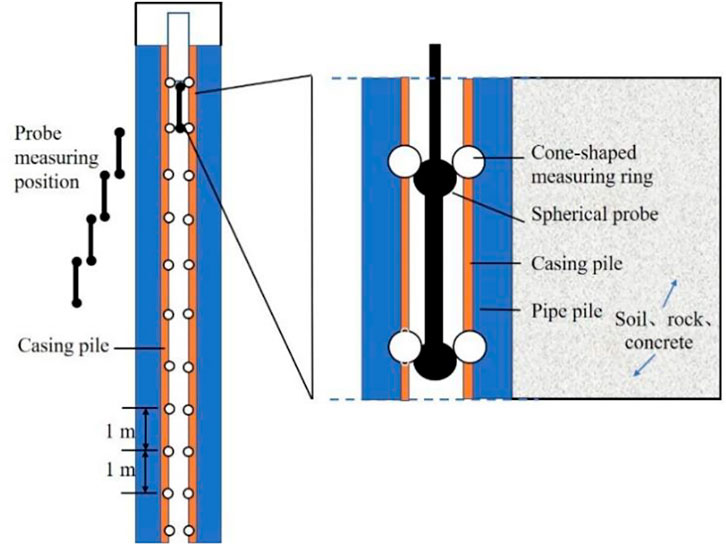
FIGURE 4. Schematic diagram of embedding sliding micrometer.
The upward traveling resistance waves of pile are presented in Figure 5, and the resistance of the upward wave Fu is depicted in Eq. 1.
where Ri is shaft resistance, Rd is the resistance, Fd1 is the resistance of the traveling downward wave towards the pile toe at time t1. The t1 is designated as the time when the impact wave passes the sensor location and the time t2 is designated as the time when the toe reflected impact wave returns to the sensor location (t2 is equal to t1 plus 2 L/c) (Green and Kightley, 2005a; Zhao, 2005; Ding et al., 2013).
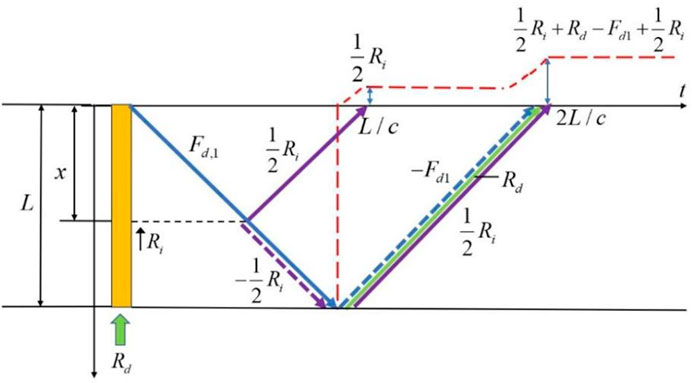
FIGURE 5. The upward traveling resistance waves of pile (Smith, 1960).
Figure 6 depicts the typical curve of HSDT in this site and the results are obtained from with CAPWAP analysis. The high strain dynamic test with CAPWAP analysis performs a wave equation form by using the velocity records as pile-top boundary conditions. The measured (Msd) force value and velocity value with CAPWAP analysis are shown in Figure 6. The cases exhibit a good proportionality between force and velocity impedance at the onset of impact. Two curves overlap well before the first peak, which shows the success of fitting between force and velocity curves. The maximum of force and velocity is 5211.43 KN and 3.63 m/s respectively. For the existence and development of shaft resistance, the two curves are seen clearly to depart sharply after the first peak. And the two curves are seen to depart sharply near the pile toe from the force time history.
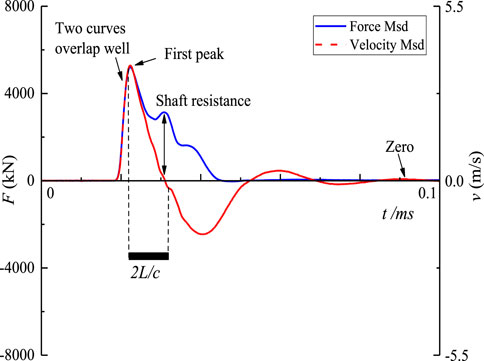
FIGURE 6. The typical curve of high strain dynamic test.
Figure 7 shows the typical curves of wave up (WU) and wave down (WD) in the site. The pile top can be considered as the starting point of the rising of WD, while the pile toe represents the starting point of the falling of WU. The duration of 2 L/c is clearly illustrated in Figures 6, 7.
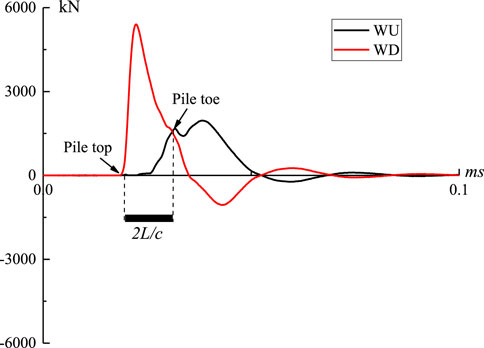
FIGURE 7. The typical curve of wave up and wave down.
Figure 8 depicts the Q-s curve results of static loading The 3#、5#、6#, and 7# piles have reached the state of failure, and the curves exhibit steep drop characteristics. In addition, the curves demonstrate that the four piles are the typical friction piles. The ultimate bearing capacity of a single pile is the load value at the starting point of a steep drop section, according to the Chinese building foundation testing code (Briaud and Tucker, 1984). Taking list 3# pile as an example, the beginning of a sharp decline in settling begins below 4,800 kN. The ultimate bearing capacities of 3#、5#、6#, and 7# piles are therefore 4,800 kN, 5200 kN, 5600 kN, and 2,400 kN, respectively.
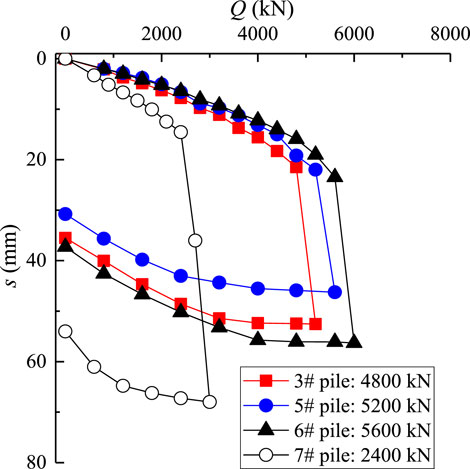
FIGURE 8. The Q-s curve results of static loading.
The ratio of settlement value to pile diameter is displayed in Table 3 for all test pipe piles. Extensive practical experience demonstrates that the ultimate load may occur only when the settlement reaches 10% of the pile’s diameter (Smith, 1960). The ratio of settlement to pile diameter for the majority of piles exceeds 10%, and the max ratio value is 16.99% from 7# pile. Considering the steep drop characteristics and highly weathered argillaceous siltstone of the pile tip bearing stratum, it can be concluded that the bearing capacity of the foundation was completely developed during the static load test.
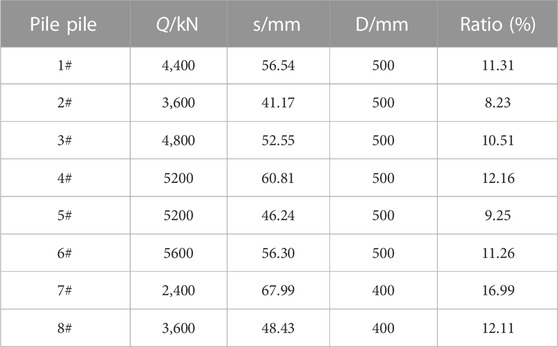
TABLE 3. The ratio of settlement value to pile diameter.
Figure 9 illustrates the s-lgt curve results of 3# pile from static loading. When the load is increased from 800 kN to 4,800 kN (the twelfth load), the settlement does not decrease appreciably and a steep decline trend do not appear. However, when the load is increased to 5200 kN (the thirteenth load), the curve demonstrates a clear decreasing tendency. Consequently, the ultimate bearing capacity from the s-lgt curve results is also 4,800 kN, which is equal to the result from the Q-s curve. During the unloading test, the maximum settlement is 52.55 mm, and the ultimate residual settlement is 35.50 mm. Maximum rebound value is 17.05 mm, and the rate of rebound is 32.45%.

FIGURE 9. The s-lgt curve results from static loading.
The strain of the pile shaft axis under various loads can be measured continuously by embedding test elements in the pile body. The internal force test of pile body is calculated by the corresponding strain. It can be seen from Figure 10 demonstrates that under the condition of small load (800 kN), the strain change from the pile body to the pile end is minimal. The pile stress is the largest at the pile depth of about 12 m, and the stress at the pile end is the smallest, but the overall stress of the pile body is relatively uniform; as the load on the top of the pile increases, the strain around the pile body tends to be unevenly distributed. When the load on the top of the pile is 5200 kN, the strain at a distance of 12 m from the top of the pile is extremely high, and drops abruptly downward. The construction record indicates that 12 m is the piles' connecting point. When it reaches approximately 18 m and 21 m from pile top, it reaches a small peak, but the measured strain is less than 12 m. It decreases sharply to the minimum at the bottom of the pile, indicating that the pile body begins to enter the plastic stage under high load.
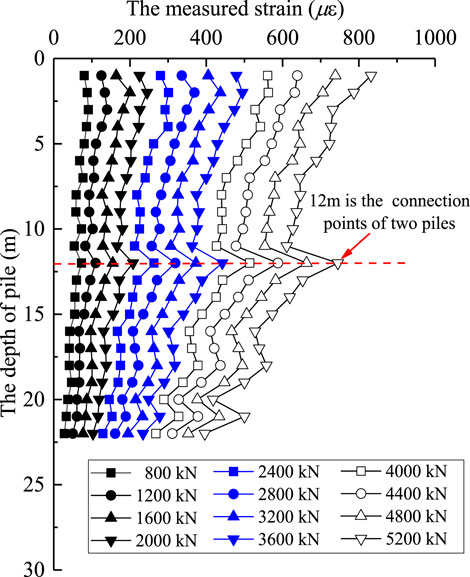
FIGURE 10. The measured strain curve of pile under various loads from 3# pile.
Figure 11 demonstrates that the axial stress of the pile body decreases as the increasing of the test pile depth under the loading of the pile top. This indicates that the pile top load is mainly offset by the pile shaft resistance, which is consistent with the relevant characteristics of friction piles.
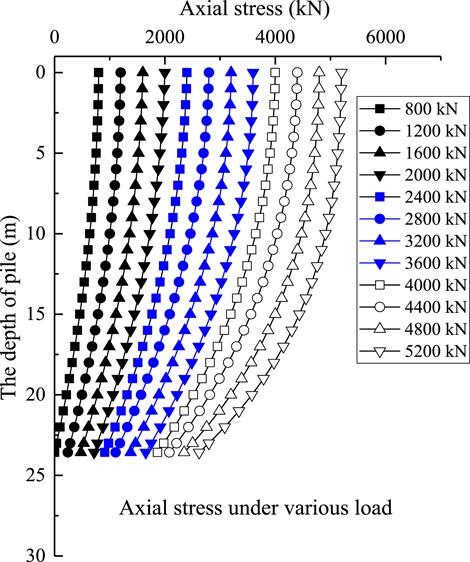
FIGURE 11. The axial stress curve under various loads from 3# pile.
The soil strength is reflected by deformation and increases in proportion to the degree of deformation. Likewise, the friction resistance increases as the relative displacement between piles and soil. Figure 12 demonstrates that as the load increases, so does the friction resistance. At different depths of the same soil layer, the friction resistance varies, and the friction resistance of each soil layer increases to varying degrees along the pile depths. In contrast to prior research, in this test the friction resistance in the deep portion of the pile has not decreased, which is mainly due to the hard soil layers of medium coarse sand, silty sand, and severely weathered mudstone.
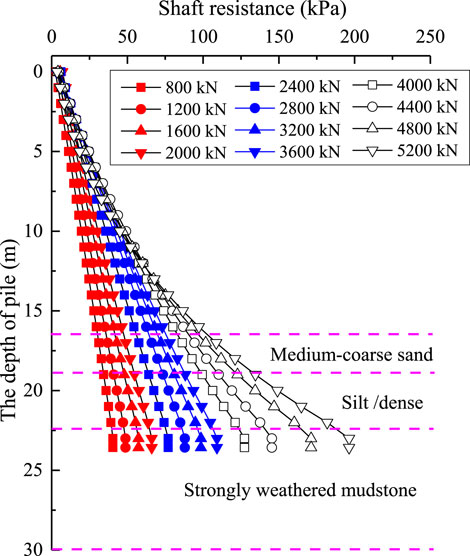
FIGURE 12. The shaft resistance curve under various loads from 3# pile.
Before loading 4,800 kN, the load on the pile top is provided by the friction resistance of the pile body, the settlement of the pile is the compression of the pile body, and the toe resistance of the pile is not exerted as shown in Figure 13. With the increase of the load to 4,800 kN, the cumulative deformation and the settlement curves of the pile top are separated, the pile tip begins to subside, and the toe resistance gradually increases with the load. a is the settlement caused by pile subsidence.
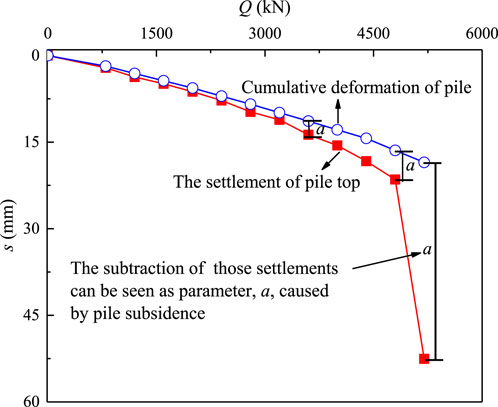
FIGURE 13. The curve of the deformation or settlement and Q value.
Figure 14 depicts the curve between relative displacement of pile-soil and shaft resistance at the base of each soil layer. The pile shaft resistance is closely related to the relative displacement of the pile-soil. Regardless of the soil layer, the pile shaft resistance increases as the pile-soil relative displacement increases. When the relative displacement of pile-soil reaches a certain extent (Inflection point), the change in pile shaft resistance is negligible, indicating that the pile shaft resistance is fully mobilized. However, the shaft resistance still has an increasing trend, but the increasing trend is small, indicating that the pile shaft resistance has not yet been fully mobilized, such as in the soil layer composed of medium-coarse sand, silt, and strongly weathered mudstone. And this phenomenon is comparable to the research conclusion reached by Huang et al. (2008) (JGJ106 –2003, 2003). As a novel notion, the inflection point is crucial for evaluating the relationship between shaft resistance and displacement of pile.
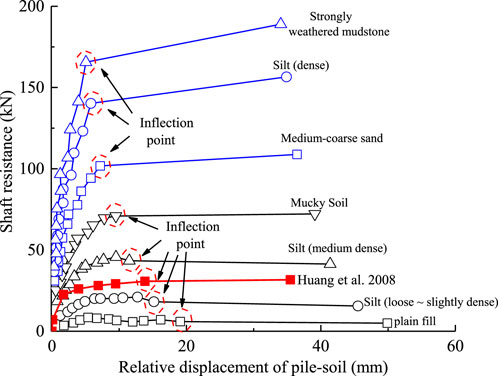
FIGURE 14. The curve between shaft resistance and relative displacement of pile-soil.
Figure 15 depicts the relationship curve between unit toe resistance and toe displacement of 3#, 5# and 6# piles, derived based on the axial stress test results from static load test. In accordance with the rule depicted in Figure 14, soil resistance is proportional to displacement. Under the same displacement, when the pile toe displacement is small, the toe resistance calculated by the high strain dynamic test is less than that calculated by the static load test. However, when the displacement is large, the toe resistance calculated by the high strain dynamic test is higher than that calculated by the static load test. Due to the difference in soil resistance, the settlement calculated by dynamic test is greater than that measured by static load test when the vertical load is small (pile displacement is small), whereas the settlement calculated by dynamic test is smaller than that measured by static load test when the load is large (pile displacement is large).
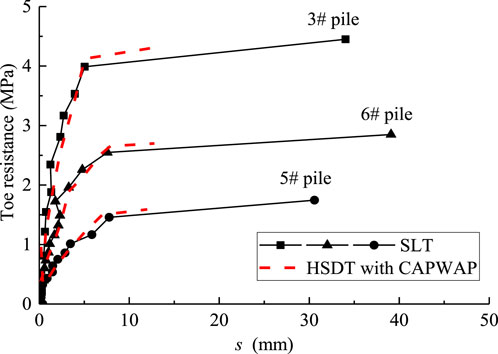
FIGURE 15. Relation between toe resistance and settlement of pile toe.
Table 4 displays the average value of unit friction resistance of each soil layer from each of the five piles (1#、3#、5#、6#、and 7#). The test results of 5 test piles indicate that the unit friction resistance of the upper soil layer measured by a slide micrometer is greater than that measured by a high strain dynamic test, but those of the deeper soil layer tested are smaller than that from the high strain dynamic test; the friction resistance of the soil layer is closely related to its depth.
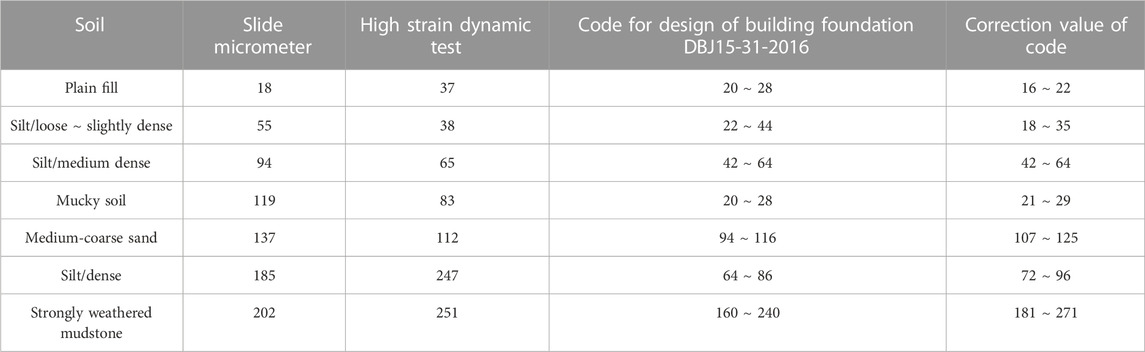
TABLE 4. Average value of unit friction resistance of each soil layer (kPa).
Figure 16 demonstrates the Q-s curve of the test pile. When the pile top load is small, the settlement calculated by high strain is close to the measured result of static load test; when the pile top load is large, especially when the pile is close to the failure condition, the settlement calculated by high strain dynamic test is obviously less than the static load test result. Table 5 compares the results of the high strain dynamic test and static load test. The errors from high strain dynamic test and static load test are within 15%.
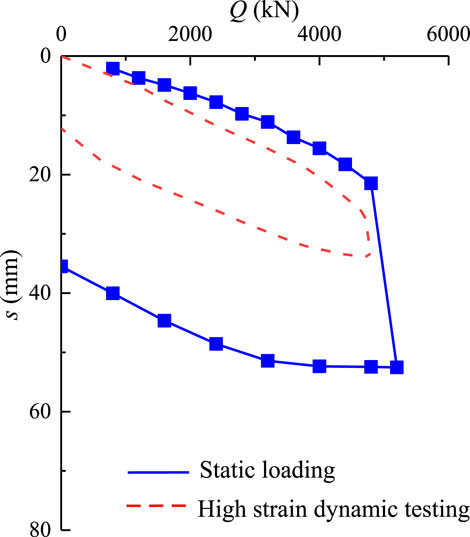
FIGURE 16. The Q-s curve of test pile.
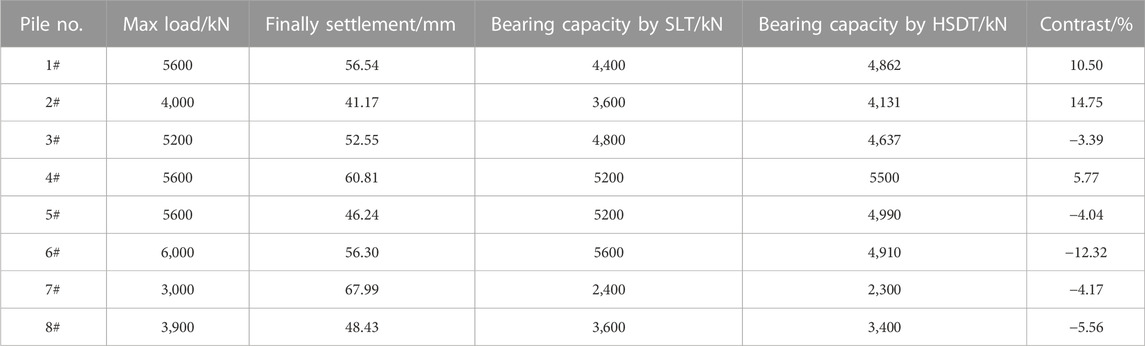
TABLE 5. The contrast from test results by SLT and HSDT.
The bearing capacity of PHC pipe piles in Chancheng district was successfully completed via high strain dynamic testing and static load test. This paper investigated a suitable tool HSDT using the PDA and SLT with the sliding micrometer. In Chancheng district of China, CAPWAP analyses by an American-imported PDA tool were successfully completed, and signal matching was accomplished. The following specific conclusions may be drawn.
1. A new concept of “inflection point” is proposed between shaft resistance and relative displacement of pile-soil. The pile shaft resistance increases as the pile-soil relative displacement increases. When the relative displacement of pile-soil increases to a certain extent, that is “Inflection point”, the change of pile shaft resistance is negligible.
2. The relationship between toe resistance and settlement of pile is shown by comparing the SLT and HSDT. when the pile toe displacement is small, the toe resistance calculated by HSDT is lower than that by SLT, while when the displacement is large, the toe resistance calculated by HSDT is higher than that by SLT.
3. CAPWAP analysis were successfully completed and signal matching was achieved. The error between the SLT and HSDT is small, and within the acceptable range of 15%. It indicates that the HSDT could provide suitable results to assess the bearing capacity of PHC pipe piles in Chancheng district.
The raw data supporting the conclusions of this article will be made available by the authors, without undue reservation.
XL is mainly responsible for revising manuscripts, project managements and can be used as the corresponding author. CL is mainly responsible for research methods, data analysis and draft writing, and can be the first author.
Majority of the work presented in this paper was funded by the National Natural Science Foundation of China (Grant No. 41877231).
The authors declare that the research was conducted in the absence of any commercial or financial relationships that could be construed as a potential conflict of interest.
All claims expressed in this article are solely those of the authors and do not necessarily represent those of their affiliated organizations, or those of the publisher, the editors and the reviewers. Any product that may be evaluated in this article, or claim that may be made by its manufacturer, is not guaranteed or endorsed by the publisher.
Aghayarzadeh, M., Khabbaz, H., Fatahi, B., and Terzaghi, S. (2020). Interpretation of dynamic pile load testing for open-ended tubular piles using finite-element method. Int. J. Geomechanics 20 (2), 1–14. doi:10.1061/(ASCE)GM.1943-5622.0001564
Alawneh, A. S., Nusier, O., Malkawi, A., and Al-Kateeb, M. (2001). Axial compressive capacity of driven piles in sand: A method including post-driving residual stresses. Can. Geotechnical J. 38 (2), 364–377. doi:10.1139/t00-104
Alwalan, M. F., and Naggar, M. E. (2020). Analytical models of impact force-time response generated from high strain dynamic load test on driven and helical piles comput. geotechnics 11, 128. doi:10.1016/j.compgeo.2020.103834
ASTM D4945 (2000). Standard test method for high-strain dynamic testing of piles. West Conshohocken, PA, USA: ASTM Int.
Briaud, J. L., and Tucker, L. (1984). Piles in sand - a method including residual-stresses. J. geotechnical engineering-ASCE 110 (11), 1666–1680. doi:10.1061/(ASCE)0733-9410(1984)110:11(1666)
Chen, R. B., Zhang, J. C., Chen, Z. Y., and Zhang, X. (2022). New mechanical model for evaluating bearing capacity of prestressed pipe piles in soil: Effect of soil layer. J. Test. Eval. 50 (3), 1–16.
Choe, J., Hans, C., and Wold, J. (2002). Pile driving analysis for top hammering and bottom hammering. J. Geotechnical Geoenvironmental Eng. 128 (2), 174–182. doi:10.1061/(asce)1090-0241(2002)128:2(174)
Ding, W., Liu, Q., Wang, B. Y., Sun, K. K., and Sui, F. T. (2013). Determining the pile bearing capacity by the curve match method of high strain dynamic testing. Appl. Mech. Mater. Trans Tech Publ. Switz. 438, 1414–1418. doi:10.4028/www.scientific.net/amm.438-439.1414
Green, T. A. L., and Kightley, M. L. (2005a). “CAPWAP testing - theory and application,” in Proceedings of the 16th International Conference on Soil Mechanics and Geotechnical Engineering: Geotechnology in Harmony with the Global Environment, Osaka, Japan, 2115–2118.
Heins, E., Bienen, B., Randolph, M. F., and Grabe, J. (2020). Effect of installation method on static and dynamic load test response for piles in sand. Int. J. Phys. Model. Geotechnics 2 (1), 1–23. doi:10.1680/jphmg.18.00028
Heins, E., and Grabe, J. (2019). FE-based identification of pile–soil interactions from dynamic load tests to predict the axial bearing capacity. Acta Geotech. 14, 1821–1841. doi:10.1007/s11440-019-00804-y
Huang, L. J., Lin, Y. X., Cai, J., and Wan-qing, Z. (2008). Dynamic and static comparative analyses of settlements of overlength PHC pipe piles. Rock Soil Mech. 29 (2), 507–516. doi:10.3901/JME.2008.10.294
JGJ106–2003 (2003). Technical code for testing of building foundation piles. Beijing China: China Architecture and Building Press. (in Chinese).
Li, Z. L., and Gao, H. Y. (2012). The comprehensive application of high-low strain test in detecting pile foundations. Appl. Mech. Mater. 170, 191–194. doi:10.4028/www.scientific.net/AMM.170-173.1917
Likins, G., Rausche, F., and Thendean, G. (1996). “CAPWAP correlation studies,” in Proceedings of the Fifth International Conference on the Application of Stress Wave Theory to Piles, Orlando, FL, USA, 447–455.
Livneh, B., and El Naggar, M. H. (2008). Axial testing and numerical modeling of square shaft helical piles under compressive and tensile loading. Can. Geotechnical J. 45 (8), 1142–1155. doi:10.1139/t08-044
Long, M. (2007). Comparing dynamic and static test results of bored piles. Geotech. Eng. 160 (1), 43–49. doi:10.1680/geng.2007.160.1.43
Meyerhof, G. G., and Murdock, L. J. (1953). An investigation of the bearing capacity of some bored and driven piles in london clay. Geotechnique 3, 267–282. doi:10.1680/geot.1953.3.7.267
Mohammed, S. (2013). Comparison between high strain dynamic and static load tests of helical piles in cohesive soils. Soil Dyn. Earthq. Eng. 54, 20–30. doi:10.1016/j.soildyn.2013.07.010
Rajagopal, C., Solanki, C. H., and Tandel, Y. K. (2012). Comparison of static and dynamic load test of pile. Electron. J. Geotechnical Eng. 17, 1905–1914.
Rausche, F., Goble, G. G., and Likins, G. E. (1985). Dynamic determination of pile capacity. J. Geotechnical Eng. 111 (3), 367–383. doi:10.1061/(asce)0733-9410(1985)111:3(367)
Salgado, R., Zhang, Y. B., Abou-Jaoude, G., Loukidis, D., and Bisht, V. (2017). Pile driving formulas based on pile wave equation analyses. Comput. Geotechnics 81, 307–321. doi:10.1016/j.compgeo.2016.09.004
Smith, E. A. L. (1960). Pile-driving analysis by the wave equation. J. Soil Mech. Found. Eng. 98 (9), 917–937. doi:10.1061/TACEAT.0008470
Svinkin, M. R. (2019). Sensible determination of pile capacity by dynamic methods. Geotechnical Res. 6 (1), 1–67. doi:10.1680/jgere.18.00032
Keywords: bearing capacity, resistance, HSDT, SLT, sliding micrometer
Citation: Li C and Li X (2023) Evaluation of bearing capacity of PHC pipe piles via the dynamic and static loading test. Front. Earth Sci. 11:1130294. doi: 10.3389/feart.2023.1130294
Received: 23 December 2022; Accepted: 24 January 2023;
Published: 09 February 2023.
Edited by:
Xuelong Li, Shandong University of Science and Technology, ChinaReviewed by:
Lin Zhang, Chang’an University, ChinaCopyright © 2023 Li and Li. This is an open-access article distributed under the terms of the Creative Commons Attribution License (CC BY). The use, distribution or reproduction in other forums is permitted, provided the original author(s) and the copyright owner(s) are credited and that the original publication in this journal is cited, in accordance with accepted academic practice. No use, distribution or reproduction is permitted which does not comply with these terms.
*Correspondence: Xuepeng Li, bGl4dWVwZW5nMTk4NEAxMjYuY29t
Disclaimer: All claims expressed in this article are solely those of the authors and do not necessarily represent those of their affiliated organizations, or those of the publisher, the editors and the reviewers. Any product that may be evaluated in this article or claim that may be made by its manufacturer is not guaranteed or endorsed by the publisher.
Research integrity at Frontiers
Learn more about the work of our research integrity team to safeguard the quality of each article we publish.