
94% of researchers rate our articles as excellent or good
Learn more about the work of our research integrity team to safeguard the quality of each article we publish.
Find out more
ORIGINAL RESEARCH article
Front. Earth Sci., 21 April 2023
Sec. Paleontology
Volume 11 - 2023 | https://doi.org/10.3389/feart.2023.1130107
This article is part of the Research TopicVirtual Paleobiology – Advances in X-Ray Computed Microtomography and 3D Visualization of FossilsView all 10 articles
The Eocene Pipestone Springs Main Pocket (Renova Formation, Jefferson County, Montana, United States of America) is a locality renowned for its diverse Chadronian (late Eocene; ∼38–33.9 million years ago) mammalian fauna and abundant coprolites. Two distinct coprolite size classes were previously identified in the trace fossil assemblage from which we selected representatives to investigate feeding behaviors and dietary selection of the producers. A subset of the selected coprolites was analyzed based on their compositional and taphonomic attributes using non-destructive x-ray tomographic microscopy in combination with more traditional methods including thin-section petrography, scanning electron microscopy, and energy dispersive spectroscopy. Among the features extracted in the tomographic data were skeletal fragments, including those showing evidence of bone-crushing; delicate hair molds; encrusted lithic fragments; and several irregular pores and cracks throughout the coprolites. Segmentation and volumetric renders permit quantitative assessment of the relative proportions of inclusions, revealing porosity as a primary volumetric element aside from the matrix and bone inclusions. There was no significant difference in the total volume of bone extracted between coprolite size class, though the smaller coprolites preserved a relatively higher volumetric proportion of undigested skeletal material. This multi-visualization approach provides a means to observe and evaluate differences in the coprolite gross morphology and inclusions across the two size classes, thereby offering valuable insights into the broader paleoecology of the Pipestone Springs Main Pocket coprolite producers and holding promise for comparable paleo-dietary studies of other coprolite-rich deposits.
Coprolites and affiliated trace fossils offer a rare glimpse into the feeding, digestive, and excretory behaviors of their producers whilst simultaneously capturing unique paleoecological and paleoenvironmental information (Hunt et al., 2012; Myhrvold, 2012). Examination of such fossils typically requires sub-sampling of the specimen, often employing destructive sampling techniques (e.g., disaggregation or dissolution) to either a portion of the specimen or its entirety (Bryant, 1970; Fry, 1970; Shillito et al., 2020). Recent studies have utilized non-destructive three-dimensional (3D) imaging techniques, such as x-ray tomographic microscopy (µCT) and synchrotron microtomography, to reveal macroscopic and microscopic inclusions that may otherwise be lost via more traditional methods (Bravo-Cuevas et al., 2017; Qvarnström et al., 2017; 2019; Wang et al., 2018; Romaniuk et al., 2020; Abella et al., 2022). Challenges with x-ray-based methodologies persist, however, often owing to the attributes of the sample. For instance, depending on the preservation of the coprolite, some inclusions may be compositionally similar to the matrix material. In such cases, overlapping intensity ranges will make discerning these features difficult via standard segmentation or thresholding techniques. This lack of phase contrast can be exacerbated by taphonomic processes caused during digestion wherein the bone margins become diffuse, or during diagenesis when remobilization of soluble minerals causes secondary infilling of pores. Diagenesis can also reduce or eliminate phase contrast through secondary remineralization of the entire specimen. Nevertheless, for coprolites and inclusions that have not been substantially altered through taphonomic or diagenetic processes, µCT proves to be a powerful tool in extracting inclusions virtually for qualitative analysis—although its applications for such research at present are in their infancy (but see Huisman et al., 2014; Shillito et al., 2020). Where prior coprolites studies employing µCT have been predominantly qualitative, intent on the description of the types of inclusions, the quantitative analysis of extracted components and associated potential to address testable hypotheses is an area that requires further research.
Herein, we employ non-destructive µCT in conjunction with targeted consumptive sampling to gain a more holistic view of the internal composition and inclusions of a subset of coprolites from a well-documented trace fossil assemblage. Specifically, we targeted coprolite material from the Pipestone Springs Main Pocket (PSMP) assemblage (Renova Formation), Jefferson County, Montana. This site is renowned for its diverse mammalian fauna and associated trace fossils (Lofgren et al., 2017), and previous work has reported on the taxonomy of vertebrate inclusions and the likely identity of at least one taxon of coprolite producer. Lofgren et al. (2017) examined coprolite surface morphology and visible skeletal elements in 358 specimens, including 20 specimens that were mechanically prepared by removing skeletal inclusions. It is worth noting that the regular shape, phosphatic composition, low bone density, and highly digested, fragmented nature of the bones in these specimens supports their interpretation as coprolites, rather than regurgitalites (Myhrvold, 2012; Gordon et al., 2020; Serafini et al., 2022). Analysis of the measurable dimensions of this coprolite assemblage have previously revealed two distinct size classes, including smaller forms ranging from 4 to 15 mm in diameter and larger forms ranging from 16 to 29 mm in diameter (Lofgren et al., 2017). The larger coprolites could not be attributed to any single genus with confidence, and are suggested to have been produced by Brachyrhynchocyon dodgei. The producer of the smaller coprolites, with several smaller carnivorous taxa as potential candidates was deduced to be Hesperocyon gregarius (Lofgren et al., 2017). This prior work provides an important foundation from which we can both ascertain the broader paleoecological framework for the coprolite assemblage and further build upon it by assessing the taphonomic and diagenetic attributes of the coprolites.
Utilizing computed tomographic techniques provides a novel avenue of investigation to substantiate previous findings on the gross morphology of the PSMP coprolites, as well as to 1) visualize 3D specimen structure and identify the undigested skeletal and keratinous inclusions via virtual segmentation; 2) quantify the relative proportions of bone inclusions and pores to feces matrix; and 3) discern any difference between the two size classes with respect to the shape and volume of bone inclusions. This work further serves to assess the potential applications (and limitations) of µCT techniques in the analysis of coprolites. Finally, corroborating previous findings with data herein, we seek to further elucidate the feeding behavior of these ancient vertebrate producers across coprolite size classes, while also detailing the taphonomic and diagenetic processes found within the PSMP assemblage.
Coprolites are derived from the PSMP, which is considered part of the Climbing Arrow Member of the Renova Formation in Jefferson County, Montana (Kuenzi and Fields, 1971; see Hanneman et al., 2022; Figures 1, 2). Specimens documented herein were collected from the upper-most 15 m-thick silty mudstone unit of the Pistone Springs reference section. Outcropping strata are exposed on opposing sides of an erosional gully though both isolated pockets are lithologically and faunally indistinguishable, hence are often referred to as the same bed (Tabrum et al., 1996). Material herein was collected from the RAM V200301 locality which is situated on the dip slope towards the northern end of the Main Pocket exposures, in the same vicinity as MV 5811, MV 5902, and CM 3575 (Orr, 1958; see Hanneman et al., 2022; Figures 3, 4).
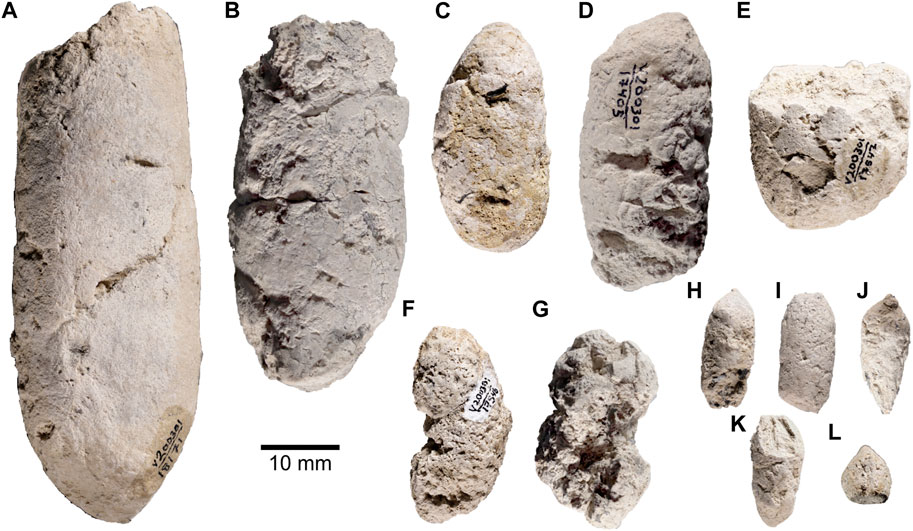
FIGURE 1. Coprolites arranged by mass (g) into Class I (A–G) and Class II (H–L) (A). RAM 18171 (B). RAM 17517 (C). RAM 17540 (D). RAM 17405 (E). RAM 17547 (F). RAM 17546 (G). RAM 17370 (H). RAM 17557 (I). RAM 31214 (J). RAM 31212 (K). RAM 31211 (L). RAM 31209.
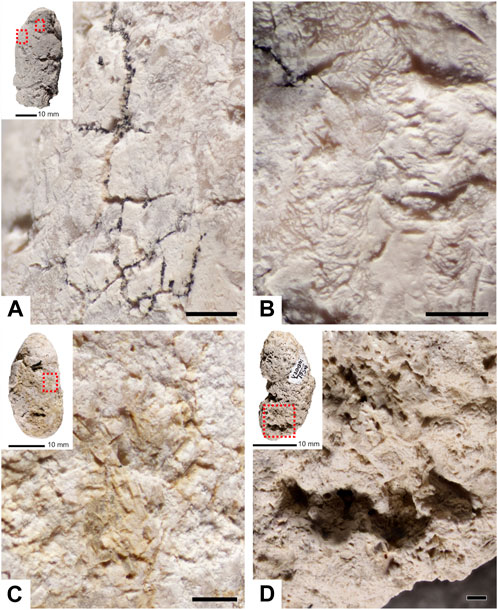
FIGURE 2. Taphonomic and morphological features observed on the surface of coprolite samples. (A) Examples of small desiccation cracks (RAM 17517). (B). Shows surface scratches that have no consistent length or pattern to them (RAM 17517). (C). Hair molds (RAM 17540). (D). Large surface pore and likely mold (RAM 17546). Red boxes in overview images represent corresponding zoomed-in images. Scale bars represent 1 mm; insets all 10 mm.
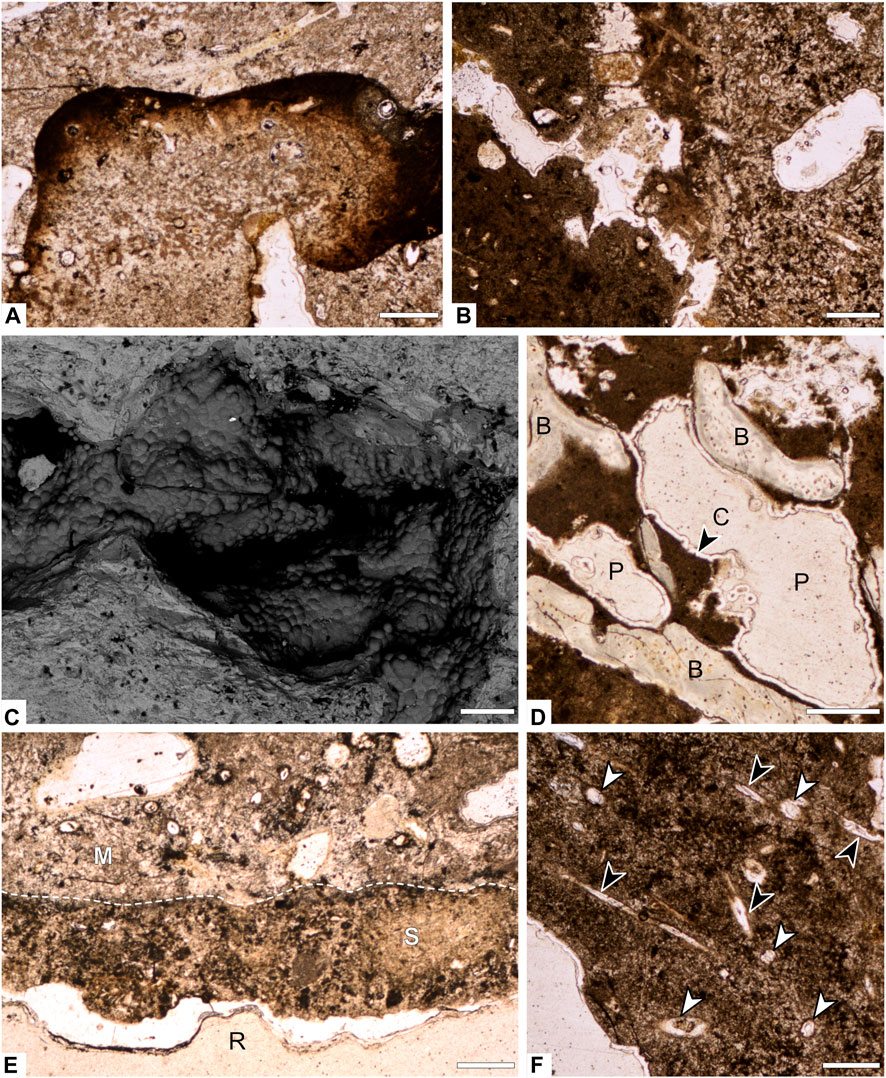
FIGURE 3. Photomicrographs and backscattered electron images of interior composition of specimen RAM 17540. (A) Phosphate enriched inclusion embedded within matrix of coprolite. (B) Contact between two fabrics of matrix in the interior of the coprolite. (C) Backscattered electron image of 3D pore space showing botryoidal silica crust. (D) Pore spaces lined with silica crust and bone inclusions. (E) Contact (dashed line) between coprolite matrix and adhered layer of sediment. (F) Transverse (white arrows) and longitudinal (black arrows) cross sections of hair molds. B= bone; P=pore; C=crust; M=matrix; S=sediment; R=resin. Scale bars represent 250 µm.
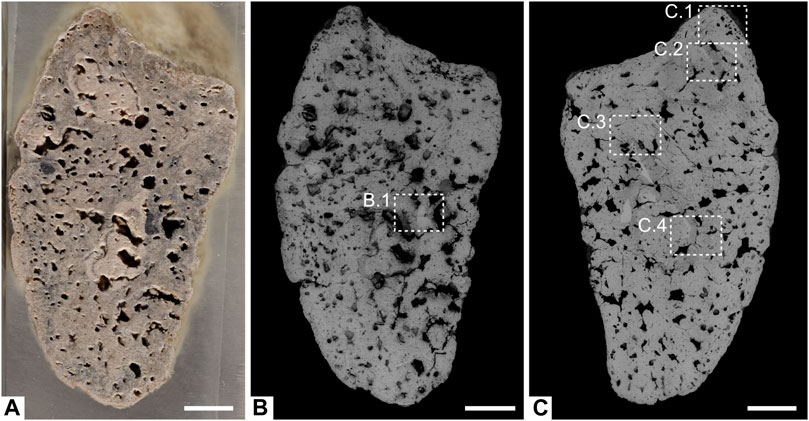
FIGURE 4. Internal and compositional characteristics of RAM 17540 (A) Plane view of the unpolished sectioned surface under plain light. (B) Backscatter electron image of the same surface figured in (A). (C) Back-scatter electron image of polished surface of sectioned sample. Insets shown in Figure 5. Scale bars represent 5 mm.
Based on prior biostratigraphic correlation and magnetostratigraphy (Prothero, 1984), the PSMP assemblage has been estimated as middle to late Chadronian in age (35.0–35.5 Ma). The deposit is exposed as a 50 cm–4 m thick layer of homogenous tuffaceous mudstone, lacking sedimentary structures or obvious bioturbation (Lofgren et al., 2017). Coprolite and vertebrate remains are randomly distributed (without size-sorting) throughout the deposit, both laterally and vertically, precluding hydrodynamic sorting (Lofgren et al., 2017). Several interpretations concerning the formation of these deposits have been proposed, with initial scenarios involving either repeated ash-rich mud flows or inundated floodplain deposits (Kuenzi and Fields, 1971; Lofgren et al., 2017). However, in the absence of clear debris-flow or fluvial sedimentary features, Hanneman et al. (2022) interpret these deposits as having been formed by predominantly aeolian processes. Paleosols of varying degrees of development and exhibiting extensive bioturbation are intercalated between aeolian events represented by direct and reworked ashfall deposits, and loessites (Hanneman et al., 2022).
The twelve coprolite specimens examined herein (Table 1) are housed in the collections of the Raymond M. Alf Museum of Paleontology (RAM), Claremont, California. The external appearance of the coprolites was examined using reflective light microscopy and photographed using a Magnify2 GIGAMacro Robotic Imaging System with Canon EOS Rebel T6i/T8i DSLR cameras and Nikon ×1 objective to acquire gigapixel resolution photomosaics. Petrographic photomicrographs were captured using a Nikon D3300 DSLR camera mounted to a Nikon Eclipse E200 polarizing microscope. Background illumination was corrected using open-source imaging software FIJI (Schindelin et al., 2012) and the method provided by Landini (2006).
Exterior physical features were described using the methods outlined in Jouy-Avantin et al. (2003), including the identification of color, shape, hardness, texture, the presence or absence of constrictions, and inclusions visible at the surface. Coprolite color was characterized based on the Munsell Color Rock-Color Chart (Munsell Color, 2010). The overall shape and specific morphology of the coprolite extremities were noted (e.g., sharp-ended, rounded, or broken), as were taphonomic modifications including desiccation, abrasion, and surface markings/burrows (Supplementary Table S1). Any inclusions visible on the surface were also noted (i.e., bones, adhering sediment). The surface texture was examined to determine whether the coprolite displayed homogenous or heterogeneous mixtures; compacted aggregates less than 1 mm, compacted aggregates greater than or equal to 1 mm, homogenous mixtures with some aggregates, or many aggregates included in a homogenous mixture.
Coprolite samples were scanned using a Zeiss Xradia 510 Versa µCT microscope at the X-ray Microanalysis Laboratory (MizzoµX), University of Missouri, for non-destructive analyses. Optimal scanning parameters for the coprolites varied, with source voltage ranging between 80 and 140 kV, source power between 7 and 10 W, and exposure time between 1 and 5 s(s). All scans captured 1,601 projections through 360° of rotation and used a ×0.4 objective. Two types of Zeiss low-energy filters were used based on sample transmittance values, with 12 scans using the LE5 filter, and two using the LE2 filter. Voxel size ranged from 3.4618 to 30.12 µm. The scanning parameters for each sample are summarized in the Supplementary Table S2.
Visualization of the 3D data was achieved by importing serial tomogram stacks into Dragonfly software v. 2020.2 Build 941–v. 2022.2 for Windows, Object Research Systems (ORS, 2020) Inc., Montreal, Canada, 2018 (http://www.theobjects.com/dragonfly). Segmentation via labeled voxels was performed using upper and lower Otsu thresholding of greyscale values, in combination with other operations such as fill inner areas, Boolean calculations, and in certain cases manual segmentation throughout the image stacks to extract internal constituents and features of the coprolites (e.g., bones and pore spaces) from the matrix. Volume measurements and relative volumetric proportions of pore space and bone inclusions were calculated for each coprolite tomogram. Note for pores, the remaining porosity was measured, which excluded pores that were secondarily infilled. For more delicate features such as the tubular voids inferred to be moldic preservation of hair, a subsample of 300 slices was classified using the Trainable Weka Segmentation Fiji plugin (Arganda-Carreras et al., 2017) to differentiate these features from other volumetric elements, and subsequently imported into ORS Dragonfly for visualization and quantification in 3D. Feret diameters (i.e., caliper diameter, defined as the distance between the two parallel planes restricting the object perpendicular to that direction) for the bones and pores were measured within Dragonfly. The minimum feret diameter for bones was set at 0.14 mm and the minimum feret diameter for pores set at 0.196 mm. A multi-ROI (Region Of Interest) was extracted from the bone segmentation into group-labeled voxels to identify individual bone components. Select components were then extracted as meshes (.stl files) and smoothed for one iteration in Dragonfly before being exported to Meshmixer, 1995 [Autodesk Meshmixer 3.5, (RRID:SCR_015736)]. The 3D meshes were rendered to remove islands and unrelated material and applied with a shader. Each bone was examined individually for identification and to determine the general shape and signs of fragmentation.
A single specimen (RAM 17540) was prepared and sectioned for examination via optical and scanning electron microscopy (SEM). The coprolite was strengthened with PALEObond Penetrant Stabilizer, embedded in epoxy, and cut diagonally along a section predetermined from observation of the µCT data. One of the two-halves was polished using a Buehler EcoMet250, while the other was left unpolished. Both halves were then analyzed using a Zeiss Sigma 500 VP SEM equipped with a high-definition 5-segment backscattered electron detector at the MizzoµX lab and imaged using the Bruker ATLAS workflow for large-area SEM mosaics. Elemental mapping was conducted on specific regions of interest using dual Bruker XFlash energy dispersive X-ray spectrometers (EDS). All SEM analyses were conducted at their optimal operating conditions of 20 keV beam accelerating voltage, 40 nA beam current, 60 µm aperture for imaging (120 µm aperture for EDS elemental mapping), chamber pressure at 20 Pa, and a working distance of 16.5 mm.
Analyses were conducted and figures produced using software package R (R core Team, 2017; Version 4.1.0) and associated R packages boot, diptest, ggplot2, ggthemes, ggpubr and mclust (Davison and Hinkley, 1997; Scrucca et al., 2016; Wickham, 2016; Arnold, 2021; Canty and Ripley, 2021; Maechler, 2021). Raw data is provided in Supplementary Tables S3–S6 along with R scripts (Supplementary Scripts S1). Using the volumetric data in Supplementary Table S4, two bar graphs were produced in Microsoft Excel in order to assess the respective contributions of matrix, bones, and pores to total coprolite volume (mm3) and the relative proportions of these components for each sample.
Size data of coprolites reported in Lofgren et al.’s (2017) Figure 11 were extracted (in 1 mm bins) using plotdigitizer.com (on 8 March 2023, Supplementary Table S6). Gaussian finite mixture modelling of these data was conducted using the mclust package in R.
We tested for differences in nine variables by coprolite size class, including measures of length, width, mass, proportion of pore volume, and proportion and size of bone inclusions. We first used the Shapiro test for normality and the Dip test for unimodality (if the data were not normally distributed) to determine if the Wilcoxon Rank-Sum tests were appropriate.
The coprolites were divided into two different size classes previously defined by Lofgren et al. (2017) based on their diameter, with larger coprolites ranging between 16 and 29 mm and smaller coprolites between 4 and 15 mm. Within our subset we had seven larger class coprolites (Class I; RAM 17370, 17405, 17517, 17540, 17546, 17547, and RAM 18171) and five smaller class coprolites (Class II; RAM 17557, 31209, 31211, 31212, and 31214). Size measurements (i.e., mass, length, and width) are summarized in Table 1. Coprolites exhibited three different colors, including yellow gray (5Y 7/2), grayish yellow (5Y 8/4), or yellowish gray (5Y 8/1), as defined in the Munsell Color Chart (2010). There was no obvious color difference between the classes of coprolites, though all Class II coprolites are yellowish gray, 5Y 8/1.
Most of the examined Class I coprolites (5/7) have a smooth, relatively homogenous surface and tend to share a similar cylinder-like shape, circular in cross-section though occasionally flattened on one side (i.e., RAM 17517) (Figure 1). Notable exceptions include RAM 17546 (Figure 1F) and RAM 17370 (Figure 1G), which both display a rough, topographically complex surface, while simultaneously showing signs of constrictions. The examined Class II coprolites also have homogenous, smooth surfaces but are less uniform in shape. As noted by Lofgren et al. (2017), the smaller forms exhibit blunt or tapered ends, and occasionally both. Though few, coprolites within both size classes I and II show small black bone inclusions on their surface visible to the naked eye. In-depth descriptions of each specimen can be found in the Supplementary Text S1.
Desiccation cracks occur prior to lithification of the coprolite and are caused as a response to both climate and depositional environment (Northwood, 2005). Several samples displayed desiccation cracks on the exterior coprolite surface (n = 6, Supplementary Table S1), varying in size from large, conspicuous cracks with infilled sediment to small hair-line cracks on the surface of the coprolite. An example of these features can be seen on RAM 17517 (Figure 2A), where the cracks appear as small continuous lines that disrupt the specimen surface. RAM 18171 also displays large, infilled cracks approximately midway along the sagittal length that range from 3 to 10 mm in length (Figure 1A). Desiccation cracks were only noted in the larger Class I coprolites where both distinct and finer cracks could be observed together on the same sample.
Abrasion relates to how smooth the surface has become in response to erosion caused by water or wind-born particle scouring following excretion or transport and weathering post lithification (Northwood, 2005). We employed the three categories designated by Northwood (2005) to describe the degrees of abrasion including: A. showing no surface abrasions, B. showing little surface abrasion, C. showing significant surface abrasion with a smooth surface. Surface abrasion was common, with most samples (n = 8) displaying evidence of significant abrasion and evenly across the two size classes (SSupplementary Table S1). Two specimens showed evidence of some abrasion (RAM 17517, Figure 1B and RAM 17546, Figure 1F). Those showing no abrasion typically preserved either topographically rough surfaces (RAM 17370, Figure 1G) or delicate features such as radial parallel anal sphincter marks (RAM 31209, Figure 1L). There is no obvious difference in abrasion pattern between coprolite size classes, as both exhibit the full range of abrasion profiles.
Surface marks are more ambiguous in their origin and manifest as some sort of imprint or trace left by either inanimate objects or a biological agent post defecation. Frequently, these include traces from coprophagous invertebrates as surface scratches or burrows (Northwood, 2005; Eriksson et al., 2011). A few specimens show plausible evidence of invertebrate scratch marks, displayed as short, radiating, unbranching traces with no unified orientation (Figure 2B). Whether these markings are biogenic or abiogenic (i.e., abrasion) is difficult to decern with confidence, though it might be expected that abrasion marks are less localized and more evenly distributed compared to biogenic markings. Notably, the scale of these marks is also comparable to the surface expression of exposed hair molds (i.e., RAM 17403 and 17557), which appear as fine linear impressions on the coprolites’ surface (Figure 2C).
Breakage in coprolite samples is any sort of mark that shows that the sample has broken after the fossilization process. Breakages are more likely to occur close to surface inclusions within the coprolite, which tend to create weak points (Northwood, 2005). The extent of breakage within the present dataset varies from small parts of the coprolite chipped off (Figures 1H, I, K) to larger portions presumably missing (i.e., RAM 17546; Figure 1E). Some of the coprolite specimens show partially smoothed fracture surfaces, such as RAM 18171 (Figure 1A), indicative of weathering and exposure following the fracture, as compared to fresher, more angular fractures in other specimens such as RAM 17547 (Figure 1E). Breakage was more prevalent in the Class I coprolites than their smaller contemporaries.
Decomposition of the feces prior to lithification is the main cause of spherical to irregular cavities on the coprolite surfaces, which result from the accumulation of decompositional gasses (Northwood, 2005). Such features were present in both Class I and Class II coprolites and varied in size from sub-millimetric scales to spanning several millimeters. Class I coprolites have larger surface pores, for example best preserved in RAM 17546 and 17370 (Figures 1F, G respectively). The large size of these cavities rules out their representing the remnants of bacterial colonies (described in phosphatic coprolites by, for example, Hollocher et al., 2001). The surface cavities were described based on their relative abundance (Supplementary Table S1). One notable cavity was a linear feature with closely spaced repeated circular depressions (Figure 2F). Select coprolites also display a ventrally flattened surface associated with pre-lithification plasticity of the sample (e.g., RAM 17405 and 18171). This distortion provides some indication of the moisture content of the original scat when excreted and is unique to the larger Class I coprolite samples in the subset observed.
Petrographic analysis reveals a very-fine to medium-grained matrix of predominantly amorphous phosphate interspersed with fine unidentifiable bone fragments (Figure 3). SEM-EDS analysis of RAM 17546 confirms a calcium and phosphorous (carbonated hydroxyapatite) matrix composition, with minor traces of silicon, aluminum, and iron (Figures 4, 5). Evidence of digestive corrosion surfaces and phosphate enrichment are visible along defined boundaries within the matrix (Figure 3A), with some boundaries between different compositional textures notably more diffuse (Figure 3B). There are also conspicuous contacts between the apatite matrix and adhered sediment on the external surface of the coprolite (Figure 3E), characterized by detrital grains and finer sediment containing aluminum and potassium (Figure 5B). Petrographic and µCT analyses additionally demonstrate evidence of desiccation cracks extending inwards from the surface of the coprolite.
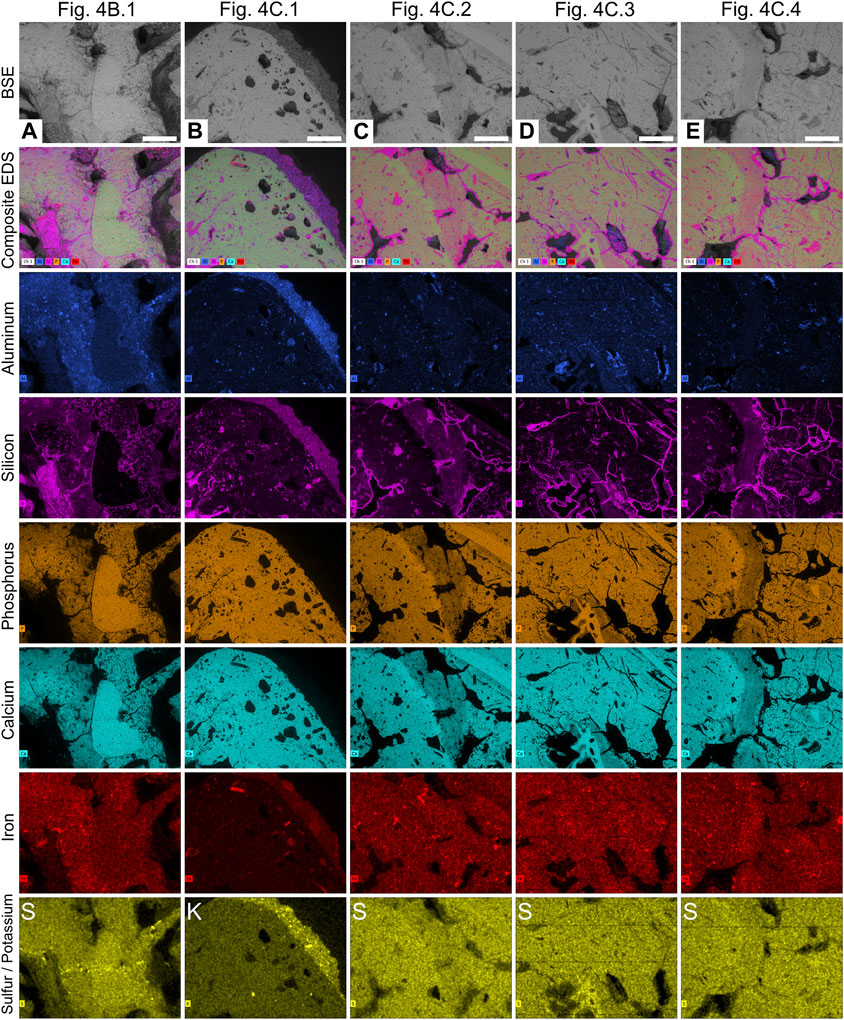
FIGURE 5. EDS elemental maps of areas in specimen RAM 17540 from Figure 4. (A). Well-preserved bone inclusion and surrounding matrix. (B) Exterior edge of the coprolite showing sediment adhered to the outer surface. (C) Etched bone inclusions with diffuse edges. (D) Matrix and hair molds. (E) Etched bone inclusions with diffuse edges. Scale bars represent 1 mm.
All coprolites examined reveal pores as a major structural element, with voids ranging in volume between 0.001 and 1,389.2 mm3, and feret diameters of 0.196–50.562 mm. When distinguished from other moldic inclusions (e.g., hair molds, discussed below), no universal pore shapes could be identified, with morphologies ranging from long and thin to large and irregular in shape (Figures 3C, D, 6, 7). Light microscopy and SEM analysis of RAM 17540 reveal that the pores are frequently lined with crusts of botryoidal silica (Figures 3C, D, 5C, D). Interconnected porosity is observed but limited and few pores are in contact with the external surface; instead, most pores are isolated within the matrix (Figure 6). By volume, pores compose the second largest constituent of the coprolite on average after the matrix, comprising between 3.35% and 14.32% across both coprolite size classes (Supplementary Table S4). The number of pores per specimen varied markedly, with their distribution throughout the sample relatively even except when influenced by the position of bone inclusions within the coprolite matrix (Figures 6J, K).
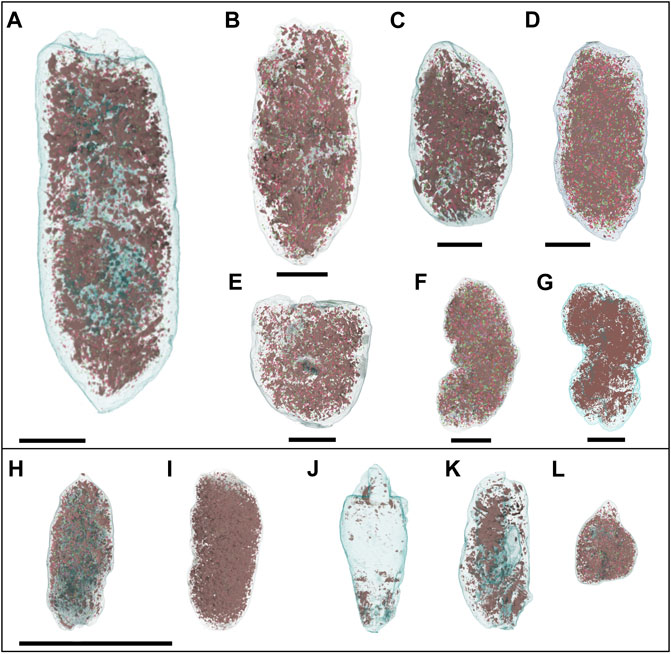
FIGURE 6. Internal view of pores of Class I Coprolites (A–G) and Class II (H–L). Pores are colored brown while the external surface of the coprolite is represented by light blue. (A) RAM 18171. (B) RAM 17517. (C) RAM 17540. (D) RAM 17405. (E) RAM 17547. (F) RAM 17546. (G) RAM 17370. (H) RAM 17557. (I) RAM 31214 (J) RAM 31212 (K) RAM 31211 (L) RAM 31209. Scale bars represent 10 mm.
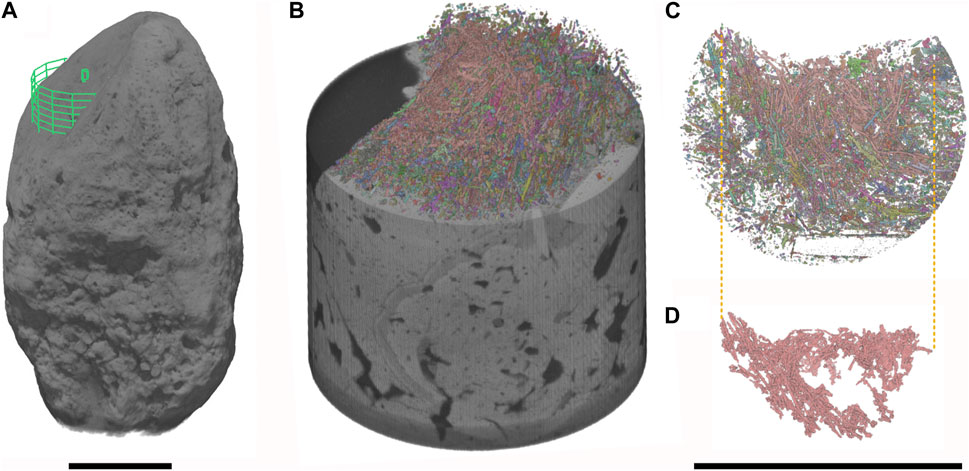
FIGURE 7. Hair molds in RAM 17540. (A) Site of targeted ROI for high resolution scan. (B) Volume render of targeted region showing a subset of the hair molds within the volume. (C,D) Extracted molds using multi-ROI to visualize individual isolated (C) and connected (D) components. Scale bars represent 10 mm.
Notable features detected using µCT are micron-scale tubules that represent the moldic remains of fossil hair within the coprolite matrix. Unlike the irregular pore spaces or other taphonomic features, these structures have a distinct and consistent morphology that does not display random branching attributed to desiccation cracks, burrows by coprophagous organisms or traces of fungal hyphae (Chin, 2007). Fossilized hair was observable via tomography in 10 of the 12 coprolites. In thin section, hair molds appear as elongated, parallel, straight-edged tubules with circular cross-sections (Figure 3F) and are typically infilled with silica (Figure 5D). Measured cross-sections reveal molds range in width from 0.015 mm to 0.092 mm (n = 60, mean=0.040). Hair molds are also discernible in tomographic slice data; for example, the targeted high-resolution scan (an ∼1 cm cylindrical ROI) of specimen RAM 17540 revealed small elongate, tube-like structures, each only a few millimeters in length (Figure 7). While hair molds were distributed relatively evenly throughout the scanned volume (Figures 7B–D), their distribution throughout the entire coprolite was more variable.
Bone inclusions visible on the exterior of the coprolites were often dark in color relative to the surrounding matrix. The sectioned surface and corresponding thin section of RAM 17540 shows that bone inclusions varied in their quality of preservation; the better-preserved fragments displayed darker inclusions with clear external margins (Figures 3A, 4A) while poorly preserved, heavily corroded, buff-colored inclusions displayed ill-defined margins (Figure 5E). Compositionally, the bones are similar to the matrix, differing by their increased concentrations of sulfur and decreased concentrations of silicon and iron as compared to the matrix (Figures 5A, E). Virtually extracted material from µCT data shows a considerable variation in the size and degree of fragmentation of bone inclusion, with a maximum bone feret diameter of 16.56 mm for the Class I coprolites and 25.73 mm for Class II. Except for a few coprolites, principally those preserving parts of long bones (inc. RAM 18171, Figure 8A; RAM 17557; Figure 8H; RAM 31212; Figure 8J), there is limited evidence of preferred bone orientation due to the overly fragmented nature of the inclusions. More typically, smaller bone fragments are visible ‘floating’ around the larger bones within the coprolite matrix.
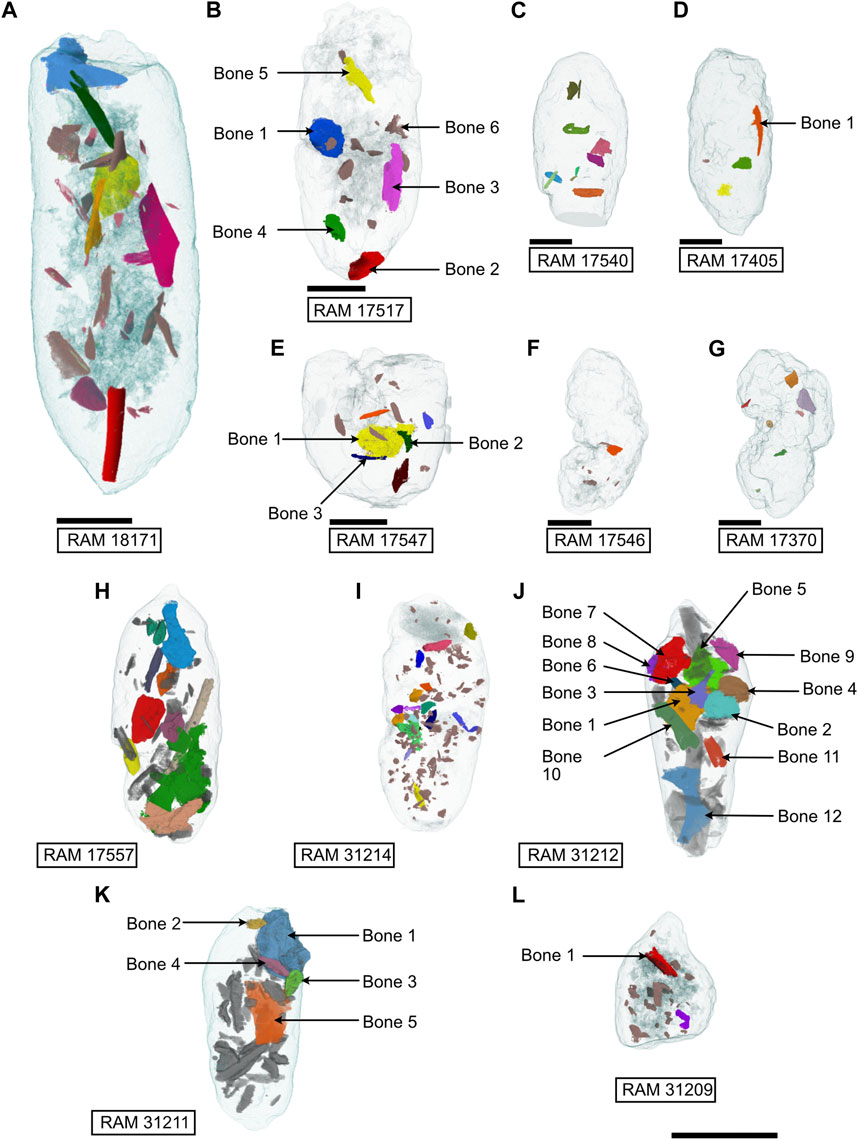
FIGURE 8. Internal view of coprolite bone inclusions divided into size Class I (A–G) and Class II (H–L). Bones of interest labeled. Scale bars 10 mm.
A total of 437 bone inclusions (excluding volumes of <0.001 mm3) were virtually extracted from the 12 coprolites examined. Due to their predominantly fragmentary nature (most <1 mm3), the majority could not be identified to any single taxon, nor categorized anatomically. However, some bones preserved sufficient morphological detail outside of general shape to allow attribution to a particular bone type, i.e., long and short, cancellous, flat and irregular bones. Full descriptions of the most complete extracted bone material figured in Figures 9, 10 are available in the Supplementary Text S2.
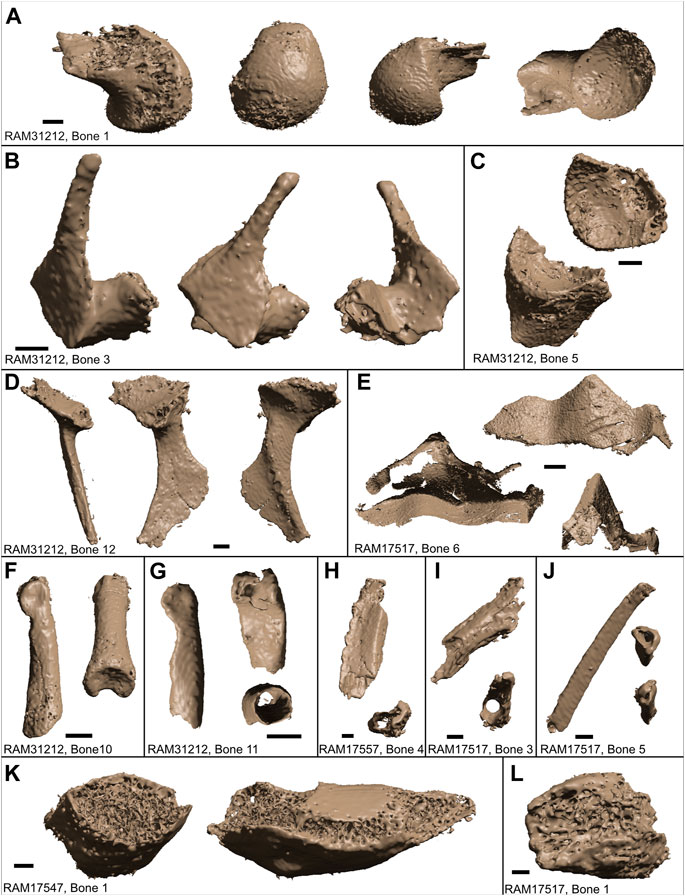
FIGURE 9. Extracted bones with identifiable features. (A) Bone 1 of RAM 31212 seen from four different angles. Shows the condyle of a long bone, or capitulum (e.g., femoral head). (B) Bone 2 of RAM 17517 seen from three angles showing the zygomatic arch. (C) Bone 5 of RAM 31212 seen from two angles, showing acetabulum (socket) of a hipbone. (D) Bone 12 of RAM 31212 seen from three different angles, showing potential elements of a pelvic girdle (ischium, or base plate and iliac blade) related to (C). (E) Bone 6 of RAM 17517 seen from three angles. Unlikely to be mammal material; unbroken edge and the overall geometry suggest this could be a squamate opisthotic. (F) Bone 10 of RAM 31212 seen from two views. Bone identified as a phalange. (G) Bone 11 RAM 31212 of RAM 31212 seen from two views. Bone identified as a phalange. (H,I) Bone 4 of RAM 17557 and Bone 3 of RAM 17517 each from two views. Potentially ribs; both are flat, hollow short bones with triangular cross-section. (J) Bone 5 of RAM 17517 seen in two views. Rib, based on triangular cross-section. (K,L) Bone 1 of RAM 17547 and Bone 1 of RAM 17517 show the cancellous structures of the bones contained within the interior. Scale bars represent 1 mm.
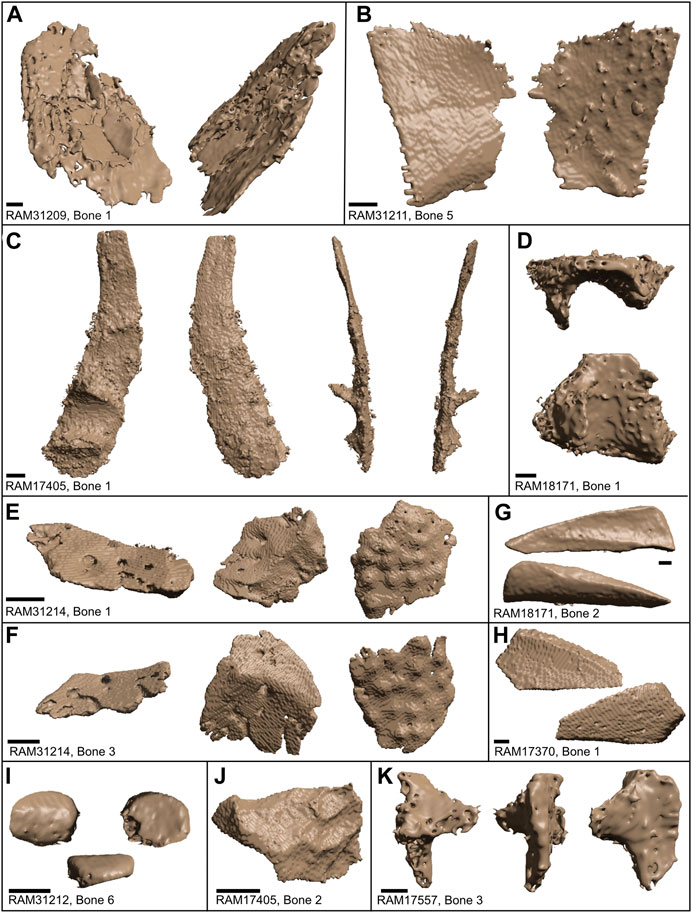
FIGURE 10. Extracted bones based on type. (A‒H) Flat bones. (A) Plane and oblique view of Bone 1 in RAM 31209. (B). Plane views of opposite sides to Bone 5 in RAM 31211. (C) Plane and side views of Bone 1 of RAM 17405; possible ilium. (D) Plane and side views of Bone 1 in RAM 18171; possible cranial element. (E‒F) Oblique and plane views of opposite sides to Bone 1 and 3 in RAM 31214. (G) Opposing flattened sides of Bone 2 in RAM 18171; resembles fibula. (H) Opposing flattened sides in Bone 1 of RAM 17370. (I‒K) Irregular bones. (I) Patella in anterior, lateral, and posterior views of Bone 6 of RAM 31212. (J) Plane view of Bone 2 of RAM 17405. (K) Plane and side views of Bone 3 of RAM 17557; possible lower jaw joint. Scale bars represent 1 mm.
The relationships between coprolite volumetric measurements and relative proportion of inclusions (i.e., matrix, pores, bones) are compared for individual coprolite samples (Figures 11A, B, respectively). The proportion of pores within the matrix was consistently greater when compared to that of bone inclusions (Figure 11B). The lowest percentage of pores in any sample was in RAM 17370, with 3.89%, and the highest percentage was 14.32% in RAM 31211. Bone inclusions, on the other hand range from 0.09% in RAM 17546% to 11.64% in RAM 31211.
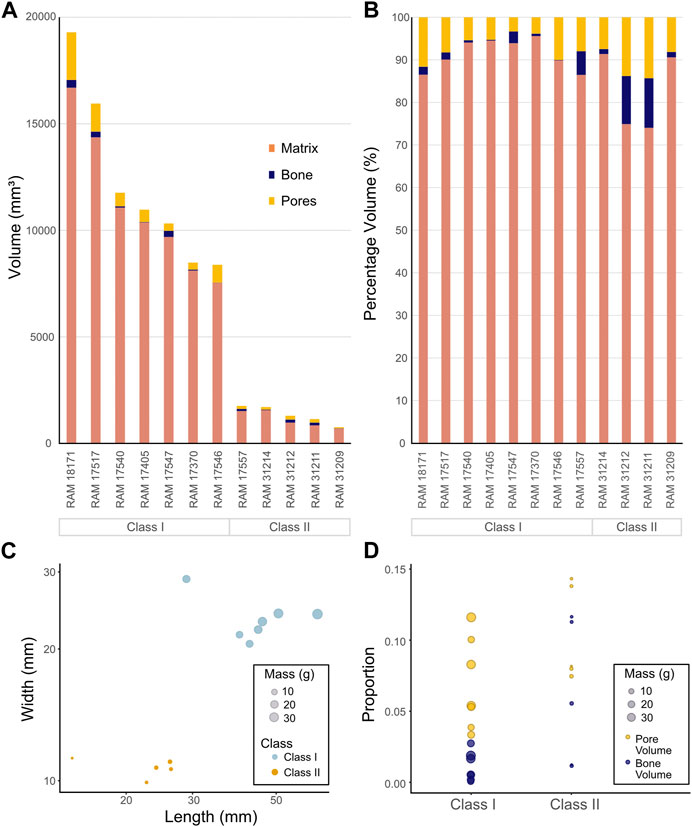
FIGURE 11. Comparison of coprolite shape in addition to volume and proportion of internal components across classes. (A) Volumetric analysis of all coprolites, comparing total volume of matrix, bones and pores. (B) Volumetric analysis of all coprolites, comparing total percentage of matrix, bones and pores. (C) A x-y plot of coprolite samples length vs. width. The size of the dots indicates the mass of the coprolite specimen. (D) The proportion of pore and bone material per coprolite specimen between the two classes. Median pore proportion in Class I is 0.054 (95% CI: 0.015, 0.155); and for Class II is 0.082 (95% CI: 0.007, 0.225). Median skeletal proportion in Class I is 0.005 (95% CI: 0.004, 0.024); and for Class II is 0.055 (95% CI: 0.044, 0.172).
All 12 coprolites (Class I, n = 7; Class II, n = 5) were included in statistical analyses to test for differences between the two classes of coprolites. The distribution of coprolite widths based on Lofgren et al.’s (2017) data is best modelled as two Gaussian distributions with unequal variance values. Component 1, the small size class, has a median width of 10.6 mm and comprises 79% of the data. Component 2, the large size class, has a median width of 18.4 mm and comprises 21% of the data. We interpret the coprolite specimens analyzed in this study to cleanly fall into one of the two size categories (nsmall = 5, nlarge = 7) (Supplementary Figure S1).
Coprolite length, width, mass, proportion of pore volume, and proportion of bone volume values for coprolites cannot be shown to not be normally distributed (Supplementary Table S7). The Shapiro tests results for bone volume, maximum feret diameter, mean feret diameter, and minimum feret diameter suggest that these values are not normally distributed, however, the Dip Test for Unimodality results cannot refute unimodality (Supplementary Table S7), therefore the Wilcoxon test is appropriate for these comparisons.
The Wilcoxon Rank-Sum test revealed significant differences in length (p = 0.003), width (p = 0.003), and mass (p = 0.003) between Class I and Class II coprolites (Figure 11C). We bootstraped 95% confidence intervals for the median proportion of pore volume between Class I (0.054 mm3) and Class II (0.082 mm3) coprolites and found no significant difference. Conversely, bootstrapping for the median proportion of skeletal material between Class I and Class II suggests that there is a significant difference in the median.
Differences in median bone size between the two coprolite classes were tested with a Wilcoxon Rank-Sum test, comparing bone volume, maximum feret diameter, mean feret diameter, and minimum feret diameter (Figures 12A–D; Supplementary Table S7). In total 437 bone values were used in the analysis (Class I, n = 172; Class II, n = 265). There was no significant difference (p = 0.176) between the median bone volumes of Class I (0.1 mm3) and Class II (0.09 mm3). The median value of the maximum feret diameters of bones for Class I (1.58 mm) was significantly larger (p = 0.002) than Class II (1.250 mm). Similarly, there was a significant difference (p < 0.001) between the median value of mean feret diameters of bones of Class I (1.015 mm) and Class II (0.870 mm). The same result can be seen with the median value of minimum feret diameters of bones, with Class I (0.495 mm) significantly larger (p=0.004) than Class II (0.460 mm).
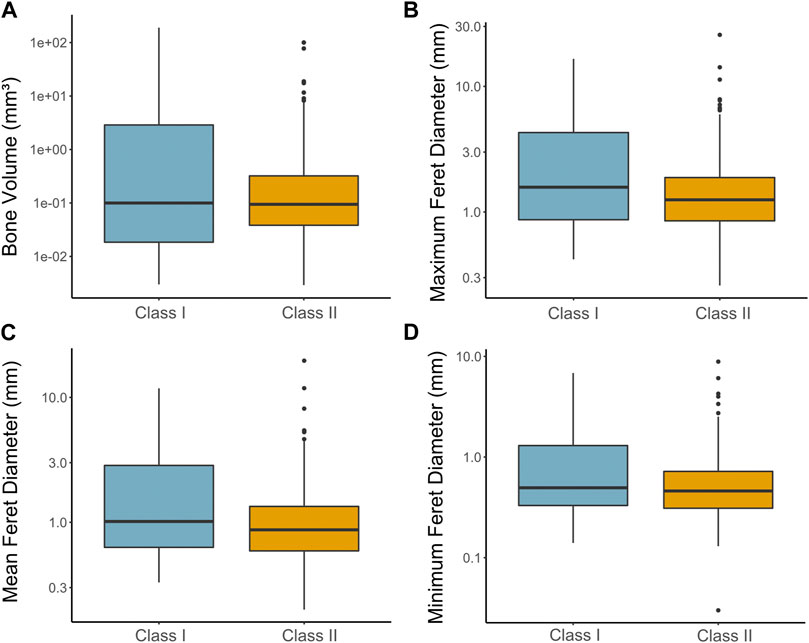
FIGURE 12. Comparison of bone volume and feret diameters across coprolite classes. (A) Median difference between Class I and Class II of bone volumes (Class I=0.1 m3 and Class II=0.09 mm3). (B) Median difference between Class I and Class II maximum feret diameters of bones for coprolites (Class I= 1.575 mm, Class II= 1.25 mm, p=0.001863). (C) Median difference between Class I and Class II mean feret diameters of bones for coprolites (Class I= 1.015 mm, Class II= 0.87 mm, p=0.0006583). (D) Median difference between Class I and Class II minimum feret diameters of bones for coprolites (Class I= 0.495 mm, Class II= 0.460 mm, p=0.004129).
The PSMP coprolites are well-preserved, excluding extensive surface abrasion, and possess minor diagenetic alteration or secondary mineralization. The limited evidence of adverse taphonomic processes within the subsample conforms to deposition in relatively dry and stable paleoenvironmental conditions. In addition to their in-tact or complete nature, surface features of the coprolites indicate that specimens may have been exposed at the surface for a prolonged period pre-burial due to high degrees of abrasion, likely from wind erosion, and the presence of desiccation cracks. Distortion exhibited by flattened ventral surfaces of the coprolites also suggests these rested relatively undisturbed soon after defecation. Desiccation cracks are relatively sparse and are most conspicuous on the larger size Class I specimens. Post-burial diagenesis is similarly limited with minimal evidence of compaction and only minor influence from percolating fluids. Thin botryoidal silica crusts on the surface of internal pores indicate incursion of silica-rich fluids through the porous matrix. Silica is likely derived from adjacent ashfall lapilli tuffs and the coarse fraction (including volcanic glass, quartz, plagioclase, potassium feldspar, and granitic fragments) of the silty mudstone which characterizes the Pipestone Springs strata (Hanneman et al., 2022). Silica infill observed in thin section and SEM data is notably thin, coating pores to a thickness of between ∼8 and 354 µm. The lack of homogeneous silica infill or secondary remobilization of phosphate suggests that between phases of burial and exposure, conditions were predominantly devoid of moisture.
The porous nature of the PSMP coprolites is a key morphological attribute that has been overlooked in prior studies. Pores compose the largest percentage of internal structural components after the matrix (Figures 11A, B). Moreover, this represents a minimum estimate of the true porosity, as several pores have been secondarily infilled with silica. As seen in Figure 6, the irregular pores (excluding hair molds) dramatically vary in size from 0.196 to 50.562 mm and are distributed relatively evenly throughout the matrix when not occupied by skeletal remains. Though pores are known to frequently occur within the matrix of coprolites (Horwitz and Goldberg, 1989; Herbig, 1993), their origins remain uncertain, owing to several different processes associated with their formation. One explanation for their formation is decay of some degradable materials within the feces, including smaller bone fragments, soft tissue (muscle, tendons, ligaments, etc.), or insect parts that might not have been digested, and subsequently decayed to form these pores. Given the relatively even distribution of pores throughout the matrix, this seems unlikely. An alternative explanation is that the pores were already present at defecation (including on the surface) caused by trapped gases within the feces—a product of bacterial respiration in the intestine (Herbig, 1993; Magondu, 2021). Gases produced during digestion are typical and varied (Levitt and Bond, 1970); however, reporting the preservation of these gaseous vesicles and their relative abundance within a coprolite is often neglected. As excess gas can relate to bacterial overgrowth within the gut, which may have deleterious consequences for the individual or indicate an intestinal disease (Suarez et al., 2000; Pimentel et al., 2006; Kalantar-Zadeh et al., 2019), the prevalence of such gaseous vesicles may be useful in understanding the gut biome and physiological attributes of coprolite producers. A third explanation for the pores relates to desiccation; as the sample loses moisture, smaller pores (possibly those formed by gases) are enlarged in conjunction with the reduction in overall coprolite volume. As few actualistic studies exist investigating the complete taphonomic processes (from defecation to burial) of modern feces in natural environments, much of this remains speculative (Northwood, 2005; though see Brachaniec et al., 2022).
Another constituent of the porous volumes within the coprolites are the moldic remains of keratinous material, specifically hair. Whilst targeted higher resolution scanning was only performed on one specimen (RAM 17540; Figure 7), other coprolites from this sample subset exhibit similar structures. These small tube-like pores generally fall within the shaft shape and size range of hair, with distinct circular cross-sections. Because these pores are small, isolated, and many terminate without contacting the surface of the coprolite, these tubules can readily be distinguished from desiccation cracks, insect burrows or fungal hyphae. Hair molds can also be observed on the surface of select PSMP coprolites (see RAM 17540, Figure 2C). However, not all small pores exhibit this tube-like form and hence hairs cannot account for all the small topographic depressions observed. Due to keratinous material possessing highly resistant molecules that few extant taxa are able to digest (Leprince et al., 1980), hair is relatively resistant to digestive and early lithification processes (Taru and Backwell, 2013). Though the hair eventually decayed, it was preserved long enough to form molds of the shafts within the interior of the coprolite. This pathway conforms with previous studies where hair tubules have been found as casts and impressions both on the surface and interior of coprolites, often preserving exceptional details of the cuticular surface (Crooper et al., 1997; Taru and Backwell, 2013; Bajdek et al., 2016). Similar to the irregular pores, these molds display a siliceous coating caused by secondary infilling during diagenesis.
Qualitative and quantitative analyses of the two coprolite size classes observed reveal notable differences with respect to the morphology of the inclusions, which may inform about feeding habits and physiological differences of their respective producers. Results of our analyses reveal a discernable statistical difference in the relative proportions of bone inclusions to total coprolite volume between Classes I and II. Notably, the proportion of bone volume was greater in the smaller Class II coprolites by comparison to the larger Class I coprolites (Figure 12A). However, there was no significant difference in the extracted bone volumes between the two classes indicating that, despite the relative size of the smaller Class II coprolites, the bone constituent was comparable to that observed in larger Class I coprolites.
In the case of Class I coprolites, bones tended to be larger overall with respect to their feret diameters (Figures 12B–D). Bone inclusions within the Class I coprolites also showed more degradation and evidence of intense fragmentation from mastication, such that few bones could be reliably identified. This implies that the Class I producers were capable of consuming larger prey compared to the Class II producers. Bones extracted from the Class I coprolites, including Bone 1 of RAM 17547 (Figure 9K) and Bone 1 of RAM 17517 (Figure 9L), lacked an identifiable shape but revealed internal features such as cancellous tissue associated with larger bones (e.g., pelvic bones, vertebrae, etc.). The ambiguous shapes, incomplete condition of the bones, and preponderance of homogeneous phosphatic matrix contained within Class I coprolites, aligns with specific feeding habits and digestive processes. Principally, the evidence presented herein supports a durophagous carnivorous producer with a bone crushing habit, which is comparable to previous findings in relation to late Miocene carnivoran coprolites from California (Wang et al., 2018). The producers of these latter coprolites are inferred to have been borophagine canids that filled a unique ecological niche in North America, comparable to extant hyenas, until their disappearance approximately 2 million years ago (Lofgren et al., 2017; for further discussion see section 2.4.2 below). Like the California specimens, the PSMP coprolites also exhibit a powdered homogenous matrix of bone residues (Figures 3A, B) indicative of a producer with a highly acidic gastrointestinal system (Wang et al., 2018). Examples of corrosion are visible in Bone 1 RAM 17547 (Figure 9K) where internal thin trabecular material is revealed. Bone dissolution could also account for the diffuse boundaries exhibited by several bone inclusions during the segmentation process.
Class II coprolites overall have a statistically larger proportion of bones compared to total coprolite volume than Class I, though there is notable variation within the sampled dataset (Figure 11D). Such variation is also evident in the condition of extracted inclusions. Most identifiable bones in the PSMP material are associated with specimens in Class II, though this is slightly skewed as most of these bones were also recovered from a single specimen, RAM 31212 (Figure 8J). This coprolite has the second largest amount of bone inclusions of those examined here (Supplementary Table S4, 11.28%), while RAM 31211 has the highest overall proportion (Supplementary Table S4, 11.64%). Three of the Class II coprolites (RAM 31211, 31212, and 17557) are more densely packed with larger bone inclusions suggesting that the producers were capable of consuming the bones whole, with limited mastication of prey items compared to the producers of the Class I coprolites. In this case, producers of these Class II coprolites were able to extract nutrients with minimal bone-crushing required to consume the prey item. Most likely, this is attributed to the smaller size of the prey item itself for which durophagous mastication was not necessary (Pokines and Tersigni-Tarrant, 2012). On the other hand, the Class II coprolites also preserve smaller bones compared to Class I coprolites, as seen by the significantly smaller median values in feret diameters in Class II compared to Class I coprolites (Figures 12B–D). These smaller bones show evidence of intense fragmentation (RAM 31209, Figure 8I and RAM 31214, Figure 8L) which lends support to the capacity for bone-crushing when required for larger prey items, or once the higher-return nutrient-rich organs had been eaten (Pokines and Tersigni-Tarrant, 2012). More direct evidence for a bone-crushing habit is displayed in Bone 1 of RAM 31209 (Figure 10A) which features a clear indent on the flat surface of the bone where the bone has been partially crushed, as well as tooth marks in Bone 6 of RAM 17517 (Figure 9E). There is also some tentative evidence to suggest gnawing or bone cracking in Bone 12 of RAM 31212 (Figure 9D) exhibited by the somewhat rounded edges on the proximal base plate. It is worth noting that the degree to which stomach acids have caused shrinkage or subsequent breakage of the ingested bone material in the Class II coprolites is difficult to discern and could potentially further account for some reduction in bone fragment size (Fernández-Jalvo et al., 2014). However, the clear boundaries visible between the matrix and the bone material via the CT tomogram slices might attest to the relative resistance of these bone fragments to acid dissolution.
In a previous study employing comparable µCT methods, evidence of an osteophagous diet was inferred from two carnivoran coprolites of discrete sizes from the late Miocene, Spain (Abella et al., 2022). Evidence of osteophagy was based on abundant skeletal inclusions including fragments that appeared to belong to larger bones while others display depressions resembling partial tooth marks. Similar to the Class I PSMP coprolites, the larger specimen of the Spanish coprolites (specimen BAT-3′9.178) preserves irregular bone fragments not identifiable to a specific anatomical bone but does show evidence of digestive corrosion (Abella et al., 2022). The smaller coprolite (BAT-3′10.153), which is comparable in length to the PSMP Class I coprolites exhibits more complete skeletal elements and has a greater proportion of bone inclusions relative to the larger coprolite at the same locality (Abella et al., 2022; Figures 4, 6). Several medium-sized carnivores were suggested as the producer of the smaller coprolite though the most probable was Protictitherium crassum, a member of Hyaenidae.
These findings conform with the borophagine canids interpretation of Lofgren et al. (2017), to the extent that 1) some of the predators consumed whole bones; 2) there was a degree of bone fracturing that occurred, especially in the smaller coprolites; and 3) evidence of digestive corrosion was present.
In previous work, Lofgren et al. (2017) hypothesize that the relationship between the diameter of a producer’s feces and its body mass, in conjunction with the relative abundance of the respective carnivore species in the PSMP could be applied to determine the likelihood of the producer itself. Several different mammalian predators have been recovered from the PSMP site, belonging to eight different species (Lofgren et al., 2017) including Hyaenodon microdon (Mellett, 1977), Hyaenodon crucians (Leidy, 1853), H. gregarius (Cope, 1873), Mustelavus priscus (Clark, 1936, in Scott and Jepsen, 1936), B. dodgei (Scott, 1898), Parictis montanus (Clark and Guensburg, 1972), Daphoenictis tedfordi (Hunt, 1974), and Palaeogale sectoria (Gervais, 1848). After estimating the overall body mass of the predators and their mean prey mass (see Table 2), Lofgren et al. (2017) deduced that the range in diameters of larger coprolites may have represented multiple species, concluding that B. dodgei was most likely due to the abundance of dentigerous elements in the deposit (77% of the larger species). Similarly, the smaller coprolites could have been produced by P. sectoria, P. montanus, Hyaenodon crucians, H. microdon, and H. gregarius (Lofgren et al., 2017). Although the body mass estimates are congruent with Hy. crucians as a likely producer, the bone alteration observed in the smaller coprolites is more consistent with extant canids and hence Hes. gregarius was inferred as the main producer of the smaller coprolites (Lofgren et al., 2017).

TABLE 2. Summary of the main carnivorous species found in the PSMP. Data derived from LaGarry (2004)a; Lofgren et al. (2017)b; Christison et al. (2022)c.
While the coprolite interior volumes and bone inclusions observed herein did not reveal any unambiguous details as to which taxon might have excreted the coprolites, they did show that at least the Class I producers had aggressive gastrointestinal environments that could digest bone material and cartilage. This is presumably comparable to the bone-crushing habits of modern spotted hyaenas (Crocuta), which are also known to consume (and occasionally regurgitate) indigestible materials such as hair (Kruuk, 1972; Di Silvestre et al., 2000). However, as noted by Wang et al. (2018) in their assessment of the California carnivoran coprolites, there is a paucity of literature investigating gastric pH across broader Carnivora, and hence it is highly speculative to make further inferences as to the identity of the producer based on broad assumptions of a bone-dissolving gastrointestinal system alone.
The value of using µCT as a non-destructive method in extracting information on the internal inclusions of coprolite samples has been well-demonstrated (Qvarnström et al., 2017; 2019). However, specific advantages, limitations, and implicit biases encountered herein are worthy of discussion. We note that while X-ray microscopy can certainly add value to the study of coprolites, results depend on the resolution of the CT scan and the nature of the specimen. In some cases, using μCT alone may not be sufficient to fully describe the internal constituents of bromalites for a particular investigation, and it is recommended to use it in conjunction with other techniques for a more comprehensive analysis. The difficulty of identifying bone inclusions within the PSMP coprolites using µCT to a level beyond generic bone type was not a limitation of µCT itself, but rather a consequence of how much the bones were masticated and digested. Similar results were documented by Abella et al. (2022), wherein they solely used µCT, but found many of the bones were not identifiable to a certain anatomical bone or taxon, and instead the authors relied on describing the general shape and features. Studies comparing the results of mechanical extraction and µCT analysis have encountered similar difficulties. For example, investigations of neolithic midden deposits from Swifterbant, Netherlands, used paired µCT and physical extraction methods to examine phytoliths and bone fragments from finely layered and coprolite-hosting deposits (Huisman et al., 2014). Results showed that many bone features were visible using both methods, though comparably more recognizable bone elements were identified in the sieved material (n = 32) compared to µCT (n = 7 with confidence, 5 unable to be attributed to species level) (Huisman et al., 2014). The benefit of using µCT in the case of the Swifterbant material, was the ability to provide microstratigraphic context as well as recognize articulated remains and material too small to appear in the sieved fraction (Huisman et al., 2014). A noteworthy finding comparable to observations made in the material herein was that identification of the skeletal components was not dependent on how the bones were extracted, but rather on how completely the bones were preserved (Huisman et al., 2014). Bones with few distinguishable features as a consequence of mastication and digestive processes are going to appear almost identical whether observed virtually or as physically extracted material. In the case of the present study, surface renders of select bones were blurred by ill-defined edges and significant degradation due to the digestive processes which reduced the phase contrast between bone inclusions and the surrounding phosphatic matrix. This further emphasizes that potential limitations on µCT are associated with the degree of preservation of the inclusions and not solely the imaging technique.
The primary advantage of using µCT in this study was the ability to reveal volumes, including pores and moldic remains of fossil hair, that would not otherwise be attainable via traditional disaggregation methods. These structures were readily visible in tomographic slices, in both standard and targeted higher resolution scans, and could be extracted to display their morphology as well as their distribution in 3D space (Figure 7). Because hair tubules represent external molds, mechanical or chemical extraction of inclusions would impede the detection of such features at all. Even thin sectioning only provides a very shallow 3D view of these fossil hair follicles and may preclude unambiguous identification of the elongate molds from other potential explanations (i.e., burrows, desiccation cracks). Hair imprints in phosphate aggregates from a Palaeolithic cave site in Western Slovenia have similarly been revealed by µCT methods (Turk et al., 2015). Though the PSMP hair molds could not be attributed to any specific taxon, their prevalence throughout the coprolite may provide insight into the higher taxonomic affiliation to prey items (i.e., mammalian), or alternatively could allude to the affinity of the consumer (e.g., if they ingested their own hair while grooming). Based on analysis of modern vertebrate carnivore scat, the digestibility of hair varies between predator and prey item, however, under most circumstances, it is significantly less digestible compared to bone (Ackerman et al., 1984; Baker et al., 1993; Gamberg and Atkinson, 2016). The presence of hair in feces also can persist for several days after initial consumption depending on the rate of passage through the intestine (Helm, 1984; Kelly and Garton, 1997; Pires et al., 2011). Consequently, we hypothesize that coprolites have a higher likelihood of preserving hair remains when compared to body fossils, and introduce taphonomic bias toward bromalites as a source of information on hair structures and morphology. This supports previous studies that demonstrate the potential of bromalites to facilitate exceptional preservation of soft tissues (Chin et al., 2003; Qvarnstrom et al., 2017; Gordon et al., 2020).
Internal porosity and associated characteristics of the pores were overlooked in previous examination of this material (Lofgren et al., 2017) and are easily removed via consumptive sampling methods. Though it is difficult to ascertain whether such original features were considered or overlooked in other coprolite studies (Wang et al., 2018; Romaniuk et al., 2020; Abella et al., 2022), this raises concern for a potential reporting bias in the visualization of segmented volume renders in isolation to tomographic slice data. Ideally, pairing cross-sectional tomographic data directly with volumetric reconstructions (e.g., Turk et al., 2015; figures 4, 5; Shillito et al., 2020; figure 3) promotes transparency in documenting coprolite internal composition. Moreover, tomographic slices should be made available upon publication (whether via the journal or repository institution) to facilitate reproducibility of the analysis. Porosity of coprolites is likely an important primary and taphonomic feature. The presence of pores may have broader implications for gut function and health, hence understanding pore morphology, abundance, and distribution is relevant to revealing both palaeobiological data of the producer and the diagenetic history of the overall coprolite specimen.
X-ray tomographic microscopy of twelve coprolites examined herein provides key insights into the diet, feeding behavior, and physiology of the producers from the Miocene Pipestone spring Main Pocket, Montana. The application of µCT was a viable alternative to consumptive sampling and was able to differentiate internal inclusions and volumes, including bones and pores, from the overall matrix. Across the two coprolite size classes, several different bone types of varying quality are preserved. Although µCT methods were able to extract the skeletal inclusions in detail, the condition of the bones as a result of the overall digestive process precluded taxonomic identification and hence limited descriptions to general bone type. A primary benefit to employing µCT methods is the ability to extract details of internal structures that would be unattainable via consumptive sampling methods. Foremost is the presence of pores and tubular hair molds within the coprolite matrix, which we describe in coprolites of this locality for the first time.
The size, shape, and abundance of bone inclusions in conjunction with hair impressions demonstrate these predators consumed vertebrate prey. Depending on the size of the prey, the respective producers of the coprolite size classes may have adapted different feeding habits to maximize the return on nutrients. The larger coprolites contained comparatively fewer complete bones but were highly fragmented suggesting bone-crushing habits. Alternatively, the variability in the smaller coprolites containing both complete bone morphologies in greater proportions as well as fragmented bone implies both whole consumption and bone-crushing behavior.
Overall, application of µCT methodologies will allow for further standardization of coprolite studies. With the growth of virtual paleontology, an opportunity has presented itself for the expansion of coprolite research and the integration of novel qualitative and quantitative analyses. Where coprolite samples were once damaged or destroyed via traditional methods, µCT provides a valuable means to preemptively survey specimens to target regions of interest that maximize data return whilst minimizing consumptive sampling for thin sectioning, SEM and elemental analyses. Within the sample subset described here, certain coprolites possess minimal inclusions and consequently would offer a limited view of the internal heterogeneity present within the sample population. Moreover, it is desirable that prior to destructive sampling, a virtual record of the coprolite is retained for reference. To this end, µCT may be instrumental in the long-term preservation and curation of coprolite samples, and simultaneously promote sharing 3D datasets via online repositories. Ultimately, this facilitates opportunities to share qualitative and quantitative µCT datasets via digital repositories. Such methodologies enable greater standardization of methods and allow for more comparative analyses to expand the field of coprolite research.
The datasets presented in this study can be found in online repositories. The names of the repository/repositories, accession numbers and DOIs can be found in the article/Supplementary Material.
SJ: conceptualization, methodology, supervision, writing—review and editing, investigation, resources, visualization, project administration, data curation, funding acquisition. J-LW: writing—original draft, software, investigation, visualization. JH: formal analysis, visualization, editing. TS: visualization, funding acquisition. JS: visualization, resources, funding acquisition. All authors contributed toward edits to the final submitted manuscript.
Research presented herein was supported by the University of Missouri Research Council Award (URC-20-046), which provided funds for CT scanning and SEM imaging. SJ and J-LW were supported by NSF Sedimentary Geology and Paleobiology Award (EAR-SGP) 1917031. J-LW was also supported by the Department of Geological Sciences, University of Missouri. JS and the X-ray Microanalysis Core were supported by NSF Instrumentation and Facilities (EAR/IF) 1636643. JH and JS were supported by NSF EAR CAREER 1650745 and 1652351 respectively.
We appreciate the valuable comments made by two reviewers which greatly improved the overall quality of the manuscript. We would like to thank Dr. Andrew Farke, Dr. Gabriel Santos, and Bailey Jorgensen from the Raymond M. Alf Museum of Paleontology at the Webb School (Claremont, California, United States) for gathering and loaning the specimens that were used in this study. We appreciate the assistance of Drs Lee Lyman and Casey Holliday for helpful discussions on the identification of select extracted bones from the CT data.
The authors declare that the research was conducted in the absence of any commercial or financial relationships that could be construed as a potential conflict of interest.
All claims expressed in this article are solely those of the authors and do not necessarily represent those of their affiliated organizations, or those of the publisher, the editors and the reviewers. Any product that may be evaluated in this article, or claim that may be made by its manufacturer, is not guaranteed or endorsed by the publisher.
The Supplementary Material for this article can be found online at: https://www.frontiersin.org/articles/10.3389/feart.2023.1130107/full#supplementary-material
Abella, J., Martín-Perea, D. M., Valenciano, A., Hontecillas, D., Montoya, P., and Morales, J. (2022). Coprolites in natural traps: Direct evidence of bone-eating carnivorans from the late Miocene batallones-3 site, madrid, Spain. Lethaia 54, let.12438–774. doi:10.1111/let.12438
Ackerman, B. B., Lindzey, F. G., and Hemker, T. P. (1984). Cougar food habits in southern Utah. J. Wildl. Manage. 48, 147–155. doi:10.2307/3808462
Arganda-Carreras, I., Kaynig, V., Rueden, C., Eliceiri, K. W., Schindelin, J., Cardona, A., et al. (2017). Trainable Weka segmentation: A machine learning tool for microscopy pixel classification. Bioinformatics 33, 2424–2426. doi:10.1093/bioinformatics/btx180
Arnold, J. (2021). “ggthemes: Extra themes, scales and geoms for 'ggplot2'. R package,”. version 4.2.4.
Bajdek, P., Qvarnström, M., Owocki, K., Sulej, T., Sennikov, A. G., Golubev, V. K., et al. (2016). Microbiota and food residues including possible evidence of pre-mammalian hair in Upper Permian coprolites from Russia. Lethaia 49 (4), 455–477. doi:10.1111/let.12156
Baker, L. A., Warren, R. J., and James, W. E. (1993). Bobcat prey digestibility and representation in scats. Proc. Annu. Conf. Southeast. Assoc. Fish Wildl. Agencies 47, 71–79.
Brachaniec, T., Środek, D., Surmik, D., Niedźwiedzki, R., Georgalis, G. L., Płachno, B. J., et al. (2022). Comparative actualistic study hints at origins of alleged Miocene coprolites of Poland. PeerJ 10, e13652. doi:10.7717/peerj.13652
Bravo-Cuevas, V. M., Morales-García, N. M., Barrón-Ortiz, C. R., Theodor, J. M., and Cabral-Perdomo, M. A. (2017). Canid coprolites from the late pleistocene of hidalgo, central Mexico: Importance for the carnivore record of North America. Ichnos Int. J. Plant Animal Traces 24, 239–249. doi:10.1080/10420940.2016.1270209
Bryant, V. M. J. (1970). “Late full-glacial and postglacial pollen analysis of Texas sediments,” in Unpublished PhD thesis (Austin: University of Texas).
Chin, K., Eberth, D. A., Schweitzer, M. H., Rando, T. A., Sloboda, W. J., and Horner, J. R. (2003). Remarkable preservation of undigested muscle tissue within a late cretaceous tyrannosaurid coprolite from Alberta, Canada. Palaios 18, 286–294. doi:10.1669/0883-1351(2003)018<0286
Chin, K. (2007). The paleobiological implications of herbivorous dinosaur corprolites from the Upper Cretaceous two medicine formation of Montana: Why eat wood? Palaios 22, 554–566. doi:10.2110/palo.2006.p06-087r
Christison, B. E., Gaidies, F., Pineda-Munoz, S., Evans, A. R., Gilbert, M. A., and Fraser, D. (2022). Dietary niches of creodonts and carnivorans of the late Eocene cypress hills formation. J. Mammal. 103 (1), 2–17. doi:10.1093/jmammal/gyab123
Clark, J. (1936). Diagnosis of metacodon and description of M. magnus. Scott, W. B., and G. L. Jepsen The mammalian fauna of the white river oligocene: Part 1. Insectivora and Carnivora (Pennsylvania: Transactions of the American Philosophical Society).
Clark, J., and Guensburg, T. E. (1972). Arctoid genetic characters as related to the genus. Parictis Fieldiana Geol. 26, 1–76.
Cope, E. D. (1873). Third notice Of extinct vertebrata from the tertiary of the plains. Paleontological Bulletin 16, 1–8.
Davison, A. C., and Hinkley, D. V. (1997). Bootstrap methods and their applications. Cambridge: Cambridge University Press.
Di Silvestre, I., Novelli, O., and Bogliani, G. (2000). Feeding habits of the spotted hyaena in the niokolo koba national park, Senegal. Afr. J. Ecol. 38 (2), 102–107. doi:10.1046/j.1365-2028.2000.00220.x
Eriksson, M. E., Lindgren, J., Chin, K., and Månsby, U. (2011). Coprolite morphotypes from the upper cretaceous of Sweden: Novel views on an ancient ecosystem and implications for coprolite taphonomy. Lethaia 44, 455–468. doi:10.1111/j.1502-3931.2010.00257.x
Fernández-Jalvo, Y., Andrews, P., Sevilla, P., and Requejo, V. (2014). Digestion versus abrasion features in rodent bones. Lethaia 47 (3), 323–336. doi:10.1111/let.12061
Fry, G. F. (1970). “Preliminary analysis of the hogup cave coprolites,” in Hogup cave ed. Aikens (Salt Lake City: University of Utah Press, University of Utah Anthropological Papers).
Gamberg, M., and Atkinson, J. L. (2016). Prey hair and bone recovery in ermine scats. J. Wildl. Manage. 52, 657–660. doi:10.2307/3800926
Gervais, P. M. P. (1848). Zoologie et paléontologie françaises (animaux vertébrés): ou nouvelles recherches sur les animaux vivants et fossiles de la France. Libraire de la Société de Géographie, Paris, 271. doi:10.5962/bhl.title.39473
Gordon, C. M., Roach, B. T., Parker, W. G., and Briggs, D. E. G. (2020). Distinguishing regurgitalites and coprolites: A case study using a triassic bromalite with soft tissue of the pseudosuchian archosaur revueltosaurus. Palaios 35, 111–121. doi:10.2110/palo.2019.099
Hanneman, D. L., Lofgren, D., Hasiotis, S. T., and Mcintosh, W. C. (2022). Late Eocene (Priabonian) chronostratigraphy, depositional environment, and paleosol-trace fossil associations, Pipestone Springs, southwest Montana. Acta Palaeontol. Pol. 67 (1), 5–20. doi:10.4202/app.00901.2021
Helm, R. C. (1984). Rate of digestion in three species of pinnipeds. Can. J. Zool. 62, 1751–1756. doi:10.1139/z84-258
Herbig, H. G. (1993). First upper devonian crustacean coprolites: Favreina prima n. sp. from northern Morocco. J. Paleontol. 67 (1), 98–103. doi:10.1017/s002233600002120x
Hollocher, T. C., Chin, K., Hollocher, K. T., and Kruge, M. A. (2001). Bacterial residues in coprolite of herbivorous dinosaurs: role of bacteria in mineralization of feces. Palaios 16, 547–565. doi:10.1669/0883-1351(2001)016<0547:BRICOH>2.0.CO;2
Horwitz, L. K., and Goldberg, P. (1989). A study of Pleistocene and Holocene hyaena coprolites. J. Archaeol. Sci. 16, 71–94. doi:10.1016/0305-4403(89)90057-5
Huisman, D. J., Ngan-Tillard, D., Tensen, M. A., Laarman, F. J., and Raemaekers, D. C. M. (2014). A question of scales: studying Neolithic subsistence using micro CT scanning of midden deposits. Journal of Archaeological Science. doi:10.1016/j.jas.2014.05.006
Hunt, A. P., Lucas, S. G., Milàn, J., and Spielmann, J. A. (2012). Vertebrate coprolite studies: Status and prospectus. NMMNH&S 57, 5–24.
Hunt, R. M. (1974). Daphoenictis, a cat-like carnivore (mammalia, amphicyonidae) from the oligocene of North America. J. Paleontology 48 (5), 1030–1047.
Jouy-Avantin, F., Debenath, A., Moigne, A. M., and Moné, H. (2003). A standardized method for the description and the study of coprolites. J. Archaeol. Sci. 30 (3), 367–372. doi:10.1006/jasc.2002.0848
Kalantar-Zadeh, K., Berean, K. J., Burgell, R. E., Muir, J. G., and Gibson, P. R. (2019). Intestinal gases: Influence on gut disorders and the role of dietary manipulations. Nat. Rev. Gastroenterology Hepatology 16, 733–747. doi:10.1038/s41575-019-0193-z
Kelly, B. T., and Garton, E. O. (1997). Effects of prey size, meal size, meal composition, and daily frequency of feeding on the recovery of rodent remains from carnivore scats. Can. J. Zool. 75, 1811–1817. doi:10.1139/z97-810
Kruuk, H. (1972). The spotted hyena: A study of predation and social behavior. Chicago: University of Chicago Press.
Kuenzi, W. D., and Fields, R. W. (1971). Tertiary stratigraphy, structure, and geologic history, Jefferson Basin, Montana. Geol. Soc. Am. Bull. 82, 3373–3394. doi:10.1130/0016-7606(1971)82[3373:TSSAGH]2.0
LaGarry, H. E. (2004). “Taphonomic evidence of bone processing from the Oligocene of northwestern Nebraska,” in School of natural Resources, institute of agriculture and natural Resources (United States: University of Nebraska-Lincoln).
Landini, G. (2006). Background illumination correction. https://blog.bham.ac.uk/intellimic/background-illumination-correction (Accessed March 21, 2021).
Leidy, J. (1853). Remarks on a collection of fossil Mammalia from Nebraska. Proc. Acad. Nat. Sci. Phila. 6, 392–394.
Leprince, P., Dandrifosse, G., Goffinet, G., and Schoffeniels, E. (1980). How are feathers digested by raptors? Biochem. Syst. Ecol. 8, 211–219. doi:10.1016/0305-1978(80)90014-9
Levitt, M. D., and Bond, J. H. (1970). Volume, composition, and source of intestinal gas. Gastroenterology 59, 921–929. doi:10.1016/s0016-5085(19)33654-6
Lofgren, D. L., Shen, C. Y., Buday, N. N., Ylagan, C. A., Lofgren, K. K., Lai, R., et al. (2017). Coprolites and mammalian carnivores from Pipestone Springs, Montana, and their paleoecological significance. Ann. Carnegie Mus. 84 (4), 265–285. doi:10.2992/007.084.0402
Maechler, M. (2021). “diptest: Hartigan's dip test statistic for unimodality - corrected,”. R package version 0.76-0.
Magondu, B. W. (2021). “Fracture mechanics of pelleted feces within mammals,” in Undergraduate research option thesis (Georgia: Georgia Institute of Technology).
Mellett, J. S. (1977). Paleobiology of North American Hyaenodon (Mammalia, Creodonta). Paleobiology of North American Hyaenodon (Mammalia, Creodonta) 1, 1–134.
Munsell Color (Firm) (2010). Munsell soil color charts: With genuine Munsell color chips. Grand Rapids, MI: Munsell Color.
Myhrvold, N. P. (2012). A call to search for fossilised gastric pellets. Hist. Biol. 24, 505–517. doi:10.1080/08912963.2011.631703
Northwood, C. (2005). Early Triassic coprolites from Australia and their palaeobiological significance. Palaeontology 48 (1), 49–68. doi:10.1111/j.1475-4983.2004.00432.x
Orr, J. B. (1958). “The tertiary of Western Montana,” in Society of vertebrate paleontology, 8th annual field conference guidebook , 25–33.
ORS: Object Research Systems (2020). Dragonfly software v. 2020.2 Build 941–v. 2022.2. Montréal, Canada: ORS: Object Research Systems, Inc. Available at: http://www.theobjects.com/dragonfly.
Pires, M. M., Widmer, C. E., Silva, C., and Setz, E. Z. F. (2011). Differential detectability of rodents and birds in scats of ocelots, Leopardus pardalis (Mammalia: Felidae). Zoologia 28, 280–283. doi:10.1590/S1984-46702011000200019
Pokines, J. T., and Tersigni-Tarrant, M. A. (2012). “Forensic anthropology: An introduction,” in Forensic anthropology: An introduction. Editors M. A. Tersigni-Tarrant, and N. R. Shirley (Boca Raton (FL): CRC Press).
Prothero, D. R. (1984). Magnetostratigraphy of the early oligocene Pipestone Springs locality, Jefferson county, Montana. Contributions Geol. Univ. Wyo. 23 (1), 33–36.
Qvarnström, M., Niedźwiedzki, G., Tafforeau, P., Žigaite, Ž., and Ahlberg, P. E. (2017). Synchrotron phase-contrast microtomography of coprolites generates novel palaeobiological data. Sci. Rep. 7, 2723. doi:10.1038/s41598-017-02893-9
Qvarnström, M., Wernström, J. V., Piechowski, R., Tałanda, M., Ahlberg, P. E., and Niedźwiedzki, G. (2019). Beetle-bearing coprolites possibly reveal the diet of a Late Triassic dinosauriform. R. Soc. Open Sci. 6, 181042. doi:10.1098/rsos.181042
Pimentel, M., Lin, L. N., Enayati, P., Van Den Burg, B., Lee, H. R., Chen, J. H., et al. (2006). Methane, a gas produced by enteric bacteria, slows intestinal transit and augments small intestinal contractile activity. American Journal of Physiology-Gastrointestinal and Liver Physiology 290, 1089–1095. doi:10.1152/ajpgi.00574.2004
R Core Team (2017). R: A language and environment for statistical computing. Vienna, Austria: R Foundation for Statistical Computing.
Romaniuk, A. A., Panciroli, E., Buckley, M., Pal Chowdhury, M., Willars, C., Herman, J. S., et al. (2020). Combined visual and biochemical analyses confirm depositor and diet for Neolithic coprolites from Skara Brae. Archaeol. Anthropol. Sci. 12, 274. doi:10.1007/s12520-020-01225-9
Schindelin, J., Arganda-Carreras, I., Frise, E., Kaynig, V., Longair, M., Pietzsch, T., et al. (2012). Fiji: An open-source platform for biological-image analysis. Nat. methods 9, 676–682. doi:10.1038/nmeth.2019
Scott, W. B., and Jepsen, G. L. (1936). The mammalian fauna of the white river oligocene: Part I. Insectivora and Carnivora. Trans. Am. Philos. Soc. 28 (1), 1–153. doi:10.2307/1005507
Scott, W. B. (1898). Notes on the canidae of the white river oligocene. Proc. Am. Philos. Soc. 19, 325–415. doi:10.2307/1005497
Scrucca, L., Fop, M., Murphy, T. B., and Raftery, A. E. (2016). Mclust 5: Clustering, classification and density estimation using Gaussian finite mixture models. R J. 8 (1), 289–317. doi:10.32614/rj-2016-021
Serafini, G., Gordon, C. M., Foffa, D., Cobianchi, M., and Giusberti, L. (2022). Tough to digest: first record of Teleosauroidea (Thalattosuchia) in a regurgitalite from the Upper Jurassic of north-eastern Italy. Papers in Palaeontology 8, 1–22. doi:10.1002/spp2.1474
Shillito, L. M., Blong, J. C., Green, E. J., and van Asperen, E. N. (2020). The what, how and why of archaeological coprolite analysis. Earth Sci. Rev. 207, 103196. doi:10.1016/j.earscirev.2020.103196
Suarez, F. L., and Levitt, M. D. (2000). An understanding of excessive intestinal gas. Curr. Gastroenterol. Rep. 2, 413–419. doi:10.1007/s11894-000-0042-8
Tabrum, A. R., Prothero, D. R., Garcia, D., and Emry, R. J. (1996). “Magnetostratigraphy and biostratigraphy of the Eocene-Oligocene transition, southwestern Montana”,” in The terrestrial eocene-oligocene transition in North America. Editors D. R. Prothero, and R. J. Emry (Cambridge: Cambridge University Press).
Taru, P., and Backwell, L. (2013). Identification of fossil hairs in Parahyaena brunnea coprolites from Middle Pleistocene deposits at Gladysvale cave, South Africa. J. Archaeol. Sci. 40 (10), 3674–3685. doi:10.1016/j.jas.2013.04.031
Turk, J., Čretnik, J., Turk, M., and Mladenovič, A. (2015). Hair imprints in Pleistocene cave sediments and the use of X-ray micro-computed tomography for their reconstruction. Facies 61 (422). doi:10.1007/s10347-014-0422-4
Wang, X., White, S. C., Balisi, M., Biewer, J., Sankey, J., Garber, D., et al. (2018). First bone-cracking dog coprolites provide new insight into bone consumption in Borophagus and their unique ecological niche. Elife 7, e34773. doi:10.7554/eLife.34773
Keywords: coprolite, taphonomy, μCT, diet, hair
Citation: Jacquet SM, Webb J-L, Huntley JW, Selly T and Schiffbauer JD (2023) X-ray tomographic microscopy of Eocene coprolites from Pipestone Springs Main Pocket, southwest Montana. Front. Earth Sci. 11:1130107. doi: 10.3389/feart.2023.1130107
Received: 22 December 2022; Accepted: 06 April 2023;
Published: 21 April 2023.
Edited by:
Elizabeth Clark, University of California, Berkeley, United StatesReviewed by:
Caleb Gordon, Yale University, United StatesCopyright © 2023 Jacquet, Webb, Huntley, Selly and Schiffbauer. This is an open-access article distributed under the terms of the Creative Commons Attribution License (CC BY). The use, distribution or reproduction in other forums is permitted, provided the original author(s) and the copyright owner(s) are credited and that the original publication in this journal is cited, in accordance with accepted academic practice. No use, distribution or reproduction is permitted which does not comply with these terms.
*Correspondence: Sarah M. Jacquet, amFjcXVldHNAbWlzc291cmkuZWR1
Disclaimer: All claims expressed in this article are solely those of the authors and do not necessarily represent those of their affiliated organizations, or those of the publisher, the editors and the reviewers. Any product that may be evaluated in this article or claim that may be made by its manufacturer is not guaranteed or endorsed by the publisher.
Research integrity at Frontiers

Learn more about the work of our research integrity team to safeguard the quality of each article we publish.