 Dan Wang1,2†
 Youpu Dong
94% of researchers rate our articles as excellent or good
Learn more about the work of our research integrity team to safeguard the quality of each article we publish.
Find out more
ORIGINAL RESEARCH article
Front. Earth Sci., 03 July 2023
Sec. Structural Geology and Tectonics
Volume 11 - 2023 | https://doi.org/10.3389/feart.2023.1129217
This article is part of the Research TopicLithosphere and Surface Processes of the Sichuan Basin and Surrounding Areas: Resources and Environmental EffectsView all 6 articles
Both tectonism and erosion are presumed to have influenced the landscape evolution of the Xiaojiang Region, SE Tibetan Plateau. However, it remains unclear which of these broad processes has played the dominant role in determining landscape form and evolution. To establish the relative importance of these two processes, we measured river longitudinal profiles and spatial variation in selected geomorphic indices within the region. We measured longitudinal profiles along four large rivers from north to south through the region and also measured drainage basin asymmetry, basin shape index, hypsometric integral, normalized stream-length gradient index, and the ratio of valley-floor width to valley height of 77 drainage basins in this region. The four longitudinal profiles reveal that tectonic activity decreases from north to south. Spatial variation in geomorphic indices reflects that the topography in the Xiaojiang Region may be primarily influenced by three major faults: the Xiaojiang fault, the Shiping fault, and the Qujiang fault, rather than influenced by precipitation, lithology, and drainage reorganization. The tectonic activity in different parts of the region shows that the northern part is the most active, the central part is the least active, and the southern part is moderately active. It is concluded that the spatial variation in landscape form and evolution of the Xiaojiang Region has been influenced more strongly by tectonics than by erosion.
Different models have been proposed for explaining the evolution of the southeastern Tibetan Plateau. The oblique shortening and extrusion model suggests a stepwise southeastward migration of tectonic rock uplift and surface uplift, with major fault zones accommodating large-scale crustal extrusion and/or shortening and the intensity of tectonic activity in the region gradually decreases from north to south (Tapponnier et al., 1982; Wang et al., 1998; Tapponnier, 2001; Jun et al., 2003; Tian et al., 2014; Wang H. et al., 2017; Wang et al., 2021; Zhu et al., 2021; Wang H. et al., 2022). The lower crustal flow model suggests a different deformation pattern (Clark et al., 2005; Royden et al., 2008; Yuan et al., 2022), and the entire SE Tibetan Plateau experienced uniform southeastward tilting from north to south. The progressive deformation model suggests the deformation changing from localized shortening and thickening along major pre-existing fault zones to lower crustal expansion out of the fault zones (Zhang et al., 2022). Erosionally driven denudation model predicts that the greatest amounts of denudation, and therefore isostatic response, occurred in areas with the greatest precipitation (Champagnac et al., 2012; Olen et al., 2016; Adams et al., 2020; Tao et al., 2020). These hypothesized mechanisms should account for the anomalous topography in the southeastern Tibetan Plateau. In order to test these models and determine which one is most accurate, geomorphic studies are needed to examine the geomorphic variation of the southeastern Tibetan Plateau.
In this study, we aim to assess the geomorphic variation for the southeastern Tibetan Plateau using the example of the Xiaojiang Region, which is located in the southeastern Tibetan Plateau and lies within the East Asian summer monsoon precipitation area (Figure 1A) (Wang et al., 1998; Tapponnier, 2001; Deng et al., 2003; Nie et al., 2018; Li et al., 2019; Wu et al., 2020; Wang H. et al., 2022; Yu et al., 2022). Geomorphic indices are quantitative methods that can be used to measure information about landscape form and evolution and thus infer the controls on landscape evolution (Strahler, 1952; El Hamdouni et al., 2008; Figueroa and Knott, 2010; Perron and Royden, 2013; Wang et al., 2017b; Cheng et al., 2018; He et al., 2019; Shi et al., 2020; Róycka and Migoń, 2021; Wang D. et al., 2022). In this study, we use geomorphic indices based on the analysis of digital elevation models (DEMs) to evaluate the variation in the landscape evolution of the Xiaojiang Region. We measure longitudinal profiles along four large rivers from north to south across the Xiaojiang Region and measure five geomorphic indices for 77 drainage basins in this region (Figure 1B). The ability to discriminate between tectonics and erosion concerning their influences on the geomorphology of the Xiaojiang Region should help our understanding of the nature of landscape evolution in this tectonically active, high-precipitation region. Our finds may provide a geomorphological basis for the understanding the evolution of the southeastern Tibetan Plateau.
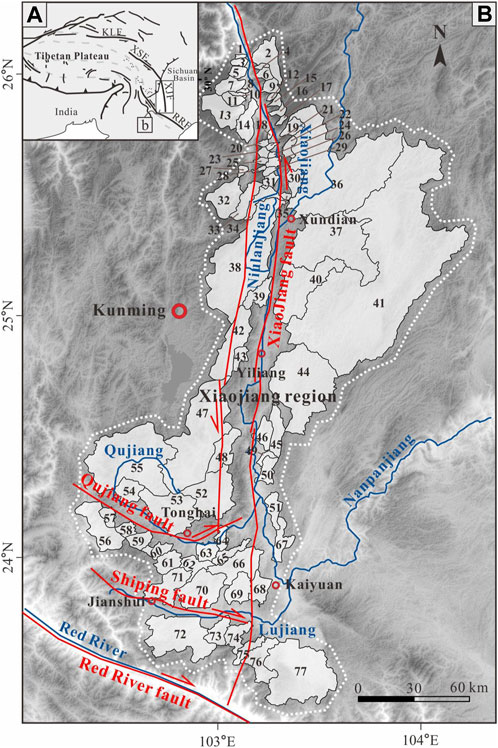
FIGURE 1. (A) Structural sketch map of the Xiaojiang region and surrounding area, showing the location of the study area. (B) Shaded relief map showing the analyzed drainage basins in the Xiaojiang region. Numbers indicate the basins within which geomorphic indices were measured (see Table 1 for detailed information about the drainage basins). KLF, Kunlun fault; XSF, Xianshuihe fault; XJF, Xiaojiang fault; RRF, Red River fault.
The Xiaojiang Region is situated in eastern Yunnan on the southeastern margin of the Tibetan Plateau, which is ∼400-km-long, ∼200-km-wide, which developed along the Xiaojiang fault (Figure 1B). The Xiaojiang Region has been tectonically active throughout the late Quaternary, including the occurrence of some strong earthquakes in historical times, including the 1725 Wanshoushan (Ms = 6.8), 1733 Dongchuan (Ms = 7.8), 1833 Songming (Ms = 8.0), 1927 Xundian (Ms = 6), and 1970 Tonghai (Ms = 7.3) earthquakes (Jun et al., 2003; Paradisopoulou et al., 2007; Wen et al., 2011; Ren, 2013).
The neotectonics of the Xiaojiang Region are dominated by three active faults: the Xiaojiang, Qujiang, and Shiping faults. Of these, the N-S-trending Xiaojiang fault is the main fault and cuts through the entire region, whereas the WNW-ESE-trending Qujiang and Shiping faults occur in the southern part of the region (Wang et al., 1998). Since ∼2–4 Ma, a total displacement of ∼60 km has been estimated for the northern part of the Xiaojiang fault, but to the south, the displacement vanishes rapidly (Wang et al., 1998). The average slip rate of the Xiaojiang fault in the north is ∼10 mm/yr and ∼3.5 mm/yr in the south (King et al., 1997; Xu and Wen, 2003; Li et al., 2019). Qujiang and Shiping faults show a slip rate of 4.5 mm/yr (Wen et al., 2011). The lithology is mainly sandstone, and the strata in this region include extensively distributed Proterozoic and Paleozoic rocks, with local Upper Cretaceous and Cenozoic deposits (Figure 2) (Wang et al., 1998). Several basins containing widespread Quaternary sedimentary strata have been formed in this region (Figure 2) (Wang et al., 1998; Wen et al., 2011).
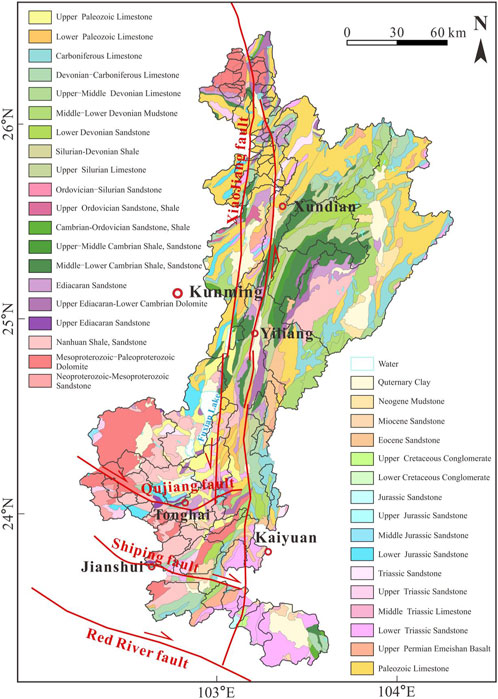
FIGURE 2. Simplified geological map of the Xiaojiang region.
The Xiaojiang Region has a mean annual precipitation of 781.1–1,054.7 mm/yr (period 1970–2019, data downloaded from http://data.cma.cn). Previous research has suggested that spatial variation in erosion caused by spatial variation in monsoon precipitation controls surface processes in this region (Nie et al., 2018; Adams et al., 2020; Tao et al., 2020). The areas of high precipitation are in the central (from Xundian to Yiliang) and southernmost parts of the Xiaojiang Region (Figure 3), whereas the areas of low precipitation are in the northern (north of Xundian) and southern (south of Yiliang) parts of the region.
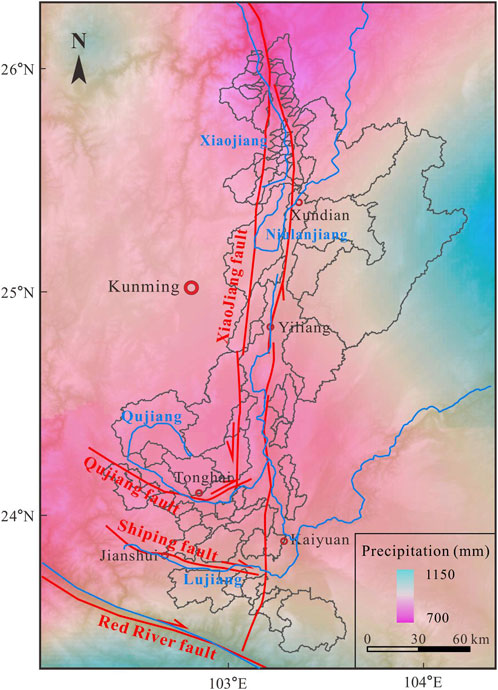
FIGURE 3. Annual precipitation data (period 1970 to 2019; data downloaded from http://data.cma.cn) for the Xiaojiang region.
Geomorphic indices measured at the drainage basin scale were used to capture variation in landscape form (El Hamdouni et al., 2008). Several geomorphic indices including river channel profile form and drainage basin shape were used to measure erosion and deposition processes and to detect anomalies caused by local changes in surface variation and tectonic activity (Strahler, 1952; El Hamdouni et al., 2008; Gao et al., 2013; Tsimi and Ganas, 2015; Cheng et al., 2016; Faghih et al., 2016; Cheng et al., 2018; He et al., 2019; Shi et al., 2020; Róycka and Migoń, 2021; Wang et al., 2021; Wang H. et al., 2022). Monthly precipitation data from the China Meteorological Data Network (period 1970–2019, data downloaded from http://data.cma.cn) were used to calculate the mean annual precipitation by Kriging interpolation for basins in the Xiaojiang Region (Figure 3).
In this study, we selected 77 drainage basins (Nos 1 to 77 from north to south through the Xiaojiang Region; Figure 1) from 3 arc-second global (30 m pixel resolution) Shuttle Radar Topography Mission (SRTM) DEMs (http://www.gscloud.cn/) and used these DEMs in ArcGIS (version 10.2) and MATLAB (version R2015b) software to extract values of five geomorphic indices. The five indices measured were drainage basin asymmetry (AF), basin shape index (BS), hypsometric integral (HI), normalized stream-length gradient index (SLK), and the ratio of valley-floor width to valley height (VF) (Table 1; Figure 4). Furthermore, considering the variation in values of the five geomorphological indices (Figure 4), each index was divided into three classes (Classes 1–3: strong, moderate, and weak) in the study area. Then, based on El Hamdouni et al. (2008), we obtained values of the index of relative active tectonics (IAT) by integrating the five classification values from the primary indices and dividing this composite index into four classes. We also compared the longitudinal profiles of four large rivers and many small basins in the Xiaojiang Region.
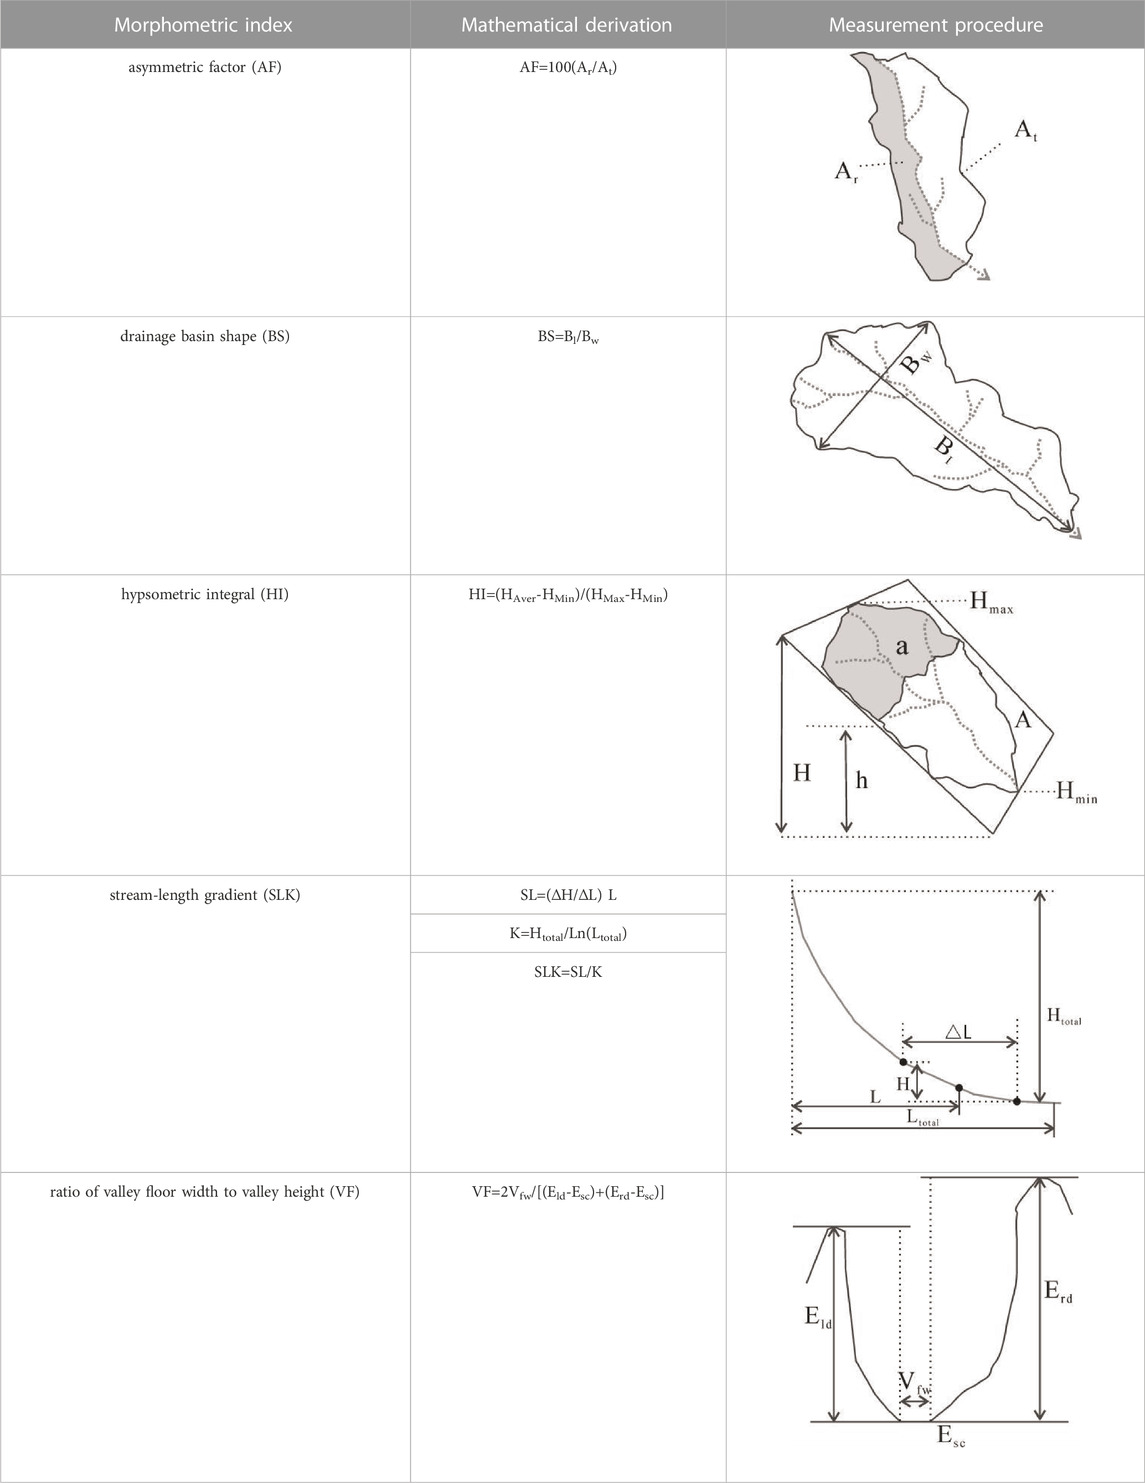
TABLE 1. Summary and explanation of morphometric parameters used to measure landscape form in the present study (based on El Hamdoun et al., 2008; Figueroa and Knott, 2010; Cheng et al., 2018).
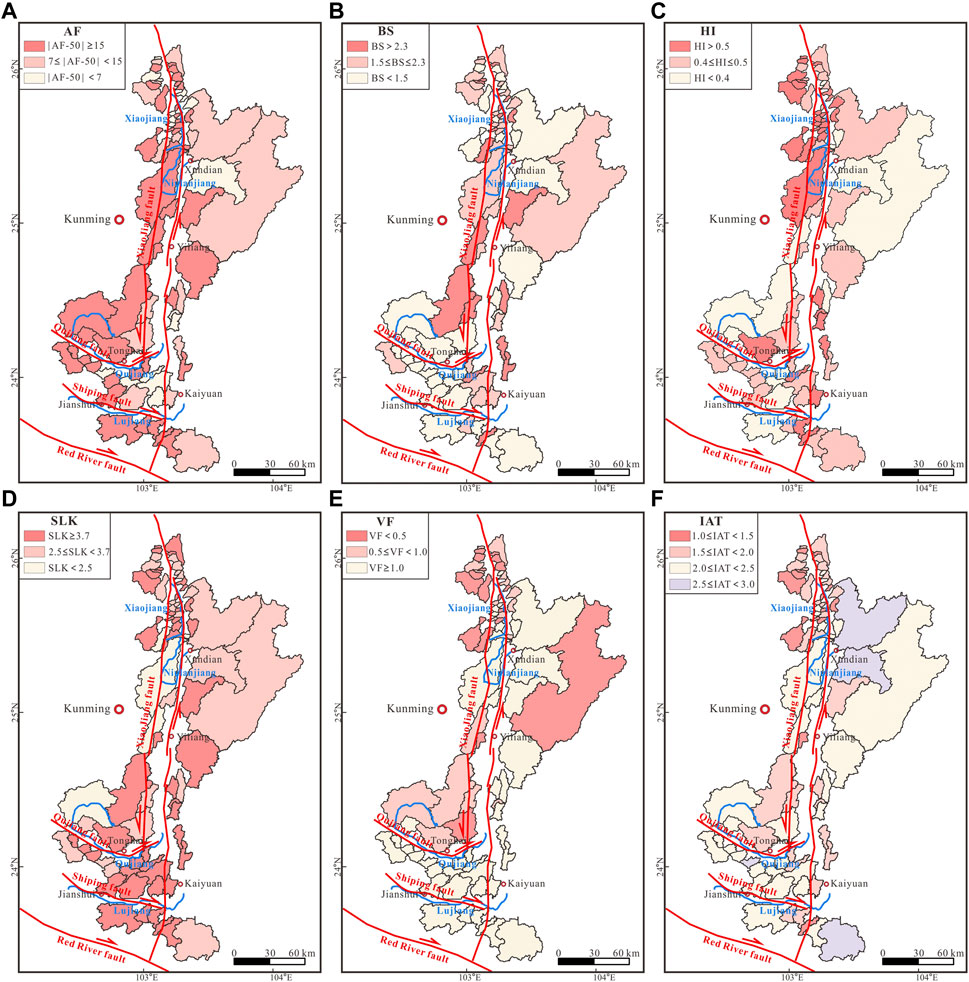
FIGURE 4. Spatial distribution of classes of the five measured geomorphic indices for drainage basins (A–E) and classes of the composite index IAT (F).
The Asymmetric factor index (AF; Figure 4A; Table 1) is a measure of basin asymmetry and can be used to assess geometry tilting at the scale of a drainage basin (El Hamdouni et al., 2008). AF is defined as follows:
where
The drainage basin shape index (BS; Figure 4B; Table 1) is the ratio of the straight-line distance from the source to the outlet of the basin to the maximum width perpendicular to the straight line (Bull and Mcfadden, 1977). The BS index is defined as follows:
where Bl is the length of a basin measured from the highest point to the outlet (lowest point) and Bw is the maximum width of a basin measured perpendicular to Bl (Figure 4B; Table 1) (El Hamdouni et al., 2008; Cheng et al., 2018). In regions of active tectonic activity, relatively young drainage basins often have elongated drainage basins on a mountain’s topographic slope. Higher values of BS reflect more elongated drainage basins which commonly correlated with stronger tectonic activity (El Hamdouni et al., 2008; Cheng et al., 2018). BS values were divided into three classes: (1) BS ≥ 4, (2) 4 > BS ≥ 3, and (3) BS < 3 (El Hamdouni et al., 2008; Cheng et al., 2018).
The hypsometric integral (HI) is an index that describes the distribution of elevation in a given area of a landscape. The integral, which is an index independent of basin area, is typically derived for a specific drainage basin. The area below the hypsometric curve, which is the definition of the index, expresses the volume of an undisturbed basin. The HI measures the relative volume of the basin that has not been eroded. In a given drainage basin, the HI describes the relative distribution of elevation. A high value of the index usually means that less of the uplands have been eroded, which may indicate a younger landscape, perhaps produced by active tectonic movements. The high value of Hi may also be due to the deposition of recent cuts in the young geomorphic surface (Strahler, 1952; El Hamdouni et al., 2008). The HI index is defined as follows (Figure 4C; Table 1):
where HAver is the mean elevation of the drainage basin, HMax is the maximum elevation, and HMin is the minimum elevation. The HI value is divided into three classes: (1) HI > 0.5, (2) 0.4 ≤ HI ≤ 0.5, and (3) HI < 0.4 (El Hamdouni et al., 2008).
The stream-length gradient index (SL; Figure 4D; Table 1) was first defined by Hack (1973) as follows:
where
where Htotal and Ltotal are the altitude difference and length of the entire channel, respectively (Azor et al., 2002). Following a similar study (El Hamdouni et al., 2008), we grouped the SLK values into three classes: (1) SLK ≥ 3.7, (2) 3.7 > SLK ≥ 2.5, and (3) SLK < 2.5.
The ratio of valley-floor width to valley height (VF; Figure 4E; Table 1) can be applied to evaluate regional uplift rates and river incision rates (Bull and Mcfadden, 1977; Keller, 1986; Cheng et al., 2018; Shi et al., 2020). VF is defined as follows (Bull and Mcfadden, 1977):
where Vfw is the valley-floor width; Eld and Erd are left and right valley shoulder elevations, respectively; and Esc is the valley-floor elevation. In the range of 0.5–2.0 km from the stream outlet, the valley cross section was established and the VF value of the basin was calculated. Three classes were defined to reflect the intensity of denudation in valleys: (1) VF < 0.5, (2) 0.5 ≤ VF < 1.0, and (3) VF ≥ 1.0.
A single geomorphic index provides a specific measure and captures particular geomorphological information and associated process signals. Practically, because of the complexity of lithology and structure in many draining basins, a single index inevitably has its limitations and cannot fully reflect patterns of regional geomorphological evolution. A combination of multiple indices to form a composite index can avoid the shortcomings of a single index. El Hamdouni et al. (2008) proposed such a composite index (the IAT) to comprehensively evaluate landscape form and evolution (Figure 4F; Table 1). In this study, five geomorphic indices (AF, BS, HI, SLK, and VF) were combined to form the IAT using Eq. 8:
where S represents the integration of each class level of the indices; and N is the amount of the geomorphic indices. Thus, the tectonic activity is reversely proportional to IAT (Cheng et al., 2018). Four classes were defined to reflect the intensity of denudation in valleys: (1) 1.0 ≤ IAT < 1.5, (2) 1.5 ≤ IAT < 2.0, (3) 2.0 ≤ IAT < 2.5, (4) 2.5 ≤ IAT < 3.0.
Interpretation of tectonic history and the documentation of long-term system changes in drainage basins frequently utilize longitudinal river profiles. When rivers are in equilibrium, they typically have an upward-concave shape. However, until erosion restores balance to the river profile, tectonic uplift may lead to a state of disequilibrium and a convex-upward riverbed form. Active faults can also change the concave-upward shape of river longitudinal profiles into a convex-upward shape (El Hamdouni et al., 2008; Figueroa and Knott, 2010; Haviv et al., 2010; Perron and Royden, 2013; Bagha et al., 2014; Wang et al., 2019). The associated knickpoint will move headward through the river profile to allow equilibrium to be regained. The parts of the river profile downstream of the knickpoint become severely degraded, whereas the upstream segments above the knickpoint maintain their previous equilibrium state (Figueroa and Knott, 2010). The intensity of tectonic activity and the amount of uplift can be determined by examining the knickpoints of longitudinal profiles.
In this study, five landform morphometric indices plus a composite index, as well as four longitudinal river profiles, were examined to assess the spatial variations in landscape form and evolution in the Xiaojiang Region.
The measured values of |AF-50| range from 0.76 to 47.95. (Figure 4A; Supplementary Table S1). Drainage basins in the Xiaojiang Region tend to have high AF values, showing high degrees of tectonic tilting.
Values of BS were calculated for the streams and range from 0.33 to 4.99 (Figure 4B; Supplementary Table S1). The values of BS are highest from Xundian to Tonghai and lowest to the north of Xundian and south of Tonghai (Figure 4B).
In the study area, HI values were calculated for all streams and range from 0.21 to 0.64 (Figure 4C; Supplementary Table S1). In the Xiaojiang Region, HI values are high to the north of Xundian, moderate in the area near and south of Tonghai, and low from Xundian to Tonghai (Figure 4C). Drainage basins with high HI values are found to the north of Xundian, where the Tangdan thrust block and its surrounding area have been uplifted during the late Quaternary (Wang et al., 1998; Wang and Wang, 2005). The drainage basins from Xundian to Tonghai have low HI values, which may reflect older landscapes and weak erosion. High HI values are found in drainage basins 53, 65, 68, 75, and 76, which are located in the southern part of the Xiaojiang Region in the vicinity of the Qujiang and Shiping faults (Wen et al., 2011).
Values of SLK range from 0.97 to 6.12 (Figure 4D; Supplementary Table S1) and are high to both the north and south of Yiliang and low from Xundian to Yiliang. There is an SLK value anomaly to the north of Xundian near the Tangdan thrust block and surrounding areas, which have been uplifted during the Quaternary (Wang et al., 1998; Wang and Wang, 2005). The high SLK values of drainage basins to the south of Yiliang are attributed to regional rapid uplift caused by strike-slip and thrust movement on the Qujiang and Shiping faults (Wen et al., 2011).
In the study area, values of VF range from 0.17 to 5.66 (Figure 4E; Supplementary Table S1) and are low to the north of Xundian and from Yiliang to Tonghai, and high from Xundian to Yiliang and south of Tonghai. Drainage basins with values in VF classes 1 and 2 are found to the north of Xundian and from Yiliang to Tonghai, where fluvial downcutting is pronounced, and most river valleys are V-shaped (Figure 4E).
In this study, IAT values are computed as a composite of values of the five measured geomorphic indices. The map of IAT values (Figure 4F) reveals that 4.2% of the area of the studied region is class 1, 20.5% is class 2, 56.3% is class 3, and 18.9% is class 4 (Figure 4F; Supplementary Table S1). The IAT results show that the level of tectonic activity in the Xiaojiang Region is strong to the north of Xundian, weak from Xundian to Yiliang, and moderate near and to the south of Tonghai.
River longitudinal profiles can be interpreted in terms of height difference, knickpoints, and topographic parameters. Knickpoints demarcate the abrupt change between the steeper downstream channel and the lower-gradient upstream channel (Figure 5) (El Hamdouni et al., 2008; Figueroa and Knott, 2010; Haviv et al., 2010; Perron and Royden, 2013; Bagha et al., 2014; Wang et al., 2019). We chose four large rivers (the Xiaojiang, Niulanjiang, Qujiang, and Lujiang rivers) in the Xiaojiang Region and analyzed their longitudinal channel profiles (Figure 5). Of these, only the Xiaojiang River shows an obvious knickpoint (Figure 5A), and dams or karst caves are located on the other three rivers, meaning that knickpoints can be examined only for the Xiaojiang River. The channel of the Niulan River is smooth (Figure 5B), and the ∼800–1,000 m height difference between the Qujiang and Lujiang rivers is large, which may have been caused by differential movements across the Qujiang and Shiping faults (Figures 5C, D) (Wen et al., 2011). We also measured topographic parameters (maximum, mean, and minimum elevations and local relief) for 10-km-wide sections centered on the four analyzed rivers (Figure 6). The Xiaojiang River, which is developed along the eastern branch of the Xiaojiang fault, is highly erosive and has resulted in a height difference of more than 1700 m from the maximum height to the minimum at the same place (Figure 6A). The height difference of the Niulanjiang River cut by the western branch of the Xiaojiang fault is larger than that of the two sides (Figure 6B), while the river cut by the east branch of Xiaojiang fault has little change, possibly reflecting weak tectonic activity during the Quaternary (Wang et al., 1998). The height difference between the Qujiang and Lujiang rivers cut by the Xiaojiang fault barely changes and the two rivers flow along the Qujiang and Shiping faults, respectively, showing fault control of the river location (Figures 6C, D) (Wen et al., 2011).
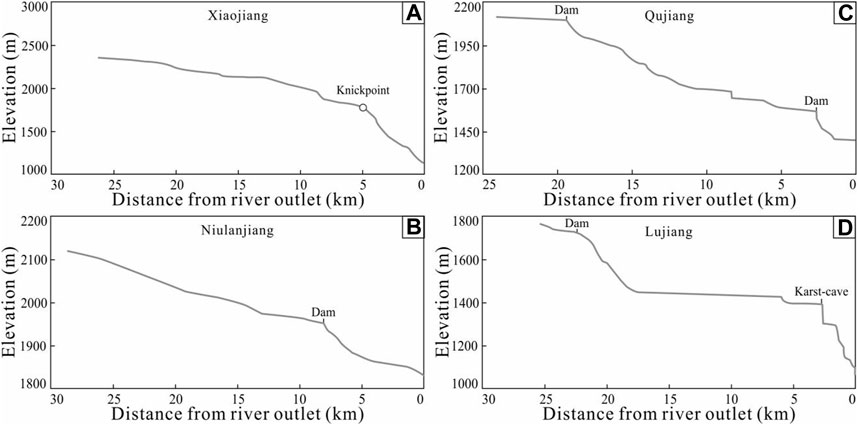
FIGURE 5. Channel longitudinal profile analysis of the Xiaojiang (A), Niulanjiang (B), Qujiang (C), and Lujiang (D) rivers. River locations are shown in Figure 1.
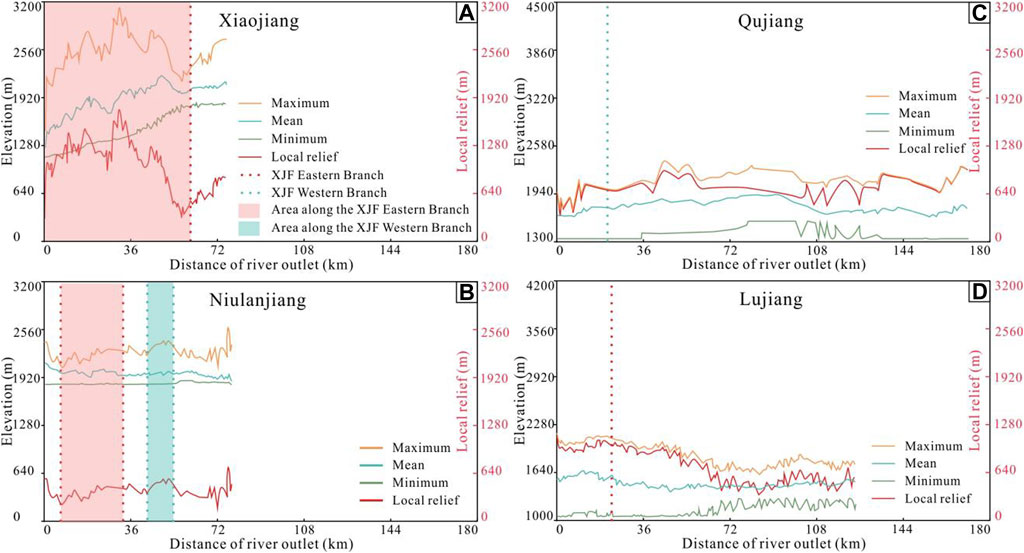
FIGURE 6. Topographic parameters measured over 10-km-wide sections centered on the four main channels of the Xiaojiang (A), Niulanjiang (B), Qujiang (C), and Lujiang (D) rivers. River locations are shown in Figure 1.
Erosion and tectonics are the most important roles in landscape evolution (Champagnac et al., 2012; Wang et al., 2014a; Wang et al., 2017c; Nie et al., 2018; Tao et al., 2020; He et al., 2021). In what follows, we discuss the influences of the two factors respectively.
Erosional processes are affected by lithology, precipitation, and drainage reorganization. We exclude these as significant controlling factors for the following reasons. First, lithologic resistance influences the erosion rate of channel bedrock (Strahler, 1952; Palumbo et al., 2009; Wang et al., 2014b; Pan et al., 2015; Wang et al., 2019). Variation in lithology controls the shape of stream profiles and thus the overall topography of the landscape (Tucker and Slingerland, 1996; Gallen and Wegmann, 2017). Because weak rocks are more easily eroded than strong rocks, lithology may have a measurable effect on the geomorphic indices. To examine the distribution of knickpoints and determine whether lithology may have an impact on geomorphological characteristics, more than half of the channel profiles (41 basins) along-profile lithologies were randomly selected (Supplementary Table S2). Three of the tributaries have no knickpoints, and the remaining 38 tributaries have 45 knickpoints, but only 4 knickpoints appear near lithologic boundaries, with the remaining 41 knickpoints being unrelated to lithologic boundaries. Hence, the strong control of IAT by lithology in the Xiaojiang Region is excluded (Supplementary Table S2).
Second, precipitation has a marked effect on landscape form and geomorphic processes in southeast Asia (Verstappen, 1997; Olen et al., 2016; Nie et al., 2018). Higher precipitation generally leads to increased river flow, which in turn increases the potential for erosion of the channel base and thus for the transformation of landscapes (Kirby et al., 2003; Wang et al., 2017). If variation in the composite geomorphic index IAT is to be attributed to precipitation or tectonic activity, the influence of each factor should be considered separately. More than half of the basins were randomly selected to quantify the relationship between precipitation and geomorphic indices (the precipitation map is above a DEM, Figure 3). Weak correlations were found between them: AF (R2 = 0.0047: Figure 7A), BS (R2 = 0.0559: Figure 7B), HI (R2 = 0.2342: Figure 7C), SLK (R2 = 0.0079: Figure 7D), VF (R2 = 0.2526: Figure 7E), and IAT (R2 = 0.1589: Figure 7F). In addition, spatial variation in mean annual precipitation within the Xiaojiang Region was calculated. Precipitation is shown to be stronger from Xundian to Yiliang and south of Kaiyuan but weaker to the north of Xundian and from Yiliang to Kaiyuan. However, variation in the geomorphic indices differs from this distribution, implying that mean annual precipitation is not the main control on the landscape evolution of the Xiaojiang Region.
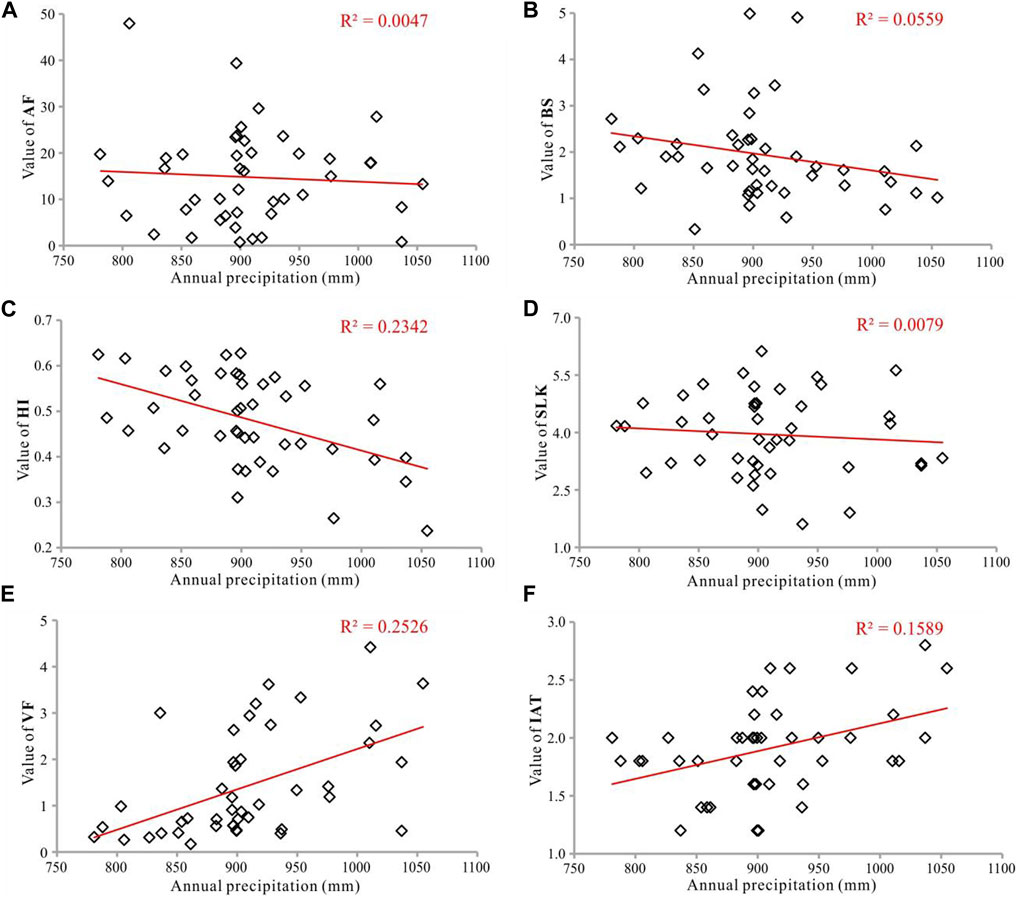
FIGURE 7. Comparison of geomorphic indices with annual precipitation in the Xiaojiang region. (A) AF. (B) BS. (C) HI. (D) SLK. (E) VF. (F) Relative active tectonics (IAT).
Third, some of the larger rivers downstream of the Xiaojiang Region have been reorganized in the Cenozoic, like the paleo-Yangtze River and the Red River (Wang H. et al., 2017; Deng et al., 2020; Yang et al., 2020; Zhao et al., 2021), but this has had little influence on the Xiaojiang Region. Although river recombination may occur randomly throughout the drainage basins, the study area is dominated by sandstone, and there are few areas with large lithology changes, so it will not have a systemic influence on the Xiaojiang Region.
The measured AF values in this study are high in the analyzed drainage basins throughout the entire Xiaojiang Region, demonstrating pervasive tectonic tilting through the region, probably as a result of regional-scale fault movements (Figure 4A; Supplementary Table S1). High values of SLK are clustered to the north of Xundian and south of Yiliang (Figure 4D; Supplementary Table S1). The indices of HI, VF, and IAT show values in classes 1 or 2 to the north of Xundian and in classes 3 (or 4 for IAT) from Xundian to Yiliang, and in classes 2 or 3 near and to the south of Tonghai (Figures 4C, E, F; Supplementary Table S1). The longitudinal profiles of the four studied large rivers show that tectonic activity is higher in the north than in the south of the Xiaojiang Region (Figures 5, 6).
The N-S-trending Xiaojiang fault extending through the Xiaojiang Region is a slip boundary for the southeastward translation of the Sichuan-Yunnan Block of the Tibetan Plateau (Tapponnier et al., 1982; Wang et al., 1998; Tapponnier, 2001; Jun et al., 2003; Li et al., 2019; Wang D. et al., 2022). From north to south, this fault changes from strike-slip to extensional and has produced a series of Quaternary basins (Tapponnier et al., 1982; Wang et al., 1998; Tapponnier, 2001). The Xiaojiang fault shows a horizontal reduction in the amount of fault displacement, of ∼60 km has been estimated for the northern part and vanishes in the south (Wang et al., 1998). The Xiaojiang fault consists of two N-S-trending main strands: the western and eastern strands (Li et al., 2019). The western strand terminates near the Qujiang fault, and the eastern strand ceases near the Red River fault (Wang et al., 1998). The Xiaojiang fault was initiated from at least the Late Pliocene, and movement along the Xiaojiang fault zone has accelerated since the beginning of the Middle Pleistocene (Wang et al., 1998; Jun et al., 2003). The average slip rate of the Xiaojiang fault is higher in the north (∼10 mm/yr) than in the south (∼3.5 mm/yr) (King et al., 1997; Deng et al., 2003; Xu and Wen, 2003; Wen et al., 2011; Li et al., 2019). These slip rates are consistent with GPS data (Zhang, 2004; Liang et al., 2013). The spatial variations in geomorphic indices of the Xiaojiang Region measured here show that the tectonic activity is strong in the northern part and weak in the central part, which may be related to the strike-slip rate being fast in the north and slow in the south. However, the geomorphic indices show higher variation for basins near and to the south of Tonghai, near the Qujiang and Shiping faults. These basins could be strongly influenced by movement on these two faults, each of which shows a slip rate of 4.5 mm/yr (Figures 5, 6) (Wen et al., 2011).
Therefore, the hypotheses that predict the entire Xiaojiang Region experienced uniform southeastward tilting from north to south, and the deformation changing from localized shortening and thickening along major pre-existing fault zones to lower crustal expansion out of the fault zones do not fit the observed geomorphology. Erosionally driven denudation model explains the higher tectonic activity in the central part of the Xiaojiang Region, but do not fit the observation that the greatest tectonic activity is found in the northern part of the Xiaojiang Region. We hypothesize that spatial variation in geomorphic indices reflects that the landscape in the Xiaojiang Region may be primarily influenced by three major faults: the Xiaojiang fault, the Shiping fault, and the Qujiang fault, rather than influenced by precipitation, lithology, and drainage reorganization. The geomorphological evolution of the southeastern Tibetan Plateau appears to be guided by the strike-slip faults, which appears more in agreement with ‘the oblique shortening and extrusion model’.
This study examined spatial variation in geomorphic indices of drainage basins, as well as river longitudinal profiles, for the Xiaojiang Region of eastern Yunnan, SE Tibetan Plateau, to determine the main controls on landscape form and evolution. The variation in geomorphic indices corresponds far more closely to variation in tectonic activity than to variation in erosion within the region. It is concluded that tectonics have played a more important role than erosion in the landscape evolution of the Xiaojiang Region. The geomorphological evolution of the southeastern Tibetan Plateau appears to be guided by the strike-slip faults, which appears more in agreement with ‘the oblique shortening and extrusion model’.
The original contributions presented in the study are included in the article/Supplementary Material, further inquiries can be directed to the corresponding authors.
Conceptualization was performed by DY and LY. The methodology was developed by WD. Formal analysis and investigation were carried out by WD and DJ. The writing and preparation of the original draft were conducted by WD, DY, and LY. All authors contributed to the article and approved the submitted version.
This study was supported by the ore-forming regularity and ore reserve increase of Sn-W mineralization of multiple types and stages in the Gejiu-Malipo ore-concentration area, SE Yunnan, SW China (grant No. 202202AG050006), a major scientific and technological project in Yunnan.
Earlier versions of this manuscript benefited from reviews by Yizhou Wang and Chuanqi He. Reviews by Yuntao Tian and Lei Wu greatly improved the manuscript.
DJ was employed by China Southwest Geotechnical Investigation and Design Institute Co., Ltd.
The remaining authors declare that the research was conducted in the absence of any commercial or financial relationships that could be construed as a potential conflict of interest.
All claims expressed in this article are solely those of the authors and do not necessarily represent those of their affiliated organizations, or those of the publisher, the editors and the reviewers. Any product that may be evaluated in this article, or claim that may be made by its manufacturer, is not guaranteed or endorsed by the publisher.
The Supplementary Material for this article can be found online at: https://www.frontiersin.org/articles/10.3389/feart.2023.1129217/full#supplementary-material
Adams, B. A., Whipple, K. X., Forte, A. M., Heimsath, A. M., and Hodges, K. V. (2020). Climate controls on erosion in tectonically active landscapes. Sci. Adv. 6, eaaz3166. doi:10.1126/sciadv.aaz3166
Azor, A., Keller, E. A., and Yeats, R. S. (2002). Geomorphic indicators of active fold growth: south mountain–oak ridge anticline, ventura basin, southern california. GSA Bulletin 114 (6), 745–753. doi:10.1130/0016-7606(2002)114<0745:GIOAFG>2.0.CO;2
Bagha, N., Arian, M., Ghorashi, M., Pourkermani, M., El Hamdouni, R., and Solgi, A. (2014). Evaluation of relative tectonic activity in the Tehran basin, central Alborz, northern Iran. Geomorphology 213 (15), 66–87. doi:10.1016/j.geomorph.2013.12.041
Bull, B. W., and McFadden, L. D. (1977). “Tectonic geomorphology north and south of the garlock fault, California,” in Geomorphology in arid regions: Binghamton geomorphology symposium 8 (Oxfordshire: Routledge), 115–138. Synthetic Metals.
Champagnac, J., Molnar, P., Sue, C., Herman, F., et al. (2012). Tectonics, climate, and mountain topography. J. Geophys. Res. Atmos. 117, B02403. doi:10.1029/2011JB008348
Cheng, W., Wang, N., Zhao, M., and Zhao, S. (2016). Relative tectonics and debris flow hazards in the Beijing mountain area from DEM-derived geomorphic indices and drainage analysis. Geomorphol. Amst. Neth. 257, 134–142. doi:10.1016/j.geomorph.2016.01.003
Cheng, Y., He, C., Rao, G., Yan, B., Lin, A., Hu, J., et al. (2018). Geomorphological and structural characterization of the southern WeiheGraben, central China: Implications for fault segmentation. Tectonophysics 722, 11–24. doi:10.1016/j.tecto.2017.10.024
Clark, M. K., House, M. A., Royden, L. H., Whipple, K. X., Burchfiel, B. C., Zhang, X., et al. (2005). Late cenozoic uplift of southeastern tibet. Geology 33 (6), 525–528. doi:10.1130/g21265.1
Deng, B., Chew, D., Mark, C., Liu, S., Cogné, N., Jiang, L., et al. (2020). Late Cenozoic drainage reorganization of the paleo-Yangtze river constrained by multi-proxy provenance analysis of the Paleo-lake Xigeda. GSA Bull. 133 (1-2), 199–211. doi:10.1130/b35579.1
Deng, Q., Zhang, P., Ran, Y., Yang, X., Min, W., and Chu, Q. (2003). Basic characteristics of active tectonics of China. Sci. China (Series D ) 46 (4), 356–372. doi:10.1360/03yd9032
El Hamdouni, R., Irigaray, C., Fernández, T., Chacón, J., and Keller, E. A. (2008). Assessment of relative active tectonics, southwest border of the Sierra Nevada (southern Spain). Geomorphology 96 (1-2), 150–173. doi:10.1016/j.geomorph.2007.08.004
Faghih, A., Nezamzadeh, I., and Kusky, T. M. (2016). Geomorphometric evidence of an active pop-up structure along the sabzpushan fault zone, Zagros mountains, SW Iran. J. Earth Sci. 27 (6), 945–954. doi:10.1007/s12583-016-0663-y
Figueroa, A. M., and Knott, J. R. (2010). Tectonic geomorphology of the southern Sierra Nevada Mountains (California): Evidence for uplift and basin formation. Geomorphology 123 (1-2), 34–45. doi:10.1016/j.geomorph.2010.06.009
Gallen, S. F., and Wegmann, K. W. (2017). River profile response to normal fault growth and linkage: An example from the hellenic forearc of south-central crete, Greece. Earth Surf. Dyn. 5 (1), 161–186. doi:10.5194/esurf-5-161-2017
Gao, M., Zeilinger, G., Xu, X., Wang, Q., and Hao, M. (2013). DEM and GIS analysis of geomorphic indices for evaluating recent uplift of the northeastern margin of the Tibetan Plateau, China. Geomorphology 190, 61–72. doi:10.1016/j.geomorph.2013.02.008
Hack, J. T. (1973). Stream-profiles analysis and stream-gradient index. J. Res. U.S. Geol. Surv. 1 (4), 421–429.
Haviv, I., Enzel, Y., Whipple, K. X., Zilberman, E., Matmon, A., Stone, J., et al. (2010). Evolution of vertical knickpoints (waterfalls) with resistant caprock: Insights from numerical modeling. J. Geophys. Res. 115, F03028. doi:10.1029/2008jf001187
He, C., Rao, G., Yang, R., Hu, J., Yao, Q., and Yang, C. J. (2019). Divide migration in response to asymmetric uplift: Insights from the Wula Shan horst, North China. Geomorphology 339, 44–57. doi:10.1016/j.geomorph.2019.04.024
He, C., Yang, C., Turowski, J. M., Rao, G., Roda-Boluda, D. C., and Yuan, X. P. (2021). Constraining tectonic uplift and advection from the main drainage divide of a mountain belt. Nat. Commun. 12 (1), 544. doi:10.1038/s41467-020-20748-2
Jun, S., Yipeng, W., and Fangmin, S. (2003). Characteristics of the active Xiaojiang fault zone in yunnan, China: A slip boundary for the southeastward escaping sichuan-yunnan block of the Tibetan plateau. J. Asian Earth Sci. 21 (10), 1085–1096. doi:10.1016/s1367-9120(02)00185-2
Keller, E. A. (1986). Investigation of active tectonics; Use of surficial earth processes. Washington, DC: National Academy Press, 136–147.
King, R. W., Shen, F., Burchfiel, B. C., Royden, L. H., Wang, E., Chen, Z., et al. (1997). Geodetic measurement of crustal motion in southwest China. Geology 25 (2), 179–182. doi:10.1130/0091-7613(1997)025<0179:gmocmi>2.3.co;2
Kirby, E., Whipple, K. X., Tang, W., and Chen, Z. (2003). Distribution of active rock uplift along the eastern margin of the Tibetan Plateau: Inferences from bedrock channel longitudinal profiles. J. Geophys. Res. Solid Earth 108 (B4), 2217. doi:10.1029/2001jb000861
Li, X., Bai, D., Ma, X., Chen, Y., Varentsov, I. M., Xue, G., et al. (2019). Electrical resistivity structure of the Xiaojiang strike-slip fault system (SW China) and its tectonic implications. J. Asian Earth Sci. 176, 57–67. doi:10.1016/j.jseaes.2019.01.031
Liang, S., Gan, W., Shen, C., Xiao, G., Liu, J., Chen, W., et al. (2013). Three-dimensional velocity field of present-day crustal motion of the Tibetan Plateau derived from GPS measurements. Jouenal Geophys. Res. Solid Earth 118, 5722–5732. doi:10.1002/2013jb010503
Nie, J., Ruetenik, G., Gallagher, K., Hoke, G., Garzione, C. N., Wang, W., et al. (2018). Rapid incision of the Mekong River in the middle Miocene linked to monsoonal precipitation. Nat. Geosci. 11 (12), 944–948. doi:10.1038/s41561-018-0244-z
Olen, S. M., Bookhagen, B., and Strecker, M. R. (2016). Role of climate and vegetation density in modulating denudation rates in the Himalaya. Earth Planet. Sci. Lett. 445, 57–67. doi:10.1016/j.epsl.2016.03.047
Palumbo, L., Hetzel, R., Tao, M., and Li, X. (2009). Topographic and lithologic control on catchment-wide denudation rates derived from cosmogenic 10Be in two mountain ranges at the margin of NE Tibet. Geomorphology 117 (1-2), 130–142. doi:10.1016/j.geomorph.2009.11.019
Pan, B., Li, Q., Hu, X., Geng, H., and Gao, H. (2015). Bedrock channels response to differential rock uplift in eastern Qilian Mountain along the northeastern margin of the Tibetan Plateau. J. Asian Earth Sci. 100, 1–19. doi:10.1016/j.jseaes.2014.12.009
Paradisopoulou, P. M., Garlaouni, C. G., Jin, X., Papadimitriou, E. E., Karakostas, V. G., and Yang, J. (2007). Application of the stress evolutionary model along the Xiaojiang fault zone in Yunnan Province, Southeast China. Acta Geophys. 55 (4), 577–593. doi:10.2478/s11600-007-0028-0
Perron, J. T., and Royden, L. (2013). An integral approach to bedrock river profile analysis. Earth Surf. Process. Landforms 38 (6), 570–576. doi:10.1002/esp.3302
Ren, Z. (2013). Geometry and deformation features of the most recent co-seismic surface ruptures along the Xiaojiang Fault and its tectonic implications for the Tibetan Plateau. J. Asian Earth Sci. 77, 21–30. doi:10.1016/j.jseaes.2013.08.016
Róycka, M., and Migoń, P. (2021). Morphometric properties of river basins as indicators of relative tectonic activity - problems of data handling and interpretation. Geomorphology 389, 107807. doi:10.1016/j.geomorph.2021.107807
Royden, L. H., Burchfiel, B. C., and van der Hilst, R. D. (2008). The geological evolution of the Tibetan plateau. Science 321 (5892), 1054–1058. doi:10.1126/science.1155371
Shi, X., Yang, Z., Dong, Y., Qu, H., Zhou, B., and Cheng, B. (2020). Geomorphic indices and longitudinal profile of the Daba Shan, northeastern Sichuan Basin: Evidence for the late Cenozoic eastward growth of the Tibetan Plateau. Geomorphology 353, 107031. doi:10.1016/j.geomorph.2020.107031
Strahler, A. N. (1952). Hypsometric (Area-Altitude) analysis of erosional topography. Bull. Geol. Soc. Am. 63 (11), 1117–1142. doi:10.1130/0016-7606(1952)63[1117:haaoet]2.0.co;2
Tao, Y., Xiong, J., Zhang, H., Chang, H., and Li, L. (2020). Climate-driven formation of fluvial terraces across the Tibetan plateau since 200 ka: A review. Quat. Sci. Rev. 237, 106303. doi:10.1016/j.quascirev.2020.106303
Tapponnier, P., Peltzer, G., Dain, A., Armijo, R., and Cobbold, P. (1982). Propagating extrusion tectonics in Asia: New insights from simple experiments with plasticine. Geology 10 (12), 611. doi:10.1130/0091-7613(1982)10<611:petian>2.0.co;2
Tapponnier, P., Zhiqin, X., Roger, F., Meyer, B., Arnaud, N., Wittlinger, G., et al. (2001). Oblique stepwise rise and growth of the tibet plateau. Science 294 (5547), 1671–1677. doi:10.1126/science.105978
Tian, Y., Kohn, B. P., Gleadow, A. J. W., and Hu, S. (2014). A thermochronological perspective on the morphotectonic evolution of the southeastern Tibetan plateau. J. Geophys. Res. Solid Earth 119 (1), 676–698. doi:10.1002/2013jb010429
Tsimi, C., and Ganas, A. (2015). Using the ASTER global DEM to derive empirical relationships among triangular facet slope, facet height and slip rates along active normal faults. Geomorphology 234, 171–181. doi:10.1016/j.geomorph.2015.01.018
Tucker, G. E., and Slingerland, R. (1996). Predicting sediment flux from fold and thrust belts. Basin Res. 8 (3), 329–349. doi:10.1046/j.1365-2117.1996.00238.x
Verstappen, H. T. (1997). The effect of climatic change on southeast Asian geomorphology. J. Quat. Sci. Rev. 12, 413–418. doi:10.1002/(sici)1099-1417(199709/10)12:5<413::aid-jqs324>3.0.co;2-p
Wang, D., Dong, Y., Jiao, Q., Zhang, D., Duan, J., and Yu, H. (2022b). The mechanism of tectonic deformation of the central yunnan terrane in the late cenozoic based on tectonic geomorphology. Earth Sci. 47 (8), 3016–3028. doi:10.3799/dqkx.2021.146
Wang, D., Dong, Y., Xie, Z., Zhang, D., Duan, J., Yu, H., et al. (2021). Evaluation of the relative tectonic activity from the faults in the gengma-lancang-menghai seismic belt (southwestern China). J. Earth Sci. 10.1007/s12583-Dan Wang JES-02-2021-0067.
Wang, E., Burchfiel, B. C., Royden, L. H., Liangzhong, C., Jishen, C., Wenxin, L., et al. (1998). Late cenozoic Xianshuihe- Xiaojiang Red River, and dali fault systems of south-western sichuan and central yunnan, China. Boulder, Colorado: Special Paper of the Geological Society of America, 1–108.
Wang, G., and Wang, E. (2005). Extensional structures whthin the compressional orogenic belt and its mechanism: A case study for the late cenozoic deformation in central yunnan. Seismol. Geol. 27 (2), 188–199.
Wang, H., Li, K., Tian, Y., and Zhang, G. (2022a). Oligocene-early miocene exhumation and shortening along the anninghe fault in the southeastern Tibetan plateau: Insights from zircon and apatite (u-th)/he thermochronology. Int. Geol. Rev. 64 (3), 390–404. doi:10.1080/00206814.2020.1858354
Wang, H., Tian, Y., and Liang, M. (2017a). Late cenozoic exhumation history of the luoji Shan in the southeastern Tibetan plateau; Insights from apatite fission-track thermochronology. J. Geol. Soc. 174 (5), 883–891. doi:10.1144/jgs2017-005
Wang, Y., Schoenbohm, L. M., Zhang, B., Granger, D. E., Zhou, R., Zhang, J., et al. (2017b). Late Cenozoic landscape evolution along the Ailao Shan Shear Zone, SE Tibetan Plateau: Evidence from fluvial longitudinal profiles and cosmogenic erosion rates. Earth Planet. Sci. Lett. 472, 323–333. doi:10.1016/j.epsl.2017.05.030
Wang, Y., Zhang, B., Hou, J., and Xu, X. (2014a). Structure and tectonic geomorphology of the Qujiang fault at the intersection of the Ailao Shan-Red River fault and the Xianshuihe-Xiaojiang fault system, China. Tectonophysics 634, 156–170. doi:10.1016/j.tecto.2014.07.031
Wang, Y., Zhang, H., Zheng, D., Wenjun, Z., Zhuqi, Z., Weitao, W., et al. (2014b). Controls on decadal erosion rates in qilian Shan: Re-Evaluation and new insights into landscape evolution in north-east tibet. Geomorphology 223, 117–128. doi:10.1016/j.geomorph.2014.07.002
Wang, Y., Zhang, H., Zheng, D., Yu, J., Pang, J., and Ma, Y. (2017c). Coupling slope-area analysis, integral approach and statistic tests to steady-state bedrock river profile analysis. Earth Surf. Dyn. 5 (1), 145–160. doi:10.5194/esurf-5-145-2017
Wang, Y., Zheng, D., Zhang, H., Xiao, L., Li, Y., and Hao, Y. (2019). The distribution of active rock uplift in the interior of the Western Qilian Shan, NE Tibetan Plateau: inference from bedrock channel profiles. Tectonophysics 759, 15–29. doi:10.1016/j.tecto.2019.04.001
Wen, X., Du, L., Long, F., Fan, J., and Zhu, H. (2011). Tectonic dynamics and correlation of major earthquake sequences of the Xiaojiang and Qujiang-Shiping fault systems, Yunnan, China. Sci. China Earth Sci. 41 (5), 1563–1575. doi:10.1007/s11430-011-4231-0
Wu, K., Dong, Y., Duan, J., Ru, X., Zhang, D., and Wang, D. (2020). Cenozoic uplift of the central yunnan fragment, southwestern China, revealed by apatite (U-Th)/He dating. J. Earth Sci. 31 (4), 735–742. doi:10.1007/s12583-020-1328-4
Xu, X., Wen, X., Zheng, R., Ma, W., Song, F., and Yu, G. (2003). Pattern of latest tectonic motion and its dynamics for active blocks in Sichuan-Yunnan region, China. Sci. China Ser. D Earth Sci. 46 (2), 210–226. doi:10.1360/03dz0017
Yang, R., Suhail, H. A., Gourbet, L., Willett, S. D., Fellin, M. G., Lin, X., et al. (2020). Early Pleistocene drainage pattern changes in Eastern Tibet: Constraints from provenance analysis, thermochronometry, and numerical modeling. Earth Planet. Sci. Lett. 531, 115955. doi:10.1016/j.epsl.2019.115955
Yu, L., Dong, Y., Zhou, W., Zhang, D., Wang, D., Yu, H., et al. (2022). Evaluation of the rock uplift pattern in the central yunnan subblock, SE Tibetan plateau: Based on the bedrock channel profile. Front. Earth Sci. 10, 821367. doi:10.3389/feart.2022.821367
Yuan, X. P., Jiao, R., Dupont-Nivet, G., and Shen, X. (2022). Southeastern Tibetan Plateau growth revealed by inverse analysis of landscape evolution model. Geophys. Res. Lett. 49 (10), e2021Gl097623. doi:10.1029/2021gl097623
Zhang, G., Tian, Y., Li, R., Shen, X., Zhang, Z., Sun, X., et al. (2022). Progressive tectonic evolution from crustal shortening to mid-lower crustal expansion in the southeast Tibetan plateau: A synthesis of structural and thermochronological insights. Earth-science Rev. 226, 103951. doi:10.1016/j.earscirev.2022.103951
Zhang, P., Shen, Z., Wang, M., Gan, W., Bürgmann, R., Molnar, P., et al. (2004). Continuous deformation of the Tibetan Plateau from global positioning system data. Geology 9 (32), 809–812. doi:10.1130/g20554.1
Zhao, X., Zhang, H., Tao, Y., Wang, Y., Pang, J., Ma, Y., et al. (2021). Pliocene to early Pleistocene drainage reorganization in eastern tibet inferred from detrital zircons. Geophys. Res. Lett. 48, e2021GL094563. doi:10.1029/2021gl094563
Keywords: landscape evolution, Xiaojiang region, geomorphic indices, river longitudinal profiles, tectonics, erosion
Citation: Wang D, Dong Y, Liu Y and Duan J (2023) Spatial variation in landscape evolution of the Xiaojiang Region, SE Tibetan Plateau. Front. Earth Sci. 11:1129217. doi: 10.3389/feart.2023.1129217
Received: 21 December 2022; Accepted: 21 June 2023;
Published: 03 July 2023.
Edited by:
Yuntao Tian, Sun Yat-sen University, ChinaReviewed by:
Yizhou Wang, China Earthquake Administration, ChinaCopyright © 2023 Wang, Dong, Liu and Duan. This is an open-access article distributed under the terms of the Creative Commons Attribution License (CC BY). The use, distribution or reproduction in other forums is permitted, provided the original author(s) and the copyright owner(s) are credited and that the original publication in this journal is cited, in accordance with accepted academic practice. No use, distribution or reproduction is permitted which does not comply with these terms.
*Correspondence: Youpu Dong, ZG9uZ3lwc2RAMTI2LmNvbQ==; Yi Liu, OTA5MjI4Nzg2QHFxLmNvbQ==
†ORCID: Dan Wang, https://orcid.org/0000-0001-6587-847X; Youpu Dong, https://orcid.org/0000-0002-2829-7585
Disclaimer: All claims expressed in this article are solely those of the authors and do not necessarily represent those of their affiliated organizations, or those of the publisher, the editors and the reviewers. Any product that may be evaluated in this article or claim that may be made by its manufacturer is not guaranteed or endorsed by the publisher.
Research integrity at Frontiers
Learn more about the work of our research integrity team to safeguard the quality of each article we publish.