 Zhishuang Xu
 Jie Liu1
 Xiaoli Li
94% of researchers rate our articles as excellent or good
Learn more about the work of our research integrity team to safeguard the quality of each article we publish.
Find out more
ORIGINAL RESEARCH article
Front. Earth Sci., 11 July 2023
Sec. Geohazards and Georisks
Volume 11 - 2023 | https://doi.org/10.3389/feart.2023.1128827
The rapid assessment of an intensity map following a strong earthquake forms the foundation for risk assessment and emergency response in Chinese mainland. The determination of the major axis direction in the assessed intensity map depends on various factors, including nearby active faults, instrumental intensities, and the distribution of aftershocks. To evaluate the effectiveness of promptly determining the major axis direction based on early aftershock distribution, we relocated and analyzed aftershock sequences occurring within 2 h of eighteen aftershock-rich earthquakes with a magnitude of Ms ≥ 6.0 in Chinese mainland from 2012 to 2021. HypoDD was used for relocation, and the standard deviational ellipse fitting technique was employed for analysis. Comparing the aftershock ellipses resulting from our analysis with the macroseismic intensity maps obtained from field surveys reveals a high level of agreement, with an average difference of approximately 9° in the major axis directions of the aftershock ellipses and the meizoseismal zones. For the majority of earthquakes, regardless of focal mechanisms, the lengths of the major axes of the aftershock ellipses closely correspond to the intensity VIII scale. Additionally, the spatial distribution of aftershocks aids in distinguishing the seismogenic fault from the two fault planes with distinctly different dips as indicated by the focal mechanism solution. Moreover, the distance between the aftershock center and the macroseismic epicenter systematically increases as the dip decreases. These findings hold significant scientific value as they contribute to the prompt determination of assessed intensity maps and provide effective guidance for earthquake emergency response.
China is among the countries with a high level of seismic activity worldwide, particularly in the North-South seismic belt and the Tianshan seismic belt, which are recognized regions with above-average seismicity. It is common for these areas to experience one or two large earthquakes per year, often accompanied by numerous aftershocks near the hypocenters of these main earthquakes. Between 2012 and 2021, over 20 earthquakes with surface wave magnitudes (Ms) exceeding 6.0 and highest macroseismic intensities equal to or greater than VIII were recorded in Chinese mainland. Out of these, 18 were found to have significant aftershock activity. Among the 18 earthquakes, nine exhibited dip-slip or thrust mechanisms with some strike-slip components, while the others were either strike-slip or predominantly strike-slip with some thrust components.
The assessment of seismic intensity is typically performed within minutes of the mainshock using either seismic intensity attenuation equations or ground-motion prediction equations (Wang et al., 2000; Bakun and Scotti, 2006; Allen et al., 2012; Sun et al., 2014; Cilia et al., 2017; Kiani et al., 2019; Ferrario et al., 2020). The major axis direction of the assessed intensity map is determined by considering various factors, including nearby active faults, Shake-Maps, aftershock sequences, instrumental intensities, focal mechanisms, and rupture processes (Chen et al., 2018; Xu et al., 2020; Xu et al., 2022). The results of this rapid assessment, especially the identification of high-intensity areas (around VIII or higher), play a crucial role in guiding earthquake emergency responses. Subsequently, a field survey of macroseismic effects is conducted on the same day as the mainshock, based on the assessed intensity map. The actual intensity map, which incorporates the cumulative effects of the earthquake sequence, is officially determined and published by the Ministry of Emergency Management of the People’s Republic of China (Yuan, 2008).
The major axis direction and location of the macroseismic epicenter in the assessed intensity map have significant implications for loss assessments. Both the assessed and actual intensity maps generally exhibit elongated intensity contours parallel to the rupture plane, with the exception of nearly circular contours for intensity VI. Discrepancies exist in the major axis directions of the assessed and actual intensity maps, as well as in the locations of macroseismically and instrumentally derived epicenters in some cases. The assessed intensity maps not only assist decision-makers in organizing emergency rescue efforts and formulating recovery strategies but also serve as valuable resources for further seismic studies, including the exploration of empirical relationships between macroseismic intensities and epicentral distances (Sun et al., 2014; Vannucci et al., 2021). Therefore, improving the assessment of intensity direction is a challenging issue that requires attention and resolution.
The aftershock sequences following large shallow earthquakes, lasting several months and extending over dozens to hundreds of kilometers, can help determine the seismogenic fault and the major axis direction of the intensity map (Kisslinger and Jones, 1991; Cai et al., 2023). Studies have also found correlations between ground motions of the main shock and aftershocks, with overall motions influencing building destruction and macroseismic intensity distribution (Zhang et al., 2019; Li et al., 2022; Tesfamariam and Goda, 2022). Precise relocations of large earthquake sequences have been used to estimate fault geometry, rupture dimensions, and possible intensity distribution (e.g., Astiz et al., 2000; Henry and Das, 2001; Neo et al., 2020; Xu et al., 2020). In dip-slip earthquakes, aftershocks, highest shaking, and high intensities primarily occur in the hanging wall of the seismic fault, known as the hanging wall effect (Lekkas, 2010; Wang et al., 2010; Galli et al., 2017; Xu et al., 2020). Similarly, in strike-slip earthquakes, aftershocks are not symmetrically distributed along the fault but concentrate on one side (Astiz et al., 2000). Various methods have been proposed to study aftershock distribution, including linear distribution, two-dimensional Gaussian distribution, and directional distribution (Kagan, 2002; Matumoto and Latham, 1973; Xu et al., 2020). The trends in aftershock activity align closely with fault lines, and projecting aftershocks onto a vertical plane perpendicular to these trends aids in defining fault dips and lengths (Matumoto and Latham, 1973; Xu et al., 2020). Statistical analyses have indicated that the size of aftershock distribution primarily depends on the magnitude of the mainshock, rather than the focal mechanism (Kagan, 2002; Jiang et al., 2007), although fault width imposes certain limitations on dip-slip earthquakes (Henry and Das, 2001).
The main objective of this article is to investigate the relationships between macroseismic intensity maps and relocated aftershock sequences of large earthquakes in Chinese mainland over the past decade, particularly focusing on major axis directions and macroseismic epicenters. Furthermore, the study aims to discuss the implications of spatial aftershock distribution for intensity assessment. The findings of this research provide a method for promptly assessing the major axis direction and macroseismic epicenter of intensity maps, effectively guiding emergency rescue operations following large earthquakes.
In the past 10 years, Chinese mainland has experienced more than 20 earthquakes with a magnitude MS ≥ 6.0. Among these, 18 cases exhibited a high occurrence of aftershocks, with over 40 aftershocks recorded within 2 h after the mainshock. This study focuses on analyzing the aftershock sequences of these 18 earthquakes, as shown in Table 1; Figure 1. The focal mechanisms were obtained from the Global Centroid Moment Tensor Project (GCMT) (Dziewonski et al., 1981; Ekström et al., 2012), except for the MS 6.0 Changning, Sichuan earthquake on 17 June 2019, which was taken from Xu et al. (2020). The intensity maps used in the study were obtained from field surveys conducted and released by the China Earthquake Administration, Ministry of Emergency Management of the People’s Republic of China (refer to Supplementary Table S1 for details). The magnitudes of the earthquakes analyzed ranged from MS 6.0 to 7.4 (moment magnitude MW 5.7–7.4, as provided by the global GCMT).
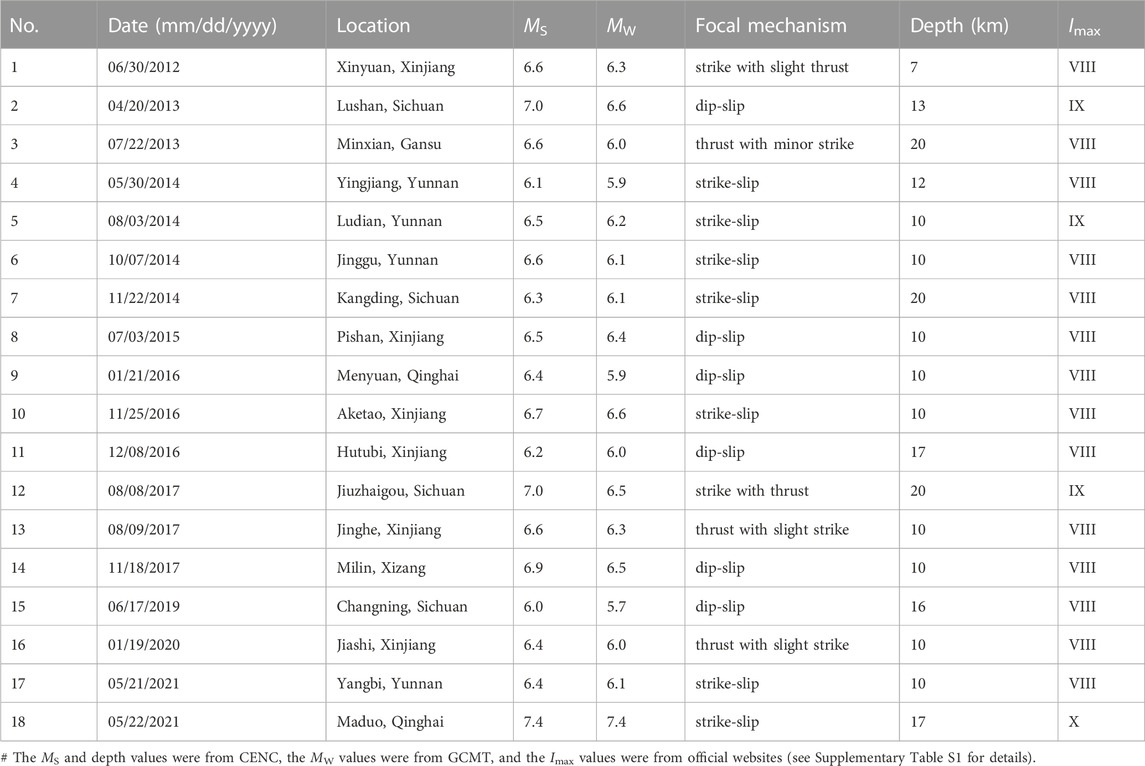
TABLE 1. Parameters of studied earthquakes in Chinese mainland (2012–2021).
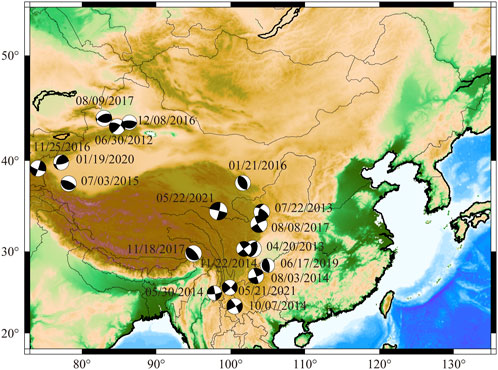
FIGURE 1. Epicenters and focal mechanisms of the 18 studied earthquakes (2012–2021). The epicenter locations were from CENC and the focal mechanism solutions were from GCMT.
Xu et al. (2020) previously investigated the aftershock distributions for various time intervals following the mainshock (0.5 h, 1 h, 2 h, and 3 h, up to 24 h). The results of the 2-h aftershock distributions were found to be consistent with the majority of the earthquakes studied here. Considering the necessity of rapid seismic assessment and emergency guidance, the 2-h aftershock distribution was selected as the preferred measure for the highly affected area in this study. The number of aftershocks recorded by the China Earthquake Networks Center (CENC), China Earthquake Administration, ranged from approximately 40–200 during the 2-h interval. In the case of earthquakes with significant foreshocks, such as the MS 6.4 Yangbi, Yunnan earthquake on 21 May 2021, and the MS 6.4 Jiashi, Xinjiang earthquake on 19 January 2020, the foreshocks were also included in the analysis.
To accurately determine the locations of the aftershocks, the HypoDD method (Waldhauser and Ellsworth, 2000) was used to relocate the aftershocks based on the catalog data provided by the CENC. HypoDD accounts for lateral velocity inhomogeneity in the crust, but its effectiveness depends on the velocity structure near the source. Therefore, a subregional P-wave velocity model of the crust and upper mantle for each region near the epicenter was considered during the relocation process. The seismic phase data from stations within a range of 200 km–400 km from the epicenter were used for the calculation, depending on the density of local station coverage.
In the following, the definitions of some key parameters are provided.
1. Aftershock ellipse: This refers to the ellipse obtained by fitting the relocated aftershocks using the standard deviational ellipse fitting method.
2. Aftershock center: It represents the geometric center of the aftershock ellipse.
3. Aftershock direction: This term typically denotes the major axis direction of the aftershock ellipse, measured clockwise from the north. The estimated uncertainty is approximately 3%.
4. Aftershock length: It corresponds to the length of the major axis of the aftershock ellipse. The estimated uncertainty is approximately 3%.
5. Macroseismic epicenter: Generally, this refers to the geometric center of the meizoseismal zone, which is the area characterized by the highest intensity levels.
6. Intensity direction: This term denotes the major axis direction of the meizoseismal zone. The estimated uncertainty is approximately 3%.
7. Intensity length: It represents the straight distance between the two farthest points along the intensity contour (typically VIII). The estimated uncertainty is approximately 5%.
8. Difference in direction (°):This refers to the disparity between the aftershock direction and the intensity direction. Figure 2 illustrates an example measurement from the MS 6.4 Yangbi, Yunnan earthquake that occurred on 21 May 2021. φ1 and φ2 represent the intensity direction and the aftershock direction, respectively, while Δφ indicates the difference in direction. The estimated uncertainty is around 4%.
9. Difference in length (%): it refers to the relative difference between the aftershock length and the intensity length, i.e.,
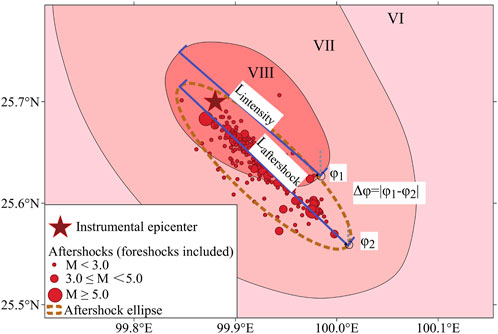
FIGURE 2. The measurement of a sample of the 21 May 2021 MS 6.4 Yangbi, Yunnan, earthquake.
Our previous study (Xu et al., 2022) demonstrated the effectiveness of the standard deviational ellipse, also referred to as the directional distribution method, in obtaining an aftershock ellipse. This ellipse is characterized by its center, major and minor axes, and rotation angle (Mitchell, 2005).
The weighted geographic center was calculated as follows:
In the given equation, xi and yi denote the east-west and north-south coordinate values, respectively, of the ith aftershock. The fitting process involves a total of n aftershocks, with mi representing the magnitude of the ith aftershock, which is considered as the weighted value in the analysis.
The standard deviations of the major and minor axes of the ellipse were calculated as:
where θ was any angle between the x- and the y-axis. (
The rotation angle θm of the ellipse represents a specific value, defined as the angle at which the y-axis of the ellipse rotates clockwise from the north, reaching the extreme value of standard deviation along its axis. Lefever (1926) derived Eqs 3, 4 to calculate the standard deviation with respect to θ.
The solution of the above formula was:
with
and
The values obtained from Eqs 3, 4, 6–8 can be used to draw the standard deviational ellipse, following the given relation.
where s represented for the confidence value, and a value of 95% was selected in present study.
The 18 earthquakes analyzed in this study predominantly occurred in the North-South seismic belt and the Tianshan seismic belt within China. They were primarily concentrated in the Xinjiang Uygur Autonomous Region, Yunnan, Sichuan, and Qinghai provinces (Table 1). Yunnan experienced earthquakes solely caused by strike-slip faults, while Sichuan and Qinghai had an equal distribution of strike-slip and dip-slip faults. Other regions primarily consisted of dip-slip faults. Following the relocation process, the average standard errors in longitude, latitude, and vertical directions were reduced to dozens of or a few hundred meters. The average locating residuals were significantly reduced to no more than 0.8 s.
The contours of the aftershock areas exhibited similar shapes to the intensity maps, and all aftershock sequences showed concentrated distribution directions. Considering foreshocks in the analysis did not significantly affect the results, as the results were highly consistent with the analysis that excluded foreshocks. The aftershock lengths measured in this study were found to have minimal dependence on the earthquake’s focal mechanism (Supplementary Tables S2, S3), aligning with the findings of Kagan (2002) and Jiang et al. (2007). Table 2 presents the differences in directions for strike-slip earthquakes, and Table 3 displays the results for dip-slip earthquakes.
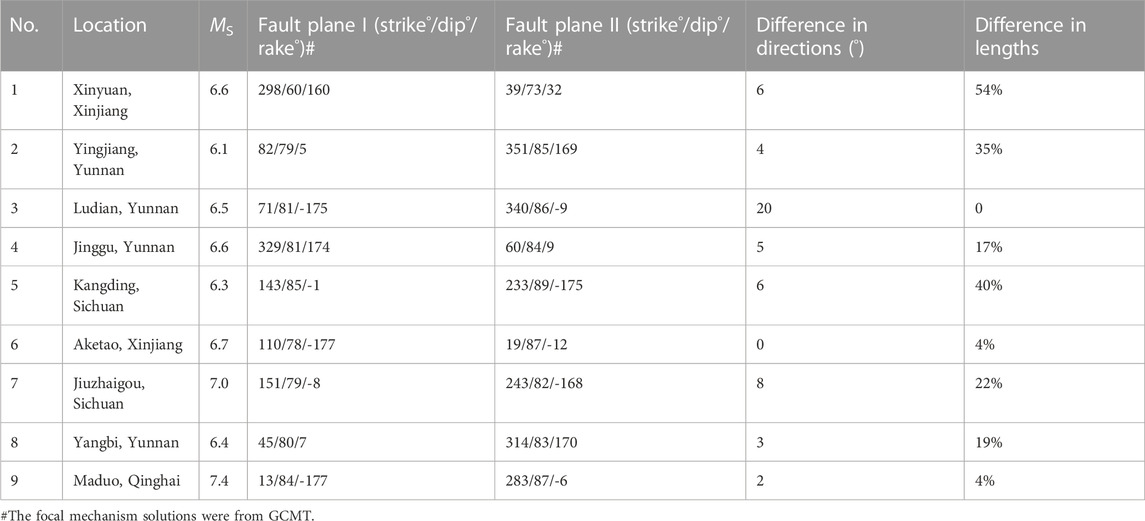
TABLE 2. Parameters of aftershock zones and fault planes of strike-slip earthquakes.
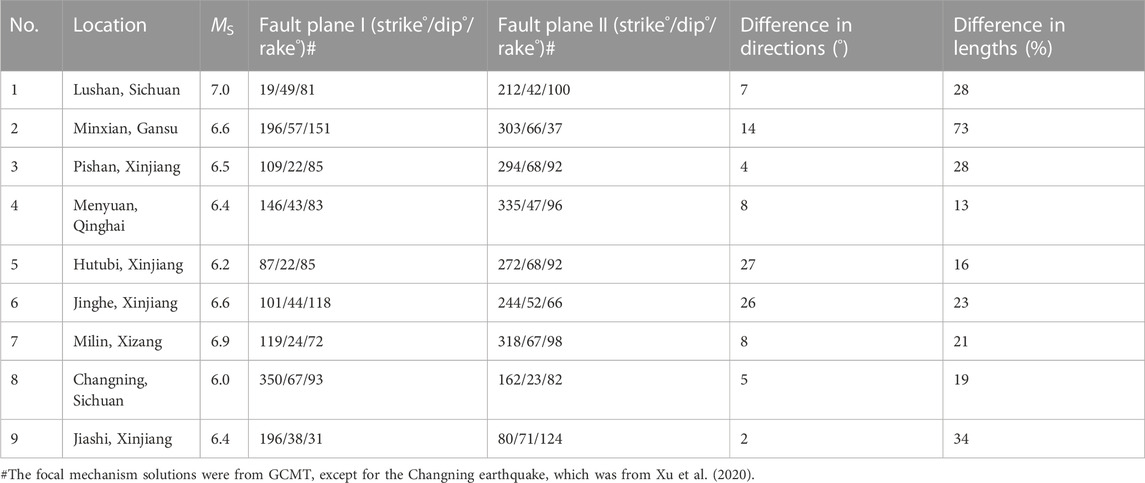
TABLE 3. Parameters of aftershock zones and fault planes of dip-slip earthquakes.
The variations in directions between the aftershock ellipses and the intensity maps ranged from 0° to 27°, with an average difference of approximately 9°. The differences in lengths between the aftershocks and the intensity maps ranged from 0% to 73%, with an average difference of approximately 25%. In most cases, the lengths of the aftershocks were comparable to intensity levels VIII or VII, except for the MS 6.6 Xinyuan, Xinjiang earthquake on 30 June 2012, and the MS 6.6 Minxian, Gansu earthquake on 22 July 2013. The 2-h results for the Xinyuan and Minxian aftershocks aligned with the aftershocks observed over a longer time frame, which were concentrated in small areas. Apart from these two cases, the differences between aftershock lengths and intensity lengths varied from 0% to 40%, with an average difference of approximately 20%. The discrepancy between the macroseismic epicenter and the aftershock center did not show significant improvement when compared to the difference between the instrumental and macroseismic epicenters.
Figures 3A–I presents the results of the aftershock ellipses and macroseismic intensity maps for nine strike-slip earthquakes. It can be observed that most of the aftershock ellipses align with the VIII contours. Some discrepancies in the Figure 3 between aftershock position and isoseismal area could be due to differences in the number of inhabitants, especially for the earthquakes happened in the Xinjiang Uygur Autonomous Region (Figures 3A, F), since the macroseismic intensity maps obtained from field surveys were mainly based on the damage to the houses. The values for direction difference and length difference are provided in Table 2 and illustrated in Figure 4. The differences in directions are predominantly below 10°, with an average of 6°. It is worth noting that a direction difference of 30° is acceptable for quick assessment shortly after an earthquake. Consequently, the aftershock direction proves to be useful in assessing the intensity direction. Furthermore, there seems to be no significant relationship between the direction difference and length difference with the magnitude of the earthquake (Figure 4).
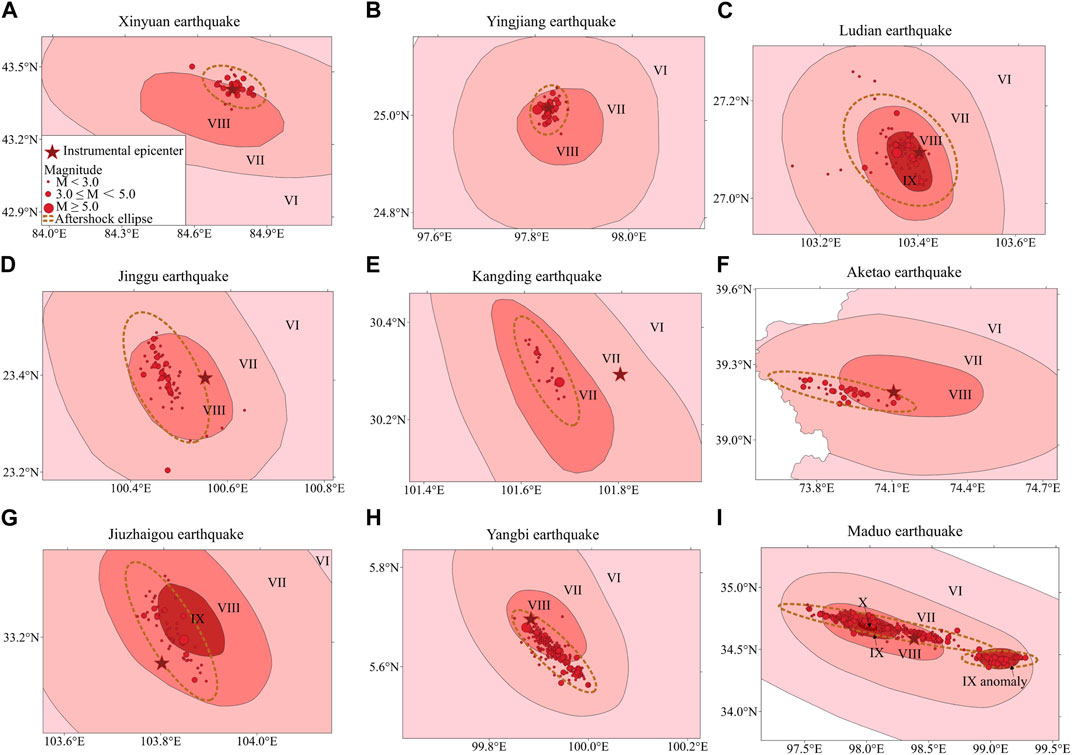
FIGURE 3. The comparison of aftershock ellipses and intensity maps for nine strike-slip earthquakes. (A). The Xinyuan, Xinjiang, earthquake. (B). Yingjiang, Yunnan, earthquake. (C). Ludian, Yunnan, earthquake. (D). Jinggu, Yunnan, earthquake. (E). Kangding, Sichuan, earthquake. (F). Aketao, Xinjiang, earthquake. (G). Jiuzhaigou, Sichuan, earthquake. (H). Yangbi, Yunnan, earthquake. (I). Maduo, Qinghai, earthquake.
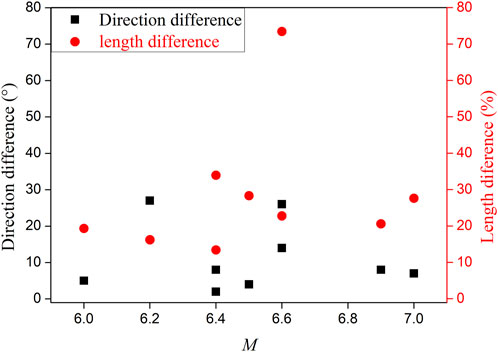
FIGURE 4. The distribution of direction difference and length difference with magnitude for nine strike-slip earthquakes.
For most of the studied earthquakes, the maximum intensity reached VIII, with a few cases reaching IX, and the MS 7.4 Maduo, Qinghai earthquake on 22 May 2021, reaching X. Additionally, there was an anomaly of intensity IX in the southeast region of the meizoseismal zone of the Maduo earthquake (Figure 5). The majority of the relocated locations within the 2-h timeframe were situated within the epicentral zones, which are approximately 60 km wide (Figure 5A). However, there were two distinct clusters in the distribution of the 24-h aftershocks (Figure 5B). This 24-h aftershock distribution precisely corresponds to the intensity map. Although with fewer aftershocks, the direction of the aftershocks within a 2-h period aligns with that observed over 24 h. The aftershock length within 2 h (131.4 km) matches the combined lengths of the VIII and IX anomaly (126.0 km, see Supplementary Table SA2), with a difference of 4%.
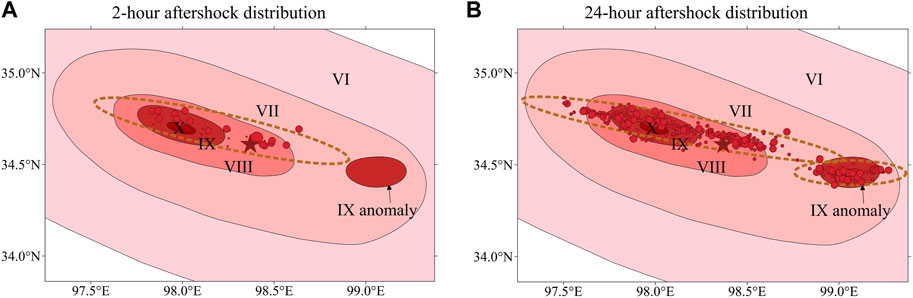
FIGURE 5. The aftershocks within 2 h (A) and 24 h (B) of the 22 May 2021 MS 7.4 Maduo, Qinghai, earthquake.
The maximum difference in direction is 20°, observed in the MS 6.5 Ludian, Yunnan earthquake on 3 August 2014. The relocated aftershock distribution of this earthquake displays a primary direction of NW and a secondary direction of approximately EW (Figures 3C, 6), which is not uncommon for strike-slip earthquakes. When the aftershocks in the secondary direction were excluded from the fitting data, a new aftershock ellipse was obtained (Figure 6). The difference between the new aftershock direction and the VIII direction was reduced to 7°. Based on this, it is suggested to obtain the aftershock ellipse by excluding the aftershocks in the minor direction and considering the aftershock direction as the assessed intensity direction. Additionally, both the original and refitted aftershock lengths of the Ludian earthquake show perfect agreement with the length of intensity VIII.
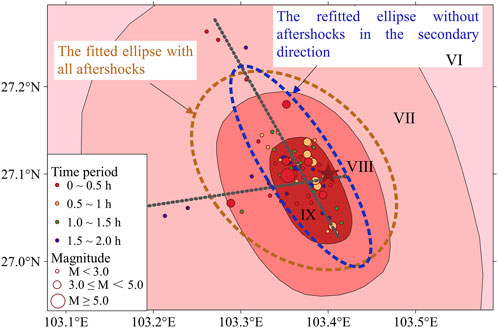
FIGURE 6. The aftershock distribution of the 3 August 2014 MS 6.5 Ludian, Yunnan, earthquake.
Table 2 reveals that the strikes of the two fault planes for strike-slip earthquakes exhibit a difference of nearly 90° or 270°. Xu et al. (2022) highlighted that one of the fault plane strikes from the focal mechanism was notably consistent with the intensity direction in over 83% of earthquakes in Chinese mainland. Therefore, the seismogenic fault can be determined based on the relocated aftershock direction. For example, the fault plane parameters for the Maduo earthquake were 13°/84°/-177° (fault plane I) and 283°/87°/-6° (fault plane II), respectively. The measurement of the aftershock direction resulted in a value of 103°, aligning with 283° in a straight line (Supplementary Table S2). Hence, fault plane II with a strike of 283° was identified as the seismogenic fault.
All the dip-slip earthquakes examined in this study were attributed to thrust faults. Comparing the aftershock ellipses with the intensity maps (Figures 7A–I), it is evident that the aftershock directions align well with the intensity directions, with an average difference of 11°. Similar to the findings for the strike-slip earthquakes, it can be concluded that the aftershock direction is valuable for assessing the intensity direction during rapid assessments.
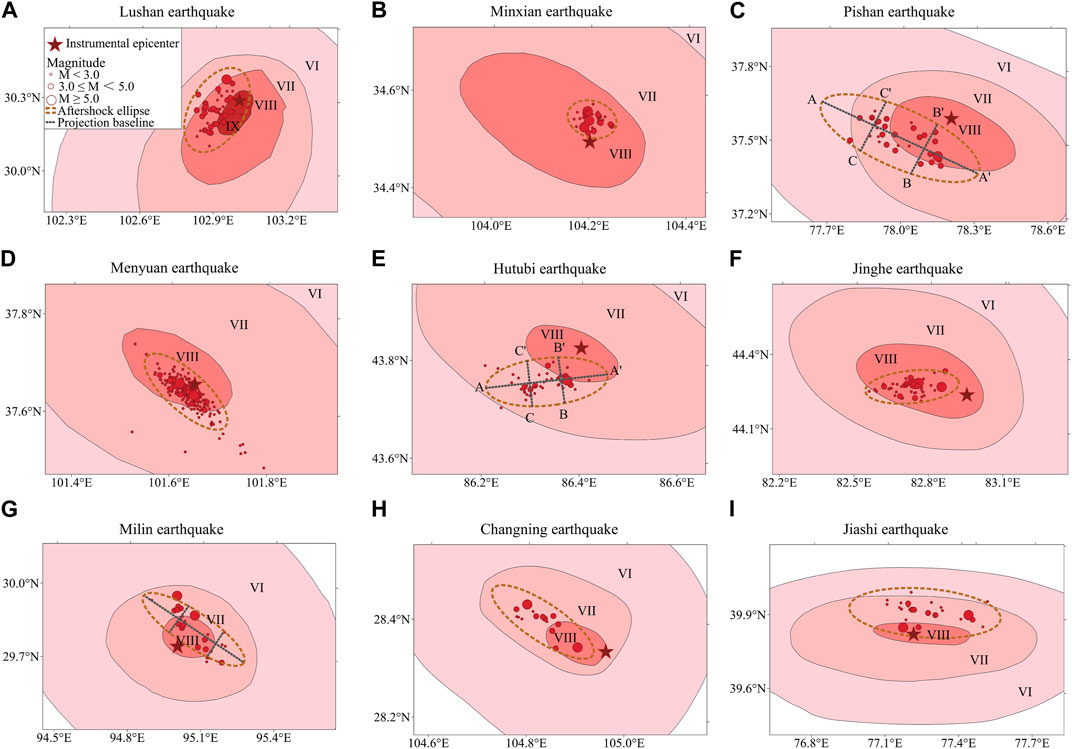
FIGURE 7. The comparison of aftershock ellipses and intensity maps for nine dip-slip earthquakes. For the Pishan and the Hutubi earthquakes, AA’ indicates the aftershock direction, while BB’ and CC’ directions are perpendicular to the aftershock direction. (A). The Lushan, Sichuan, earthquake. (B). Minxian, Gansu, earthquake. (C). Pishan, Xinjiang, earthquake. (D). Menyuan, Qinghai, earthquake. (E). Hutubi, Xinjiang, earthquake. (F). Jinghe, Xinjiang, earthquake. (G). Milin, Xizang, earthquake. (H). Changning, Sichuan, earthquake. (I). Jiashi, Xinjiang, earthquake.
As depicted in Figure 7, the lengths of the aftershocks generally correspond to the intensity lengths, except for the Minxian earthquake (Figure 7B), where the aftershock distribution was highly concentrated in a small area. In most cases, the lengths associated with intensity VIII are recommended for comparison with the aftershock lengths. However, intensity VII is preferred for the Milin earthquake (Figure 7G) and the Changning earthquake (Figure 7H). This discrepancy can be attributed, in part, to the uninhabited VIII zone in the former case, which was only one-seventh the size of the Ⅶ area, while the latter earthquake had a relatively shallow focal depth, resulting in an VIII area of only 84 km2 (Xu et al., 2020). It is understandable that the highly affected intensities in these two earthquakes are 1 unit lower than the others. The majority of the length differences between the aftershocks and the intensities (VII for the Milin and Changning earthquakes, and VIII for the others) are within 30%, except for the Minxian earthquake. Hence, the aftershock length serves as a reference for assessing the intensity length.
The direction differences for the Hutubi earthquake (Figure 7E) and the Jinghe earthquake (Figure 7F) are not as favorable as the others, with direction differences of 27° and 26°, respectively (Table 3). The 24-h aftershocks for these two earthquakes were also analyzed, and the results are illustrated in Figure 8. The 24-h results for the Hutubi earthquake align better with the VIII direction, reducing the difference to 12° (Figure 8A). It is presumed that the earlier aftershocks occurred on a secondary fault, while the later aftershocks occurred on the main fault. Therefore, a dynamic correction of the intensity direction based on aftershocks during different time periods is suggested for earthquakes with complex seismogenic causes, such as the Hutubi earthquake.
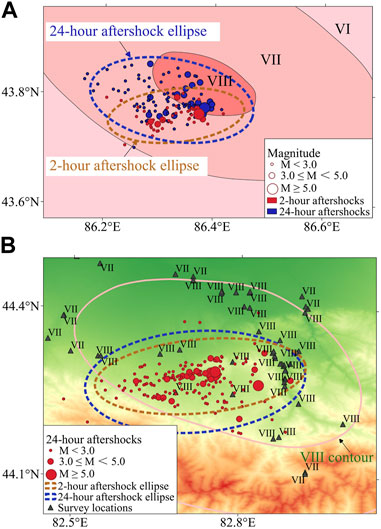
FIGURE 8. (A) The aftershocks within 2 and 24 h of the Hutubi earthquake. (B) The aftershocks within 24 h and the field survey locations and intensity values of the Jinghe earthquake.
Figure 8B illustrates that the 24-h aftershock direction of the Jinghe earthquake generally aligns with the 2-h result, with a difference consistently above 20°. It is apparent that the southern part of the VIII contour had a lack of survey locations due to its high altitude. Therefore, the major axis direction of the VIII contour was inferred based on topography and geological structure during the field survey. However, from a seismological perspective, it is more appropriate to infer the major axis direction based on the aftershock direction. This suggests the importance of considering the aftershock distribution along with other factors during seismic intensity surveys.
There exists a certain disparity between the macroseismic epicenter and the aftershock center, partly attributed to the presence of dip and the rupture mode (unilateral for the Changning earthquake and asymmetric bilateral rupturing for the Lushan earthquake). In the case of dip-slip earthquakes, the aftershocks and high intensities predominantly occur on one side of the seismic faults (Figure 7), and the distance between the aftershock center and the macroseismic epicenter increases as the dip decreases (Figure 9). A power function fitting yields D = 316.2 × r−1.0, where r represents the dip. This indicates that the aftershock center and the macroseismic epicenter become closer as the dip angle increases. However, further study is required to refine the fitting using additional earthquake parameters.
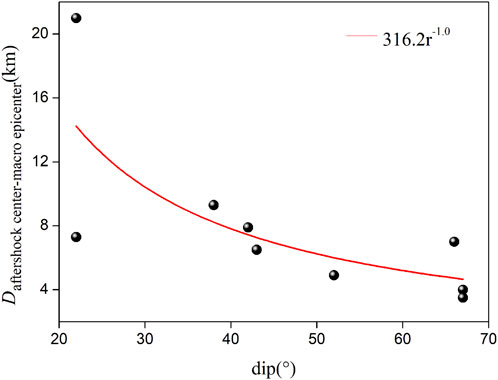
FIGURE 9. The distribution of the distance between the aftershock center and the macroseismic epicenter with dip.
The strikes of the two fault planes for the nine thrust faults exhibit differences ranging from 110° to 200°, as shown in Table 3. In cases where the strike difference is approximately 180°, it is nearly impossible to determine the seismogenic fault based solely on the epicenter distribution of aftershocks. For earthquakes with two distinct dip angles, such as the Hutubi (Figure 7E) and Pishan (Figure 7C) earthquakes, the spatial distributions of aftershocks were taken into consideration, as presented in Figure 10. The projection lines are marked in Figure 7.
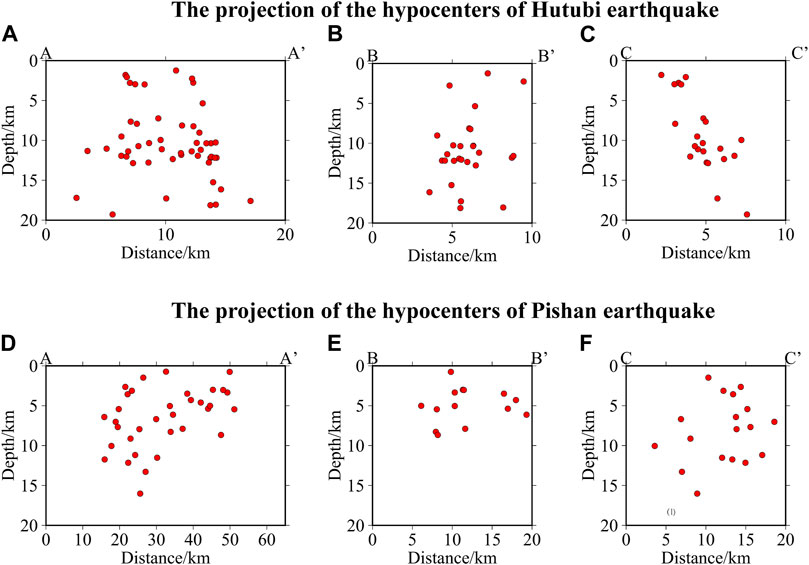
FIGURE 10. The projections of the hypocenters onto vertical planes along and perpendicular to the aftershock directions for the Hutubi earthquake (A–C) and the Pishan earthquake (D–F). The projection width for each case depended on the distribution area of the aftershocks.
Figure 10 demonstrates the vertical plane projections of the hypocenters, revealing a steep slope for the Hutubi earthquake (Figures 10A–C) and a gentle slope for the Pishan earthquake (Figures 10D–F). Consequently, the assumed seismogenic fault parameters for the Hutubi earthquake were 272°/68°/92°, while for the Pishan earthquake, they were 109°/22°/85° (Table 3). According to the definition of the focal mechanism solution, the dip is on the right-hand side along the strike, confirming the presence of hanging wall and footwall for these two earthquakes. Taking the hanging wall effect into consideration, an estimation of the approximate location of the macroseismic epicenter can be made by shifting the aftershock center to the hanging wall. The extent of this shift requires further research to refine the relationship between the difference in location and the dip (Figure 9).
In summary, the intensity direction, VIII length, and the location of the macroseismic epicenter are approximately determined based on the findings discussed above, providing a foundation for rapid intensity assessment. These conclusions reaffirm the importance of considering aftershocks in rapid assessment and emergency response efforts following large earthquakes.
This study focuses on 18 aftershock-rich earthquakes (MS ≥ 6.0) that occurred in Chinese mainland over the past decade. The relocation of aftershock hypocenters was carried out using the hypoDD method, while the standard deviational ellipse was employed to determine the aftershock ellipses. The key conclusions derived from this analysis are as follows.
(1) The aftershock directions and lengths generally align with the intensity maps. The average difference in direction is approximately 9° for all 18 earthquakes, and the average length difference is around 20% for 16 earthquakes, excluding the Xinyuan and Minxian earthquakes, where the aftershocks were concentrated in small areas. Discrepancies between the aftershock positions and the isoseismal areas could be attributed to variations in population density. Consequently, the 2-h aftershock distribution provides valuable information for determining the direction and VIII length of the assessed intensity map.
(2) Aftershock distribution aids in identifying the seismogenic fault. For earthquakes primarily associated with strike-slip faults, the two strikes provided by the focal mechanism solution typically differ by approximately 90° or 270°. The nodal plane with a strike close to the aftershock direction is inferred to be the seismogenic fault plane. In the case of the Ludian earthquake, the aftershocks exhibit one major direction and one minor direction. It is suggested to exclude the aftershocks in the minor direction when constructing the aftershock ellipse, and the resulting aftershock direction can be considered as the assessed intensity direction.
(3) In earthquakes predominantly related to thrust faults where the two strikes provided by the focal mechanism solution differ by approximately 180°, determining the seismogenic fault based solely on the epicenter distribution of aftershocks is insufficient. Therefore, the aftershocks were projected onto vertical planes along and perpendicular to the aftershock direction. For earthquakes exhibiting distinct dip angles, this projection enables the determination of the dip and differentiation between the seismogenic fault and the auxiliary plane. Moreover, the distance between the aftershock center and the macroseismic epicenter increases as the dip decreases. A preliminary fitting suggests a relationship of D = 316.2 × r−1.0, where r represents the dip. Further optimization of this fitting is needed to enhance accuracy. The approximate location of the macroseismic epicenter can be estimated by shifting the aftershock center to the hanging wall using a refined fitting relation.
(4) In some cases, the 2-h aftershocks occurred on a secondary fault, while subsequent long-term aftershocks occurred on the main fault, as observed in the Hutubi earthquake. To improve the assessment of the intensity map, a dynamic correction of the intensity direction based on aftershocks during different periods is suggested. Additionally, uneven distribution of survey locations around the epicenter due to topographical factors, such as in the Jinghe earthquake, calls for inferring the major axis direction of the intensity map based on the aftershock direction from a seismological standpoint.
To summarize, China is prone to seismic activity, and it is highly probable that large earthquakes will impact Chinese mainland in the future. The findings of this study have important implications for the rapid assessment of intensity maps following such events. It is important to highlight the significant advancements made in instrumental intensity determination and earthquake early warning systems in recent years within Chinese mainland. These advancements enable quick assessments of seismic hazards. Therefore, one of the key challenges in the field of macroseismology in Chinese mainland is to establish the relationship between traditional intensity maps and instrumental intensity values. Further research is necessary to comprehensively evaluate the intensity distribution of large earthquakes in a comprehensive manner.
The original contributions presented in the study are included in the article/Supplementary Material, further inquiries can be directed to the corresponding author.
ZX and JL conceptualized the study idea and wrote the original draft. AY prepared Figures 1–6 and XL prepared Figures 7–10. JR and XW prepared Tables 1–3. All authors contributed to the article and approved the submitted version.
This work was supported by the National Key Research and Development Program of China (Grant No. 2018YFC1504006) and the Spark Program of Earthquake Sciences (Grant No. XH20071Y).
The authors declare that the research was conducted in the absence of any commercial or financial relationships that could be construed as a potential conflict of interest.
All claims expressed in this article are solely those of the authors and do not necessarily represent those of their affiliated organizations, or those of the publisher, the editors and the reviewers. Any product that may be evaluated in this article, or claim that may be made by its manufacturer, is not guaranteed or endorsed by the publisher.
The Supplementary Material for this article can be found online at: https://www.frontiersin.org/articles/10.3389/feart.2023.1128827/full#supplementary-material
Allen, T. I., Wald, D. J., and Worden, C. B. (2012). Intensity attenuation for active crustal regions. J. Seismology16 16, 409–433. doi:10.1007/s10950–012–9278–7
Astiz, L., Shearer, P. M., and Agnew, D. C. (2000). Precise relocations and stress change calculations for the Upland earthquake sequence in southern California. J. Geophys. Res. 105, 2937–2953. doi:10.1029/1999jb900336
Bakun, W. H., and Scotti, O. (2006). Regional intensity attenuation models for France and the estimation of magnitude and location of historical earthquakes. Geophys. J. Int. 164, 596–610. doi:10.1111/j.1365-246x.2005.02808.x
Cai, G., Wang, W., Wu, J., Su, J., Lai, G., Wu., P., et al. (2023). Three-dimensional body wave velocity structure and seismogenic structure for the 2022MS6.8 Luding earthquake sequence in Sichuan, China. Front. Earth Sci. 11, 1114. doi:10.3389/feart.2023.1099744
Chen, K., Yu, Y., Gao, M., and Kang, C. (2018). Comparative study on ShakeMaps of PGA for the napa MW6 0 earthquake on 24 aug. 2014 constrained by different conditions, Seismol. Geol 40, 440–449. doi:10.3969/j.issn.0253-4967.2018.02.011
Cilia, M. G., Mooney, W. D., and Robinson, A. (2017). A seismic intensity survey of the 1 april 2014 M 8 2 iquique, Chile, earthquake and tsunami, and a comparison with strong-motion data. Seismol. Res. Lett. 88, 1232–1240. doi:10.1785/0220170030
Dziewonski, A. M., Chou, T.-A., and Woodhouse, J. H. (1981). Determination of earthquake source parameters from waveform data for studies of global and regional seismicity. J. Geophys. Res. 86, 2825–2852. doi:10.1029/JB086iB04p02825
Ekström, G., Nettles, M., and Dziewonski, A. M. (2012). The global CMT project 2004 T010: Centroid-moment tensors for 13017 earthquakes. Phys. Earth. Planet. Inter. 2000y01, 11y. doi:10.1016/j.pepi.2012.04.002
Ferrario, M. F., Livio, F., Capizzano, S. S., and Michetti, A. M. (2020). Developing the first intensity prediction equation based on the environmental scale intensity: A case study from strong normal-faulting earthquakes in the Italian apennines. Seismol. Res. Lett. 91, 2611–2623. doi:10.1785/0220200044
Galli, P., Castenetto, S., and Peronace, E. (2017). The macroseismic intensity distribution of the 30 October 2016 earthquake in central Italy (MW 6.6): Seismotectonic implications. Tect. 36, 2179–2191. doi:10.1002/2017TC004583
Henry, C., and Das, S. (2001). Aftershock zones of large shallow earthquakes: Fault dimensions, aftershock area expansion and scaling relations. Geophys. J. Int. 147, 272–293. doi:10.1046/j.1365-246x.2001.00522.x
Jiang, H. K., Zheng, J. C., Wu., Q., Qu, Y. J., Li, Y. L., and Dai, L. (2007). Statistical features of aftershock distribution size for moderate and large earthquakes in Chinese mainland. Acta Seismol. Sin. 29, 151–164. (in Chinese with English abstract). doi:10.1007/s11589-007-0158-0
Kagan, Y. Y. (2002). Aftershock zone scaling. Bull. Seismol. Soc. Am. 92, 641–655. doi:10.1785/0120010172
Kiani, A., Torabi, M., and Mirhosseini, S. M. (2019). Intensity measures for the seismic response evaluation of buried steel pipelines under near-field pulse-like ground motions. Earthq Eng Eng Vib 18, 917. doi:10.1007/s11803–019–0543–4
Kisslinger, C., and Jones, L. M. (1991). Properties of aftershock sequences in southern California. J. Geophys. Res. 96, 11947–11958. doi:10.1029/91JB01200
Lefever, D. W. (1926). Measuring geographic concentration by means of the standard deviational ellipse. Am. J. Soc. 32, 88–94. doi:10.1086/214027
Lekkas, E. L. (2010). The 12 may 2008 MW 7.9 wenchuan, China, earthquake: Macroseismic intensity assessment using the EMS-98 and ESI 2007 scales and their correlation with the geological structure. Bull. Seismol. Soc. Am. 100, 2791–2804. doi:10.1785/0120090244
Li, Y., and Pu, W. (2022). Analyzing the 2020 M-w 6.4 Puerto Rico earthquake sequence based on the epidemic-type aftershock sequence model. Seismol. Res.Lett. 93, 609–619. doi:10.1785/0220210217
Matumoto, T., and Latham, G. (1973). Aftershocks and intensity of the managua earthquake of 23 december 1972,Science 181, 5455447.doi:10.1785/0220210217
Mitchell, A. (2005). The esri guide to GIS analysis spatial measurement & statistics. California: Esri Press, 49–50.
Neo, J. C., Huang, Y., Yao, D., and Wei, S. (2020). Is the aftershock zone area a good proxy for the mainshock rupture area? Bull. Seismol. Soc. Am. 111, 424–438. Se. doi:10.1785/0120190200
Sun, B., Yan, P., and Chen, X. (2014). New characteristics of intensity assessment of sichuan lushan “4.20” Ms7.0 earthquake. Earthq. Eng.& Eng. Vib. 13, 123–139. doi:10.1007/s11803-014-0243-z
Tesfamariam, S., and Goda, K. (2022). Risk assessment of CLT-RC hybrid building: Consideration of earthquake types and aftershocks for Vancouver, British Columbia. Soil Dyn. Earthq. Eng. 156, 107240–111102. doi:10.1016/j.soildyn.2022.107240
Vannucci, G., Lolli, B., and Gasperini, P. (2021). Inhomogeneity of macroseismic intensities in Italy and consequences for macroseismic magnitude estimation. Seismol. Res.Lett. 92, 2234–2244. doi:10.1785/0220200273
Waldhauser, F., and Ellsworth, W. (2000). A double-difference earthquake location algorithm: Method and application to the Northern Hayward Fault, California. Bull. Seismol. Soc. Am. 90, 1353–1368. doi:10.1785/0120000006
Wang, D., Xie, L. L., and Abrahamson, N. A. (2010). Comparison of strong ground motion from the wenchuan, China, earthquake of 12 may 2008 with the next generation attenuation (NGA) ground-motion models. Bull. Seismol. Soc. Am. 100, 2381–2395. doi:10.1785/0120090009
Wang, S., Yu, Y., Gao, A., and Yan, X. (2000). Development of attenuation relations for ground motion in China. Earth. Res. China 16, 996r06. (in Chinese with English abstract).
Xu, Z. S., Liu, J., Zheng, T. Z., Ren, J., Chen, Y. H., and Li, X. L. (2020). Isoseismal line of Sichuan Changning MS6.0 earthquake in 2019 based on precisely located aftershocks sequence. Acta Seismol. Sin. 42, 4474456. (in Chinese with English abstract). doi:10.11939/jass.20200072
Xu, Z. S., Ren, J., Tan, Z. T., Gao, X. Y., Chen, Y. H., Yang, Z. G., et al. (2022). Determination of the long-axis direction of the seismic influence field using the strike of the focal mechanism solution. J. Seismo. Res. 45, 88–99. doi:10.20015/j.cnki.ISSN1000–0666
Yuan, Y. (2008). Impact of intensity and loss assessment following the great wenchuan earthquake. Earthq. Eng. Eng. Vib. 7, 247–254. doi:10.1007/s11803-008-0893-9
Keywords: assessed intensity map, aftershock sequences, major axis direction, macroseismic epicenter, earthquake emergency response
Citation: Xu Z, Liu J, Yalikun A, Li X, Ren J and Wen X (2023) Determination of the major axis direction and macroseismic epicenter of the assessed intensity map based on relocated aftershock sequences. Front. Earth Sci. 11:1128827. doi: 10.3389/feart.2023.1128827
Received: 21 December 2022; Accepted: 28 June 2023;
Published: 11 July 2023.
Edited by:
Hans-Balder Havenith, University of Liège, BelgiumReviewed by:
Mircea Radulian, National Institute for Earth Physics, RomaniaCopyright © 2023 Xu, Liu, Yalikun, Li, Ren and Wen. This is an open-access article distributed under the terms of the Creative Commons Attribution License (CC BY). The use, distribution or reproduction in other forums is permitted, provided the original author(s) and the copyright owner(s) are credited and that the original publication in this journal is cited, in accordance with accepted academic practice. No use, distribution or reproduction is permitted which does not comply with these terms.
*Correspondence: Zhishuang Xu, eHpzMDYxMEBzZWlzLmFjLmNu
Disclaimer: All claims expressed in this article are solely those of the authors and do not necessarily represent those of their affiliated organizations, or those of the publisher, the editors and the reviewers. Any product that may be evaluated in this article or claim that may be made by its manufacturer is not guaranteed or endorsed by the publisher.
Research integrity at Frontiers
Learn more about the work of our research integrity team to safeguard the quality of each article we publish.