
94% of researchers rate our articles as excellent or good
Learn more about the work of our research integrity team to safeguard the quality of each article we publish.
Find out more
ORIGINAL RESEARCH article
Front. Earth Sci., 19 January 2023
Sec. Petrology
Volume 11 - 2023 | https://doi.org/10.3389/feart.2023.1128692
This article is part of the Research TopicTectono-Magmatism, Metallogenesis, and Sedimentation at Convergent MarginsView all 13 articles
Reconstruction of paleo-depositional environments in a sedimentary basin is often obstructed by the absence of typical environmental indicators in sedimentary rocks. Here, we propose a biomarker method using C20-C21-C23 tricyclic terpanes (TTs) as a tracer, which is simple in analysis but robust to provide reliable and detailed environmental information. Based on the analysis of 271 C20-C21-C23TT data from 32 basins in 18 countries, we observed a relationship between C20-C21-C23TT abundance patterns and depositional environments. This relationship was attributed to the control of depositional environments on the input proportions of plankton and terrigenous plants, which act as two end-member precursors for the TTs in a depositional system. The various mixing proportions between these two end-members result in different C20-C21-C23TT abundance patterns associated with different depositional environments, e.g., C20>C21>C23TT in river-lake transitional, C20<C21<C23TT in marine or saline lacustrine environments, C20<C21>C23TT in freshwater lacustrine and C20>C21<C23TT in marine-continental transitional environments. In addition, the C23/C21TT ratio increases with elevated salinity of depositional water, and the C21/C20TT ratio increases with increasing water depths. Based on these observations, a discrimination diagram using C23/C21TT vs. C21/C20TT was developed for environmental identification. The validity of this C20-C21-C23TT biomarker method is well demonstrated by the rock samples with typical environmental indicators. This method is applicable in a broad spectrum of rocks and in maturities up to 2.4%Ro. Its strength was shown by a case study of a complex depositional system in the East China Sea Basin, which has been strongly affected by eustasy.
Reconstruction of paleo-depositional environment is critical in oil-gas exploration, paleoclimatic and paleoenvironmental studies. Conventional methods for environmental reconstruction mostly rely on sedimentary, petrological and/or mineralogical characterizations (e.g., Oskay et al., 2019; Pichat et al., 2021), paleontological record (e.g., Heard et al., 2020), and/or geochemical tracing (e.g., Govind et al., 2021). For example, lithology, sedimentary/biogenic structures, rock fabrics and texture in sedimentary rocks have been used to reconstruct sedimentary microfacies, which is further used to infer depositional environments (e.g., El-Sabbagh et al., 2017; Mtelela et al., 2017; Barrera et al., 2020). However, these sedimentological, mineralogical and petrological characterizations are sometimes limited by the availability of outcrops and drilling cores, or the lack of typical depositional indicators. Paleontological methods are highly efficient in revealing paleo-depositional environment. Fossils, bioglyphs and their assemblages have been used to classify biofacies (e.g., Laprida et al., 2007; El-Sabbagh et al., 2017; Mahfouz et al., 2021). However, well-preserved characteristic fossils are not always available in sedimentary rocks because most of organisms in sediments have been degraded during burial and diagenesis. Geochemical data are sensitive to a variety of depositional conditions, such as redox condition (e.g., V/Cr, Ni/Co, U/Th) and salinity (e.g., Sr/Ba, B/Ga, Rb/K). However, these geochemical parameters are not diagnostic to a specific depositional environment, and thus cannot be used solely for depositional environment identification. Recently, biomarkers produced from the degradation of organisms living in different environments has attracted increasing attention in depositional environment studies (e.g., Aderoju and Bend, 2018; Wendorff-Belon et al., 2021; Liu et al., 2022). Here, we demonstrate a new biomarker method using C20-C21-C23 tricyclic terpanes (TTs) as a robust tool for the identification of depositional environment.
TTs with carbon numbers range from C19 to C29 are ubiquitous in crude oils and extracts of sedimentary rocks (De Grande et al., 1993). Higher carbon TTs are also present but are often masked by hopanes in the m/z 191 mass chromatogram (Samuel et al., 2010) (Figure 1). TTs have been widely applied to oil-source correlation due to their high thermal stability and resistance to biodegradation (Farrimond et al., 1999; Xiao et al., 2019a). Although the exact precursors of TTs have not been identified yet (Dutta et al., 2006; Philp et al., 2021), previous studies have noticed a close relationship between TTs and depositional environments. TTs always show a predominance of C23TT in marine facies and a predominance of C21TT in freshwater lacustrine facies, and more abundant lower than higher carbon numbers of TTs in shallow-water environments (e.g., Zumberge, 1987; Tao et al., 2015; Atoyebi et al., 2017; Xiao et al., 2019b).
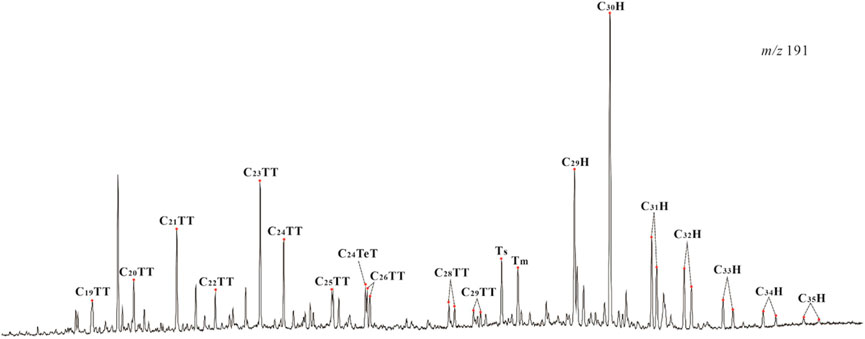
FIGURE 1. Mass chromatogram (m/z 191) showing the distribution of tricyclic terpanes (TTs) and hopanes (Hs) in the rock extract from C1 well in the East China Sea Basin.
However, the exact correspondences between TTs and various depositional environments have not been clearly defined, limiting their applications to environmental identification. Here, we carried out a thorough examination of new and published C20-C21-C23TT data from a range of known depositional environments worldwide and discovered good correspondences between C20-C21-C23TT abundance patterns and typical depositional environments. Based on the analysis on the origin of C20-C21-C23TT abundance patterns, a discriminating diagram of C20-C21-C23TTs was developed for environmental identification and was then demonstrated for its validity and applicability, and was finally applied to a complex depositional system in the East China Sea Basin to show its strength.
A total of 232 C20-C21-C23TT data from a range of depositional environments in 30 basins across 18 countries were compiled from the literature (Table 1; Supplementary Table S1). The data were obtained from gas chromatography-mass spectrometry (GC-MS) analysis of crude oils and source-rock extracts, with rock ages mainly ranging from the Devonian to Neogene (Supplementary Table S1).
Additionally, new C20-C21-C23TT data were acquired from four source-rock samples and 35 oil samples from three basins (the Ordos, Bohai Bay and Qaidam basins) in China (Table 1 and Supplementary Table S1). The soluble organic matter was extracted from the source rocks following the description by Philp et al. (2021). The biomarkers including C20-C21-C23TTs in the rock extracts and oils were analyzed by GC-MS as described by Wang et al. (2019). Subsequently, the source rocks for the oils were determined by the previous oil-source correlations in these basins (e.g., Sun, 2006; Cao et al., 2008; Zhang et al., 2009). As the depositional environments of source rocks in these three basins have been well constrained by previous studies (e.g., Zhu and Jin, 2003; Sun, 2006; Cao et al., 2008; Zhang et al., 2009; Gao et al., 2014), the correspondence between C20-C21-C23TT data and depositional environments were easily determined.
In order to verify the validity of our biomarker method and its applicability to thermal maturity, 13 core samples from 8 wells were collected from the Ordovician and Permian in the Ordos Basin (Table 2). These samples contain typical depositional environment indicators or were deposited in the well-defined depositional environments. All these samples are now at highly mature stages (Table 2). C20-C21-C23TTs in these rock extracts were also analyzed by GC-MS as described by Wang et al. (2019). Two samples (i.e., L65, 4296.3 m and L41-1, 4120 m) were selected to measure vitrinite reflectance (Ro%) following the description by Kalinowski and Gurba (2020). Two thin sections (i.e., L65, 4296.3 m and L66, 4040.45 m) were prepared for the observation of petrography and fossil.
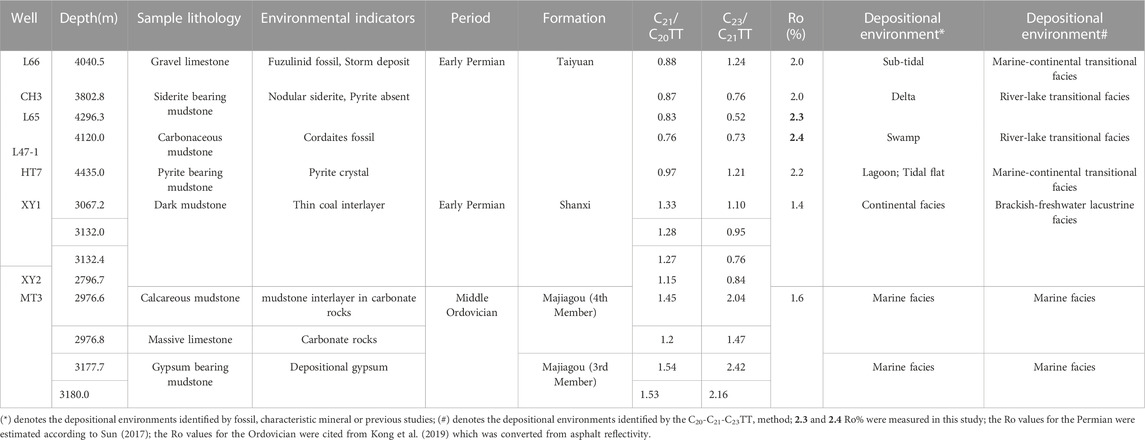
TABLE 2. The ratios of C21/C20TT, C23/C21TT and vitrinite reflectance (Ro) from the known depositional environments in the Ordos Basin.
Forty-four sets of geochemical data (including total organic carbon (TOC), Rock-Eval pyrolysis, chloroform asphalt ‘A’, Ro and biomarkers of rock extracts) obtained from 14 wells in the Pingbei area in the East China Sea Basin (Table 3), were collected from the SINOPEC Shanghai Offshore Oil & Gas Company for a case study.
The marine C20-C21-C23TT data were compiled from 20 basins in 11 countries (Table 1). Their C21/C20TT and C23/C21TT ratios vary from 0.98 to 2.83 and 1.20 to 3.57, respectively (Figure 2). The relative abundances of C20-C21-C23TTs display a pattern of C20<C21<C23TT (e.g., Figure 3A).
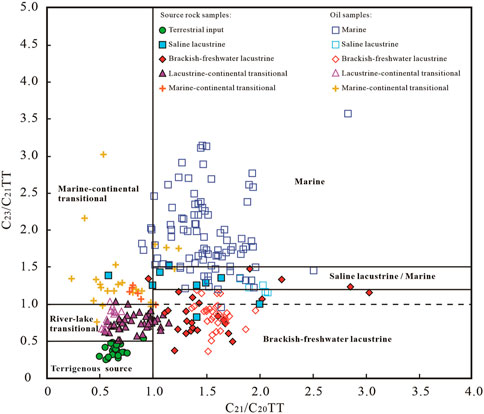
FIGURE 2. Cross-plots of C20-C21-C23 tricyclic terpane (TT) ratios in context of depositional environments. The solid boundary lines were established with confidence by the data. The dotted line is a speculated boundary between brackish and freshwater lacustrine facies.
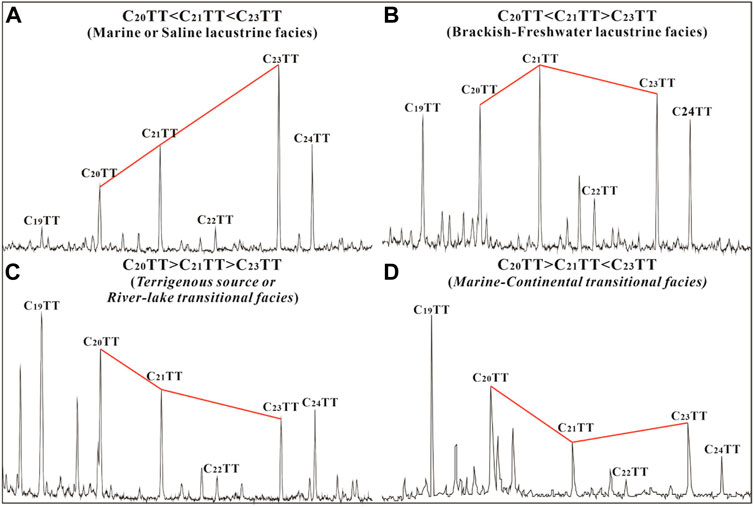
FIGURE 3. Four representative abundance patterns of C20-C21-C23 tricyclic terpanes (TTs) in six depositional environments (A), Marine or Saline lacustrine facies; (B), Brackish-freshwater lacustrine facies; (C), Terrigenous or River-lake transitional facies; (D), Marine-continental transitional facies.
Saline lacustrine facies is represented by the source rocks from the Junggar Basin in Northwestern China (Bian et al., 2010; Yu et al., 2017) and the oil samples from the Bohai Bay Basin in Eastern China (Table 1). Their C21/C20TT and C23/C21TT ratios vary from 1.00 to 2.08 and 1.15 to 1.52, respectively (Figure 2), which slightly overlaps with samples classified as marine in origin (Zhu and Jin, 2003; Yu et al., 2017). The relative abundances of C20-C21-C23TTs associated with saline lacustrine facies are similar to those of marine facies.
Brackish-freshwater lacustrine facies is represented by the samples from the Muglad Basin (Sudan) (Xiao et al., 2019b), Bohai Bay Basin (Lv and Thesis, 2019) and Ordos Basin in Central China (this study, Table 1), which were deposited in semi-deep to deep brackish-freshwater lacustrine facies (Zhang et al., 2009; Xiao et al., 2019a; Ma et al., 2019). The C21/C20TT and C23/C21TT ratios fall into the ranges of 0.95–3.03 and 0.36 to 1.34, respectively (Figure 2). The relative abundances of C20-C21-C23TTs display two patterns: C20<C21<C23TT and C20< C21>C21TT (e.g., Figure 3B).
Terrigenous organic matter can be transported by rivers and eventually deposited in lacustrine or marine environments. Terrigenous organic matter transported by rivers has been reported to be deposited in marine facies in the northern South China Sea (Li et al., 2011; Deng et al., 2019) and lacustrine facies in the Junggar Basin (Gao et al., 2017). On this condition, the C20-C21-C23TT data are strongly controlled by the source instead of depositional environment. The C20-C21-C23TT data of terrigenous source in the Junggar Basin give C21/C20TT ratios of 0.50–0.91, and C23/C21TT ratios of 0.25–0.53 (Figure 2), with a relative abundance of C20>C21>C23TT (e.g., Figure 3C).
Marine-continental transitional facies is represented by the C20-C21-C23TT data from 11 basins in nine countries collected by Zumberge (1987) and Gao et al. (2017) (Table 1). The majority of the C21/C20TT ratios are lower than 1.0, while the C23/C21TT ratios are mostly greater than 1.0 (Figure 2), showing an abundance pattern of C20>C21<C23TT (e.g., Figure 3D).
River-lake transitional facies is represented by the C20-C21-C23TT data from the Junggar Basin (Wang et al., 2020) and Qaidam Basin (this study and Cao et al., 2008; Table 1) in China. Their C21/C20TT and C23/C21TT ratios vary from 0.52 to 1.04 and 0.51 to 1.03, respectively (Figure 2), with a dominant C20>C21>C23TT pattern.
TTs have drawn broad attention in literature since Anders and Robinson (1971) and Gallegos (1971) described the lower homologs (C19-C24) of TTs in the bitumen and oils of the Green River Shale (e.g., Aquino Neto et al., 1982; Chicarelli et al., 1988; De Grande et al., 1993; Dutta et al., 2006; Tao et al., 2015; Philp et al., 2021). Multiple compound sources/precursors for TTs have been proposed, such as prokaryotic cell membrane (e.g., Ourisson et al., 1982), diterpenes in terrigenous plants (e.g., Ekweozor et al., 1983) and the now-extinct algal-like Tasmanites (e.g., Aquino Neto et al., 1982; Chicarelli et al., 1988; De Grande et al., 1993; Dutta et al., 2006). So far, no clear precursor-product relationship has been established, which has at least partially impeded the direct application of TTs as source indicators (Philp et al., 2021).
Here, the analysis of a large amount of C20-C21-C23TT data from various depositional environments provides some insights into the origin of the observed C20-C21-C23TT abundance patterns. Previous studies have shown that the organic matter in typical marine and shallow-water terrestrial facies mainly originated from plankton and terrestrial plants (e.g., Tissot and Welte, 1978). Accordingly, the C20<C21<C23TT pattern likely corresponds to a dominant plankton input, while the C20>C21>C23TT pattern may correspond to a dominant contribution of terrigenous plants. The former correspondence can be evidenced by the Neoproterozoic oil shale (900–873 Ma; maturity: 0.6–0.7%Ro) in North China, in which the terrigenous plant input can be ignored (Zhang et al., 2007). This oil shale contains cyanobacteria and green algae, and shows a C20<C21<C23TT abundance pattern in the rock extracts, suggesting that planktons are the biological source for the TTs with C20<C21<C23TT abundance pattern.
The analysis also indicates that neither plankton nor terrigenous plants alone can generate the TTs with C20>C21<C23TT or C20<C21>C23TT patterns, which have been observed in marine-continental transitional and brackish-freshwater lacustrine facies, respectively. As these two depositional environments commonly receive blended input of plankton and terrigenous plants, mixing from different sources is likely the cause of the C20>C21<C23TT and C20<C21>C23TT patterns. This hypothesis is well supported by the numerical modeling of a mixing between plankton and terrigenous plants at various mixing ratios (Figure 4). Representative C20-C21-C23TT abundance patterns in the terrigenous plants domain (i.e., Point A in Figure 4A) and the plankton domain (i.e., Points B or C in Figure 4A) determined by this study, were used as end-members for the mixing modeling.
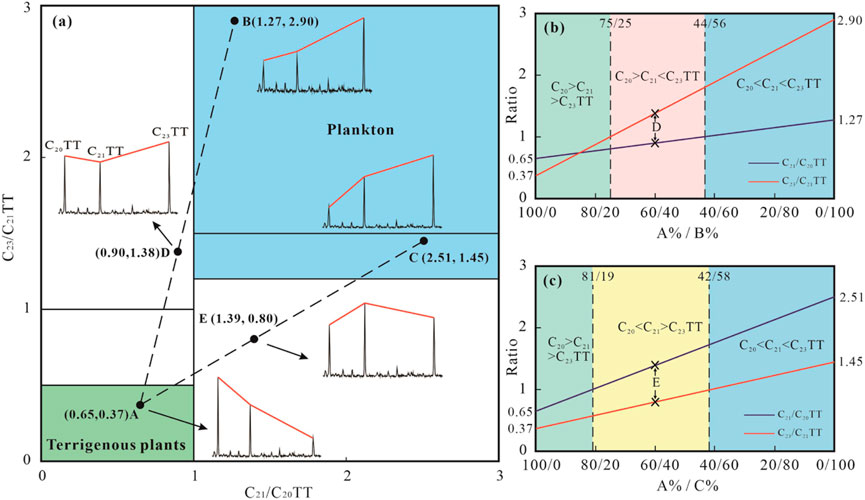
FIGURE 4. Numerical simulation for the origin of C20-C21-C23 tricyclic terpane (TT) abundance patterns by mixing plankton and terrigenous plants at various mixing ratios. Points (A–C) are the representative end-member C20-C21-C23TT distributions for the mixing modeling. With the change of mixing ratios between A and B (C), the C20-C21-C23TT abundance pattern changes along Line A-B (C). Points D and E are the representative C20-C21-C23TT abundance patterns of A-B mixture and A-C mixture, respectively.
As illustrated in Figure 4, with the change of mixing ratios between A and B, the C20-C21-C23TT abundance pattern changes from C20>C21>C23TT to C20>C21<C23TT (e.g., D in Figures 4A, B) when the mixing ratio (expressed as A%/B% ratio) decreases from 100/0 to 75/25, and further to C20<C21<C23TT when the mixing ratio is lower than 44/56 (Figure 4B). Similarly, mixing between A and C can generate the C20<C21>C23TT pattern (e.g., E in Figures 4A, C) when the mixing ratios (expressed as A%/C% ratio) are in the range of 81/19–42/58 (Figure 4C). Notably, almost all C20-C21-C23TT data in this study fall into a range from the terrigenous plants domain to the plankton domain (Figure 5), suggesting that C20-C21-C23TT abundance patterns are strongly controlled by the two end-member biological sources and their mixing contributions. Thus, the input mixing of plankton and terrigenous plants at different proportions should be responsible for the formation of various C20-C21-C23TT abundance patterns.
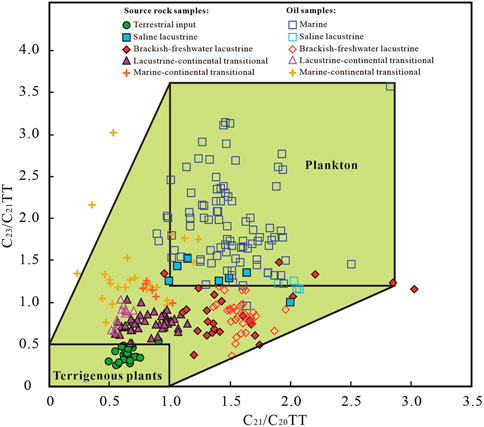
FIGURE 5. Cross-plot of C20-C21-C23 tricyclic terpane (TT) ratios with two defined end-member domains of plankton and terrigenous plants. Almost all C20-C21-C23TT data in this study fall into a range from the terrigenous plants domain to the plankton domain.
Depositional environments control the input proportions of plankton and terrigenous plants, which is proposed to control the C20-C21-C23TT abundance patterns in sedimentary rocks. The analysis of available C20-C21-C23TT data from known depositional environments clearly show that the C20-C21-C23TT abundance patterns in different depositional environments are distinct from each other, with C20<C21<C23TT in typical marine and saline lacustrine facies, C20<C21>C23TT in freshwater lacustrine facies, C20>C21>C23TT in river-lake transitional facies, and C20>C21<C23TT in marine-continental transitional facies. As illustrated in Figure 2, the C23/C21TT ratio not only increases progressively from freshwater lacustrine, to saline lacustrine, to marine facies, but also increases progressively from terrigenous source, to river-lake transitional, to marine-continental transitional facies. The C23/C21TT ratio appears to increase gradually with elevated salinity of depositional water. The increase in salinity usually indicates a decrease in fresh-water input and therefore a decrease in terrigenous input, which results in the C23/C21TT ratios approaching their source signatures of halophilic plankton. Accordingly, the boundary between brackish and freshwater lacustrine facies is expected to lie around a C23/C21TT ratio of 1.0 (Figure 2). Furthermore, the C21/C20TT ratios in marine and lacustrine facies are obviously greater than those in transitional facies (Figure 2), suggesting that the C21/C20TT ratio seems to increase with elevated depths of depositional water. In general, the greater the depositional depth, the farther offshore, and the less terrigenous input. Thus, their C21/C20TT ratios approach the signatures of planktons (halophilic plankton or freshwater plankton).
Based on the good correspondences between C20-C21-C23TT abundance patterns and typical depositional environments, the cross-plot of C23/C21TT vs. C21/C20TT in context of depositional environments (Figure 2) can be used as a discriminating diagram for environmental identification. C23/C21TT and C21/C20TT are expected to be the parameters to assess water salinity and depositional depth, respectively.
The Ordos Basin undergone (1) an early Paleozoic shallow oceanic-platform stage and 2) a late Paleozoic offshore-plain stage during the Paleozoic (Li, 2004). During the Middle Ordovician, the Majiagou Formation was deposited within a semi–closed epicontinental sea environment (Li et al., 2018). From the Late Ordovician to the Early Carboniferous, the basin was uplifted by the Caledonian orogeny and underwent 130 million years of erosion (Yang et al., 2012; Xu et al., 2018). The following Hercynian orogeny caused the Late Paleozoic Ordos Basin subsidence. Large scale of transgression occurred from the east and west of the basin during the Benxi period and the seawater connected together during the Late Taiyuan period. With the gradual regression during the Shanxi period, continental deposition began to dominate, resulting in the development of marine-continental transitional facies, delta facies and lacustrine facies (Sun, 2017).
Thirteen core samples from the Ordovician-Permian in the Ordos Basin (Figure 6; Table 2) and ten coal or carbonaceous mudstones from the Eocene in the East China Sea Basin (Table 3) were used to verify the validity of C20-C21-C23TT biomarker method.
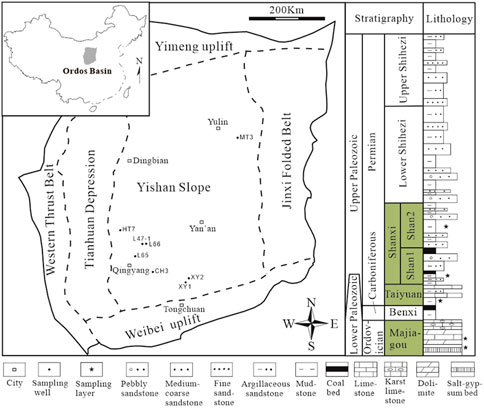
FIGURE 6. Tectonic units and composite stratigraphic columnar section of the Ordos Basin (modified from Li et al., 2021). The samples were collected from the Yishan Slope with the ages ranging from the Ordovician to Permian.
The four samples including gypsum bearing mudstones, massive limestone and calcareous mudstone (Table 2) from the Majiagou Formation were all identified as marine facies (Figure 7), which is consistent with the present understanding of epicontinental sea environment (Li et al., 2018). Furthermore, the suggestion that the C23/C21TT ratio is a salinity indicator in this study is also evidenced by these samples. The Majiagou Formation is divided into six members, numbered from bottom to top as Ma1 to Ma6. The Ma1, Ma3 and Ma5 members were deposited with evaporite production during low sea level, while the Ma2, Ma4 and Ma6 members were deposited with carbonate production during high sea level (Xiao et al., 2019b). Thus, the depositional water salinity of Ma3 is higher than that of Ma4. It should be noted that the C23/C21TT ratios in Ma3 extract are indeed greater than those in Ma4 extract (Table 2; Figure 7).
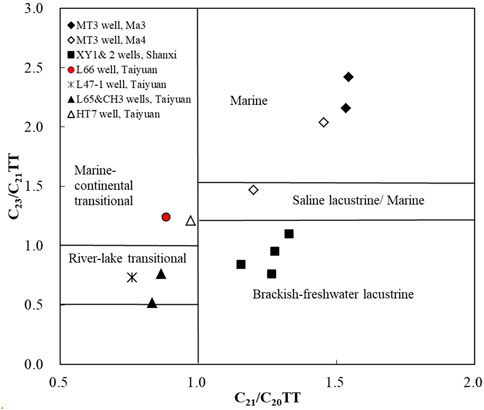
FIGURE 7. Environmental identification for the samples from the Ordovician and Permian in the Ordos Basin.
The depositional environments of the Permian Shanxi Formation in the southern Ordos basin have been determined by previous studies to be continental facies including delta and lacustrine facies (e.g., Wang et al., 2007; Sun, 2017; Li et al., 2021). Four dark mudstones from the Shanxi Formation in XY1 and XY2 wells (See locations in Figure 6) were extracted for environmental identification. As shown in Figure 7, the C21/C20TT and C23/C21TT ratios of these mudstones plot within the brackish-freshwater lacustrine facies, consistent with the regional depositional environments.
Cordaitean fossil leaves are known from early Carboniferous to early Permian deposits, representing the depositional environments including floodplains, river levees, coastal plains or swamp (Zodrow et al., 2000; Yang, 2007). The carbonaceous mudstone containing the Cordaitean fossil leaves (Figure 8A; Table 2) was identified as river-lake transitional facies by our biomarker method (Figure 7). This is consistent with the depositional environments indicated by the Cordaitean fossil leaves.
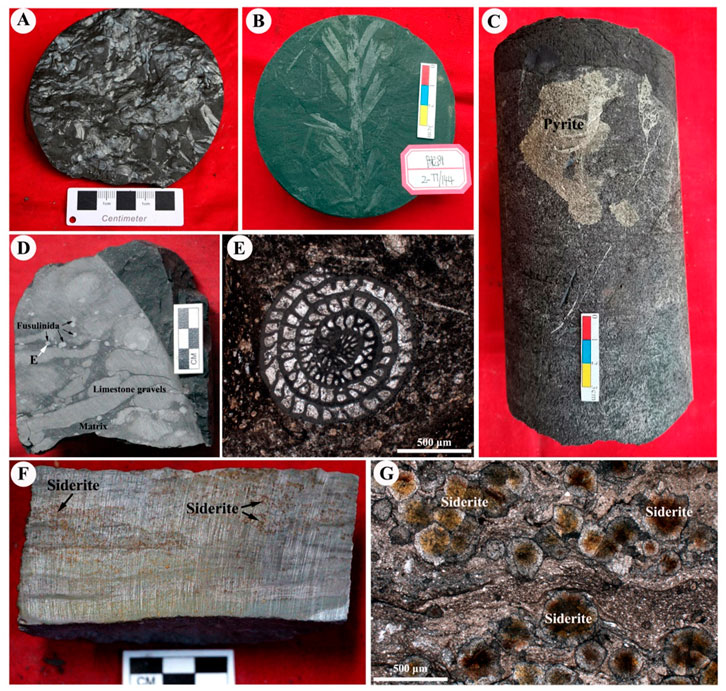
FIGURE 8. Depositional environment indicators in the core samples and thin sections from the Taiyuan Formation in the Ordos Basin [(A), Cordaites fossil, L47-1 well, 4120m; (B), Cordaites fossil, L81 well; (C), Pyrite crystal, HT7 well, 4435.0m; (D, E), Fuzulinid fossil and limestone gravels, L66 well, 4040.5 m; (F, G), Nodular siderite, L65 well, 4296.3 m].
The Fuzulinid fossil with 1 mm∼4 mm in size and limestone gravels (Figures 8D, E) constitute a storm deposition which indicates a sub-tidal depositional environment. This sample was identified by the biomarker method to be deposited within a marine-continental transitional facies (Figure 7). As sub-tidal belongs to marine-continental transitional facies, the identification result of our biomarker method is thus correct.
It is widely known that coal and carbonaceous mudstone are the indicators of shallow-water environment (e.g., swamp). The C20-C21-C23TT biomarker method not only identified the coal and carbonaceous mudstone as shallow-water environment (i.e., transitional environments defined by C21/C20TT<1.0) as expected, but further determined their specific depositional environments: marine-continental transitional or river-lake transitional environments (Figure 9A).
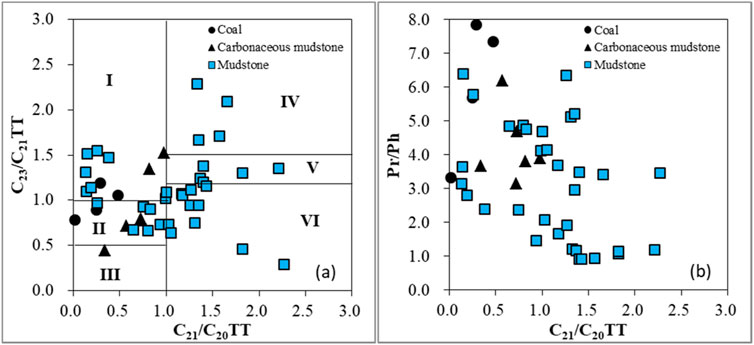
FIGURE 9. Cross-plots of C23/C21TT vs. C23/C21TT (A) and C21/C20TT vs. Pr/Ph (B) in the Pingbei area, East China Sea Basin. Note: TT= tricyclic terpane; Pr/Ph = pristane/phytane; I: Marine-continental transitional facies; II: River-lake transitional facies; III: Terrigenous source; IV: Marine facies; V: Saline lacustrine facies or marine facies; VI: Brackish-freshwater lacustrine facies.
Although siderite can occur in various depositional environments, layered nodular siderite without pyrite in mudstone (Figures 8F, G) was considered to be deposited in delta front, where iron oxides and terrigenous organic matter transported by river water are condensed and precipitated in a large amount (Shen et al., 2017). The two siderite bearing mudstones were identified by the biomarker method to be deposited within a river-lake transitional facies (Figure 7). According to the sedimentary model of rock series containing siderite and pyrite created by Shen et al. (2017), the mudstone containing pyrite was expected to be deposited in lagoon or tidal flat. The pyrite bearing mudstone was identified by the biomarker method to be deposited within a marine-continental transitional facies (Figure 7). It is clear that these two identification results using the biomarker method are both correct.
Compared with siderite, pyrite was considered to be precipitated in a relatively deeper environment (Figure 10). Notably, the C23/C21TT ratio of pyrite bearing mudstone is greater than those of siderite bearing mudstones (Table 2; Figure 7), indicating that the suggestion of C23/C21TT ratio as a depth indicator is reasonable. This suggestion was also evidenced by the negative correlation between pristane/phytane (Pr/Ph) and C21/C20TT ratios (Figure 9B). Pr/Ph ratios, which have been widely used to assess the redox of depositional environment, decrease with elevated anoxic conditions (Rashid, 1979). As shown in Figure 9B, the Pr/Ph ratios decrease along the C21/C20TT values. The increase in C21/C20TT ratios indicates an increase in depositional depths, which further indicates an increase in anoxic conditions.
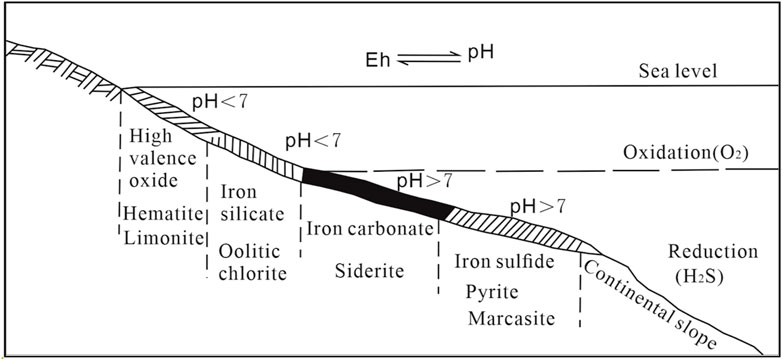
FIGURE 10. Schematic diagram of the facies change of sedimentary iron ore deposits (modified from Qiu, 1987).
The C20-C21-C23TT biomarker method only requires a small amount of rock extracts, depending on the lower limit of GC-MS analysis. At present, the rock extracts more than 10 μg is guaranteed to obtain high-quality m/z191 mass chromatogram. Take the mudstone samples from the Pingbei area for example, the TOC and S1+S2 values of mudstone samples vary from 0.23% to 3.68% and from 0.20 mg/g to 6.03 mg/g (Table 3), which were classified as “poor” to “fair” level source rocks. Although the chloroform asphalt ‘A’ extracted from the mudstones are as low as 0.01% (Table 3), the high-quality m/z 191 mass chromatogram with C20-C21-C23TT signature has been obtained from every mudstone sample (e.g., Figure 1). This indicates that our method is not necessarily restricted to hydrocarbon source rocks, but can be applied to a broad spectrum of rocks.
TTs are characterized by higher thermal stability than hopanes and steroterpenes (Peters et al., 1990; Farrimond et al., 1999; Xiao et al., 2019a). Thermal evolution during maturation and high-maturation stages makes little effect on the abundance patterns of C20-C21-C23TT (Chen et al., 2017; Xiao et al., 2019b). As shown in Table 2, although the rocks have evolved into the maturities ranging from 1.6% to 2.4%Ro, C20-C21-C23TT biomarker method are still effective in environmental identification. Furthermore, C20-C21-C23TT distributions are stable even in the severely biodegraded oils with 25-norhopane series, showing strong resistance to biodegradation (Xiao et al., 2019a).
To test the robustness of the C20-C21-C23TT biomarker method for environmental identification, it has been applied to a complex depositional system: the Pingbei area in the East China Sea Basin (Figure 11).
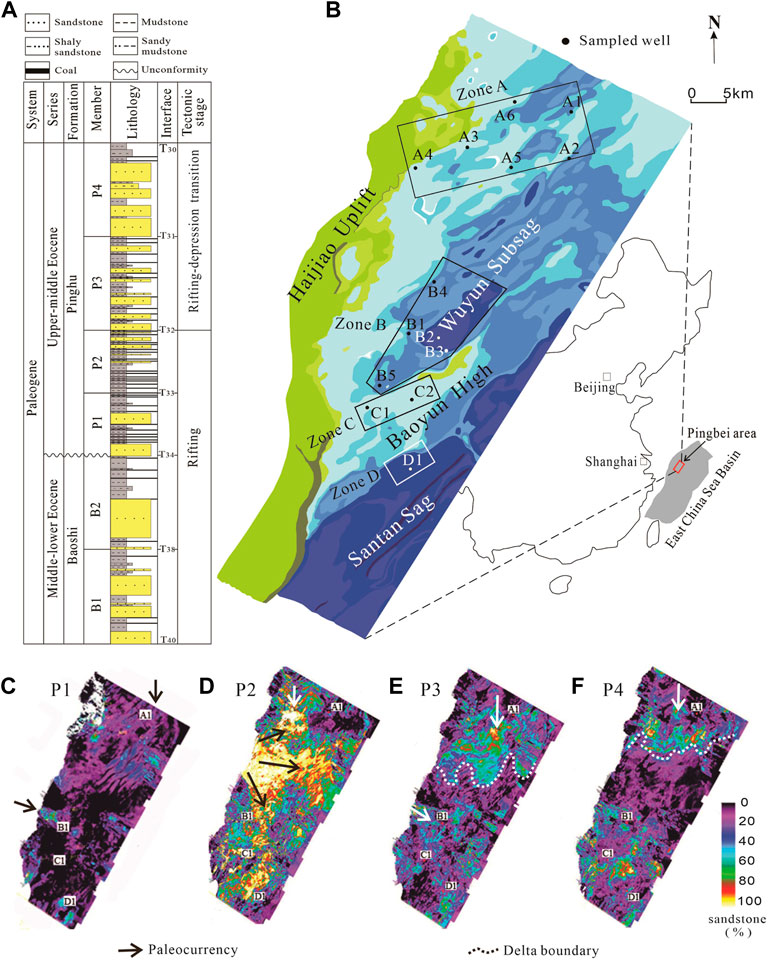
FIGURE 11. Generalized stratigraphy of the Pinghu Formation (A), the paleogeomorphology at the bottom of P1 Member [(B), modified from Li et al., 2019), the sandstone percentages (including siltstone, obtained by seismic inversion] in the P1 (C), P 2(D), P3 (E) and P4 (F) members in the Pingbei area in the East China Sea Basin.
The Pingbei area was a hinged margin of a rift basin during the Eocene (Soreghan and Cohen, 1996). The petroleum system in the area is within the upper-middle Eocene Pinghu Formation, which consists of alternate sandstone, mudstone and thin coal seams. From bottom to top, the Pinghu Formation is further divided into the P1, P2, P3 and P4 members (Figure 11A).
Due to the scarcity of wells and the lack of typical facies indicators in drill core, the depositional environments of the Pinghu Formation have been strongly debated among three possibilities: delta environment (e.g., Shen et al., 2016; Jiang et al., 2020), tidal flat environment (e.g., Zhao et al., 2008) and mixed delta and tidal flat environment (e.g., Zhang et al., 2017; Abbas et al., 2018).
The Ro values in the Pinghu Formation in the area vary from 0.51% to 0.87% (Table 3), indicating a low-mature to mature stage. The C20-C21-C23 TT abundance patterns cannot be affected by this maturity range, and are thus available to identify depositional environments. The C21/C20TT and C23/C21TT ratios were plotted in the discriminating diagram to identify the depositional environment of each member in the Pinghu Formation (Figure 12). Paleogeomorphologic map (Figure 11B) and seismic inversion data (Figures 11C–F) are also reported here as additional evidence to (1) support the environmental identification by the C20-C21-C23TT biomarker method, and (2) help characterize the spatial distribution of depositional environment (Figures 12B, D, F, H).
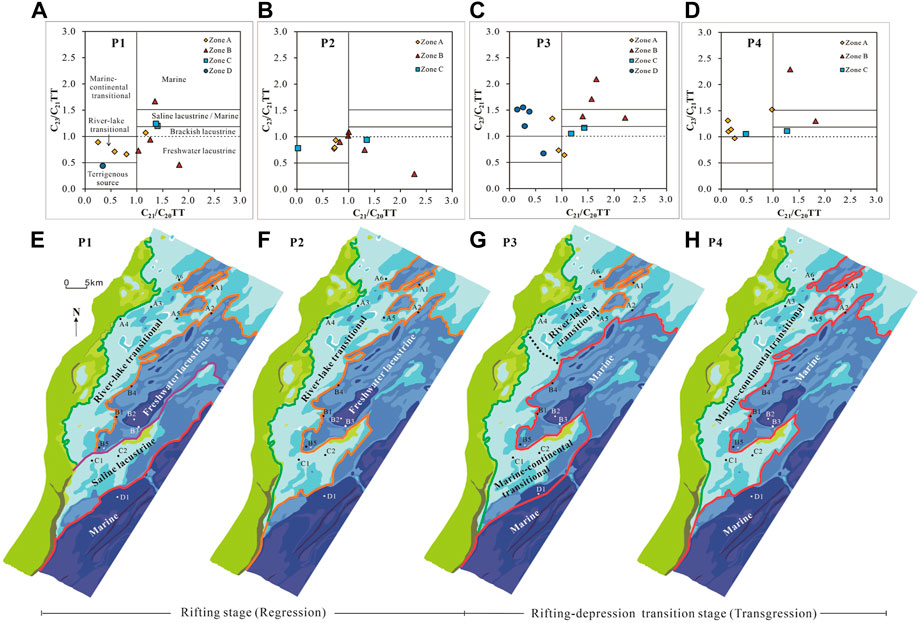
FIGURE 12. Environmental identification for the P1 (A), P2 (C), P3 (E) and P4 (G) members, and depositional environment distribution of the P1 (B), P2 (D), P3 (F) and P4 (H) members in the Pingbei area.
The depositional environments of P1 Member in zones A, B and C (see locations in Figure 11B) are identified as river-lake transitional, freshwater lacustrine and saline-lacustrine/marine facies (Figure 12A), respectively. Organic matter in the carbonaceous mudstone (Table 3) in Zone D (Figure 11B) was originated from a terrestrial source through river transportation (Figure 12A). Based on the environmental identification and paleogeomorphologic map of this period (Figure 11B), the depositional environment in Zone D is expected to be marine facies.
Notably, the spatial distribution of these facies is consistent with an environmental transition from continental facies in the north to marine facies in the south (Figure 12B). The Baoyun High formed in the rifting stage (Figures 11A, B) probably isolated the northern freshwater deposition and southern saline water deposition. The interpretation of a freshwater lake in Zone B is acceptable because Zone B was located at the Wuyun Subsag during the P1 period (Figure 11B).
The depositional environments of P2 Member are identified as a continental depositional system including freshwater lacustrine facies in the subsag and river-lake transitional facies around the subsag (Figures 12C, D). This environmental identification is supported by the evidence from seismic sedimentology: a large-scale fluvial-induced delta with a bird-foot shaped distribution of sand bodies occurred in the study area (Figure 11D).
The spatial distribution and sand body shapes revealed by seismic inversion indicate a wave-altered delta in the north and a speculative delta in the south (Figure 11E), suggesting a transitional facies dominated in the area. For comparison, the C20-C21-C23TT biomarker method also identified a transitional facies, but provides much more detailed depositional information: river-lake transitional facies in Zone A, marine facies in Zone B, and marine-continental transitional facies in C and D zones (Figures 12E, F).
The depositional environment of P4 Member in Zone A is identified as marine-continental transitional facies (Figure 12G), which is consistent with the interpretation of wave-altered deltas by seismic inversion (Figure 11F). The depositional environments in B and C zones are identified as marine/saline lacustrine and marine-continental transitional facies (Figure 12G). These environments indicate that the Pingbei area was dominated by saline-water deposition during the P4 period (Figure 12H).
Based on the above depositional environments identified by the C20-C21-C23TTs, the environmental evolution process of the Pinghu Formation was reconstructed. The P1 Member in the area is characterized by a coexistence of continental system in the north and marine system in the south which were isolated by the Baoyun High (Figure 12B). During the P2 period, freshwater deposition range obviously expanded and the area was dominated by a continental depositional system (Figure 12D), suggesting a regression has occurred since the P1 period. This regression can be characterized by a synchronous decrease of C23/C21TT values from the P1 to P2 members in B1 and C1 wells (Figures 13A, B). Subsequently, the depositional environments in the area gradually evolved into a marine depositional system (Figures 12F, H), suggesting a transgression occurred during the P3 and P4 periods in the area. This transgression was also characterized by a synchronous increase of C23/C21TT values from the P2 to P4 members (Figure 13).
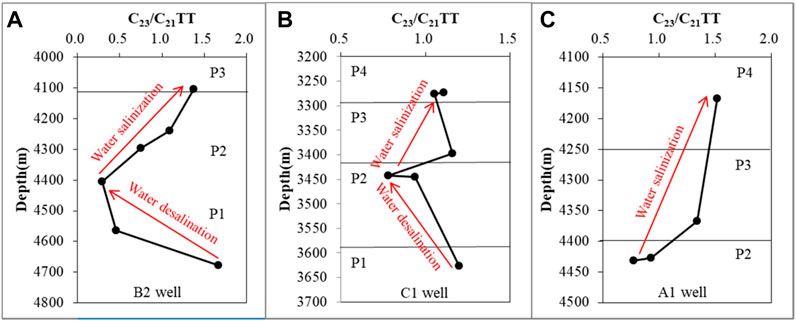
FIGURE 13. The profile of C23/C21TT ratios along depths for the rock samples in the B2 (A), C1 (B) and A1 (C) wells. The C23/C21TT ratios in these three wells vary synchronously along stratum.
In summary, the depositional environments of the Pinghu Formation in the Pingbei area were controlled by a complex marine-continental transitional system to a large extent. The C20-C21-C23TT biomarker method not only identified the depositional environments supported by evidence from seismic sedimentology, paleogeomorphology and other conventional methods (e.g., Shen et al., 2016), but also provided much more depositional details. Take the freshwater lacustrine facies hidden in the marine-continental transitional environment for example, it has not been recognized by previous studies but was easily identified by our method. Thus, the C20-C21-C23TT abundance patterns are robust for environmental identification even for the complex systems strongly affected by eustasy, which generally resulted in coexistence of and/or fast transition between diverse depositional environments.
Based on the analysis of a large quantity of published data and this study from a range of depositional environments worldwide, we propose that the relative abundance of C20-C21-C23TTs in sedimentary rocks and oils are controlled by the relative contribution of plankton and terrigenous plants. The C20-C21-C23TT abundance patterns in marine and saline lacustrine, freshwater lacustrine, shallow-water terrestrial, and marine-continental transitional facies are very distinct, characterized by C20<C21<C23TT, C20<C21>C23TT, C20>C21>C23TT and C20>C21<C23TT, respectively. The C23/C21TT ratio increases with increasing salinity of depositional water, while the C21/C20TT ratio increases with increasing depth of depositional water.
A discrimination diagram has been developed in this study for environmental identification. The C20-C21-C23TT ratios can not only identify depositional environments, but also restore the environmental evolution through the analysis of salinity and depth variation. The effectiveness, applicability and robustness of this C20-C21-C23TT method have been demonstrated by the samples with typical environmental indicators and a case study in a complex depositional system in the East China Sea Basin.
The original contributions presented in the study are included in the article/Supplementary Material; further inquiries can be directed to the corresponding author.
AW: Idea, Writing; CL: Data collection, Sample testing, Writing; LL: Review, Supervision, Language polishing; RP: Seismic inversion.
This work was supported by the National Natural Science Foundation of China (No. 41402115); the Natural Science Basic Research Program of Shaanxi (2020JQ-591).
The authors sincerely thank the SINOPEC Shanghai Offshore Oil & Gas Company for contributing data. Prof. Qu Hongjun at Department of Geology, Northwest University is thanked for his informative and valuable discussions on research methods of depositional environment.
The authors declare that the research was conducted in the absence of any commercial or financial relationships that could be construed as a potential conflict of interest.
All claims expressed in this article are solely those of the authors and do not necessarily represent those of their affiliated organizations, or those of the publisher, the editors and the reviewers. Any product that may be evaluated in this article, or claim that may be made by its manufacturer, is not guaranteed or endorsed by the publisher.
The Supplementary Material for this article can be found online at: https://www.frontiersin.org/articles/10.3389/feart.2023.1128692/full#supplementary-material
Abbas, A., Zhu, H. T., Zeng, Z. W., and Zhou, X. H. (2018). Sedimentary facies analysis using sequence stratigraphy and seismic sedimentology in the paleogene Pinghu Formation, xihu depression, east China sea shelf basin. Mar. Petrol. Geol. 93, 287–297. doi:10.1016/j.marpetgeo.2018.03.017
Aderoju, T., and Bend, S. (2018). Reconstructing the palaeoecosystem and palaeodepositional environment within the upper devonian–lower mississippian bakken formation: A biomarker approach. Org. Geochem. 119, 91–100. doi:10.1016/j.orggeochem.2018.03.003
Anders, D. E., and Robinson, W. E. (1971). Cycloalkane constituents of the bitumen from Green River Shale. Geochim. Cosmochim. Ac. 35 (7), 661–678. doi:10.1016/0016-7037(71)90065-2
Aquino Neto, F., Restle, A., Connan, J., Albrecht, P., and Ourisson, G. (1982). Novel tricyclic terpanes (C19, C20) in sediments and petroleums. Tetrahedron Lett. 23 (19), 2027–2030. doi:10.1016/S0040-4039(00)87251-2
Atoyebi, A. O., Adekola, S. A., and Akinlua, A. (2017). Tricyclic terpane geochemistry of source rocks from Northwestern and Central Niger Delta. Petroleum Sci. Technol. 35 (22), 2094–2101. doi:10.1080/10916466.2017.1381714
Barrera, I., Nogueira, A., and Bandeira, J. (2020). The Silurian glaciation in the eastern Parnaíba Basin, Brazil: Paleoenvironment, sequence stratigraphy and insights for the evolution and paleogeography of West Gondwana. Sediment. Geol. 406, 105714. doi:10.1016/j.sedgeo.2020.105714
Bian, W. H., Hornung, J., Liu, Z. H., Wang, P. J., and Hinderer, M. (2010). Sedimentary and palaeoenvironmental evolution of the Junggar Basin, xinjiang, northwest China. Palaeobiodiversity Palaeoenvironments 90 (3), 175–186. doi:10.1007/s12549-010-0038-9
Cao, J., Bian, L. Z., Hu, K., Liu, Y. T., Wang, L. Q., Yang, S. Y., et al. (2008). Biomarker features of Jurassic mudstone source rock from different sedimentary environments in the northern Qaidam basin and its applications. Acta Geol. Sin. 82 (8), 1121–1128. (in Chinese with English abstract).
Chen, Z., Liu, G., Wei, Y., Gao, G., Ren, J., Yang, F., et al. (2017). Distribution pattern of tricyclic terpanes and its influencing factors in the Permian source rocks from Mahu Depression in the Junggar Basin. Oil gas Geol. 38, 311–322. (in Chinese with English abstract). doi:10.11743/ogg20170211
Chicarelli, M. I., Neto, F., and Albrecht, P. (1988). Occurrence of four stereoisomeric tricyclic terpane series in immature Brazilian shales. Geochim. Cosmochim. Ac. 52 (8), 1955–1959. doi:10.1016/0016-7037(88)90176-7
De Grande, S. M. B., Neto, F. R. A., and Mello, M. R. (1993). Extended tricyclic terpanes in sediments and petroleums. Org. Geochem. 20 (7), 1039–1047. doi:10.1016/0146-6380(93)90112-O
Deng, Y. H., Lan, L., Li, Y. C., Liu, S. X., Tang, W., and Chen, Y. (2019). On the control effect of deltas on the distribution of marine oil and gas fields in the South China Sea. Acta Pet. Sin. 40 (S2), 1–12. (in Chinese with English abstract). doi:10.7623/syxb2019S2001
Dutta, S., Greenwood, P. F., Brocke, R., Schaefer, R. G., and Mann, U. (2006). New insights into the relationship between Tasmanites and tricyclic terpenoids. Org. Geochem. 37 (1), 117–127. doi:10.1016/j.orggeochem.2005.08.010
Ekweozor, C., Strausz, O., Albrecht, P., Cornford, C., de Groot, K., Eglinton, G., et al. (1983). “Tricyclic terpanes in the athabasca oil sands: Their geochemistry [C]//bjorøy, speers, G,” in Advances in organic geochemistry New York (1983) 746–766.
El-Sabbagh, A. M., El-Hedeny, M. M., and Mansour, A. S. (2017). Paleoecology and paleoenvironment of the middle–upper jurassic sedimentary succession, central Saudi Arabia. Proc. Geologists' Assoc. 128, 340–359. doi:10.1016/j.pgeola.2017.02.001
Farrimond, P., Bevan, J. C., and Bishop, A. N. (1999). Tricyclic terpane maturity parameters: Response to heating by an igneous intrusion. Org. Geochem. 30 (8), 1011–1019. doi:10.1016/s0146-6380(99)00091-1
Gallegos, E., J. (1971). Identification of new steranes, terpanes, and branched paraffins in Green River shale by combined capillary gas chromatography and mass spectrometry. Anal. Chem. 43 (10), 1151–1160. doi:10.1021/ac60304a004
Gao, B. B., Xu, Y. H., and Li, K. W. (2014). Characteristics of jurassic source rocks in northern Qaidam Basin. J. Yangtze Univ. 11 (2), 21–23. (in Chinese with English abstract).
Gao, G., Titi, A., Yang, S. R., Tang, Y., Kong, Y. H., and He, W. J. (2017). Geochemistry and depositional environment of fresh lacustrine source rock: A case study from the triassic baijiantan formation shales in Junggar Basin, northwest China. Org. Geochem. 113, 75–89. doi:10.1016/j.orggeochem.2017.08.002
Govind, A. V., Behera, K., Dash, J. K., Balakrishnan, S., Bhutani, R., Managave, S., et al. (2021). Trace element and isotope Geochemistry of Neoarchean carbonate rocks from the Dharwar craton, southern India: Implications for depositional environments and mantle influence on ocean chemistry. Precambrian Res. 357, 106137. doi:10.1016/j.precamres.2021.106137
Heard, R. W., Morales-Núñez, A. G., de Lourdes Serrano-Sánchez, M., Coutiño, M. A., Barragán, R., and Vega, F. J. (2020). A new family, genus and species of Tanaidacea (Crustacea; Apseudomorpha) from the Lower Cretaceous (Aptian) of Chiapas, Mexico: Systematic revisions, including designation of two new Paleozoic families, and paleoenvironmental observations. J. S. Am. Earth Sci. 102, 102609. doi:10.1016/j.jsames.2020.102609
Jiang, Y. M., Shao, L. Y., Li, S., Zhao, H., Kang, S. L., Shen, W. C., et al. (2020). Deposition system and stratigraphy of pinghu formation in pinghu tectonic belt, xihu sag. Geoscience 34 (1), 141–153. (in Chinese with English abstract). doi:10.19657/j.geoscience.1000-8527.2020.002
Kalinowski, A. A., and Gurba, L. W. (2020). Interpretation of vitrinite reflectance–depth profiles in the northern denison trough, bowen basin, Australia. Int. J. Coal Geol. 219, 103367. doi:10.1016/j.coal.2019.103367
Kong, Q. F., Zhang, W. Z., Li, J. F., and Zan, C. L. (2019). Geochemical characteristice and Genesis of Ordovician natural gas under gypsolyte in Ordos Basin. Nat. Gas. Geosci. 30 (03), 423–432. (in Chinese with English abstract). doi:10.11764/j.issn.1672-1926.2018.12.020
Laprida, C., Chapori, N. G., Violante, R. A., and Compagnucci, R. H. (2007). Mid-Holocene evolution and paleoenvironments of the shoreface–offshore transition, north-eastern Argentina: New evidence based on benthic microfauna. Mar. Geol. 240 (1-4), 43–56. doi:10.1016/j.margeo.2007.02.001
Li, D. S. (2004). Return to petroleum geology of Ordos Basin. Petrol. explor. Dev. 31, 1–7. (in Chinese with English abstract).
Li, J., Li, J., Li, Z., Zhang, C., Cui, H., and Zhu, Z. (2018). Characteristics and genetic types of the lower Paleozoic natural gas, Ordos Basin. Mar. Petrol. Geol. 89, 106–119. doi:10.1016/j.marpetgeo.2017.06.046
Li, K., Zhou, X., Ding, F., Yuan, J., Shen, S., and Lv, P. (2019). Multi-factor control of sandboies distribution in the Pinghu Formation, Pingbei region of baochu slop, the xihu sag. Mar. Geol. Quat. Geol. 39, 115–123. (in Chinese with English abstract). doi:10.16562/j.cnki.0256-1492.2019061701
Li, Y. C., Deng, Y. H., Zhang, G. C., Fu, N., and Sun, Y. M. (2011). Tertiary marine source rocks in the northern South China Sea. Acta Pet. Sin. 32 (2), 219–225. (in Chinese with English abstract). doi:10.7623/syxb201102005
Li, Y., Fan, A., Yang, R., Sun, Y., and Lenhardt, N. (2021). Sedimentary facies control on sandstone reservoir properties: A case study from the permian Shanxi Formation in the southern Ordos basin, central China. Mar. Petrol. Geol. 129, 105083. doi:10.1016/j.marpetgeo.2021.105083
Liu, Z., Chang, X., Xu, Y., Shi, B., Zeng, Z., and Zhang, P. (2022). Depositional environment, age determination and source diagnose of oils from the Western Chepaizi Uplift (Junggar Basin) constrained by molecular biomarkers. J. Petrol. Sci. Eng. 110495, 110495. doi:10.1016/j.petrol.2022.110495
Lv, C. (2019). Geochemical characteristics and oil-source correlation of paleogene source rocks in southern Dongpu Depression. M.S. thesis. Wuhan: Yangtze University. (in Chinese with English abstract).
Ma, X. X., Yao, S. P., Zhang, B. L., Zhang, Y. X., and Peng, J. (2019). Redox conditions of paleogene paleolake and development models of high-quality source rocks in the dongpu sag, bohai bay basin. Geol. J. China Univ. 25 (6), 801–812. (in Chinese with English abstract).
Mahfouz, K. H., El-Sheikh, I., Obaidalla, N. A., and Shreif, A. (2021). New insights into stratigraphy and paleoenvironment of the upper cretaceous–eocene succession, farafra oasis, western desert, Egypt. J. Afr. Earth Sci. 175, 104096–104117. doi:10.1016/j.jafrearsci.2020.104096
Mtelela, C., Roberts, E. M., Hilbert-Wolf, H. L., Downie, R., Hendrix, M. S., Patrick, M, O., et al. (2017). Sedimentology and paleoenvironments of a new fossiliferous late Miocene-Pliocene sedimentary succession in the Rukwa Rift Basin, Tanzania. J. Afr. Earth Sci. 129, 260–281. doi:10.1016/j.jafrearsci.2017.01.010
Oskay, R. G., Bechtel, A., and Karayiğit, A. (2019). Mineralogy, petrography and organic geochemistry of Miocene coal seams in the Kınık coalfield (Soma Basin-Western Turkey): Insights into depositional environment and palaeovegetation. Int. J. Coal Geol. 210, 103205. doi:10.1016/j.coal.2019.05.012
Ourisson, G., Albrecht, P., and Rohmer, M. (1982). Predictive microbial biochemistry — From molecular fossils to procaryotic membranes. Trends biochem. Sci. 7 (7), 236–239. doi:10.1016/0968-0004(82)90028-7
Peters, K. E., Moldowan, J. M., and Sundararaman, P. (1990). Effects of hydrous pyrolysis on biomarker thermal maturity parameters: Monterey Phosphatic and Siliceous members. Org. Geochem. 15 (3), 249–265. doi:10.1016/0146-6380(90)90003-I
Philp, P., Symcox, C., Wood, M., Nguyen, T., Wang, H., and Kim, D. (2021). Possible explanations for the predominance of tricyclic terpanes over pentacyclic terpanes in oils and rock extracts. Org. Geochem. 155, 104220. doi:10.1016/j.orggeochem.2021.104220
Pichat, A., Hoareau, G., Lopez, M., Callot, J., and Ringenbach, J. (2021). Sedimentology and depositional environment of the Late Eocene marine siliciclastic to evaporite transition in the Sivas Basin (Turkey). Mar. Petrol. Geol. 131, 105151. doi:10.1016/j.marpetgeo.2021.105151
Qiu, Z. G. (1987). Metallogenetic models of sedimentary iron ore deposits. J. Chengdu Coll. Geol. 14 (04), 1–7. (in Chinese with English abstract).
Rashid, M. A. (1979). Pristane-phytane ratios in relation to source and diagenesis of ancient sediments from the Labrador Shelf. Chem. Geol. 25 (1), 109–122. doi:10.1016/0009-2541(79)90087-1
Samuel, O. J., Kildahl-Andersen, G., Nytoft, H. P., Johansen, J. E., and Jones, M. (2010). Novel tricyclic and tetracyclic terpanes in Tertiary deltaic oils: Structural identification, origin and application to petroleum correlation. Org. Geochem. 41 (12), 1326–1337. doi:10.1016/j.orggeochem.2010.10.002
Shen, Y. L., Qin, Y., Guo, Y. H., Zhao, Z. G., Yuan, X. X., Qu, Z. H., et al. (2016). Development characteristics of coal-measure source rocks divided on the basis of Milankovich coal accumulation cycle in Pinghu Formation, Xihu sag. Acta Pet. Sin. 37 (6), 706–714. (in Chinese with English abstract). doi:10.7623/syxb201606002
Shen, Y. L., Qin, Y., Li, Z. F., Jin, J., Wei, Z. H., Zheng, J., et al. (2017). The sedimentary origin and geological significance of siderite in the Longtan Formation of Western Guizhou Province. Earth Sci. Front. 24 (6), 152–161. (in Chinese with English abstract). doi:10.13745/j.esf.yx.2016-11-51
Soreghan, M. J., and Cohen, A. S. (1996). Textural and compositional variability across littoral segments of lake tanganyika: The effect of asymmetric basin structure on sedimentation in large rift lakes. AAPG Bull. 80 (3), 382–409. doi:10.1306/64ed87f0-1724-11d7-8645000102c1865d
Sun, J. P. (2017). Research on Taiyuan Formation-Shanxi Formation sedimentary facies and potential shale gas exploration. M.S. thesis. Beijing): China University of Geosciences. (in Chinese with English abstract).
Sun, Y. Z. (2006). Sedimentary system and oil and gas source characteristics of Shahejie Formation in Shengtuo area, Dongying Sag. J. China Univ. Petroleum 30 (6), 24–30. (in Chinese with English abstract).
Tao, S., Wang, C., Du, J., Liu, L., and Chen, Z. (2015). Geochemical application of tricyclic and tetracyclic terpanes biomarkers in crude oils of NW China. Mar. Petrol. Geol. 67, 460–467. doi:10.1016/j.marpetgeo.2015.05.030
Tissot, B. P., and Welte, D. H. (1978). Petroleum Formation and occurrence. 2nd ed. Berlin: Springer-Verlag, 1–699.
Wang, A., Wang, Z., Li, L., Fan, C., Zhang, K., Xiang, B., et al. (2019). Hydrocarbon migration in the multiple-sourced petroleum system in the northwestern Junggar Basin (northwestern China): Constraint from geochemical and phase fractionation analysis. AAPG Bull. 103 (9), 2247–2284. doi:10.1306/01211916512
Wang, C. Y., Chen, M. J., Wang, Z. C., and Guo, Y. H. (2007). Sedimentarv facies of the Shanxi Formation and member 8 of xiashihezi formation of permian in southern Ordos Basin. J. Palaeogeogr. 9 (04), 369–378. (in Chinese with English abstract).
Wang, Y. C., Cao, J., Tao, K. Y., Li, E., Ma, C., and Shi, C. H. (2020). Reevaluating the source and accumulation of tight oil in the middle permian lucaogou formation of the Junggar Basin, China. Mar. Petrol. Geol. 117, 104384. doi:10.1016/j.marpetgeo.2020.104384
Wendorff-Belon, M., Rospondek, M., and Marynowski, L. (2021). Early oligocene environment of the central paratethys revealed by biomarkers and pyrite framboids from the tarcău and vrancea nappes (eastern outer carpathians, Romania). Mar. Petrol. Geol. 128, 105037. doi:10.1016/j.marpetgeo.2021.105037
Xiao, H., Li, M. J., Liu, J. G., Mao, F. J., Cheng, D. S., and Yang, Z. (2019a). Oil-oil and oil-source rock correlations in the Muglad Basin, Sudan and South Sudan: New insights from molecular markers analyses. Mar. Petrol. Geol. 103, 351–365. doi:10.1016/j.marpetgeo.2019.03.004
Xiao, H., Li, M. J., Yang, Z., and Zhu, Z. L. (2019b). Distribution and geochemical significance of C19∼C23 tricyclic terpanes in source rocks and crude oils from different environments. Geochimica 48 (2), 161–170. (in Chinese with English abstract).
Xu, Q. H., Shi, W. Z., Xie, X. Y., Busbeyet, A., Xu, L. T., Wu, R., et al. (2018). Inversion and propagation of the late paleozoic porjianghaizi fault (north Ordos Basin, China): Controls on sedimentation and gas accumulations. Mar. Petrol. Geol. 91, 706–722. doi:10.1016/j.marpetgeo.2018.02.003
Yang, H., Fu, J. H., Liu, X. S., and Meng, P. L. (2012). Accumulation conditions and exploration and development of tight gas in the Upper Paleozoic of the Ordos Basin. Petrol. explor. Dev. 39 (3), 315–324. doi:10.1016/S1876-3804(12)60047-0
Yang, T. (2007). Restudy of Cordaites baodeensis Sun from lower permian Shanxi Formation of baode, Shanxi. M.S. thesis. Changchun: Jilin University. (in Chinese with English abstract).
Yu, S., Wang, X. L., Xiang, B. L., Ren, J. L., Li, E. T., Wang, J., et al. (2017). Molecular and carbon isotopic geochemistry of crude oils and extracts from Permian source rocks in the northwestern and central Junggar Basin, China. Org. Geochem. 113, 27–42. doi:10.1016/j.orggeochem.2017.07.013
Zhang, S., Zhang, B., Bian, L., Jin, Z., Wang, D., and Chen, J. (2007). Xiamaling Formation oil shale: Accumulated by red algae more than 800 million years ago. Sci. China Ser. D Earth Sci. 37, 636–643. (in Chinese). doi:10.1360/zd2007-37-5-636
Zhang, W. Z., Yang, H., Hou, L. H., and Liu, F. (2009). Distribution and geological significance of 17α(H)-diahopanes from different hydrocarbon source rocks of Yanchang Formation in Ordos Basin. Sci. China Ser. D-Earth Sci. 52 (7), 965–974. (in Chinese with English abstract). doi:10.1007/s11430-009-0076-1
Zhang, X., Lin, C., Zahid, M. A., Jia, X., and Zhang, T. (2017). Paleosalinity and water body type of Eocene Pinghu Formation, xihu depression, east China Sea Basin. J. Petrol. Sci. Eng. 158, 469–478. doi:10.1016/j.petrol.2017.08.074
Zhao, L., Chen, J., Zhang, Y., Cheng, X., and Sha, X. (2008). Sedimentary characteristics of Pinghu Formation in pinghu structural belt of xihu depression, east China sea. Glob. Geol. 27, 42–47. (in Chinese with English abstract).
Zhu, G. Y., and Jin, Q. (2003). Geological and geochemical characteristics of two sets of high quality source rocks in Dongying Sag. Acta sedimentol. Sin. 21 (3), 506–512. (in Chinese with English abstract).
Zodrow, E. L., Mastalerz, M., Orem, W. H., S̆imůnek, Z., and Bashforth, A. R. (2000). Functional groups and elemental analyses of cuticular morphotypes of Cordaites principalis (germar) geinitz, carboniferous maritimes basin, Canada. Int. J. Coal Geol. 45 (1), 1–19. doi:10.1016/S0166-5162(00)00018-5
Keywords: tricyclic terpanes, depositional environment, biomarker, East China Sea Basin, environmental identification
Citation: Wang A, Li C, Li L, Pu R, Yang Z, Zhu N and Guo K (2023) C20-C21-C23 tricyclic terpanes abundance patterns: Origin and application to depositional environment identification. Front. Earth Sci. 11:1128692. doi: 10.3389/feart.2023.1128692
Received: 21 December 2022; Accepted: 09 January 2023;
Published: 19 January 2023.
Edited by:
Jiyuan Yin, Chinese Academy of Geological Sciences (CAGS), ChinaReviewed by:
Feng Guo, Xi’an Shiyou University, ChinaCopyright © 2023 Wang, Li, Li, Pu, Yang, Zhu and Guo. This is an open-access article distributed under the terms of the Creative Commons Attribution License (CC BY). The use, distribution or reproduction in other forums is permitted, provided the original author(s) and the copyright owner(s) are credited and that the original publication in this journal is cited, in accordance with accepted academic practice. No use, distribution or reproduction is permitted which does not comply with these terms.
*Correspondence: Aiguo Wang, d2FnQG53dS5lZHUuY24=
Disclaimer: All claims expressed in this article are solely those of the authors and do not necessarily represent those of their affiliated organizations, or those of the publisher, the editors and the reviewers. Any product that may be evaluated in this article or claim that may be made by its manufacturer is not guaranteed or endorsed by the publisher.
Research integrity at Frontiers

Learn more about the work of our research integrity team to safeguard the quality of each article we publish.