 Lv Guilin
 Lu Mingxing2*
95% of researchers rate our articles as excellent or good
Learn more about the work of our research integrity team to safeguard the quality of each article we publish.
Find out more
ORIGINAL RESEARCH article
Front. Earth Sci. , 04 April 2023
Sec. Geohazards and Georisks
Volume 11 - 2023 | https://doi.org/10.3389/feart.2023.1127862
This article is part of the Research Topic Mine Engineering Geological Disaster Forecasting, Monitoring, and Prevention – Volume II View all 7 articles
After the mining subsidence area reaches the stable state of surface movement, due to the continuous existence of the mutual extrusion and activation state between rock strata, the movement of particles, rock creep, and soil compression will affect the surface movement in the long-term stability, thereby threatening the safety and stability of the above ground buildings. In order to study the deformation law of rock strata movement and surface displacement after the mining subsidence area is stabilized, establish a ground deformation model caused by mining, explore the characteristics of ground movement and deformation under the action of building loads, design a similar material simulation experiment, record the ground movement changes within 378 days after the mining is completed, after the settlement is stabilized, apply equivalent loads of 10–30 floors to the model at different locations, and study various surface deformation data, Analyze the change rule. In order to quantitatively analyze the impact of residual deformation of goaf on buildings under building load, the D5 gate area of Tangshan World Horticultural Exposition in mining subsidence area is taken as an example to calculate the ground settlement value and other deformation data using probability analysis method, and the Kelvin model in rock mechanics is introduced in terms of the duration of residual deformation. The calculation results are close to the actual measured values, and the impact of residual deformation on the proposed building is analyzed.
Under the background of ecological civilization construction, the control and utilization of coal mining subsidence area is an important measure to build ecological civilization and solve the shortage of land resources in coal mining areas (Li, 2019), eveloping coal mining subsidence area into engineering construction land is an effective way to alleviate the progress of land resources (Guo et al., 2022). Under the influence of external factors, the relative balance and stability of the rock mass system after the mining subsidence area has been stabilized may continue to change and be broken, and the residual deformation will cause deformation and damage to the buildings in the mining subsidence area, increasing investment costs and implementation difficulties (Zhuang and Qu, 2022). Therefore, it is of great theoretical significance and practical value to understand and master the occurrence law of ground dynamic settlement under external factors, especially the influence of building load on ground settlement, and to study the building utilization of mining subsidence areas (Li et al., 2022).
The method of monitoring surface displacement is usually used for the construction safety of goaf, as shown by Zhuang and Qu (2022). Andreas et al. (2023) used MIMO-SAR sensors to provide accuracy and economy in structural displacement monitoring; Zhang et al. (2023) proposed the Time-Series InSAR and Hurst Index method to provide a new idea for ground deformation monitoring; Ju et al. (2023) adopted the TDT method to better eliminate the temperature delay effect; Ren et al. (2023) proposed that the distributed optical fiber monitoring technology of Brillouin optical frequency domain analysis (BOFDA) has specific advantages in monitoring the excavation deformation of ultra-deep underground space; Ju et al. (2023) adopted the TDT method to better eliminate the temperature delay effect. Some studies also provide methods to improve monitoring accuracy, such as the constrained total least squares (CTLS) method(Zhou et al., 2021), a novel robust AE/MS source location method (Rui et al., 2022a), a novel acoustic emission(AE) source localization method (Rui et al., 2022b). However, the above methods cannot theoretically evaluate the safety of aboveground buildings from the deformation law inside the goaf and guide the safety evaluation of buildings.
It is widely recognized that the probability integral method is used to calculate the ground deformation of goaf, Agnieszka et al. (2020) put forward an improved probability integral method, which can predict the ground deformation caused by the mining of various underground ore bodies; By using probability integral method, Xu et al. (2023) summarized the judgment formula of pipeline damage under composite stress, and carried out safety evaluation on surface pipeline; Li et al. (2021) analyzed the influence of residual deformation of goaf on Sangzhang tunnel by using probability integral method; Wang and Huang (2022) introduced creep damage theory to simulate the space-time change of rock materials, proposed a new criterion based on energy stability to identify the delayed failure of structures, and obtained the time-varying reliability of underground structures by applying PDEM with absorbing boundary conditions.
Liu et al. (2023) focuses on the self-stability of the coal pillar in the old goaf, study on the self-stability of coal pillar in old goaf by using geological borehole electrical survey and borehole peeping technology; Xu et al. (2023) used FLAC (3D) to conduct numerical simulation to evaluate the stability of the goaf; He et al. (2022) used the evaluation method based on fuzzy theory to evaluate the stability of goaf; He et al. (2022) analyzed the evolution of goaf shape by numerical simulation method. Bai et al. (2022) studied the residual deformation characteristics and formation mechanism of the surface above the goaf.
At the same time, we should also strengthen the monitoring of the ground in the goaf. Paulina et al. (2019) used DInSAR technology to monitor the mining subsidence of a mining area in Chile, and achieved good results in the complex terrain area.
In addition, the research on the deformation theory of the overlying strata should also be strengthened. Guo et al. (2022) used theoretical analysis methods to analyze the structural characteristics of mining overburden and the distribution characteristics of additional stress in the rock mass caused by surface load, and established a “mechanical model of mining overburden structure under load”. Zhang et al. (2023) inverted the deformation time series of the study area by using the short baseline set technology (SBAS), and successfully proved the spatial distribution of coal mining subsidence. Cai Yinfei and Verdel Thierry et al. (2020) developed a fast calculation tool for damage assessment of large buildings in mining subsidence area. Meanwhile, because of the complexity of rock movement in goaf, using the method of similar material simulation experiment to study the influence of external factors such as the law of rock movement in goaf and building load on ground deformation can achieve good results. Zhang Guojian et al. (2022) proposed the simulation experiment of superimposed similar materials to study the motion mechanism of high-stand and giant-thickness weak cementation sandstone, and its motion law is observed by the new method of single-binocular close-range photogrammetry; The research of Zhang et al. (2016) shows that the similar material simulation experiment based on the brittle material thin plate can better reflect the dynamic rock strata movement characteristics of the combined open pit and underground mining.
At present, there are few studies on the variation law of residual deformation of goaf and the influence of the ground deformation of goaf under the influence of the above-ground building load. This paper uses the similar material experiment to study the variation law of residual deformation of a mining area in Tangshan, simulates the variation law of the ground after the building load above the goaf, and then uses the probability integral method to calculate the residual deformation of the ground and its influence on the ground buildings. By comparing the experimental and calculated values with the monitoring data, the spatiotemporal variation of residual deformation in the goaf collapse area under the influence of external factors and its impact mechanism on surface buildings are analyzed, and the residual deformation prediction model is established.
Residual deformation in mining subsidence area is a term of rock mechanics (Hu et al., 2008), which refers to that the mining subsidence area has reached a stable state of surface movement (the surface subsidence does not exceed 0.167 mm every day, that is, the delayed movement deformation generated after the cumulative subsidence does not exceed 30 mm for six consecutive months). The existence of residual deformation is related to the existence and composition of particles of materials involved in deformation, the creep process of rock and the compression of soil mass. After the mining subsidence area reaches the stable condition, the rock strata movement mainly exists the process of mutual extrusion and activation between the rock strata and re stabilization, which is relatively long, corresponding to the test of Wang et al. (2020); Zhang et al. (2022). Therefore, in the process of studying residual deformation, the particle movement, rock creep and soil compression between materials in rock strata movement will affect the surface movement in a long time of stability. The residual deformation of the mining subsidence area is mainly related to the properties of the particles of the rock stratum materials involved (He, 2017). The main reason is that the movement between the blocks and particles in the land and rock mass will continue due to the existence of the blocks and particles. In the process of mutual compaction between these particles, the slow change of the surface of the mining subsidence area will be caused, or the compaction process between particles will be further intensified under the influence of water or other factors. Creep of rock refers to the phenomenon that the compression deformation of rock increases with time under the condition of keeping the stress constant or increasing little. With the increase of time, rock creep can produce considerable deformation when the stress is constant or changes little. The influence of rock creep on residual deformation is the whole process, and the influence on residual deformation is linear. The compression of soil mass is in the mining subsidence area. Due to the movement of the lower layer of rock, the three phases in the soil mass are in equilibrium, causing a desire to destroy and re balance. This re balancing process is the process of soil compression, which takes a long time and deforms slowly. If the soil thickness is relatively uniform, the influence on the residual deformation of the mining subsidence area is basically linear (Lu, 2015; 2019).
When the mining subsidence area is in the stable state of surface movement, the rock displacement speed slows down, but from the internal structure of the rock movement will continue for a long time (Teng and Yan, 1999; Teng and Zhang, 2003). Although the strata in the caving zone and fault zone have been compacted for many years(), their compressive and shear strength are significantly lower than that of the original rock due to certain cracks and separations, as shown in Figure 1, The rock strata will further cause movement under the excitation. The spatial variation under the influence of residual deformation in mining subsidence area is manifested in two aspects (Ding and Lu, 2017). One is the change of strata in vertical plane caused by the activity of caving zone, fault zone and bending zone caused by the reactivation of goaf strata caused by residual deformation. The other is the range of surface movement in horizontal plane caused by residual deformation. The changes in the vertical plane have a great influence on the evaluation of the foundation stability of buildings, and the different moving ranges in the horizontal direction of the surface have a reference value for the site selection of buildings. Therefore, it is necessary to treat the two separately. In terms of time, when only the final results are studied, the moving vector of any point on the surface points to the center of the goaf from the relative position of its starting and ending points. In mining subsidence area, further movement of overlying strata and surface caused by human factors or natural factors will continue to produce surface continuous movement and deformation.
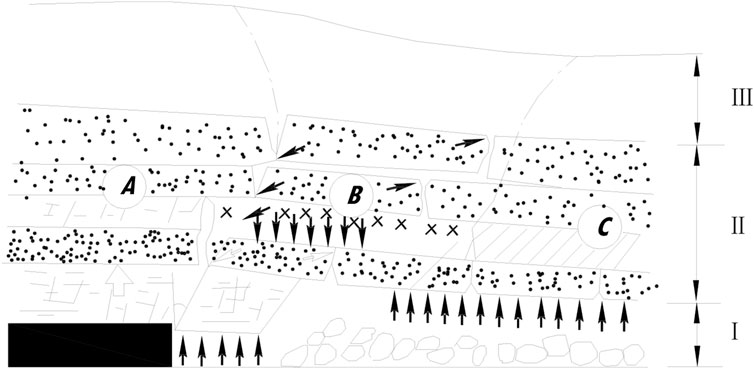
FIGURE 1. Failure characteristics of overburden rock. (A) Coal wall support affected zone. (B) Separation zone. (C) Recompaction zone I—Collapse zone. II—Fault zone. III -bending band.
The magnitude and spatial distribution of strata movement and surface displacement in mining subsidence area are closely related to the nature of overburden, mining design, mining technology and so on. They will more or less break the original stress balance state, so that the relatively stable mining subsidence area will produce the “activation” phenomenon, and the mining subsidence area will produce residual deformation. According to the principle of mining subsidence and the dynamic movement analysis of mining overburden, the influencing factors of residual movement and deformation are obtained, which mainly concentrate on four blocks: geological and topographical conditions of overburden, mining technology and method, time and other external factors Wang at al. (2015). The geological and topographical conditions of overlying strata mainly include the nature, geological structure, stratigraphic structure, hydrogeological conditions and topography of overlying strata. Mining technology mainly includes mining method and roof management method, mining depth, mining thickness, goaf size and shape, strata dip angle, repeated mining times, etc. Time factor is mainly the length of mining time. Other external factors mainly include building load, weathering, coal pillar spontaneous combustion, earthquake and other factors. Among these influencing factors, geological structure and mining technology have a great influence on the early stage of rock strata movement, so they are basically unchanged after the goaf is stable. However, these factors will still change under the influence of other factors, such as the creep of rock under the influence of temperature and humidity will reduce the strength of rock and accelerate creep. Particles in the rock strata will move relative when the groundwater and the upper (building load) or lower (adjacent coal seam mining, supporting coal pillar failure) force changes (Tan and Deng, 2006; Tan and Deng, 2007). Therefore, the external factors in the study of influencing factors of residual deformation need to be considered (Wang and Deng, 2015). New buildings on or near the goaf will directly affect the goaf that has been settled and balanced (Lian et al., 2016), and the critical mining depth causing rock mass “activation” is at least the sum of the maximum disturbance depth of the foundation under the building load and the maximum height of the falling fault zone, that is,
Although the residual deformation in the mining subsidence area can explain the existence mechanism from the micro and macro aspects, and the existence and influence of residual deformation can also be explained by various influencing factors. In order to verify the law of strata movement in the goaf, the existence mechanism of residual deformation and the deformation characteristics under the load of buildings, it is necessary to carry out similar material tests to reveal. See Figure 2 for a specific Flowchart of the study.
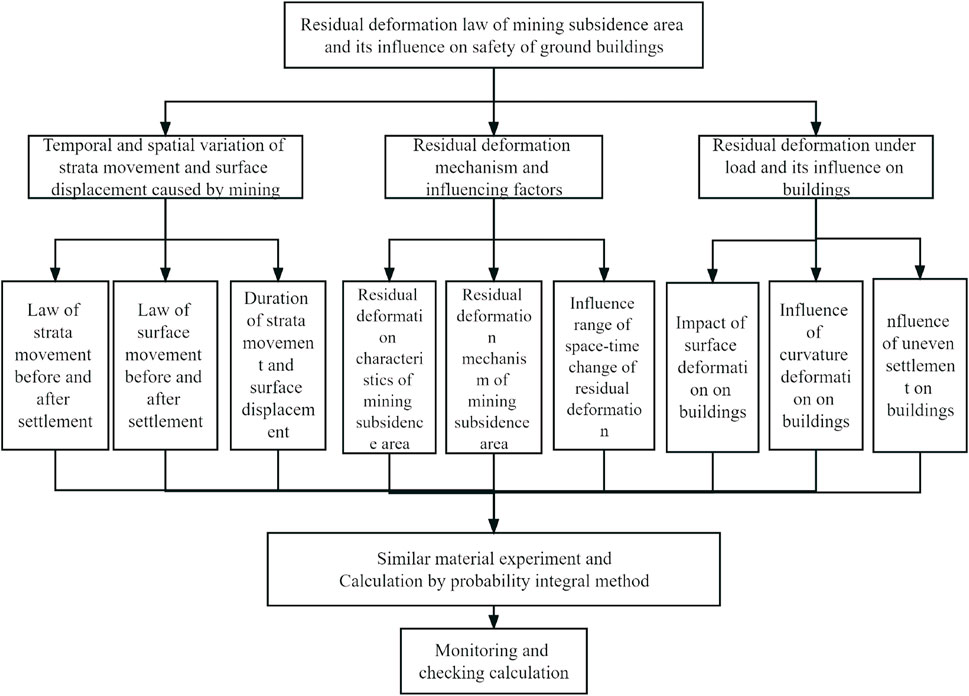
FIGURE 2. Flowchart of the study.
The project area is located in the area of Kailuan Tangshan mine field, close to the west side of the mine field boundary. Tangshan mine has carried out mining activities in the east and southeast of the area. The proposed area has been affected by mining subsidence, which provides a reliable basis for the planning and design of the area to grasp the scope of the area affected by mining subsidence and whether it can be developed and constructed. The influence of residual deformation in this area needs to be analyzed.
In order to further explore the spatial relationship between the residual deformation in the mining subsidence area and the external influencing factors, a similar material simulation experiment was carried out for the mined-out area of a mining area in Tangshan. The area is located in the south of the central area of Tangshan, at the intersection of Huanhu Road and Tangxu Road. It is proposed to build the D5 door of Tangshan World Horticultural Exposition here to analyze the impact of the residual deformation on the buildings in this area.
1) Basic model size
This experiment simulates the mining depth (H) 200 m, mining thickness (M) 5.00 m, and adopts the plane similar material simulation platform of 3000 mm × 2000 mm.
2) Selection of Similar Constants
The test geometric similarity constant is
3) Selection of similar materials
In the experiment, quartz sand was selected as aggregate, lime and gypsum as cementing materials, and borax was selected as retarder. The concentration of borax in water was 1.0%.
4) Proportion of similar materials
According to the experimental results of similar material formula made by Liaoning University of Technology, the formula and proportion of similar materials were selected. The mechanical parameters and thickness values of each rock layer and coal seam are shown in Table 1.
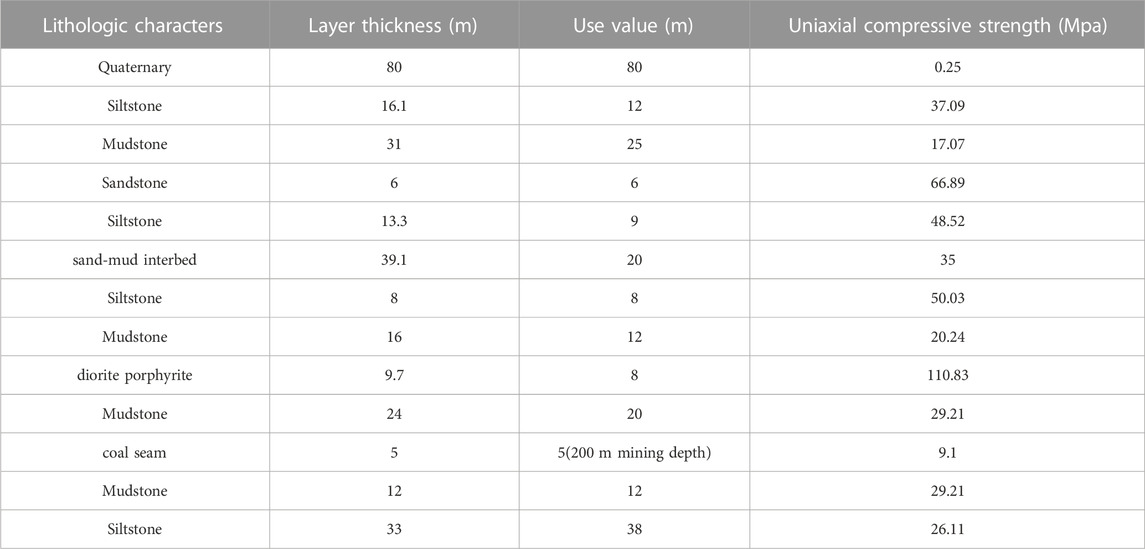
TABLE 1. Thickness and strength indexes of rock (coal) layers.
1) Model construction
The model displacement measuring points are arranged as follows: The displacement measuring points are arranged in the roof strata. The model arranged 11 horizontal lines and 29 vertical lines, a total of 319 measuring points. The position of the displacement measuring point is shown in Figure 3:
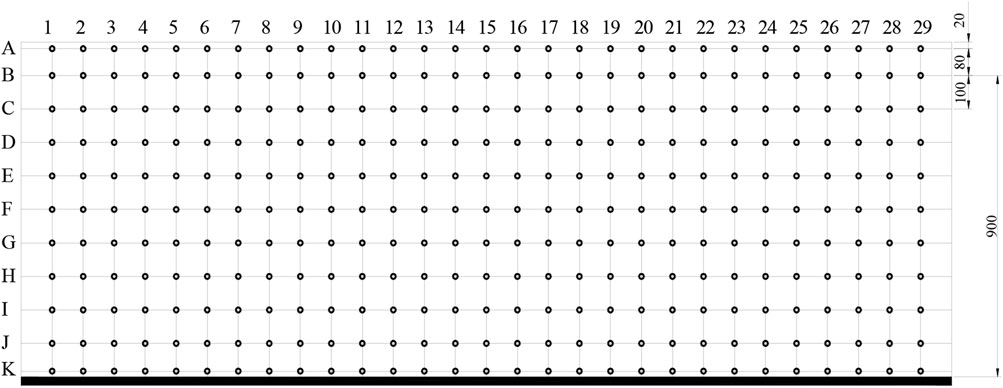
FIGURE 3. Layout of displacement measuring points.
The location of goaf and the location of earth pressure box are shown in Figure 4. In the mining process, two 25 mm coal pillars are set.
2) Excavation and monitoring methods
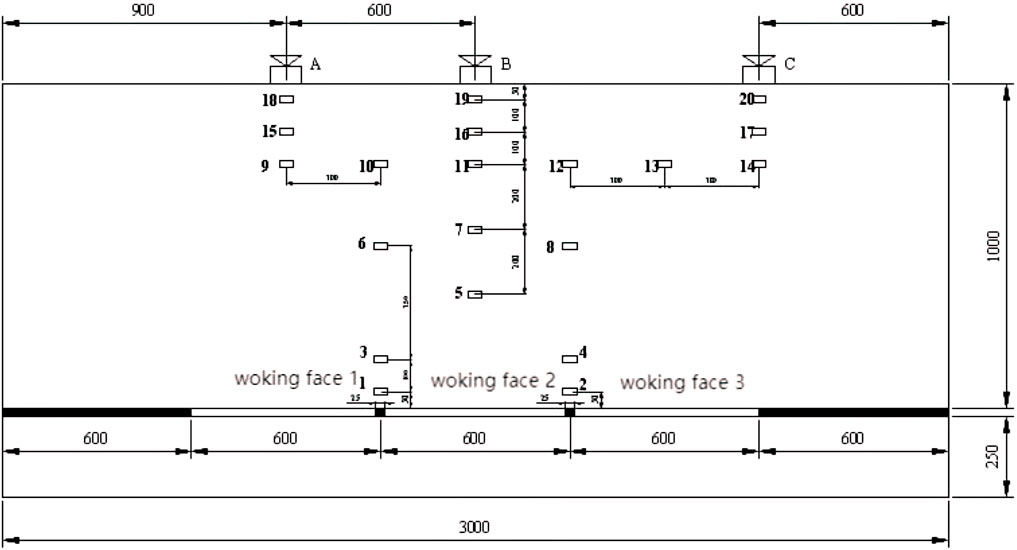
FIGURE 4. Location of earth pressure box (unit mm).
Excavation using a mined-out way, first mining the left side of the working face, in turn to the right excavation, each working face excavation from 8 to 12, a daily excavation of a working face, mining process as shown in Figure 5.
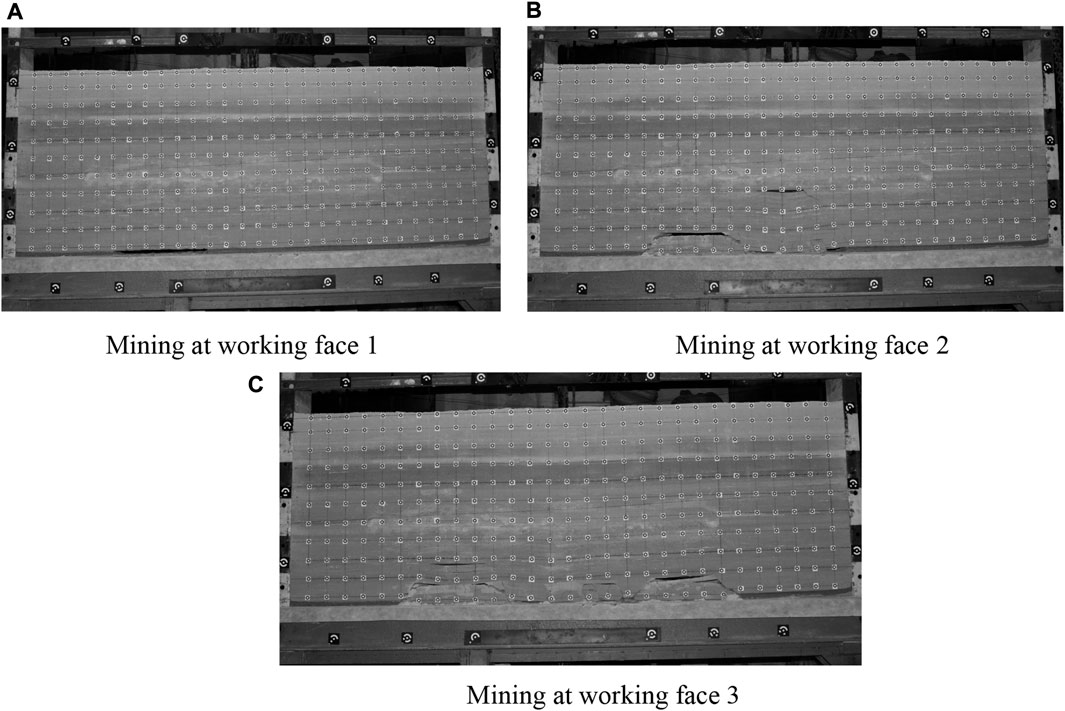
FIGURE 5. Photos of the mining process. (A) Mining at working face 1 (B) Mining at working face 2 (C) Mining at working face 3.
Measured once a day after excavation, continuous measurement for 36–48 days. In the process of measuring and recording the surface displacement, the maximum surface subsidence of 12 days interval reached 0.15 mm as the stable subsidence standard (equivalent to the actual situation of 6 months subsidence 30 mm).
Figure 6 shows the dynamic change curve of surface subsidence with the mining of working face.After mining the left and middle working face, the surface subsidence is very small, and there is no obvious subsidence basin. After the working face on the right side is mined, the coal seam mining gradually affects the surface, and the surface subsidence presents an approximate symmetrical distribution, beginning to show the shape of the subsidence basin (as shown in Figure 6). With the passage of time, the subsidence basin area expands, the maximum subsidence value increases (Zhang, 2014), and the surface movement is basically stable after half a year of mining (as shown in Figure 7).
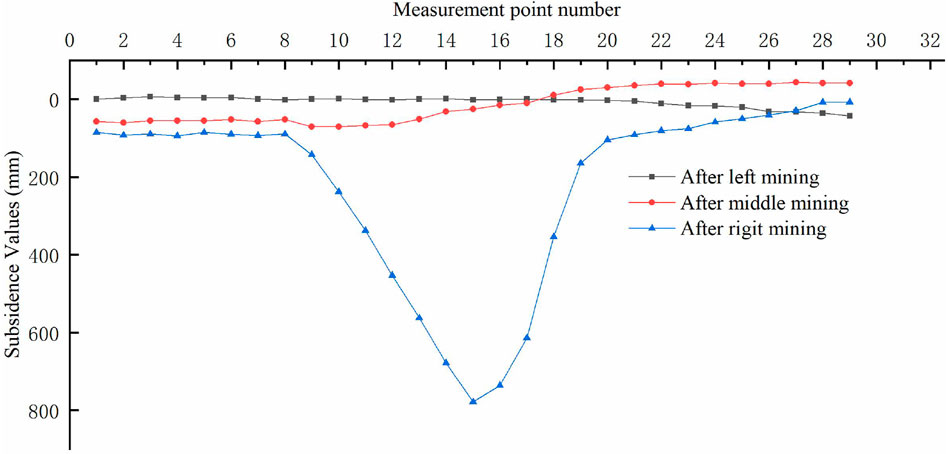
FIGURE 6. Surface subsidence curve during mining.

FIGURE 7. Dynamic curve of surface subsidence.
During the advancing process of the working face, the movement and deformation of the ground surface are called dynamic movement and deformation. When the working face is advanced to a certain distance, the surface begins to deform. The advancing distance is generally related to the depth and thickness of the coal seam mining and the physical and mechanical properties of the overlying strata.
In the test, all working faces are fully mined at one time, and the time interval between the three working faces is very short. The dynamic surface subsidence process is relatively short and the response is not obvious.
Through the experimental data, it can be found that the surface deformation is almost unaffected at the beginning of mining. With the development of mining, the coal seam mining subsidence gradually spreads to the surface, and the surface deformation shows irregular subsidence, which is mainly concentrated above the mining position. At this time, the collapse zone has not been formed. With the continuous development of mining, the collapse zone is formed and large scale collapse occurs, which is distributed symmetrically, and is in the shape of a “funnel” with low middle and slightly raised deformation edge. At this time, the surface deformation is intense. After the mining is completed, the collapse subsidence area gradually expands, and the maximum subsidence value increases. When the mining is completed for about half a year, the surface movement is basically stable, and the collapse zone grows slowly, entering the stable period. The above is the ground deformation model caused by mining.
After a period of mining, the overlying strata are basically stable. At this time, the model is loaded. The loading width of this experiment is 100 mm, and there are three loading positions, namely, the surface above the central goaf (position B), the surface above the cutting hole (position A) and the surface above the stop line (position C). Changes of earth pressure and surface subsidence were recorded during loading. See Table 2 for loading position and load.
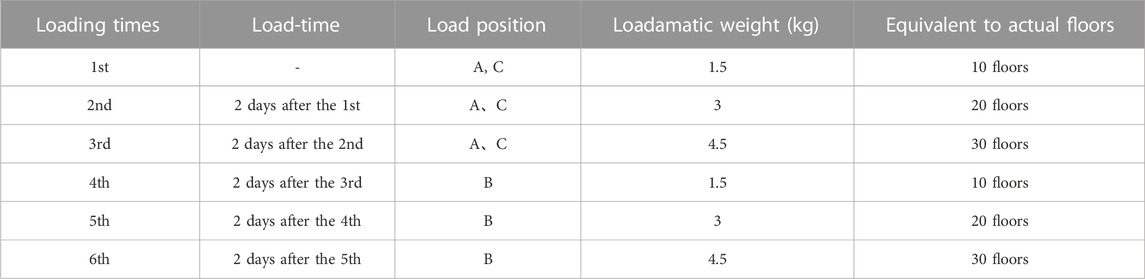
TABLE 2. Loading scheme.
It can be seen from the figure that with the increase of load, the surface subsidence value gradually increases, and the increase of surface subsidence value is not obvious at the first loading, and the surface subsidence value increases significantly after the second loading. From the perspective of relative position relationship, under the influence of load, the surface subsidence at the boundary of the goaf is small (loading point C), the surface subsidence value at the center of the subsidence basin is the smallest (loading point B), and the subsidence value inside the goaf is the largest (loading point A). The maximum surface subsidence caused by the load is 557 mm. In addition, with the increase of depth, the subsidence value caused by surface load gradually decreases. When the depth is 60 m, the added value of foundation subsidence is 173.6 mm. When the depth is 140 m, the influence of load on foundation subsidence is not obvious, as shown in Figures 8–10.
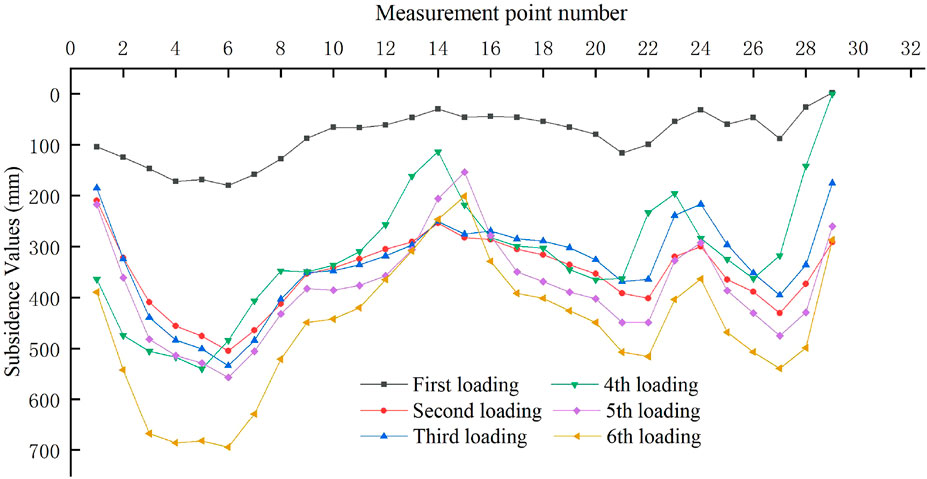
FIGURE 8. Surface subsidence curve after loading.
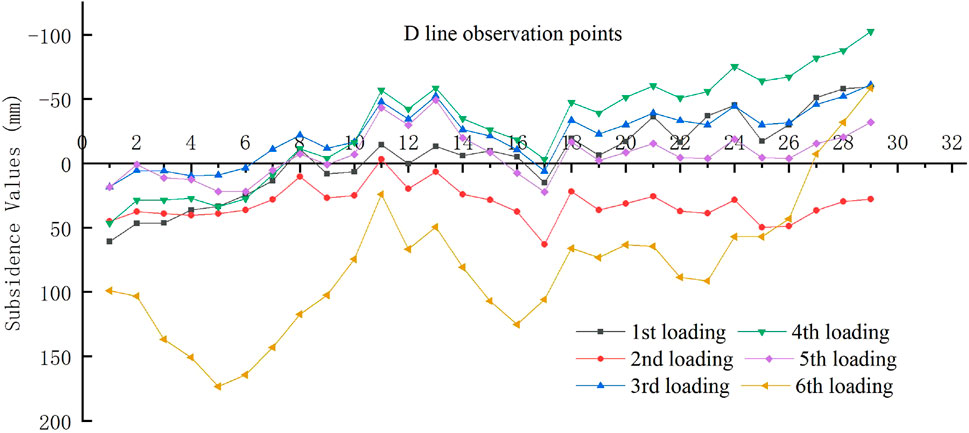
FIGURE 9. Curve of D line measuring point subsidence after loading.

FIGURE 10. The change curve of subsidence value of measuring point in line H after loading.
As the load continues to load, the surface tilt value increases, and it is added to 4.5 kg at both A and C positions. The maximum negative tilt value of A position is-8.04 mm/m, and the maximum positive tilt value is 6.97 mm/m. According to the Specification for coal pillar setting and mining of buildings, water bodies, railways and main roadways’, the building damage level is within grade III.
After the third loading of 1.5 kg on point B for 2 days, the loading continued to 4.5 kg, and the value of the approximate antisymmetric curve centered on the loading point B continued to increase, that is, the tilt deformation increased. Maximum negative tilt value—10.62 mm/m, maximum positive tilt value 7.63 mm/m. Compared with the previous two loadings, the increase of surface tilt is more obvious, indicating that the uneven settlement increases significantly. According to the “Specification for coal pillar setting and mining of buildings, water bodies, railways and main roadways”, the building damage level is above grade IV.
In summary, with the increase of load, the damage level of buildings gradually increases. When the building load increases to 30 floors, the surface buildings will reach more than grade IV damage. At this time, foundation treatment and anti-deformation design of buildings are indispensable.
Figure 11 shows the curvature deformation curve of the ground surface after loading of the model simulation buildings. In order to present the law of influence of loading on surface deformation, each point of Line A before loading is taken as the reference point.
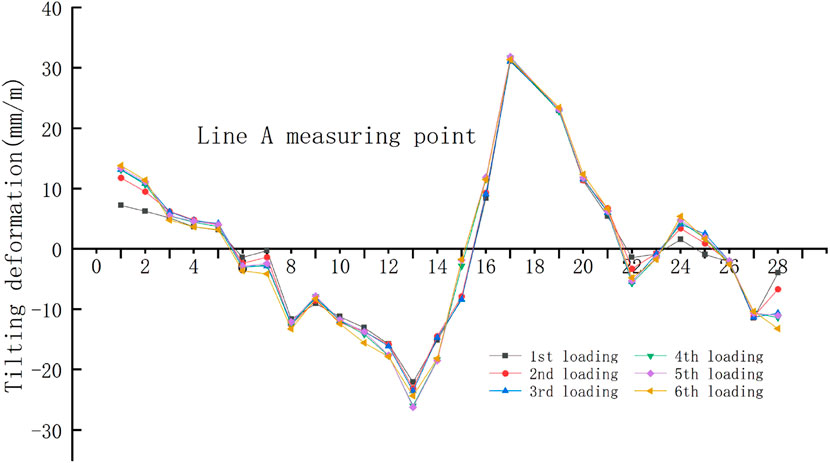
FIGURE 11. Surface curvature deformation change curve after loading.
The curvature deformation increases during loading, and points A and C form an approximate symmetrical curve centered on the loading point. After loading to 4.5 kg, the maximum value of positive curvature deformation on the surface is 0.26 × 10⁻³/m, maximum negative curvature is −0.30 × 10⁻³/m.
After point B is loaded, the approximate symmetrical curve centered on B, after loading to 4.5 kg, the maximum value of positive curvature deformation at point B is 0.43 × 10⁻³/m, the maximum value of negative curvature deformation is −0.16 × 10⁻³/m。
From the test results, the curvature deformation caused by load has little impact on the surface buildings, and the damage of buildings is within Grade I.
Figure 12 shows the horizontal surface deformation curve after model loading. After loading 1.5 kg at position A and C, the ground directly below the loading position has a certain horizontal compression deformation, and the two sides of the loading position have a certain horizontal tensile deformation. With the loading of 3 kg and 4.5 kg, the horizontal deformation value gradually increases, the maximum horizontal compression deformation value of the ground surface reaches −2.11 mm/m, and the maximum horizontal tensile deformation value reaches 1.81 mm/m.
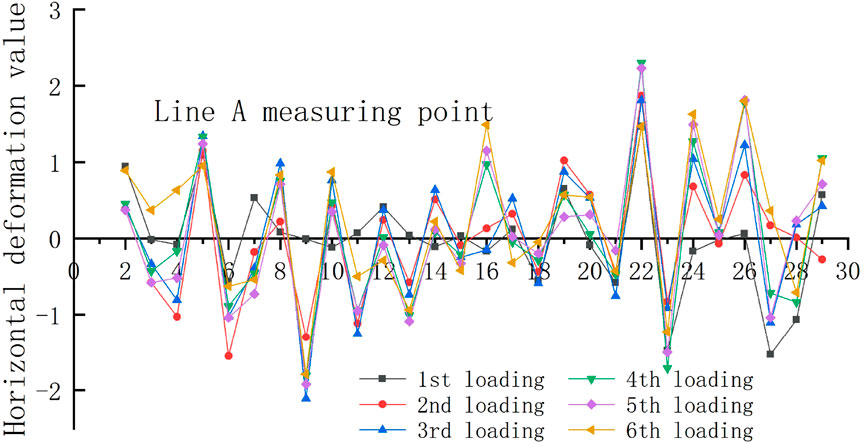
FIGURE 12. Surface relative horizontal deformation curve after loading.
After loading 1.5 kg at position B in the center of the goaf, the ground surface directly below the loading position has a certain horizontal compression deformation, and the two sides of the loading position have a certain horizontal tensile deformation. With the loading of 3 kg and 4.5 kg, the horizontal deformation value gradually increases, the maximum horizontal compression deformation value at position B reaches −0.94 mm/m, and the maximum horizontal tensile deformation value reaches 1.49 mm/m.
In addition, regardless of horizontal tensile deformation and horizontal compression deformation, position B in the center of the goaf is much smaller than positions A and C at the edge of the goaf. This shows that in the center of the goaf, the surface subsidence is relatively sufficient, so the horizontal deformation of the surface caused by loading is relatively small.After loading, the maximum horizontal compression deformation of the ground surface reaches −1.71 mm/m, and the maximum horizontal tensile deformation reaches 2.3 mm/m.
The similar simulation material test of ground deformation under building load shows that the subsidence value caused by ground load decreases gradually with the increase of depth; The change of surface tilt increases more obviously, indicating that the uneven settlement increases significantly. When the damage level of the building is above Grade IV, foundation treatment and anti deformation design of the building are essential, as shown by the test of Guo et al. (2022), Li et al. (2022) and Teng et al. (2016); Curvature deformation caused by load has little influence on surface buildings; Regardless of horizontal tension deformation and horizontal compression deformation, the surface subsidence is relatively sufficient in the center of the goaf, so the horizontal surface deformation caused by loading is relatively small.
Under the influence of residual deformation in mining subsidence area, the initial equilibrium state between buildings (structures) and foundation is destroyed due to the movement and deformation of the surface. The establishment of a new force system balance will cause additional stress in buildings (structures), which will lead to deformation of buildings (structures) and will be damaged in serious cases. Because the stiffness of the building is greater than that of the foundation, the movement and deformation of the building and the surface movement and deformation are not coordinated. The foundation movement and deformation are greater than the movement and deformation of the foundation, which causes the foundation to unload, and the unloading area appears. The unloading area mainly appears on the side of the building close to the surface where the subsidence value is large. As the building is unloaded on one side, the stress is transferred to the other side, which increases the stress on the side of the building with small subsidence, The loading area appears. In the unloading area, due to the reduction of the stress acting on the foundation, the foundation part rebounds. As a result, the settlement of buildings in the unloading area is smaller than that of the foundation. On the contrary, in the loading area, due to the increase of stress acting on the foundation, the foundation will be compressed and deformed. As a result, the settlement of buildings in the loading area is larger than that of the foundation. With the underground mining, this loading and unloading process is constantly repeated, making the building foundation, foundation and superstructure in constant interaction, When the movement deformation on the building is greater than the limit deformation, the building is damaged.
Because the probability integral method is widely used in the prediction of coal mining subsidence, at present, the probability integral method is mostly used in the residual prediction of mining subsidence area in China, and only the parameters are changed.
According to the analysis of the measured surface movement data, the surface subsidence value within six consecutive months does not exceed 30 mm, which can be considered that the surface movement caused by mining is over and the surface is relatively stable. The length of the surface movement period is mainly related to the mining depth of coal seams and other factors. It is calculated according to the calculation formula of the surface movement period recommended in the Code for Building, Water, Railway and Main Shaft and Roadway Coal Pillar Setting and Coal Pressure Mining.
The residual movement and deformation of the surface in the mining subsidence area refers to the movement and deformation of the surface that continue to occur with time after the end of the surface movement period. According to the research results of mining subsidence, it can be considered that the residual surface movement and deformation in the mining subsidence area is the continuation of the conventional surface movement and deformation, and the distribution law of the movement and deformation is consistent with the movement and deformation law during the surface movement period. Therefore, the mathematical model of probability integral method is still used to calculate the surface residual movement and deformation in the mining subsidence area.
According to the random medium theory, as shown by Wang et al. (2013), Li et al. (2021) and Zhang et al. (2020), the subsidence profile equation caused by the whole mining can be expressed as an integral formula of the probability density function. The calculation of subsidence, inclination, curvature, horizontal movement and horizontal deformation of any point on the surface caused by mining of a single working face along the j direction is shown in Equations 1–9.
Settlement calculation
Tilt calculation
Curvature calculation
Horizontal movement calculation
Horizontal deformation calculation
Where, D represents the mining coal seam area;
The calculation formula of the maximum subsidence value is Wmax=q1mcosα; The maximum tilt value is
Where: r=H/tgβ; H is the mining depth; Q1 represents the residual subsidence coefficient of the surface.
In order to reasonably evaluate the stability of the foundation in the mining subsidence area of the site to determine the feasibility of new buildings, it is estimated that the probability integral method will be selected to predict the parameters based on the mining data in the area, combined with the lithology and geological structure of the overburden in the area, and with reference to the surface movement parameters of the mining area.
Due to the long influence time of residual deformation, although the deformation curve is similar to the graph during mining, its duration is long and should be determined according to the analysis of mining method, mining time, residual space, etc.
The coefficient in residual deformation prediction shall be confirmed according to the actual measurement or numerical simulation method. If there is no reference data, the surface residual deformation subsidence coefficient can be used, which is calculated by the following formula (Wang and Deng, 2015):
Where,
The proposed area of Gate D5 of Tangshan World Horticultural Exposition in 2016 is located in the south of Tangshan downtown, west of Qinglongze (the original No. 10 and No. 8 pits) of Nanhu Ecological City, and at the intersection of Huanhu Road and Tangxu Road. The project area is located within the scope of the Tangshan mine field in Kailuan, close to the west side of the mine field boundary. Tangshan mine has conducted mining activities in the east and southeast of the area. The proposed area has been affected by mining subsidence. This provides a reliable basis for the planning and design of the area in order to understand the scope of the area affected by mining subsidence and whether it can be developed and constructed. The influence of residual deformation in this area needs to be analyzed.
The creep process of rock mass is complex and lasts for a long time. In this paper, the Kelvin model in rock mass mechanics is used to study the change process of residual movement and deformation of rock mass with time more clearly.
When the residual subsidence duration T tends to infinity, the residual subsidence value also tends to the potential maximum subsidence value, that is, the extreme value of residual subsidence. In fact, when the annual residual subsidence increment is equal to or less than 1 mm, the subsequent subsidence can be ignored, that is, it is considered as the potential maximum subsidence value. According to this standard, the calculation formula (Hu et al., 2008) of residual settlement duration Ty is:
Where,
According to the calculation of geological and mining data of Tangshan Mine in this area, the total time of residual deformation of each coal seam is listed in Table 3. According to the calculation results in Table 3, the surface movement and deformation caused by the mining of Coal Seams 5 and 9 in the west wing of Tangshan Mine in the east of the project area are basically stable; The surface movement and deformation caused by the mining of the mined areas of Coal Seams 5 and 9 in Tieyi Mining Area of Tangshan Mine in the southeast are still not stable.
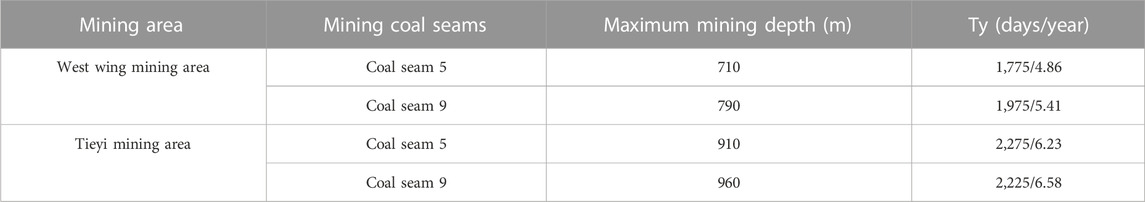
TABLE 3. Ty calculation results of coal seams 5 and 9 in Tangshan mine.
Since the coal seams mined around the project area are inclined and gently inclined, the probability integral method is used to predict the surface movement and deformation.
The selection of deformation prediction parameters is mainly based on the comprehensive determination of mining time, mining method, coal seam dip angle and other factors. The prediction parameters are determined as follows:
Subsidence coefficient: q=0.03–0.74 (determined according to mining time); Tangent of main influence angle: 5 coal seam upper tg β= 1.5, lower tg β=1.3; 9 coal seam upper tg β= 1.3, lower tg β=1.1; The transmission coefficient K of mining impact is 0.67; The horizontal movement coefficient b is 0.37; Inflection point offset coefficient is not considered; The repeated mining coefficient n is 1.1.
Input the above determined surface movement and deformation parameters, mining range, ground object coordinates and other data into the computer, predict with probability integral method, and calculate and process the current mining and future mining respectively.
The project area is only affected by the residual deformation of the old mining subsidence area of Tangshan Mine. See Table 4 for details.
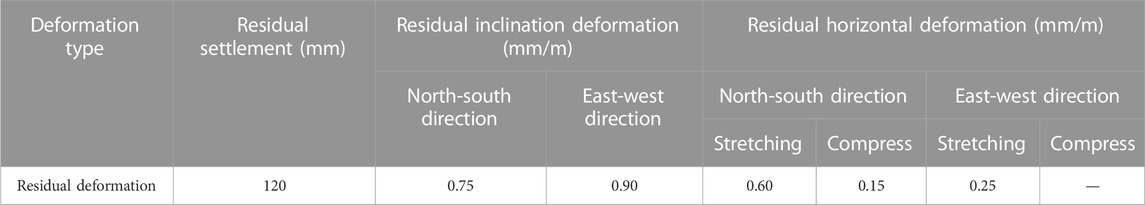
TABLE 4. Surface movement and deformation in the project area.
As shown in Table 5, it can be seen from the predicted and measured values that the predicted and fitted residual subsidence values of some mining areas are basically consistent.
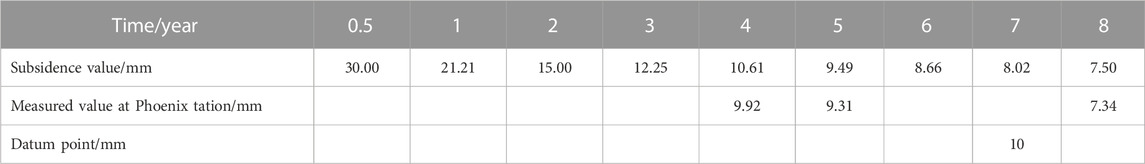
TABLE 5. Fitting predicted subsidence value and measured value.
The residual deformation prediction of D5 project area shows that this area is mainly affected by residual deformation. Under the current mining conditions, the maximum residual subsidence of the project area surface is 120 mm; The maximum residual slope deformation value of the ground surface in the north-south direction is 0.75 mm/m, and the maximum residual slope deformation value of the ground surface in the east-west direction is 0.90 mm/m; The maximum residual horizontal tensile deformation of the ground surface in the north-south direction is 0.60 mm/m; The maximum residual horizontal compression deformation is 0.15 mm/m; The east-west direction is mainly affected by tensile deformation, and the maximum residual horizontal tensile deformation is 0.25 mm/m; The buildings (structures) to be built in the project area according to the “Specification for coal pillar setting and mining of buildings, water bodies, railways and main roadways” will be slightly damaged by Grade I.
Under the influence of residual deformation in mining subsidence area, the initial equilibrium state between buildings (structures) and foundation is destroyed due to the movement and deformation of the surface. The establishment of a new force system balance will cause additional stress in buildings (structures), which will lead to deformation of buildings (structures) and will be damaged in serious cases. Because the stiffness of the building is greater than that of the foundation, the movement and deformation of the building and the surface movement and deformation are not coordinated, which is manifested in two aspects:
The paper studies the deformation mechanism and influencing factors of mining subsidence area, analyzes the causes of residual deformation from the micro and macro perspectives, and the influence relationship of building load and other external factors on surface deformation under the conditions of influencing factors, and verifies the law with the similar material model test of the impact of building load on mining subsidence area. The spatial variation range and time duration of residual deformation in mining subsidence area are discussed. The residual deformation of the project area is predicted by probability integral method. The main achievements are as follows.
(1) The residual deformation mechanism and influencing factors in mining subsidence area are analyzed, especially in the “three zones” characteristics and deformation mechanism. The mechanism of residual deformation is analyzed from the micro and macro aspects, and the influence factors of residual deformation, especially under the action of building load and the change of groundwater, are also analyzed.
(2) The similar simulation material test of surface deformation under building load shows that the subsidence value caused by surface load decreases gradually with the increase of depth; The change of surface slope is more obvious, indicating that the uneven settlement is significantly increased. The damage grade of buildings is above Grade IV, so it is necessary to carry out foundation treatment and anti-deformation design of buildings; Curvature deformation caused by load has little influence on surface buildings; Whether it is horizontal tensile deformation or horizontal compression deformation, the surface subsidence is relatively sufficient in the center of the goaf, so the horizontal deformation of the surface caused by loading is relatively small.
(3) Under the influence of water, the rock mass in the collapse zone further softens, the holes in the collapse zone are compacted, the rock mass subsidence value increases, and the surface subsidence occurs again. Under the actual natural environment conditions, the aquifer of the mined rock mass cannot be completely destroyed and lose water, and the height of the pore water unsaturated zone is limited after adding water.
(4) By analyzing the time series relationship between the strata movement and the surface displacement caused by the ore mining in the goaf, it can be seen that the residual deformation has a long duration and a great impact on the utilization of buildings. It is necessary to determine the duration and the residual deformation prediction. The probability integration method to predict the deformation conforms to the actual situation, and the deformation parameters need to be determined according to the actual situation.
(5) The residual deformation prediction of D5 project area shows that this area is mainly affected by residual deformation. Under the current mining conditions, the maximum residual subsidence of the surface in the project area is 120 mm; The maximum residual tilt deformation of the surface in the north-south direction is 0.75 mm/m, and the maximum residual tilt deformation of the surface in the east-west direction is 0.90 mm/m; The maximum residual horizontal tensile deformation of the surface in the north-south direction is 0.60 mm/m; The maximum residual horizontal compression deformation is 0.15 mm/m; The east-west direction is mainly affected by tensile deformation, and the maximum residual horizontal tensile deformation is 0.25 mm/m; The proposed buildings in the project area will be slightly damaged at level I according to the relevant mining specifications.
In order to study the deformation law of rock strata movement and surface displacement after the mining subsidence area is stabilized, and to explore the characteristics of surface movement and deformation under the action of building loads, a similar material simulation experiment was designed. After the settlement is stabilized, the model was equivalently loaded with different loads of 10–30 floors at different locations, and various surface deformation data were studied to analyze the change law. In addition, in order to quantitatively analyze the impact of residual deformation of goaf on buildings under building load, the probability analysis method is used to calculate the ground settlement value and other deformation data. The main conclusions are as follows.
(1) The model of ground deformation caused by mining is established. At the beginning of mining, the surface deformation is almost unaffected. With the development of mining, the coal seam mining subsidence gradually spreads to the surface, the surface deformation shows irregular subsidence, and the collapse zone has not been formed. After further mining, the collapse zone is formed and large scale collapse occurs, which is distributed symmetrically, and is in the shape of a “funnel” with low middle and slightly raised deformation edge. At this time, the surface deformation is severe. After the mining is completed, the collapse subsidence area gradually expands, and the maximum subsidence value increases. When the mining is completed for about half a year, the surface movement is basically stable, and the collapse zone grows slowly, entering the stable period.
(2) With the increase of mining depth, the subsidence value caused by surface load gradually decreases, and the destructive capacity of the above ground buildings is strong, so this deformation factor needs to be considered in the process of building foundation treatment; The change of the ground slope increases more obviously, indicating that the uneven settlement increases significantly. At this time, the anti deformation design of buildings and necessary foundation treatment measures should also be carried out; Curvature deformation, horizontal tension deformation and compression deformation caused by load, in the center of the goaf, the surface subsidence is relatively sufficient, so the horizontal deformation of the surface caused by loading is relatively small, and the safety impact on buildings is also small.
(3) In the process of using probability integral method to calculate the ground in the subsidence area, the Kelvin model in rock mechanics is used to calculate the duration of the residual deformation of the ground surface, and good calculation results are obtained. The calculated results are close to the actual measured values. This method can be used to calculate the subsidence value, tilt value, curvature deformation value and horizontal displacement value of the goaf ground.
The original contributions presented in the study are included in the article/supplementary material, further inquiries can be directed to the corresponding author.
LG, and LM contributed to conception and design of the study. LM organized the database. DA performed the statistical analysis. GL wrote the first draft of the manuscript. DA, GJ, GR, and DK wrote sections of the manuscript. All authors contributed to manuscript revision, read, and approved the submitted version.
The authors declare that this study received funding from the Productivity Transformation Fund of China Coal Science and Technology Ecological Environment Technology Co., Ltd. (0206KGST0005). The funder was not involved in the study design, collection, analysis, interpretation of data, the writing of this article, or the decision to submit it for publication.
The authors would like to express sincere thanks for providing support and help to Professor Ji Hongguang of Beijing University of Science and Technology.
Authors GJ, GR were employed by CCTEG Ecological Environment Technology Co.Ltd.
The remaining authors declare that the research was conducted in the absence of any commercial or financial relationships that could be construed as a potential conflict of interest.
All claims expressed in this article are solely those of the authors and do not necessarily represent those of their affiliated organizations, or those of the publisher, the editors and the reviewers. Any product that may be evaluated in this article, or claim that may be made by its manufacturer, is not guaranteed or endorsed by the publisher.
Agnieszka, M., Ryszard, H., Georgarakos, T., and Dai, D. Y. (2020). Behaviour of deep immersed tunnel under combined normal fault rupture deformation and subsequent seismic shaking. Int. J. Min. Sci. Technol. 30, 243–249. doi:10.1007/s10518-007-9055-0
Andreas, B., Avers, B., Matej, V., and Andreas, W. (2023). MIMO-SAR interferometric measurements for wind turbine tower deformation monitoring. Energies 16, 1518. doi:10.3390/en16031518
Bai, E. H., Li, X. Y., Guo, W. B., Tan, Y., Guo, M. J., Wen, P., et al. (2022). Characteristics and formation mechanism of surface residual deformation above longwall abandoned goaf. Sustainability 14, 15985. doi:10.3390/su142315985
Ding, A. H., and Lu, M. X. (2017). Experimental monitoring and simulation on the movement of similar materials in overlying conglomerate. Metal. Mine (08), 75–78.
Guo, W. B., Yang, W. Q., Ma, Z. B., Wen, P., Liu, X., and Bai, E. H. (2022). Stability criterion of overburden structure above goaf under building. J. China Coal Soc. 47 (06), 2207–2217. doi:10.13225/j.cnki.jccs.FQ21.1874
He, R. X., Liu, H., Ren, F. Y., Li, G. H., Zhang, J., and Zhou, Y. J. (2022). Comprehensive evaluation and decision for goaf based on fuzzy theory in underground metal mine. Adv. Civ. Eng. 2022, 14. doi:10.1155/2022/3104961
He, S. B. (2017). Effect of coal mine underground mining on the stability of the factory foundation. Guiyang: Guizhou University.
Hu, H. F., Zhao, Y. S., Kang, J. R., and Liang, W. G. (2008). Related laws and verification of mined-out area span, time and residual deformation. Chin. J. Rock Mech. Eng. 27 (1), 65–71. doi:10.3321/j.issn:1000-6915.2008.01.010
Ju, H. W., Zhai, W. Q., Deng, Y., Chen, M., and Li, A. Q. (2023). Temperature time-lag effect elimination method of structural deformation monitoring data for cable-stayed bridges. Case Stud. Therm. Eng. 42, 102696. doi:10.1016/j.csite.2023.102696
Li, J. Y., Zang, M. D., Xu, N. X., Qin, Y., and Chen, Y. (2021). Influence of residual deformation of goaf to sangzhangtunnel with probability integral method. J. Eng. Geol. 29 (02), 564–574. doi:10.13544/j.cnki.jeg.2020-548
Li, S. Z. (2019). Practice and countermeasure analysis of coal mining subsidence area control in China. Coal Sci. Technol. 47 (1), 36–43. doi:10.13199/j.cnki.cst.2019.01.005
Li, Y. H., Zhu, X. J., and Liu, H. (2022). Comparative study on stability analysis method of building foundationin coal mining subsidence area. Coal Sci. Technol. 50 (04), 229–235. doi:10.13199/j.cnki.cst.KSCL20-020
Lian, X. G., Hu, H. F., and Guo, B. T. (2016). Regularities of surface dynamic movement and deformation induced by mining in mountainous area. Metal. Mine (09), 151–156. doi:10.3969/j.issn.1001-1250.2016.09.030
Liu, H., Hao, C., Wang, Z. W., Li, C., Guo, L. F., Liang, J. L., et al. (2023). Study on stability of underlying room and pillar old goaf in close coal seam and mining of the upper coal seam. Front. Earth Sci. 10. doi:10.3389/feart.2022.1071250
Lu, M. X. (2015). Pressure relief mechanism at upper protective layer mining in liangzhuang coal mine and numerical simulation of protection scope. Metal. Mine 44 (4), 7–11.
Lu, M. X. (2019). Research on spatial and temporal evolution of residual deformation in mining subsidence area and the influence of ground buildings[D]. Beijing: University of Science and Technology Beijing.
Paulina, V., Dominique, D., Alfonso, F., and Miguel, P. (2019). Monitoring of mining subsidence in a sector of Central Chile through the processing of a time series of sentinel 1 images using differential interferometry techniques (DInSAR). Proceedings 19 (1), 10–15. doi:10.3390/proceedings2019019010
Ren, B. K., Shen, Y., Zhao, T. T., and Li, X. J. (2023). Deformation monitoring and remote analysis of ultra-deep underground space excavation. Undergr. Space 8, 30–44. doi:10.1016/j.undsp.2022.04.005
Rui, Y. C., Zhou, Z. L., Cai, X., Lan, R. Y., and Zhao, C. C. (2022a). A novel robust AE/MS source location method using optimized M-estimate consensus sample. Int. J. Min. Sci. Technol. 32, 779–791. doi:10.1016/j.ijmst.2022.06.003
Rui, Y. C., Zhou, Z. L., Lu, J. Y., Ullah, B., and Cai, X. (2022b). A novel AE source localization method using clustering detection to eliminate abnormal arrivals. Int. J. Min. Sci. Technol. 32 (01), 51–62. doi:10.3969/j.issn.2095-2686.2022.01.005
Tan, Z. X., and Deng, K. Z. (2007). Comprehensive analysis and application study on ground deformation prediction parameters of fully-mechanized mining with sublevel caving. Chin. J. Rock Mech. Eng. 26 (05), 1041–1047. doi:10.3321/j.issn:1000-6915.2007.05.025
Tan, Z. X., and Deng, K. Z. (2006). Smiulation on dynamicmovement and deformation laws of buildings in mining area. J. Xi’an Univ. Sci. Technol. (03), 349–352. doi:10.3969/j.issn.1672-9315.2006.03.014
Teng, Y. H., Tang, Z. X., and Yi, S. (2016). Coal mining subsidence area and evaluation of resistance to deformation of high-rise building foundation technology. Mine Surv. (01), 1–6. doi:10.3969/j.issn.1001-358X.2016.01.001
Teng, Y. H., and Yan, Z. B. (1999). In the process of mining overburden layer and development of research. J. Coal (01), 27–30.
Teng, Y. H., and Zhang, R. L. (2003). Study on surface movement in xuzhou mining area. Mine Surv. (03), 34–35+33. doi:10.3969/j.issn.1001-358X.2003.03.011
Wang, Q., and Huang, T. C. (2022). Time-variant reliability analysis of underground structures against delayed failure based on the probability density evolution method. Eng. Fail. Anal. 142, 106695. doi:10.1016/j.engfailanal.2022.106695
Wang, Y. H., Feng, Y., and Li, L. L. (2020). Regularity of movement and deformation of rock and soil mass in mining subsidence under giant thick loose layer. J. Chengdu Univ. Technol. Technol. Ed. 47 (06), 733–741. doi:10.3969/j.issn.1671-9727.2020.06.10
Wang, Y. J., He, J. H., and Yan, P. Y. (2013). Foundation stability evaluation of old goaf based on additional stress and probability integration. Metal. Mine 02, 135–139. doi:10.3969/j.issn.1001-1250.2013.02.036
Wang, Z. S., and Deng, K. Z. (2015). Analysis of durface residual deformation and stability evaluation of buildings foundation in old goaf. Coal Sci. Technol. 43 (10), 133–137. doi:10.13199/j.cnki.cst.2015.10.026
Wang, Z. Y., Guo, W. B., and Yang, D. M. (2015). Study on effects of blasting vibration on surface residual deformation and structures-taking yungaishan coal mine 2 as an example. China Saf. Sci. J. 25 (12), 123–128. doi:10.16265/j.cnki.issn1003-3033.2015.12.021
Xu, Z. C., Xu, W., Zhu, Z. H., and Zhao, J. Y. (2023). Research on monitoring and stability evaluation of ground subsidence in gypsum mine goaf. Front. Earth Sci. 10, 1097874. doi:10.3389/fenvs.2022.1097874
Zhang, F., Wu, Z. C., Zhang, Y., and Tan, X. Q. (2020). Comprehensive study of parameters of probability integral method of mining subsidence in urban planning areas of Jining City. Coal Sci. Technol. 48 (10), 150–157. doi:10.13199/j.cnki.cst.2020.10.019
Zhang, F., Diao, X. P., Tan, X. Q., Li, A. J., and Yang, J. (2022). Exploration and stability evaluation of coal mine goaf based on SBAS technology. Coal Sci. Tech. 50 (03), 208–214. doi:10.13199/j.cnki.cst.2019-1115
Zhang, H. X. (2014). Standardization of mining subsidence prediction. Coal Min. (1), 1–2. doi:10.13532/j.cnki.cn11-3677/td.2014.01.001
Zhang, J. W., Zhong, S., and Chen, B. (2016). Mining influence based on similar simulation experiment under the strata movement rule research. Coal 25 (01), 4–6. doi:10.3969/j.issn.1005-2798.2016.01.002
Zhang, X. C., Chen, L. X., and Zhou, C. (2023). Deformation monitoring and trend analysis of reservoir bank landslides by combining time-series InSAR and Hurst Index. Remote Sens. 15, 619. doi:10.3390/rs15030619
Zhou, Z. L., Rui, Y. C., Cai, X., and Lu, J. Y. (2021). Constrained total least squares method using TDOA measurements for jointly estimating acoustic emission source and wave velocity. Measurement 182, 109758. doi:10.1016/j.measurement.2021.109758
Keywords: goaf, residual deformation, similar material test, probability analysis method, building safety
Citation: Guilin L, Mingxing L, Aihua D, Junhai G, Rongjiu G and Kangshuo D (2023) Study on the law of residual deformation in mining subsidence area and its influence on the safety of ground buildings. Front. Earth Sci. 11:1127862. doi: 10.3389/feart.2023.1127862
Received: 20 December 2022; Accepted: 10 March 2023;
Published: 04 April 2023.
Edited by:
Jie Chen, Chongqing University, ChinaReviewed by:
Muhammad Kamran, Bandung Institute of Technology, IndonesiaCopyright © 2023 Guilin, Mingxing, Aihua, Junhai, Rongjiu and Kangshuo. This is an open-access article distributed under the terms of the Creative Commons Attribution License (CC BY). The use, distribution or reproduction in other forums is permitted, provided the original author(s) and the copyright owner(s) are credited and that the original publication in this journal is cited, in accordance with accepted academic practice. No use, distribution or reproduction is permitted which does not comply with these terms.
*Correspondence: Lu Mingxing, bHVtaW5neGluZ0BjaWRwLmVkdS5jbg==
Disclaimer: All claims expressed in this article are solely those of the authors and do not necessarily represent those of their affiliated organizations, or those of the publisher, the editors and the reviewers. Any product that may be evaluated in this article or claim that may be made by its manufacturer is not guaranteed or endorsed by the publisher.
Research integrity at Frontiers
Learn more about the work of our research integrity team to safeguard the quality of each article we publish.