 Mingjin Zhan
 Qiong Wu2
- 1Jiangxi Eco-meteorological Center, Jiangxi Meteorological Bureau, Nanchang, China
- 2Jiangxi Climate Change Center, Jiangxi Meteorological Bureau, Nanchang, China
On the basis of daily observations data from 1984 to 2020, the spatiotemporal characteristics of extreme precipitation events in the Poyang Lake Basin (China) were analyzed using the intensity–area–duration method. With consideration of spatially distributed data on gross domestic product (GDP), population, and disaster losses related to historical extreme precipitation events, the exposure and vulnerability of the population and GDP of the study area to extreme precipitation events were systematically assessed. The results revealed the following. 1) The intensity and frequency of extreme precipitation, as well as the area affected, showed trends of increase, especially in the northeast of the basin. 2) Population exposure in the basin showed a trend of increase of 2.43 million/a. Change in population exposure was greatest in the most recent 10 years, with an average increase of 6.64 million/a. Change in extreme precipitation was the primary driver of the rapid increase in population exposure. 3) The average annual GDP exposure of the basin was ¥5.43 billion, and economic exposure has increased substantially at an average rate of ¥0.56 billion/a. Unlike population exposure, the increase in economic exposure was driven mainly by rapid economic growth. 4) By constructing vulnerability curves of economic losses in different decades, the trend of economic vulnerability was found to have clearly declined, i.e., economic vulnerability in 2010 was 13.3 (4.1) times lower than that in the 1990s (2000s). Effective disaster prevention and reduction measures should urgently be adopted in the study area to mitigate the effects of increase in extreme precipitation events.
1 Introduction
The impact of extreme or non-extreme events is a function of both the nature of physical hazard and the exposure and vulnerability of society to such events (IPCC, 2012). Research has focused on characterizing potential changes in the frequency and the magnitude of physical hazards, whereas possible changes in exposure and vulnerability have received less attention. However, recognition of the importance of this dimension is growing, as evidenced by the treatment of risk, exposure and vulnerability in the Intergovernmental Panel on Climate Change (IPCC) Special Report on Extremes (IPCC, 2012) and IPCC AR5 WGII (IPCC, 2014).
Exposure refers to the inventory of elements (e.g., the population, economy, and fixed assets) of an area in which hazard events may occur (Cardona, 1990; UNISDR, 2009). Hence, if population and economic resources were not located in (exposed to) potentially dangerous settings, no problem of disaster risk would exist (IPCC, 2014). Vulnerability refers to the propensity of exposed elements such as human beings, their livelihoods, and assets to suffer adverse effects when impacted by hazard events (UNISDR, 2009; IPCC, 2012). It is directly related, in the context of climate change, to the susceptibility, sensitivity, and lack of resilience or capacity of the exposed system to cope with and adapt to extremes and non-extremes (Brklacich and Bohle, 2006; IPCC, 2012). Under the same level of exposure, the degree of adverse effects depends on vulnerability.
In developed countries, disaster losses mainly comprise economic losses. In developing countries, however, disasters can lead to both huge economic losses and heavy casualties. During 1970–2008, more than 95% of fatal accidents caused by natural disasters occurred in developing countries. This difference between developed and developing countries is mainly attributable to differences in vulnerability and exposure, rather than to variation in actual hazards (Zheng, 2012).
Extreme precipitation is one of the drivers of the most severe disasters in China, with 37.2% of economic losses and 11.7% of casualties during 1984–2014 related to meteorological disasters (Qin et al., 2015). Poyang Lake Basin, located in the middle and lower reaches of the Yangtze River (China), has a subtropical monsoon climate with high and temporally concentrated annual precipitation. The basin is also among the regions of China with the fastest economic growth, with its annual rate of increase in gross domestic product (GDP) averaging 7.3% during 1990–2020. During 1990–2020, 68% of economic losses and 85% of casualties related to meteorological disasters in the basin were attributable to extreme precipitation and derivative disasters (CMA, 1990–2020). Therefore, understanding the impact of changes in extreme precipitation events on exposure and vulnerability in the Poyang Lake Basin is essential.
Most previous related studies have focused on the evolution and the spatiotemporal distribution of extreme precipitation. Extreme precipitation has been found to be increasing both in China nationally and in the Poyang Lake Basin specifically. In southern China, the number of short-term extreme precipitation events and their 50-year return period are expected to increase considerably. In northern China, the number of long-duration extreme precipitation events and their 10-year return period are also expected to increase (Yuan et al., 2015). In the Poyang Lake Basin, extreme precipitation has also increased but with a notable change in rate at around 1990. The increased temporal variability and heterogenous distribution of precipitation in the basin might lead to increased risk of both drought and flooding (Guo et al., 2006; Wang et al., 2009).
In recent years, focus has shifted onto the exposure and the vulnerability components of disasters (Gray & Mueller, 2012; Jongman et al., 2012; Haer et al., 2013; Hirabayashi et al., 2013). Using the intensity–area–duration (IAD) method, Zhai et al. (2017) studied not only the changing characteristics of drought but also the exposure to drought in China. On the basis of socioeconomic data of Jiangsu Province, Wang et al. (2015) analyzed exposure and vulnerability to flood disaster in Jiangsu Province. Using provincial-level data, Jing et al. (2016) calculated the regional exposure of population and GDP to extreme precipitation in China.
Notably, attempting precise basin-level research based on provincial-level data is inappropriate. In this study, using daily precipitation data (1984–2014) from 83 meteorological stations in and around the Poyang Lake Basin, an extreme precipitation event was defined as an event during which the precipitation exceeded the 90th percentile from 1984 to 2020. Using the IAD method, both the intensity and the frequency of extreme precipitation events in the Poyang Lake Basin were calculated, and the area impacted by such events was determined. On the basis of the derived areas of impact and county-level socioeconomic data, the exposure of both the population and the GDP of the basin were analyzed. Then, considering historical disaster loss data, exposure data, and precipitation intensity data, intensity–loss curves were constructed and change in the vulnerability within the basin was investigated.
The conclusions derived from this research constitute a technical reference that could support measures intended for the prevention and mitigation of the effects of extreme precipitation, and provide a scientific basis to ensure sustainable socioeconomic development.
2 Data and method
2.1 Study area
The Poyang Lake Basin (28°22′–29°45′N, 115°47′–116°45′E, surface area: 1.62 × 10⁵ km2) is located in the southern part of China, in the middle–lower reaches of the Yangtze River (Figure 1). The basin has a typical temperate and monsoonal climate with four distinct seasons. From 1984 to 2020, annual mean temperature was 18.2 °C and annual mean precipitation was approximately 1,691 mm. The precipitation is concentrated in the flood season (April–July), with 53% of the annual total falling within this period on average. Accordingly, extreme precipitation disasters represent one of the main types of the natural disasters that occur within the basin.
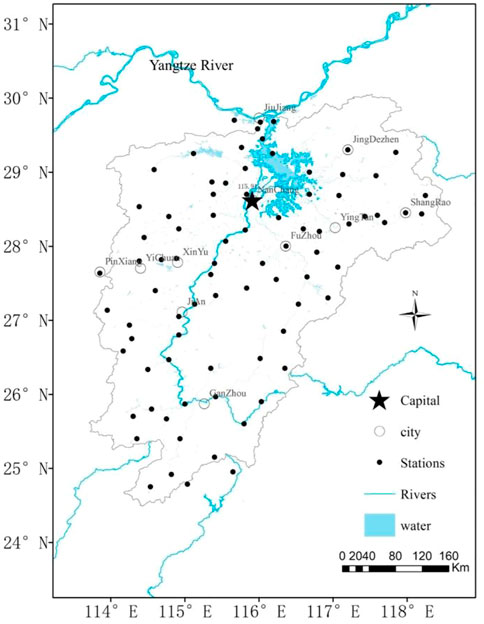
FIGURE 1. Location of the main cities and distribution of meteorological stations in the Poyang Lake Basin, China.
Nanchang is the capital of Jiangxi Province and the largest city within the basin. In 2020, Nanchang’s GDP was ¥574.551 billion and its permanent population was 6.26 million. Ji’an, Jiujiang, and Fuzhou are among the other 10 main cities (circles) within the basin (Figure 1).
2.2 Data
2.2.1 Meteorological data
This study used quality-controlled daily precipitation data obtained from 83 meteorological observation stations for the period 1 January 1984 to 31 December 2020 (black dots in Figure 1). Prior to further analysis, these data were tested for homogeneity. The quantity of missing data, corresponding to <0.25% of the total, had little or no impact on the research results. On the basis of the observed precipitation data and with consideration of their continuity, anomaly interpolation (New et al., 1999, 2000) was used to create 0.25° × 0.25° grids. This method has been used previously in interpolation of the Climatic Research Unit dataset, and has been found to effectively capture the spatiotemporal distribution of daily precipitation in the Poyang Lake Basin (Xu et al., 2009; Wu and Gao, 2013).
2.2.2 Disaster data
Information on disaster losses prior to 2000 was obtained from the China Meteorological Disaster Canon (Wen, 2008). Data for the period after 2000 were obtained mainly from the China Meteorological Disaster Yearbooks (CMA, 2001–2020).
2.2.3 Socioeconomic data
Annual population and GDP data for the Poyang Lake Basin were derived from the Jiangxi Province Statistical Yearbooks and comprise county-level statistical data (Figure 2). The population has grown from 34.6 million in 1984 to 45.2 million in 2020, at an average rate of growth of 0.29 million (Jiangxi Provincial Bureau of Statistics, 1984–2020).
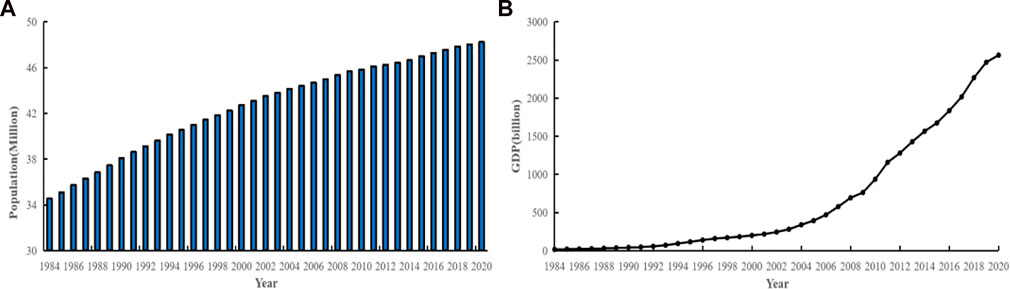
FIGURE 2. Yearly (A) population and (B) GDP (¥) of the Poyang Lake Basin (1984–2020).
Without considering inflation, the GDP of the Poyang Lake Basin has increased from ¥16.9 billion (1984) to ¥2569.2 billion (2020) at an average rate of increase of ¥65.0 billion/a. Here, considering changes in the consumer price index, the GDP data were normalized to 2014. Following this adjustment, GDP was found to have increased from ¥71.6 billion (1984) to ¥2569.2 billion (2020) at an average rate of increase of ¥66.6 billion/a. The population and GDP data for the Poyang Lake Basin were interpolated to a 0.25° × 0.25° grid (Figure 3) using the grid weight calculation method (Zhan M. J. et al., 2019).
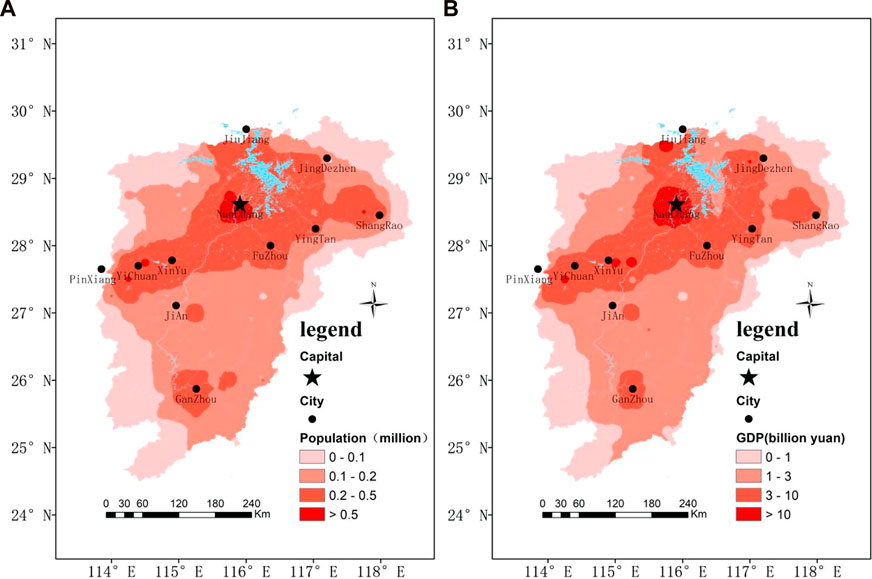
FIGURE 3. Annual average rate of increase in (A) population and (B) GDP in the Poyang Lake Basin (1984–2020).
2.3 Method
2.3.1 Intensity–area–duration (IAD) method
Intensity–Area–Duration Method This study adopted the IAD method that linked three important features of extreme events: intensity, impact area, and duration (Andreadis et al., 2005; Sheffield et al., 2009). Contiguous grid points with daily precipitation≥50 mm over a given time scale and a continuous area were selected as an extreme event. The mean precipitation of the extreme event was selected as the intensity in this method. The IAD method can be used to both study the simultaneous changes in intensity and impact area over a given duration, and analyze the most severe regional extreme precipitation events by plotting an envelope curve (Figure 4). This method has been successfully applied to analyses of heat waves, drought, and extreme precipitation events in China (Huang et al., 2017; Zhai et al., 2017; Zhan L. F. et al., 2019).
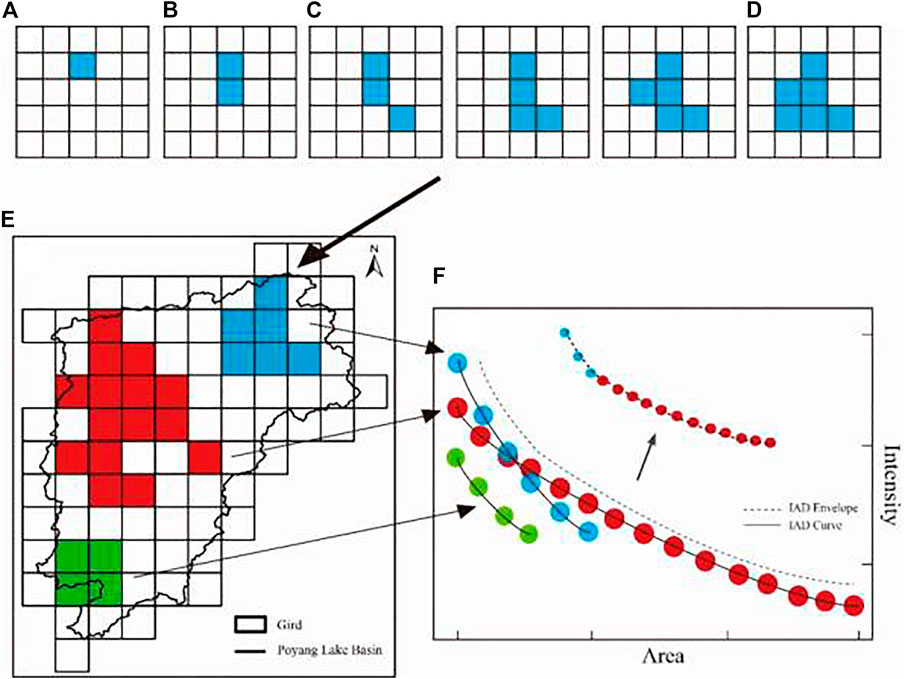
FIGURE 4. Construction of intensity-area-duration (I-A-D) curve. ((A–E): Determination of the range ofextreme events; (E): The extreme events in Poyang Lake Basin; (F): The IAD curve of all the events.) (Zhan M. J. et al., 2019).
2.3.2 Definition of exposure and analysis of contribution rate
The number of people exposed to an extreme event was defined as the population exposure (Fouillet et al., 2006). Exposure to extreme precipitation events is affected by the frequency of occurrence of such precipitation and the size of the population. Consequently, population exposure is affected by the combined effects of climatic factors (change in frequency of extreme precipitation with constant population size), population factors (constant frequency of extreme precipitation with change in population size), and climatic–population factors (changes in both frequency of the precipitation and population size). The change in population exposure to extreme precipitation events can be expressed as follow (Huang et al., 2016; Zhan L. F. et al., 2019)
where F is the frequency of extreme precipitation, ΔF is the change in the frequency of extreme precipitation, P is the population size, and ΔP is the change in the population size.
For ease of comprehension, it is assumed that the contribution rate of increased population exposure is positive, and that the contribution rate of different influencing factors in the change of population exposure to extreme precipitation is as follows:
Rate of contribution of climatic factors:
Rate of contribution of population factors:
Rate of contribution of combined climatic-population factors:
where F and P represent the frequency of extreme precipitation events and the size of the population, respectively, F × ΔP is the influence of population factors, P × ΔF is the influence of climatic factors, and ΔF × ΔP is the combined influence of climatic–population factors.
The exposure and contribution rate of GDP could be analyzed in a manner similar to that adopted for the population.
2.3.3 Intensity–loss rate curve
The relationship between precipitation intensity and loss rate can be fitted using the Napierian Logarithm (ln) function as follows:
where r is the ratio between losses and GDP for the exposed area, a is the slope, and I is quantified by the maximum areal precipitation during an extreme precipitation event (Jiang et al., 2020).
In this study, the intensity–loss rate curves for the period 1990–2020 were built and used to estimate the losses associated with extreme precipitation events in future scenarios.
3 Results
3.1 Changes in impact area, frequency and intensity of extreme precipitation events
Figure 5 shows that the area of the Poyang Lake Basin affected by extreme precipitation has increased continuously at a mean rate of 6.0 × 10³ km2/a. From the interdecadal perspective, the area impacted by extreme precipitation events was highest in the 1990s (1991–2000) and 2010s (2011–2020), with an annual average of approximately 5 × 10⁵ km2 in both cases. In the past decade, the impacted area has increased more notably, with a growth rate of 2.4 × 10⁴ km2/a (significance at 95%).
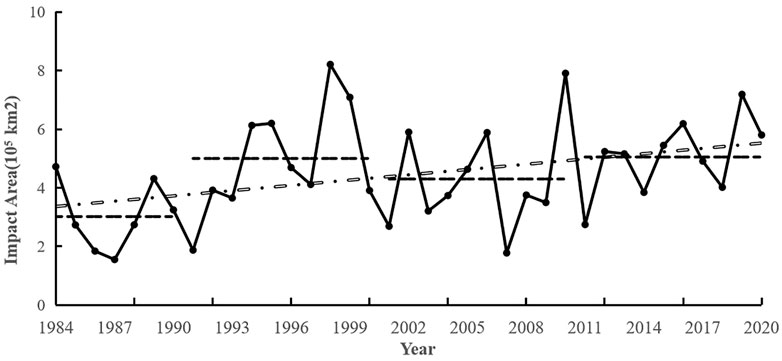
FIGURE 5. Area impacted by extreme precipitation events in the Poyang Lake Basin (1984–2020).
The frequency of extreme precipitation events reflects the number of events affecting the region, with higher frequency usually meaning greater impact. Figure 6 reveals that the number of extreme precipitation events in the 1990s (1991–2000) and 2010s (2011–2020) reached an average of three per year. These were the decades during the study period in which extreme heavy rainfall occurred most frequently. According to the spatial distribution of the annual frequency of extreme precipitation during 1984–2020 (Figure 7), various regions of the basin were affected differently by extreme precipitation events. The high-value centers (annual occurrence frequency: ≥2.8) were located mainly in the eastern and western border mountain areas and in the central mountains, consistent with the distribution of high-elevation terrain (Figure 1). The low-value areas were distributed in northern and southern parts of the basin. Thus, topography evidently affects the distribution of the frequency of occurrence of extreme precipitation in the Poyang Lake Basin.
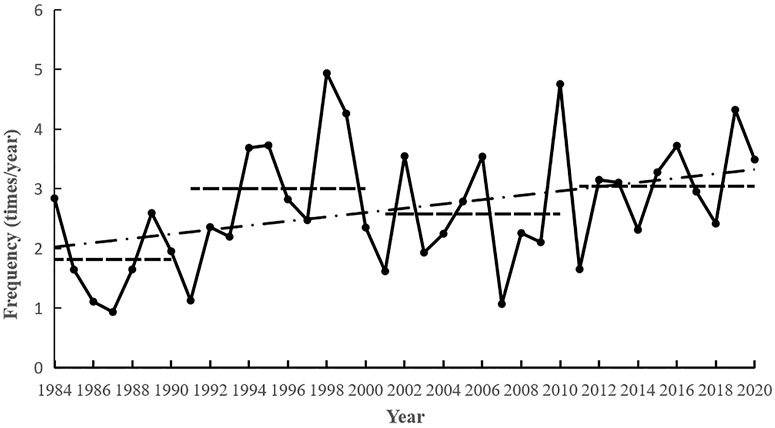
FIGURE 6. Frequency of occurrence of extreme precipitation events in the Poyang Lake Basin (1984–2020).
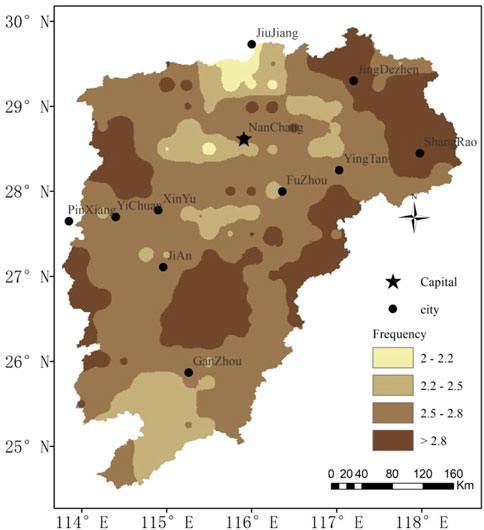
FIGURE 7. Spatial distribution of the annual frequency of occurrence of extreme precipitation events in the Poyang Lake Basin (1984–2020).
Over the period 1984–2020, the average intensity of extreme precipitation events in the Poyang Lake Basin was 73.3 mm/d. Figure 8 illustrates the change in precipitation intensity. Overall, annual intensity showed a trend of increase with a mean rate of 0.22 mm/d/a (significance at 90%). From the interdecadal perspective, the annual intensity of precipitation in the 2010s was also the highest, i.e., 76.5 mm/d (Figure 8).

FIGURE 8. Intensity of extreme precipitation events in the Poyang Lake Basin (1984–2020).
The spatial distribution of the annual intensity of extreme precipitation events during 1984–2020 exhibited an obvious regional characteristic of weakening from the northeast toward the south west (Figure 9). The maximum-value center was located in the northeast of the basin, with intensity of >75 mm/d (and some areas with intensity of 85 mm/d). The low-value areas with intensity of <65 mm/d were distributed in the southwest of the basin. The northeast of the basin was also the area with high values in terms of frequency of occurrence of extreme precipitation vents. This finding is largely consistent with that of Wu and Zhan, 2020. Consequently, authorities in the northeast of the basin should attach much importance to the management and mitigation of the possible impacts of extreme precipitation events.
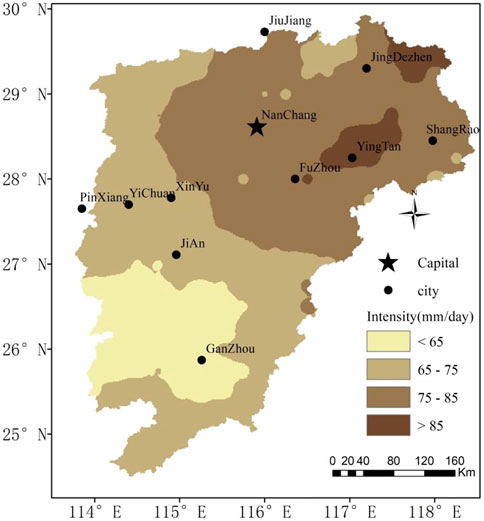
FIGURE 9. The spatial distribution of annual mean intensity of extreme precipitation events in Poyang Lake Basin from 1984 to 2020.
3.2 Exposure of population and GDP
In developing countries, exposure is an important determinant of disaster losses (Zheng, 2012). The average total cumulative population exposure annually to extreme precipitation in the Poyang Lake Basin was 110.84 million during 1984–2020. Population exposure showed a trend of increase at an average rate of 2.43 million/a (Figure 10). In decadal terms, the annual population exposure increased significantly in the 2010s, being 22.36 million higher than that in the 2000s. In the most recent 10 years, the population exposure increased by 6.64 million/a on average, i.e., at a rate greater than the average increase over the entire study period.
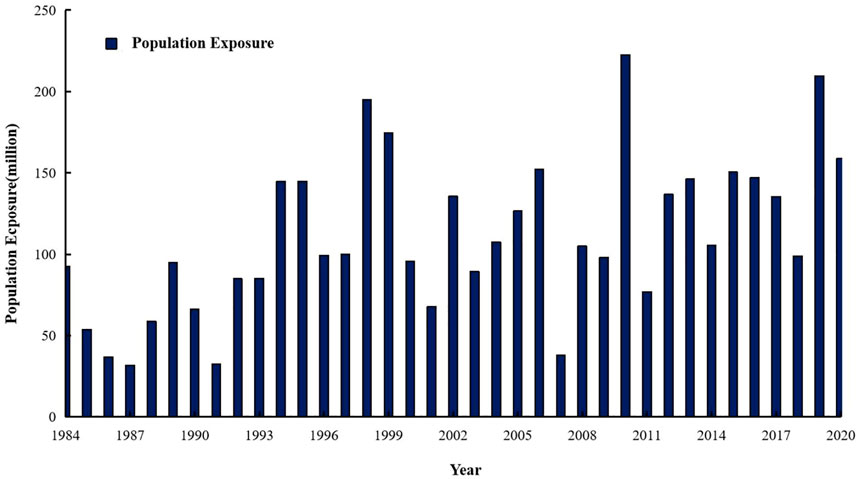
FIGURE 10. Population exposure in the Poyang Lake Basin (1984–2020).
During 1984–2020, the average total cumulative GDP exposure to extreme precipitation in the Poyang Lake Basin annually was ¥5.43 billion (Figure 11). GDP exposure showed a trend of rapid increase at a rate of 0.56 billion/a. Annual GDP exposure in the 2010s was 86 times higher than that in the 1980s. The rapid growth in GDP exposure was attributable to both the increase in the frequency of occurrence of extreme precipitation events and, more importantly, the rapid regional economic development.
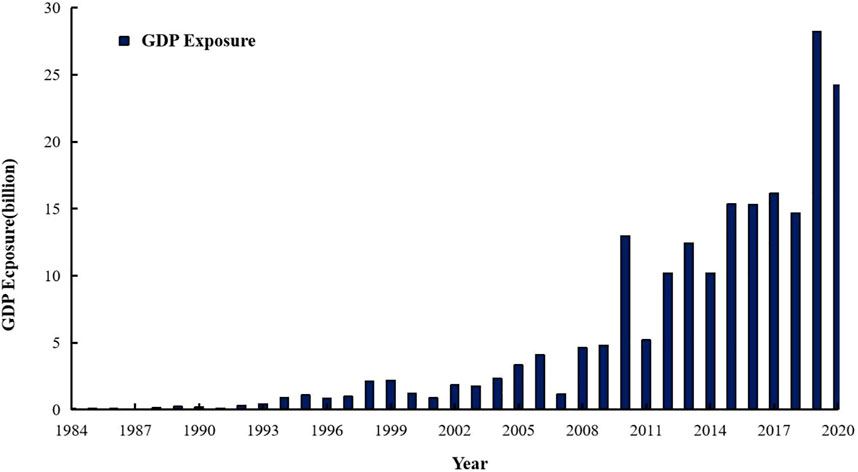
FIGURE 11. GDP exposure in the Poyang Lake Basin (1984–2020).
Figure 12 shows that the average annual change in population exposure and GDP exposure in northern, central, western, and southern parts of Poyang Lake Basin were relatively high, reaching 0.5 million and ¥50 million, respectively. The frequency of occurrence of extreme precipitation events in Nanchang was not the highest, but owing to its relatively well-developed economy and concentrated population, Nanchang has become the center of greatest population and economic exposure. The distributions of population and GDP exposure were broadly consistent with the distributions of population and GDP (Figure 3), which in turn were consistent with the distribution of the major cities in the Poyang Lake Basin. It can be seen that the distributions of population and GDP exposure were affected not only by the distribution of extreme precipitation but also by the distribution of population and GDP.
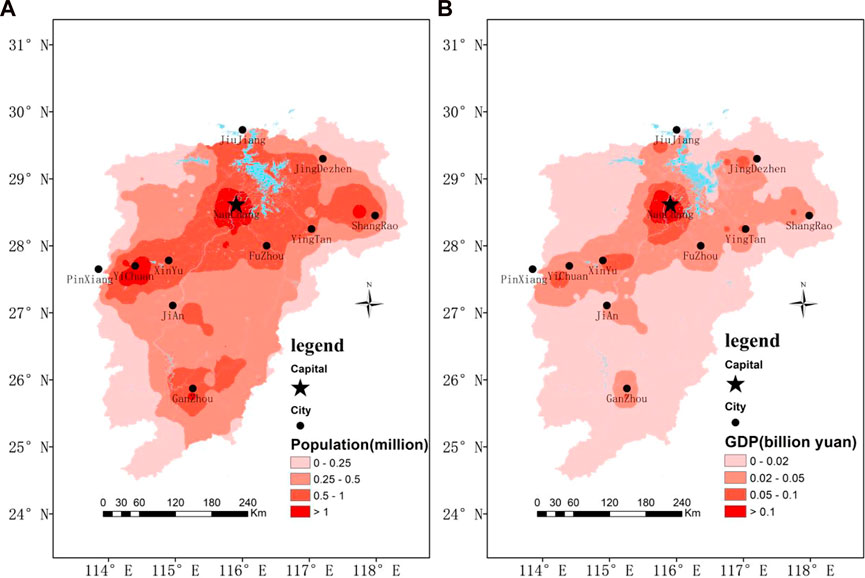
FIGURE 12. Spatial distribution of average annual change in (A) population exposure and (B) GDP exposure to extreme precipitation events in the Poyang Lake Basin (1984–2020).
Changes in population (GDP) exposure to extreme precipitation events depend on changes in the spatial distributions of climate and population (GDP) (Zhan M. J. et al., 2019). Table 1 lists the rate of contribution of each factor that influences population exposure, where a negative rate of contribution indicates that the contribution was opposite to the trend of population exposure, and where the absolute value indicates the rate of that contribution. Changes in population exposure to extreme precipitation events across the Poyang Lake Basin have been dominated by climatic factors, although the rate of contribution decreased gradually and changed from a negative contribution (−244.6% for the 2000s in comparison with the 1990s) to a positive contribution (76.6% for the 2010s in comparison with the 2000s) during 1984–2020. During 2011–2020, in comparison with 2001–2010, the population influenced by climatic factors increased by up to 17.13 million (76.6%) because of the sharp increase in the frequency of occurrence of extreme precipitation events. The period in which population factors were most influential was during the 2000s, which is when the influence of the population increased by 2.39 million (167.4%) in comparison with the 1990s. Subsequently, the population influenced by population factors gradually decreased. Generally, interaction between climatic and population factors had less impact on population exposure than that of either climatic factors or population factors alone. Climatic factors had the greatest impact on population exposure, whereas the effect of population factors exhibited a trend of decline. This can be explained by the substantial increase in extreme precipitation in recent years, during which the basin has experienced slow population growth.
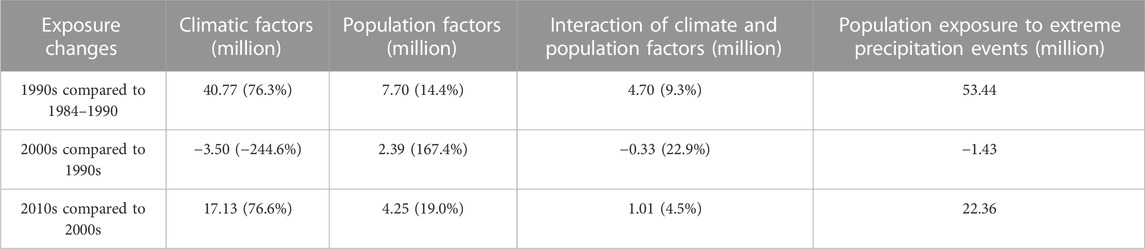
TABLE 1. Analysis of factors influencing change in population exposure to extreme precipitation events across the Poyang Lake Basin.
Table 2 lists the rate of contribution of each factor that influences GDP exposure. Changes in population exposure to extreme precipitation events across the Poyang Lake Basin have been dominated by GDP factors. The contribution of the GDP factor was always positive. Additionally, the absolute value was also greater than that of both the climate factors and the combined factors. GDP factors had the greatest impact on GDP exposure, whereas the effect of GDP factors exhibited trends of increase. This can be attributed to the rapid economic growth within the Poyang Lake Basin.
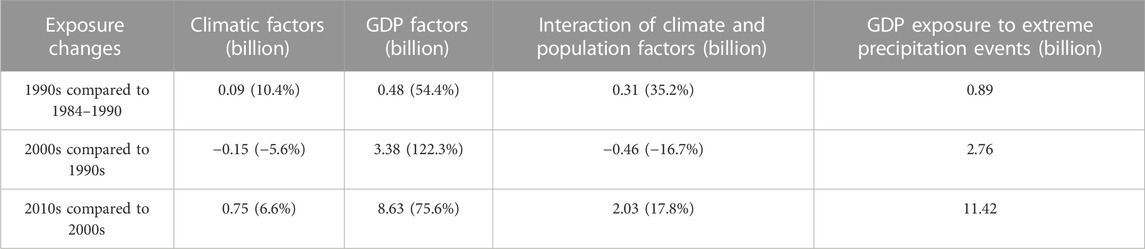
TABLE 2. Analysis of factors influencing change in GDP exposure change to extreme precipitation events across the Poyang Lake Basin.
3.3 Development of intensity–loss rate curves for the Poyang Lake Basin
For estimation of the direct economic losses caused by extreme precipitation, intensity–loss rate curves were established for the Poyang Lake Basin based on extreme precipitation losses recorded in the yearbooks of meteorological disasters in China for the period 1984–2020 (CMA, 1984–2020; Su et al., 2018). The ratio of the direct economic losses to the GDP in a specific year was regarded as the GDP loss rate. For convenience of comparison between decades, the curves were established from the 1990s.
In Figure 13, extreme precipitation intensity is plotted on the horizontal axis, denoting the averaged intensity of total extreme precipitation events per year as described in Section 3.1, and the loss rate is plotted on the vertical axis, denoting the GDP loss due to extreme precipitation.
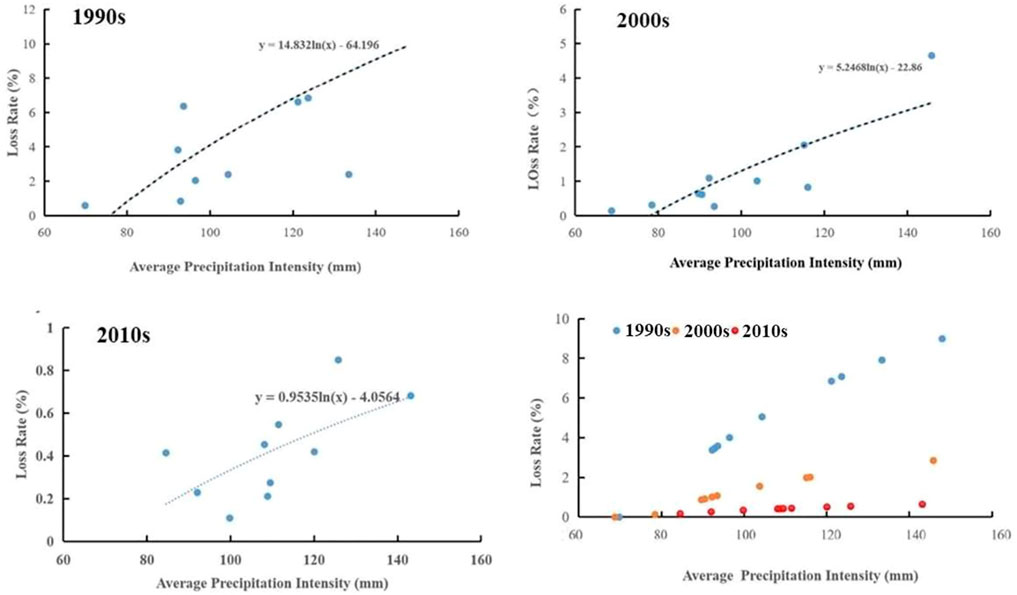
FIGURE 13. Relationship between extreme precipitation intensity and economic losses per unit area for each decade in the Poyang Lake Basin, China.
The slope (a) of an intensity–loss rate curve is an indicator of the adaptation capacity. Provinces with a lower a would usually encounter lower losses than those of provinces with a higher a when subject to extreme precipitation of similar intensity. With socioeconomic development, the adaption capacity of a region to meteorological disasters such as extreme precipitation should increase, and with increase in extreme precipitation intensity, the loss rate should increase. The loss rate of the Poyang Lake Basin was approximately 0%–10% in the 1990s, 0%–3% in the 2000s, and 0%–1% in the 2010s, i.e., the loss rate gradually decreased. The value of a was 6.69 in the 1990s, and it gradually decreased to 2.25 in the 2000s, and then to 0.48 in the 2010s, meaning that the loss rate of the basin has indeed become smaller under the same intensity of extreme precipitation. In other words, the adaption capacity of the basin has increased systematically (Figure 13).
4 Discussion and conclusion
Warming-induced global changes exacerbate variations in the occurrence of climatic extremes with respect to duration, frequency, intensity, and spatial distribution (IPCC, 2013), and this is especially true in relation to the Poyang Lake Basin in China. Extreme precipitation events in the Poyang Lake Basin can have severe societal, economic, and environmental impacts (Zhan L. F. et al., 2019). Many previous studies have investigated extreme precipitation in this basin, including precipitation on different time scales (i.e., yearly, monthly, daily, and hourly), and it has been established that the frequency and the intensity of extreme heavy precipitation events in the Poyang Lake Basin are increasing (Sun et al., 2014; Wu and Zhan, 2020; Wu et al., 2021). Consideration of socioeconomic factors (e.g., population and GDP) has revealed that the magnitude of both the population and the economic assets exposed to extreme heavy precipitation within the basin has increased rapidly (Zhan L. F. et al., 2019).
This study confirmed the above conclusions and further discussed the reasons for and the contribution rates of the increased population and GDP exposure. Moreover, with consideration of historical disaster data, the extreme precipitation adaptation capacity of the Poyang Lake Basin in different decades was discussed quantitatively.
On the basis of daily observation data from 1961 to 2020, this study determined that the frequency and intensity of extreme precipitation, and the area impacted by such precipitation events, have increased, with the greatest rate of increase in extreme precipitation occurring in the most recent 10 years.
From 1961 to 2020, population and GDP exposure also increased, but the driving factors were not the same. From the perspective of changing population exposure, whether positive or negative, climate has always been the leading influencing factor. From the GDP perspective, the economic development factor has always been the dominating factor, constituting an effect far stronger than that of climatic factors.
Construction of intensity–loss rate curves for economic losses in different decades in the Poyang Lake Basin revealed that economic vulnerability has declined. In the other words, the adaptation capacity of the basin has increased. Thus, under the same intensity of extreme precipitation, the proportion of disaster losses would be substantially reduced.
The outcomes of this study will be useful for better understanding the characteristics variation in both of extreme precipitation and adaptation capacity within the Poyang Lake Basin under the continued effects of climate change.
Data availability statement
Publicly available datasets were analyzed in this study. This data can be found here: All meteorological data used in this study were provided by the China Meteorological Administration (http://data.cma.cn/, accessed on 15 March 2022). Direct requests for these materials may be made to the provider.
Author contributions
MZ led the conception and design of the study. MZ and JX led the literature review. MZ and QW led the description and analysis of the case studies. QW and LZ led the data analysis and mapping. All authors contributed to the development of ideas and to the interdisciplinary reflection process.
Funding
The research consortium to which the authors belong is funded by the Key Project of the Science and Technology. Department of Jiangxi Province (20223BBG71019) and the Natural Science Foundation of Jiangxi Province (20202BABL203036).
Conflict of interest
The authors declare that the research was conducted in the absence of any commercial or financial relationships that could be construed as a potential conflict of interest.
Publisher’s note
All claims expressed in this article are solely those of the authors and do not necessarily represent those of their affiliated organizations, or those of the publisher, the editors and the reviewers. Any product that may be evaluated in this article, or claim that may be made by its manufacturer, is not guaranteed or endorsed by the publisher.
References
Andreadis, K. M., Clark, E. A., Wood, A. W., Hamlet, A. F., and Lettenmaier, D. P. (2005). Twentieth century drought in the conterminous United States. J. Hydrometeor. 6, 985–1001. doi:10.1175/JHM450.1
Brklacich, M., and Bohle, H.-G. (2006). “Assessing human vulnerability to global climatic change,” in Earth system science in the anthropocene. Editors E. Ehlers, and T. Krafft (Berlin, Germany: Springer), 51–61.
Cardona, O. D. (1990). Terminología de Uso Común en Manejo de Riesgos. AGID Reporte No.13, Escuela de Administración, Finanzas, y Tecnología. Medellín, Colombia.
China Meteorological Administration (2020). China meteorological disaster yearbook. Beijing, China: China Meteorological Press. 1984.
Fouillet, A., ReyLaurent, G. F., Pavillon, G., Bellec, S., and Guihenneuc-Jouyaux, C. (2006). Excess mortality related to the August 2003 heat wave in France. Int. Archives Occup. Environ. Health 80 (1), 16–24. doi:10.1007/s00420-006-0089-4
Gray, C. L., and Mueller, V. (2012). Natural disasters and population mobility in Bangladesh. Proc. Natl. Acad. Sci. U. S. A. 109, 6000–6005. doi:10.1073/pnas.1115944109
Guo, H., Jiang, T., and Wang, G. J. (2006). Climate change tendency and analysis on abrupt climate change in Poyang Lake Basin from 1961 to 2003. J. Lake Sci. 18, 443–451.
Haer, T., Kalnay, E., Kearney, M., and Moll, H. (2013). Relative sea-level rise and the conterminous United States: Consequences of potential land inundation in terms of population at risk and GDP loss. Glob. Environ. Chang. 23, 1627–1636. doi:10.1016/j.gloenvcha.2013.09.005
Hirabayashi, Y., Mahendran, R., Koirala, S., Konoshima, L., Yamazaki, D., Watanabe, S., et al. (2013). Global flood risk under climate change. Nat. Clim. Chang. 3, 816–821. doi:10.1038/nclimate1911
Huang, D., Zhang, L., and Gao, G. (2016). Changes in population exposure to high temperature under a future scenario in China and its influencing factors. Acta Geogr. Sin. 71 (7), 1189–1200. doi:10.11821/dlxb201607008
Huang, J. L., Zhai, J. Q., Jiang, T., Wang, Y., Li, X., Wang, R., et al. (2017). Analysis of future drought characteristics in China using the regional climate model CCLM. Clim. Dyn. 50, 507–525. doi:10.1007/s00382-017-3623-z
IPCC (2013). Climate change 2013: The physical science basis. Contribution of working group I to the fifth assessment report of the intergovernmental panel on climate change. Cambridge, NY, USA: Cambridge University Press, 8–10.
IPCC (2014). Climate change 2014: Impacts, adaptation and vulnerability. Contribution of working group II to the fifth assessment report of IPCC the intergovernmental panel on climate change, 5–6. Cambridge, NY, USA: Cambridge University Press.
IPCC (2012). Managing the risks of extreme events and disasters to advance climate change adaptation: A special report of working groups I and II of the intergovernmental panel on climate change. Cambridge, NY, USA: Cambridge University Press, 2–18.
Jiang, T., Su, B. D., Huang, J. L., Zhai, J., Xia, J., Tao, H., et al. (2020) Each 0.5°C of warming increases annual flood losses in China by more than US$60 billion. Bull. Am. Meteorological Soc. 101 (8), 1464–1474. doi:10.1175/bams-d-19-0182.1
Jing, C., Jiang, T., Wang, Y. J., Chen, J., et al. (2016). S.U. A study on regional extreme precipitation events and the exposure of population and economy in China. Acta Meteorol. Sin. 74, 572–582.
Jongman, B., Ward, P. J., and Aerts, J. C. (2012). Global exposure to river and coastal flooding: Long term trends and changes. Glob. Environ. Chang. 22, 823–835. doi:10.1016/j.gloenvcha.2012.07.004
New, M., Hulme, M., and Jones, P. (2000). Representing twentieth-century space-time climate variability. Part II: Development of 1901–96 monthly grids of terrestrial surface climate. J. Clim. 13, 2217–2238. doi:10.1175/1520-0442(2000)013<2217:rtcstc>2.0.co;2
New, M., Hulme, M., and Jones, P. (1999). Representing twentieth-century space–time climate variability. Part I: Development of a 1961–90 mean monthly terrestrial climatology. J. Clim. 12, 829–856. doi:10.1175/1520-0442(1999)012<0829:rtcstc>2.0.co;2
Qin, D., Zhang, J., Shan, C., and Song, L. (2015). China national assessment report on risk management and adaptation of climate extremes and disasters. Beijing, China: Science Press, 62.
Sheffield, J., Andreadis, K. M., Wood, E. F., and Lettenmaier, D. P. (2009). Global and continental drought in the second half of the twentieth century: Severity–area–duration analysis and temporal variability of large-scale events. J. Clim. 22, 1962–1981. doi:10.1175/2008JCLI2722.1
Su, B. D., Huang, J. L., Thomas, F., Wang, Y., Kundzewicz, Z. W., Zhai, J., et al. (2018). Drought losses in China might double between the 1.5°C and 2.0°C warming. PNAS 115 (42), 10600–10605. doi:10.1073/pnas.1802129115
Sun, S. L., Chen, H. S., Ju, W. M., Yu, M., Hua, W., and Yin, Y. (2014). On the attribution of the changing hydrological cycle in Poyang Lake Basin, China. J. Hydrology 514, 214–225. doi:10.1016/j.jhydrol.2014.04.013
UNISDR (2009). Terminology on disaster risk reduction. Geneva, Switzerland: United Nations International Strategy for Disaster Reduction. Available at: unisdr.org/eng/library/lib-terminology-eng.htm.
Wang, H. Q., Zhao, G. N., and Peng, J. (2009). Precipitation characteristics over five major river systems of Poyang drainage areas in recent 50 years. Resour. Environ. Yangtze Basin 18, 615–619.
Wang, Y. Y., Wang, Y. J., and Jiang, T. (2015). Spatial-temporal characteristics of flood disaster exposure and vulnerability in Jiangsu province. J. Yangtze River Sci. Res. Inst. 33, 27–32.
Wu, J., and Gao, X. J. (2013). A gridded daily observation dataset over China region and comparison with the other datasets. Chin. J. Geophys. 56, 1102–1111.
Wu, Q., Xu, B., and Zhan, M. J. (2021). Intraseasonal evolution and climatic characteristics of hourly precipitation during the rainy season in the Poyang Lake Basin, China. China 12 (1), 1931–1947. doi:10.1080/19475705.2021.1953619
Wu, Q., and Zhan, M. J. (2020). Climatic characteristics of hourly precipitation (1978–2019) in the Poyang Lake Basin, China. Geomatics, Nat. Hazards Risk 11 (1), 1679–1696. doi:10.1080/19475705.2020.1809535
Xu, Y., Gao, X., Shen, Y., Xu, C., Shi, Y., and Giorgi, F. (2009). A daily temperature dataset over China and its application in validating a RCM simulation. Adv. Atmos. Sci. 26, 763–772. doi:10.1007/s00376-009-9029-z
Yuan, Z., Yang, Z., Yan, D., and Yin, J. (2015). Historical changes and future projection of extreme precipitation in China. Appl. Clim. 3, 1–15.
Zhai, J. Q., Huang, J. L., Su, B. D., Cao, L., Wang, Y., Jiang, T., et al. (2017). Intensity–area–duration analysis of droughts in China, 1960–2013. Clim. Dyn. 48, 151–168. doi:10.1007/s00382-016-3066-y
Zhan, L. F., Wang, Y. J., Sun, H. M., Zhai, J., and Zhan, M. (2019). Study on the change characteristics of and population exposure to heatwave events on the north China plain. Adv. Meteorology 19 (4), 1–10. doi:10.1155/2019/7069195
Zhan, M. J., ZhaiSun, J. Q. H. M., Li, X., and Xia, L. (2019). Observed exposure of population and gross domestic product to extreme precipitation events in the Poyang Lake Basin, China. Atmosphere 10 (12), 817. doi:10.3390/atmos10120817
Keywords: extreme precipitation events, exposure, vulnerability, contribution rate, intensity-loss rate curve, IAD method
Citation: Zhan M, Wu Q, Zhan L and Xin J (2023) Change in extreme precipitation events: Exposure and vulnerability in the Poyang Lake Basin, China. Front. Earth Sci. 11:1125837. doi: 10.3389/feart.2023.1125837
Received: 16 December 2022; Accepted: 07 March 2023;
Published: 16 March 2023.
Edited by:
Jinlong Huang, Nanjing University of Information Science and Technology, ChinaReviewed by:
Chao Gao, Ningbo University, ChinaHui Tao, Xinjiang Institute of Ecology and Geography (CAS), China
Copyright © 2023 Zhan, Wu, Zhan and Xin. This is an open-access article distributed under the terms of the Creative Commons Attribution License (CC BY). The use, distribution or reproduction in other forums is permitted, provided the original author(s) and the copyright owner(s) are credited and that the original publication in this journal is cited, in accordance with accepted academic practice. No use, distribution or reproduction is permitted which does not comply with these terms.
*Correspondence: Mingjin Zhan, aGVsbG9ybUAxMjYuY29t