 Ningyuan Zhao
94% of researchers rate our articles as excellent or good
Learn more about the work of our research integrity team to safeguard the quality of each article we publish.
Find out more
ORIGINAL RESEARCH article
Front. Earth Sci., 18 January 2023
Sec. Solid Earth Geophysics
Volume 11 - 2023 | https://doi.org/10.3389/feart.2023.1123711
This article is part of the Research TopicPre-, Co-, and Post-Seismic Processes of Recent Earthquakes in Mainland ChinaView all 9 articles
In recent years, earthquakes have occurred frequently on the southeastern edge of the Tibetan Plateau, and the seismic hazard is high. However, because of the remote location of the Ganzi-Yushu fault zone, no high-resolution geodetic measurements of this region have been made. The radar line-of-sight deformation field of the Ganzi-Yushu fault was obtained using seven-track ascending and descending Sentinel-A/B interferometric synthetic aperture radar (InSAR) data from 2014 to 2020. Using the InSAR and published Global Navigation Satellite System (GNSS) data, we calculated the 3D deformation field in the study area, investigated the segment-specific fault slip rate, and inverted the fault slip distribution pattern using the steepest descent method. We then evaluated the seismic hazard using the strain rate field and slip deficit rate. The main findings of this study include the following. 1) The slip rate of the Ganzi-Yushu fault gradually increases from 2.5 to 6.8 mm/yr from northwest to southeast. 2) A high-resolution strain rate map shows high-value anomalies in the Yushu and Dangjiang areas. 3) Our comprehensive analysis suggests that the seismic hazard of the Dangjiang and Dengke segments with high slip deficits cannot be ignored.
The Ganzi-Yushu fault is located in the transition zone from the eastern edge of the Tibetan Plateau to its hinterland; geotectonically it lies along the Xijinwulanhu-Jinshajiang suture zone remaining after the closure of the Paleo-Tethys Ocean. To the north of this suture zone is the Songpan-Ganzi terrane, and to the south is the Qiangtang block. The Songpan-Ganzi terrane is an orogenic belt that has experienced long-term evolution since the Mesozoic. It was separated from Laurasia by the Animaqing suture zone to the north and is adjacent to the Qiangtang block on the periphery of Gondwana to the southwest, where the Yidun Arc collision zone (including the Jinshajiang and Ganzi-Litang suture zones) form the boundary. It is connected to the Yangtze craton to the southeast by the Longmen and Jinping Mountains. Its overall shape is that of an irregular inverted triangle. The Qiangtang block is connected to the Songpan-Ganzi terrane to the north and adjacent to the Lhasa terrane to the south, where the Bangonghu-Nujiang suture zone forms the boundary. It is further divided into the North Qiangtang and South Qiangtang blocks by the Longmucuo-Shuanghu suture zone (Dewey et al., 1988; Kapp et al., 2005; 2003; Zhu et al., 2011).
Since the Cenozoic, several large strike-slip faults have been formed or reactivated within the Tibetan Plateau by the ongoing India-Asia convergence (England et al., 1986; Wen et al., 2003). They include the Xianshuihe-Xiaojiang fault on the southeastern margin of the Tibetan Plateau, which has a total length of more than 1,600 km. The Ganzi-Yushu fault is a subordinate fault of the Xianshuihe-Xiaojiang fault (King et al., 1997; Shen et al., 2005; Wang et al., 2000). The Ganzi-Yushu and Xianshuihe faults form a left stepover near Ganzi County and jointly constitute the boundary between the active Bayanhar block and Qiangtang-Sichuan-Yunnan block (Liu et al., 2013). These blocks correspond to the Songpan-Ganzi and Qiangtang blocks, respectively, according to geotectonic studies. Because of differential motion between the active Bayanhar block and Qiangtang-Sichuan-Yunnan block, both the Xianshuihe and Ganzi-Yushu faults have been dominated by considerable left-lateral strike-slip movements since the Late Quaternary (Qidong et al., 2010). This differential motion directly controls the preparation and occurrence of strong earthquakes on the fault (Gan et al., 2007; Zhang et al., 2013) (Figure 1).
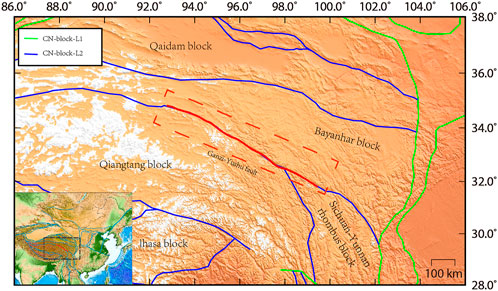
FIGURE 1. Tectonic map of Ganzi-Yushu fault zone. The red line is the Ganzi-Yushu fault.
The Ganzi-Yushu fault passes through a sparsely inhabited region with a poor transportation system. Thus, this fault has not been as thoroughly explored as the Xianshuihe fault. The earliest study on the Ganzi-Yushu fault was performed by (Wen et al., 1985). They conducted a preliminary analysis of the kinematic properties of the fault segment from Ganzi to Yushu using the geological survey results and remote sensing images available at that time. They proposed that this large fault characterized by intense left-lateral strike-slip movements was formed in the Mesozoic and has developed until today. Although it is agreed that the Ganzi-Yushu fault has been a left-lateral strike-slip fault since the Quaternary, the reported segment-specific slip rates differ significantly. Some researchers believe that the horizontal slip rate of the fault decreases continuously from the Dangjiang segment to the Ganzi segment, whereas others suggest that the slip rate decreases from the Ganzi segment toward the northwest (Zhou et al., 1996; Wen et al., 2003; Wen et al., 2003; Xu et al., 2003; Peng et al., 2006). Moreover, the slip rate values along the Ganzi-Yushu fault obtained before the 2010 Yushu earthquake are generally larger than those calculated after 2010 (Lin et al., 2011; Y. Wang et al., 2011; Wu et al., 2014; Shi et al., 2016). Therefore, current studies focus on the slip rate distribution along the entire Ganzi-Yushu fault and the variation of the kinematic characteristics of the fault. These topics deserve further exploration and discussion.
In addition, it is generally believed that tectonic movements in the Ganzi-Yushu fault zone are relatively intense in the present day and that strain energy is still accumulating in the fault zone after the 2010 Yushu earthquake. Hence, it is necessary to determine whether there is still a hazard of large earthquakes and whether some fault segments have an exceptionally high seismic hazard (Chevalier et al., 2018; Xu et al., 2017).
In this study, we processed multi-track ascending and descending Sentinel-1 InSAR data from 2014 to 2020 to obtain high-spatial-resolution deformation velocity data for the entire Ganzi-Yushu fault zone. The high-resolution 3D deformation field of the Ganzi-Yushu fault zone was calculated by integrating two methods, and the segment-specific fault slip rate was analyzed in combination with the GNSS inverse tangent results. We adopted the steepest descent method (SDM) model to invert the fault slip rates and obtained the high-resolution strain field from the 3D deformation field to identify areas with seismic hazard in the Ganzi-Yushu fault zone.
Because the study area is large, we used multi-track Sentinel-1 data rather than single-track satellite data to calculate the deformation field. We collected data from ascending tracks A70, A172, and A99 and descending tracks D77, D4, D106, and D33 with a total of 758 images taken from 2014 to 2020 for the area between 92 and 101.7°E. Table 1 lists detailed information on the data processing applied to each track, and Figure 2 show maps of the study area (Zhang et al., 2022b).
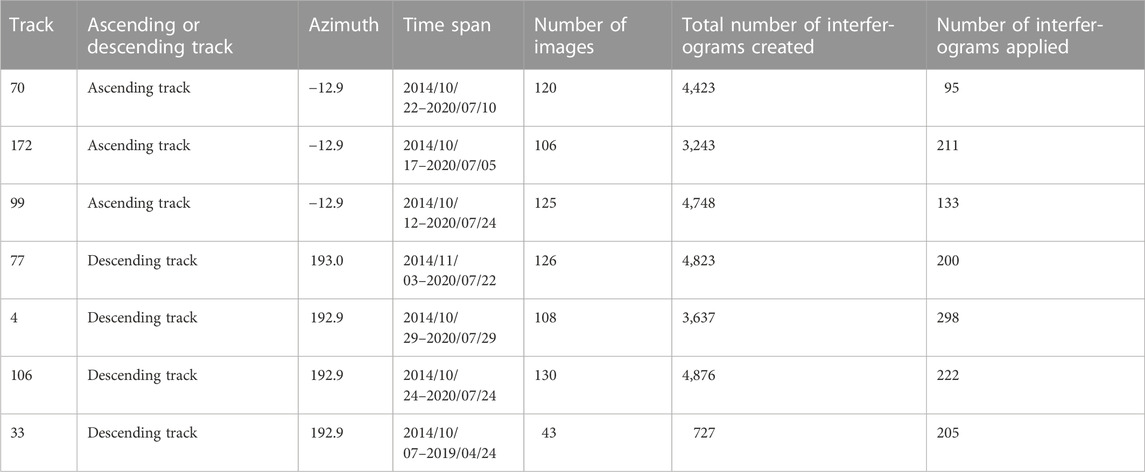
TABLE 1. Information on Sentinel-1 data used in this study.
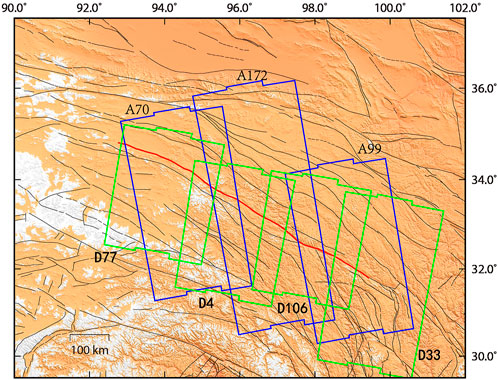
FIGURE 2. Regions monitored by ascending and descending tracks of Sentinel-1. blue and green rectangles indicate areas covered by ascending and descending Sentinel-1 images.
We processed the satellite images using the GAMMA software (Werner et al., 2000)and obtained 26,477 interferograms in total. To improve the alignment accuracy of the SAR images, we adopted an external geological dataset as the digital elevation model (the Shuttle Radar Topography Mission digital elevation model) to calibrate the effects of interferometric phase on the topographic mapping performance. As the study area is located in western China, filtering and multi-look processing are required to reduce the effects of vegetation and climate and improve the InSAR coherence. We set the multi-look factor to 120:30 and applied Goldstein’s filtering method to enhance the coherent phase (Goldstein et al., 1998). The interference phase was unwrapped using the minimum-cost flow algorithm, where the consistently coherent points near the fault were selected as reference pixels (Liu et al., 2022). To eliminate local phase unwrapping ambiguities, we filtered out doubtful phases in the spatial domain and picked up pixels with large phase deviations (<−2.8 and >2.8 radians) for comparison with the unwrapped, unfiltered phases. These pixels were marked as heavily unwrapped and added or subtracted with 2π integer ambiguities. Data errors can be effectively eliminated by performing these steps iteratively.
Atmospheric delays are the largest source of errors in radar image processing (Doin et al., 2009). Therefore, we used the Generic Atmospheric Correction Online Service to mitigate the tropospheric errors in this study (Yu et al., 2018).
We chose the interferograms according to four criteria to improve the signal-to-noise ratio. 1) Considering the rough topography of the study area, we selected a spatial baseline (interval between adjacent tracks) of less than 100 m. Image pairs with a temporal baseline of more than 300 days were selected to maximize the deformation signal. 2) Considering the vegetation cover in different seasons and climate effects, we chose mainly images captured from October to May 2014–2020, when there was relatively sparse vegetation in the study area, to improve the SAR image quality and the coherence between image pairs. 3) Coseismic deformation should be eliminated. For the epicentral areas of the 2016 M6.2 earthquake in Zaduo County, Yushu, Qinghai Province, and the M5.5 earthquake in Dingqing, Tibet, within the coverage of the tracks, we selected only SAR images captured after 2016 for slip rate calculations to eliminate the traces of coseismic deformation. 4) We discarded interferograms severely affected by atmospheric delays or unwrapping errors that cannot be effectively mitigated. After applying the above constraints, we retained 1,364 differential interferograms for the seven tracks in this study (Figure 3; Table 1).
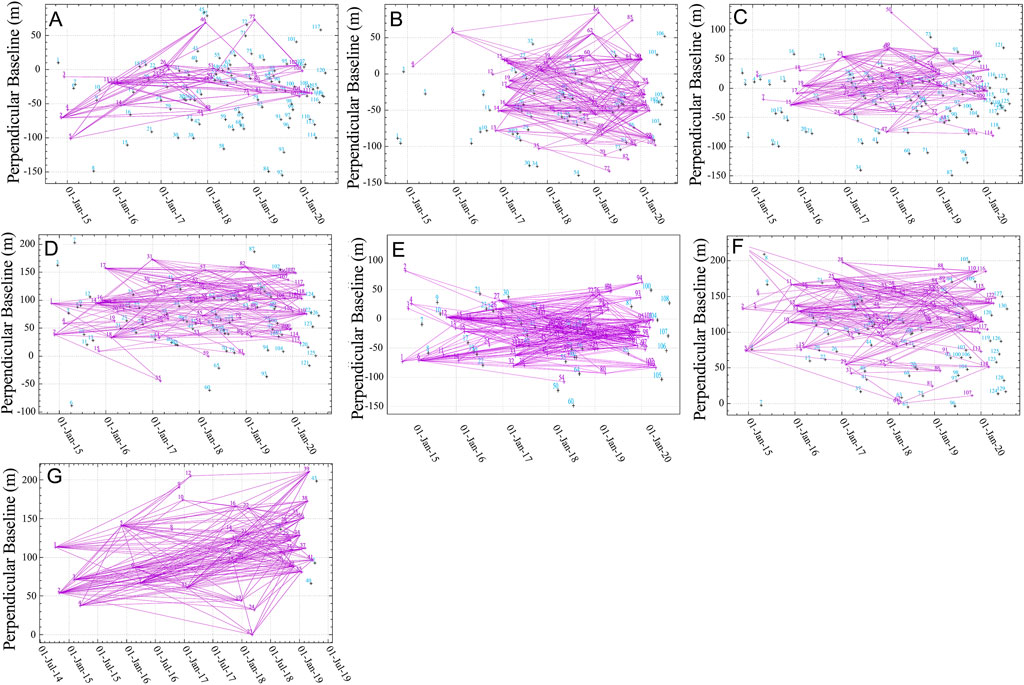
FIGURE 3. Distribution of temporal and spatial baselines of interferograms for tracks (A) A70, (B) A172, (C) A99, (D) D77, (E) D4, (F) D106, and (G) D33. The crosses with purple labels denote images used for velocity calculation, whereas the crosses with cyan labels represent other images. The purple lines indicate the generated interferograms.
Figure 4 shows the InSAR line-of-sight (LOS) velocity maps for the ascending and descending tracks, which were generated after stitching the coverage of the seven tracks. The InSAR results cover the entire Ganzi-Yushu fault zone and span approximately 750 km. According to the obtained deformation field, the velocity fields on both sides of the fault are characterized by pronounced differential motion along the fault. Negative values are indicated by yellow and red in the maps and represent displacement away from the satellite, whereas positive values appear in blue and green and represent displacement toward the satellite. The right-looking Sentinel-1 satellite map shows that the fault is left-lateral, in agreement with reported research. Note that the coseismic deformation fields of two earthquakes, the 2016 M6.2 earthquake in Zaduo County, Yushu, Qinghai Province, and the M5.5 earthquake in Dingqing, Tibet, can be identified from the velocity field in Figure 4A. Although we used only 2016 data for A70, most interferograms cross the coseismic moments; thus, these two deformation fields could not be completely eliminated. The velocity fields obtained using the ascending and descending InSAR data generally show good coherence, but significant decoherence occurs in the northwestern part of the velocity field, mainly in the regions covered by A70 and D77. The reason is that the central and southeastern parts of the study area had suitable weather, vegetation, and topographic conditions, whereas the results in the northwestern region are severely affected by vegetation cover. The entire Ganzi-Yushu fault zone is included in the spatial coverage of the entire dataset. In addition; Figure 4A clearly shows that the slip rate is significantly high at the location covered by track A172, hundreds of kilometers from the fault, which is thought to be a deformation feature related to the activity of the East Kunlun fault zone (Li et al., 2004). In Figure 4B, a region with significantly high displacement velocities appears near the eastern tip of the fault within the coverage of track D33, which is also the intersection of the studied fault and the northwestern segment of the Xianshuihe fault. The Xianshuihe fault is also characterized by left-lateral strike-slip motion. In addition, the displacement features at some positions far from the fault in the figure are inconsistent with a left-lateral strike-slip fault, typically because of data errors or other crustal movements unrelated to the Ganzi-Yushu fault.
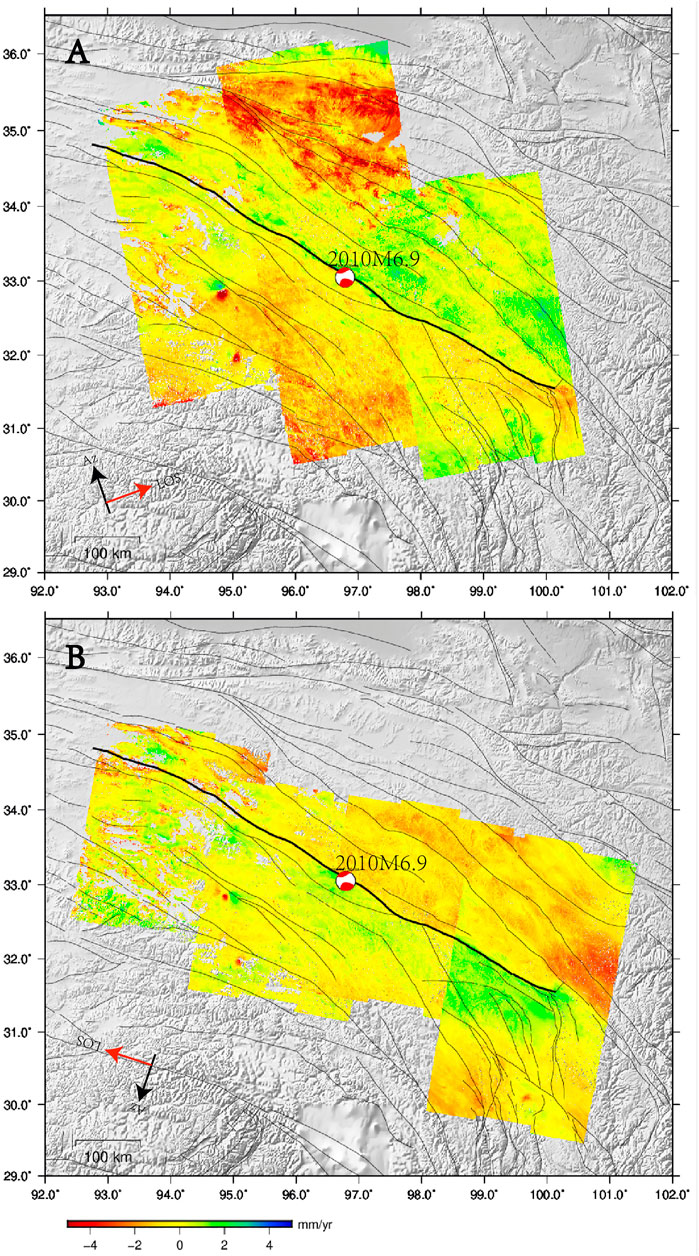
FIGURE 4. InSAR LOS velocity fields for (A) ascending tracks A70, A172, and A99 and (B) descending tracks D77, D4, D106, and D33. The black line is the Ganzi-Yushu fault.
Because InSAR is a relative measurement technique, it would be difficult to evaluate the stability of reference points for the InSAR results of the study area without a priori knowledge. Therefore, the InSAR measurement results could deviate from the benchmarks to a certain extent in actual situations, affecting the precision of their expression but not the measurement accuracy. In this study, we applied the GNSS data mentioned above to evaluate the external accordant accuracy of the InSAR measurements and control the benchmarks (Wang et al., 2020).
First, the benchmark coordinates of the two measurement results must be unified. Before benchmark control, both the InSAR and GNSS datasets were geocoded for comparison under the same reference frame. The coordinate system of the InSAR results was first converted to the WGS84 coordinate system, and then the InSAR measurements corresponding to the GNSS station coordinates were selected for comparison. The approach taken in this study assumes that there are no significant vertical velocity signals (Ji et al., 2020). The orientation of the horizontal GNSS data (north and east components) was first converted to the LOS directions using the following equation.
where
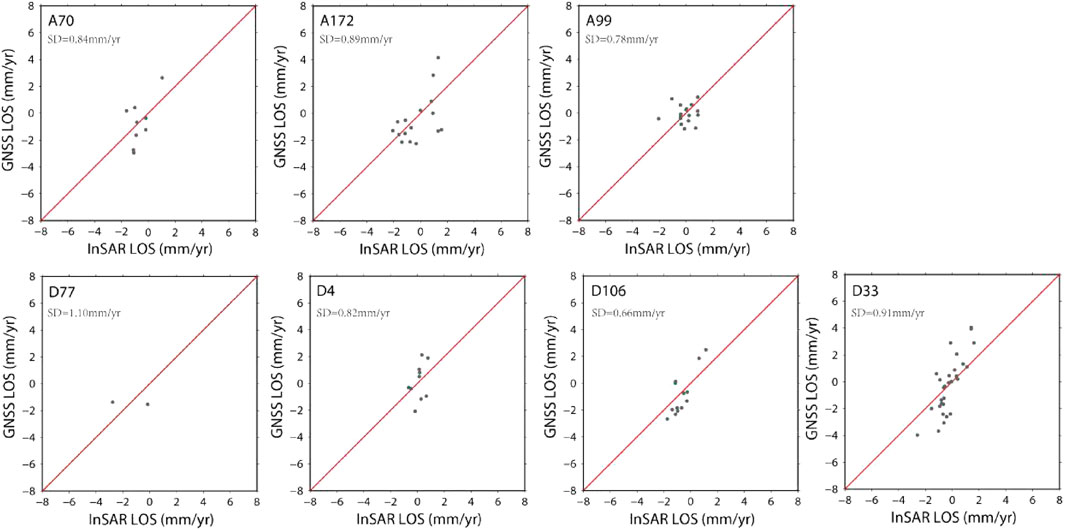
FIGURE 5. Scatter plots of InSAR and GNSS LOS deformation.
We followed the method of Shen et al. (2020) to obtain the 3D deformation field for the Ganzi-Yushu fault zone using the integrated GNSS and InSAR dataset and analyzed the regional deformation characteristics. In particular, we explored the deformation features in the vertical direction, because previous researchers generally reported that vertical deformation is limited in the left-lateral strike-slip Ganzi-Yushu fault zone.
The GNSS velocity field was first interpolated to generate continuous vector gridded data based on the locations of GNSS stations. The GNSS velocity field around the Ganzi-Yushu fault zone (Wang et al., 2020) was interpolated using the method of Shen et al. (2015), which uses a Gaussian formula, quadratic distance weighting function, and spatial or azimuthal weighting function for Voronoi cells. Next, the InSAR velocity field was converted to the same reference frame as the GNSS velocity field, and velocity field integration was finally completed using the least-squares method. The observation equation of the integrated dataset is as follows.
where V is the interpolated GNSS velocity field; S is the InSAR LOS velocity field; U is the three-component (north-south, east-west, and vertical) velocity matrix; P is the geometric parameter matrix of the SAR satellite images; K is the deskewing matrix; R represents the offset correction and deskewing of SAR satellite data; and
The integrated velocity field is shown in Figure 6, where the east-west, north-south, and vertical components are plotted separately. Figures 6A, B show obvious east-west motion on both sides of the fault, which is consistent with the left-lateral strike-slip nature of the fault. Moreover, the eastward velocity component is apparently weakened southeast of Ganzi. These results, in combination with the north-south velocity component pattern, clearly reveal that the slip direction rotates at the intersection of the Ganzi-Yushu and Xianshuihe faults, which further confirms the kinematic characteristic that the left-lateral strike-slip Ganzi-Yushu fault and the Qiangtang block rotate southward at this intersection.
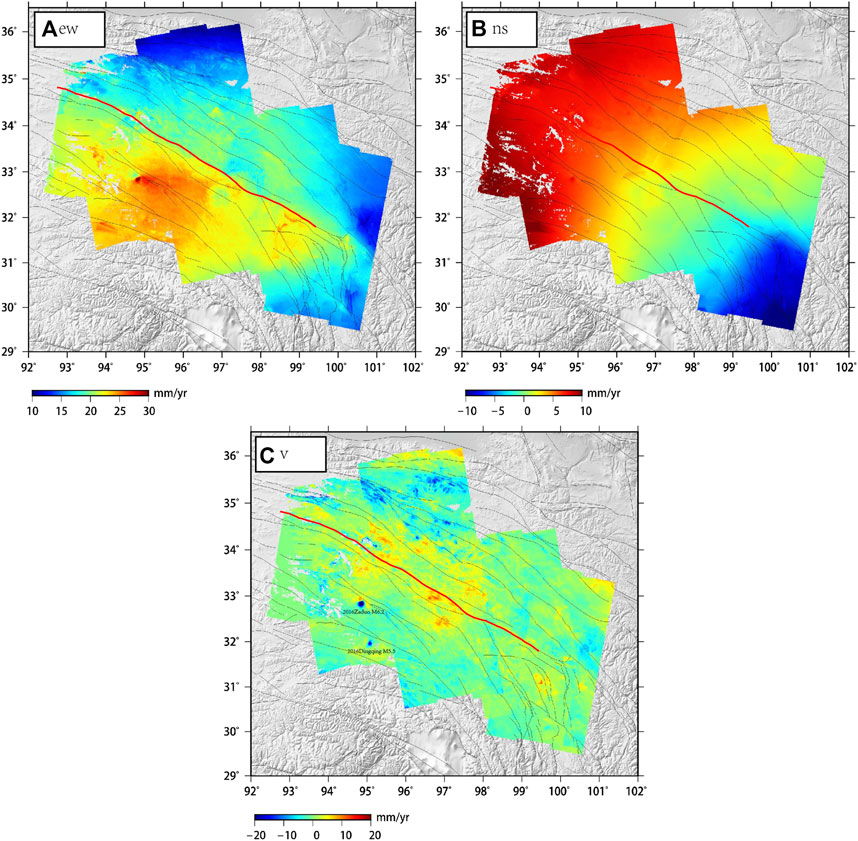
FIGURE 6. Velocity fields of Ganzi-Yushu fault zone: (A) east-west, (B) north-south, and (C) vertical components. Positive values indicate motion toward the east in (A) and north in (B).
Figure 6C shows the vertical velocity field around the Ganzi-Yushu fault zone. Although the InSAR and GNSS velocity fields were integrated, the GNSS velocity field contains only horizontal velocity components. Consequently, Figure 6C has certain errors related to the InSAR data in addition to the vertical velocity information and vertical velocity errors. Because the velocity fields in Figures 6A, B are essentially the same as the GNSS and InSAR velocity fields presented above, the errors in Figure 6C are relatively small and have little effect on the vertical velocity field. Thus, these errors can be ignored. The vertical velocity field pattern in the figure reveals an absence of regular vertical ground motion in the Ganzi-Yushu fault zone, which is essentially in agreement with previous study results. This finding also confirms that it was reasonable to neglect the vertical velocities in the Ganzi-Yushu fault zone in previous studies. Specific vertical velocity components can be identified at the epicenter of the Yushu earthquake, which are believed to be post-seismic effects of the Yushu earthquake. In addition, the figure reveals two obvious anomalies associated with the 2016 M6.2 earthquake in Zaduo County, Yushu, Qinghai Province, and the M5.5 earthquake in Dingqing, Tibet; the apparent vertical motion in the vertical velocity field map is caused by these two normal fault earthquakes.
To further analyze the segment-specific kinematic characteristics of the Ganzi-Yushu fault, we divided the Ganzi-Yushu fault into four segments, the Ganzi-Zhuqing, Dengke, Yushu, and Dangjiang segments, with reference to previous studies (Zhou et al., 1996), and analyzed their cross-fault GNSS velocity profiles.
The present-day slip rates and kinematic characteristics of the Ganzi-Yushu fault are essential for analyzing the mechanism of the eastward expansion of the Tibetan Plateau and assessing seismic hazard. In this study, we used the integrated InSAR-GNSS deformation field to calculate the present-day slip rates, as the integrated deformation field has higher spatial resolution and reliability. When studying the slip rate variations along the fault, we modeled the interseismic deformation as a horizontal screw dislocation on the fault in an elastic half-space. The present-day slip rate was fitted using the following screw dislocation model (SAVAGE et al., 1973):
where
The fault-parallel displacement rates can be calculated directly from the integrated InSAR-GNSS deformation field, and the results are close to reality. Thus, we calculated the slip rate of the Ganzi-Yushu fault using the screw dislocation model. For the 3D deformation field whose orientation has been converted to fault-parallel, the deformation rate is calculated as follows.
where
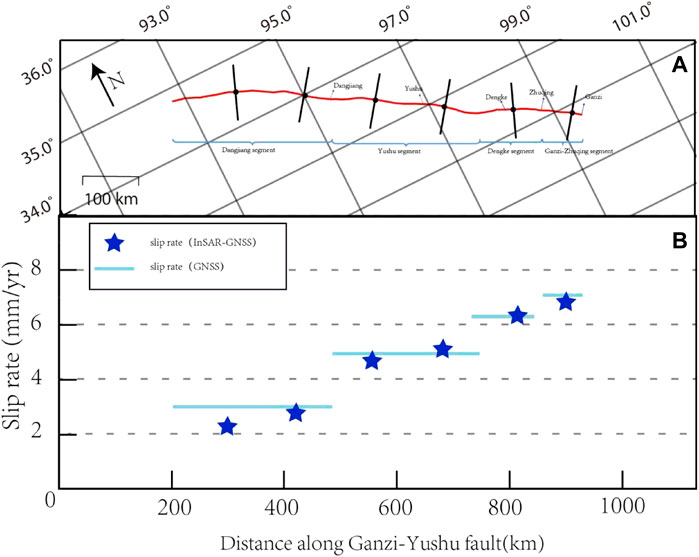
FIGURE 7. Slip rate distribution along the Ganzi-Yushu fault: (A) locations of cross-fault profiles. (B) slip rate distributions. Screw dislocation model fitting results using faultparallel velocity profiles from the InSAR-GNSS-integrated horizontal (blue stars). The thick blue lines are estimated slip rates from GNSS velocities alone.
Figure 7B shows that the obtained slip rates are consistent with the GNSS horizontal velocity field results (Wang et al., 2020). Moreover, because of the high spatial resolution of the InSAR data, slip rate variations can be precisely identified, and the slip rate results are more reliable. The figure shows that the rates of strike-slip motion in some profiles differ from those in the GNSS results (Jiang et al., 2022). The reason may be that the slip rates along the Ganzi-Yushu fault are affected by multiple faults at different seismogenic stages, and thus the near- and far-field ground motion patterns are inconsistent. In summary, the slip rates obtained in this study can more accurately describe the current motion of the Ganzi-Yushu fault.
Figure 7 reveals that the slip rate of the Ganzi-Yushu fault varies significantly between segments, and the slip rate gradually increases from 2.5 to 6.8 mm/yr from northwest to southeast. The slip rate is lowest along the fault from Fenghuoshan to the Dangjiang segment, at 2.5–3.0 mm/yr, which is lower than the results of Peng et al. (2006); Zhou et al. (1996), which were obtained using geological methods. The slip rate along the Yushu segment is approximately 4.5–5.3 mm/yr, which is similar to the value of 5.2 mm/yr provided by Wu et al. (2014) using geological methods but lower than the InSAR slip rate of 6.4 mm/yr measured by Liu et al. (2011) before the Yushu earthquake. The difference between these two results may originate from the differences in the time span of the SAR data. The left-lateral slip rate is approximately 6.3 mm/yr along the Dengke segment and increases to 6.8 mm/yr along the Ganzi-Zhuqing segment, in excellent agreement with the left-lateral slip rate of 6.6 ± 1.5 mm/yr obtained by Y. Wang et al. (2011) using GNSS data. In addition, Wen et al. (2003); Xu et al. (2003) found a slip rate of 12–14 mm/yr from geological results, which is much higher than the slip rate obtained in the present study. The reasons for these discrepancies may be that the results of geologic slip rate measurements span multiple seismic cycles and that coseismic effects cannot be eliminated. By contrast, geodetic measurements using either InSAR or GNSS cover only a short time period; thus, the integrated InSAR-GNSS deformation field corresponds to only the current seismic cycle. Furthermore, uncertainties in the geologic and geodetic observation models may also result in differences in slip rate results (Ji et al., 2020).
We used the InSAR data for inversion because the InSAR deformation field can accurately represent near-field deformation changes. We further inferred the slip rate pattern along the entire Ganzi-Yushu fault during the interseismic period. During the inversion, we first set the fault geometry and determined the modeling method. Then, the velocity was inverted under the constraint of the InSAR results, and the linear superposition of rectangular dislocations in the layered crust model was also considered. Finally, the modeling results were analyzed.
The SDM was used as the inversion method to determine the interseismic slip distribution along the Ganzi-Yushu fault (Bock et al., 2016; R. J. Wang et al., 2011). The SDM code has been widely applied to invert coseismic slip distributions for strong earthquakes (Liu et al., 2019; Wang et al., 2013). The method has also been used for inverting the interseismic slip deficit (Jouanne et al., 2017; Liu et al., 2018; Qiu et al., 2018).
The fault parameters and geometric properties were determined using available data and the surface fault trace. The geometry of the entire fault segment was approximated along the fault trend. According to the results of previous geological studies (Wu et al., 2014), the plane of the Ganzi-Yushu fault is nearly vertical overall. The dip angle of the fault plane was taken as 83° with reference to the orientation of the seismogenic fault of the 2010 Yushu earthquake. The total length of the fault is approximately 730 km, and the crust at depths of 0–20 km was taken as the seismogenic layer. According to the depth and position of local earthquake activity, the fault motion at each location was simulated on the basis of the fault structure. The crust below 20 km depth is regarded as a ductile layer, and the slip rate is constrained by simulating the far-field interseismic loading effect in the calculation. The inversion provides only the results for depths of 0–20 km, with a grid size of 4.86 × 3.5 km. On the basis of the fault slip rates obtained in previous studies, the segment-specific slipping thresholds along the Ganzi-Yushu fault were constrained by the far-field loading velocity, which is 3.1 mm/yr for the Dangjiang segment, 5.3 mm/yr for the Yushu segment, 6.3 mm/yr for the Dengke segment, and 6.8 mm/yr for the Ganzi-Zhuqing segment.
SDM is an iterative algorithm based on the constrained least-squares method. It can be used to solve the fault slip distribution from the InSAR interseismic deformation results.
where G is Green’s function, and H is the Laplace operator, a smoothing factor that balances the degrees of data misfit and model roughness. The value of
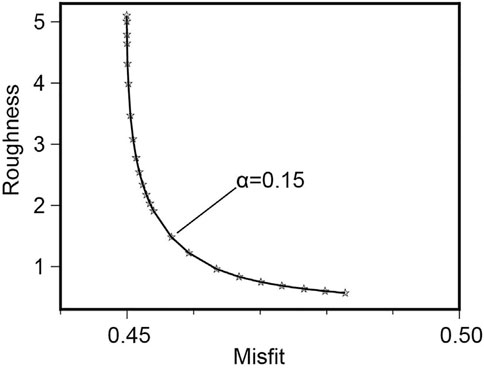
FIGURE 8. Trade-off curve between misfit and model roughness. The roughness values are normalized. The plus symbol corresponds to where the balance between the model misfit and smoothness is achieved, a smooth factor of 0.15 used for estimating the slip distributions.
Figures 9, 10 show the modeled interseismic slip distribution along the Ganzi-Yushu fault for the ascending and descending tracks, respectively. Panel a) shows the original results of each track, b) shows the modeling effect after SDM inversion, and c) shows the residuals. The residuals represent the differences between the observed and simulated interferograms. They indicate that the modeling results generally fit the fault deformation measurements well. Only the deformation results at a few points are poorly fitted. The residuals may result from errors in the InSAR velocity data, for example, incompletely removed atmospheric artifacts. These errors would not distort the slip distribution results significantly.
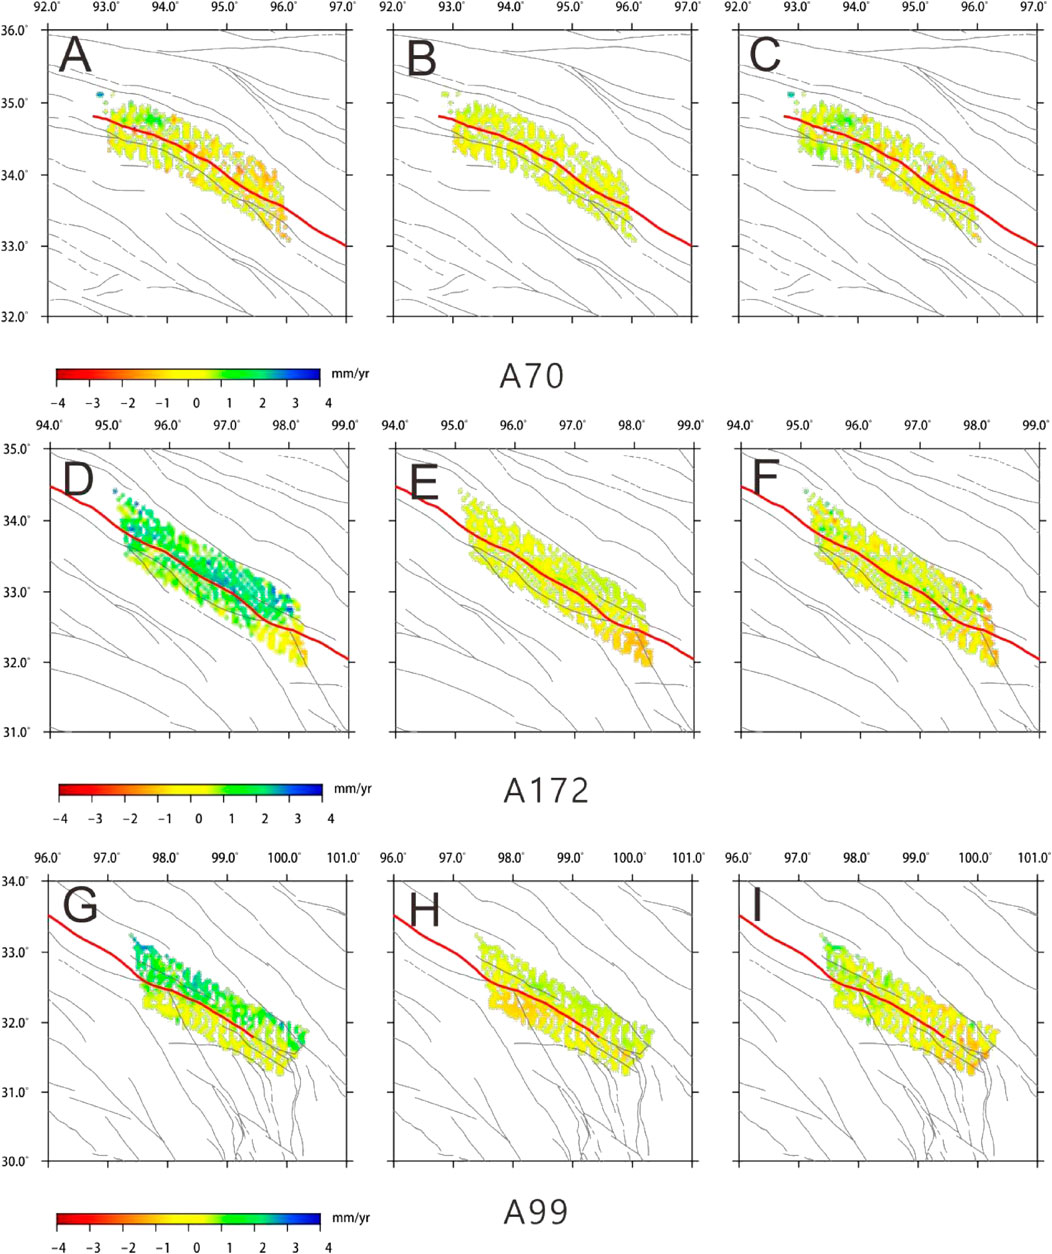
FIGURE 9. Modeling results obtained using ascending track data: (A, D, G) measured values, (B, E, H) simulated values, and (C, F, I) residuals.
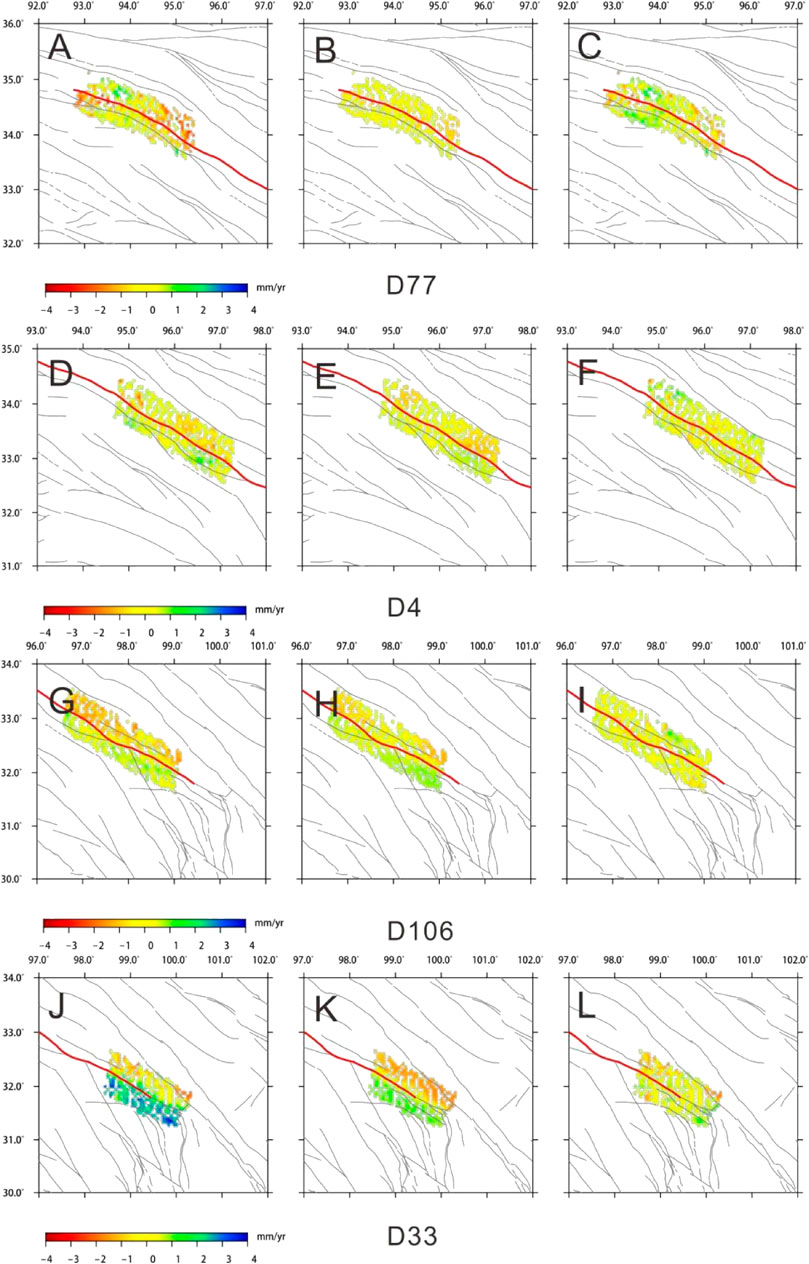
FIGURE 10. Modeling results obtained using descending track data: (A, D, G, J) measured values, (B, E, H, K) simulated values, and (C, F, I, L) residuals.
Figure 12 shows the 3D distribution of interseismic fault slip rates along the Ganzi-Yushu fault obtained by processing the InSAR results by SDM inversion. The rupture length of the 1738 Dangjiang earthquake is not clear because the earthquake occurred long ago in a remote area. We roughly estimated the rupture length according to the earthquake’s magnitude and impact range. Moreover, as the Dangjiang earthquake occurred nearly 300 years ago, its surface rupture is shown in gray in the figure. The four major earthquakes occurring on the fault since 1800 are also marked in the figure with different colors according to their rupture lengths and locations obtained from previous geological surveys. Darker colors indicate more recent rupture events. The distribution of small earthquakes on the Ganzi-Yushu fault from 1970 to 2019 is shown by small gray circles, and the range of the green box in Figure 11 is approximately 10 km on each side of the fault. This area was selected to avoid adjacent faults as far as possible to eliminate the effects of other faults.
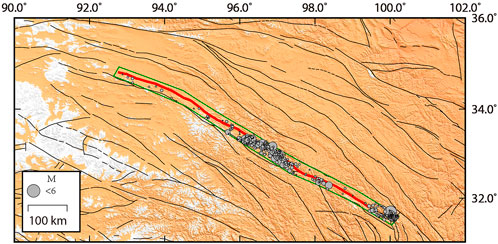
FIGURE 11. Distribution range of small earthquakes in fault slip rate map. the range of the green box in Figure is approximately 10 km on each side of the fault, the grey circles is an earthquake with magnitude less than six.
The inversion results in Figure 12 show that the fault slip rate and slip distribution vary significantly along the entire Ganzi-Yushu fault. The slip rate is relatively high in the deep part of the Ganzi-Zhuqing segment, and it decreases gradually toward the northwest. Then the slip rate decreases sharply in the Yushu segment northwest of Dengke, presumably because of the impact of the 2010 Yushu earthquake. Several secondary faults were generated from the Dengke segment to the Yushu segment; thus, the strain energy was dispersed. The overall energy reduction in the Yushu segment resulted in a decrease in the fault slip rate. The results suggest that the fault slip distribution varies significantly between segments and is highly correlated with seismic events, and some regions exhibit low slip rates. In the rupture area of the 1866 Ganzi earthquake in the Ganzi-Zhuqing segment, the number of small earthquakes is large, and the slip rate is high in the shallow crust. These results are influenced largely by the Xianshuihe fault. The overall fault slip rate in this segment is similar to that of the Xianshuihe fault; thus, the accumulated energy is relatively limited, and energy is continuously released through small earthquakes. The slip rate discrepancy is relatively large at Zhuqing. A region with a low slip rate of 0–6.3 mm/yr appears in the shallow crust and extends downward in a funnel shape, which may be related to the gradually decreasing effect of the Xianshuihe fault on the slip rate of the Ganzi-Yushu fault.
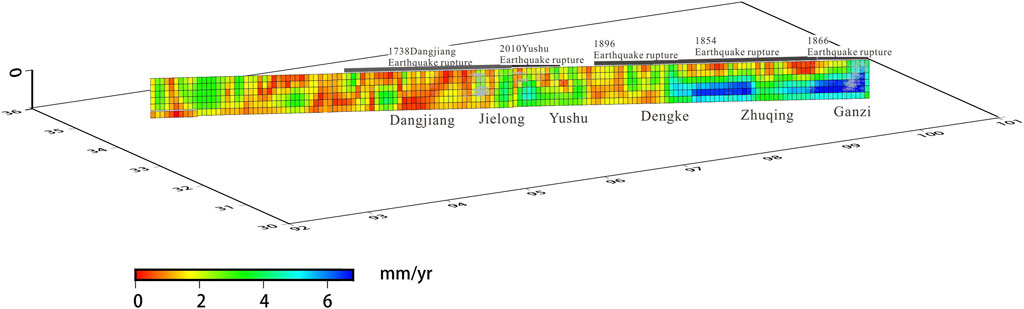
FIGURE 12. Inverted interseismic fault slip distribution along the Ganzi-Yushu fault.
The surface rupture of the 1896 M7.3 earthquake in the Dengke segment is more than 70 km long (Zhou et al., 2014). The slip rate in this region deviates from the maximum slip rate used as the constraint, and the depth of the low-slip-rate zone increases significantly.
Note that in the Yushu segment, four intense earthquakes have occurred on the fault in the segment from Ganzi to Yushu since the 1856 Ganzi earthquake, including the 2010 Yushu earthquake, which was the most recent. The surface fault rupture passes through the entire fault segment; however, the region between Dengke and Yushu is unruptured (Dong et al., 2012; Yuan et al., 2011). In another part of the Yushu segment, surface rupture reaches 50 km because of the Ms7.1 earthquake in 2010. Small earthquakes frequently occur in this region, most of which are aftershocks of the Yushu earthquake. The slip rate in the shallow crust at the epicenter of the Yushu earthquake is higher than that on either side (Ma et al., 2012).
The slip rate decreases further from Jielong to the Dangjiang segment in the northwest, forming a low-slip-rate area (below 3.1 mm/yr) more than 100 km long. Figure 11 shows that small earthquakes on the fault are infrequent in this region. Although the 2010 Yushu earthquake had a magnitude of 7.1, the rupture length was only approximately 50 km, and rupture did not extend northwestward to the Dangjiang segment. It is also suspected that the fault is locked in this area. Note that the slip rate increases at the northwestern end of the Dangjiang segment. We speculate that the Bayanhar block is strongly compressed by the Qiangtang block from the south in the Dangjiang segment, resulting in the overall north-south ground motion in the entire segment. Thus, the eastward motion of crustal material escaping from the Tibetan Plateau has decreased, and the fault-parallel slip rate here is clearly lower than that on either side (Li et al., 2016; Wu et al., 2017).
The inversion results partially confirm the previous conclusions, but there are also discrepancies, which may be explained by the following three factors. The first is the temporal characteristics of the selected InSAR deformation data. The results vary when data with different time spans are used. Second, the use of different interseismic deformation models will also result in discrepancies in the results. In the model used in this study, the interseismic slip is constrained by the InSAR data, which give only the relative motion on two sides of the fault and do not include block rotation or internal deformation. Therefore, the observed deformation is a combination of track errors and deformations caused by shallow and deep slips along the fault. Although the effects of data errors were reduced as much as possible during data processing, their negative impacts on the accuracy of the results cannot be completely eliminated. Third, many previous studies were conducted before the Yushu earthquake. Although some conclusions on present-day slip rates are based on interseismic fault activity rates, the coseismic effects on slip rate calculation for the entire region cannot be completely ignored and will also cause large differences in the conclusions obtained using data obtained before and after 2010. In this study, we used the current data to estimate the long-term slip rates; thus, some of our results differ from previous conclusions, whereas others confirm them.
Seismic events are quasi-periodic. Each seismic cycle is inevitably accompanied by the accumulation and release of stress and strain (Wen et al., 2011), where crustal motion and deformation are relatively direct indicators of subsurface stress and strain. Two methods are typically used to analyze the long-term seismic hazard of large-scale active faults using geodetic deformation data.
The first is to solve the deformation field using the least-squares collocation method (Jiang et al., 2003; 2010) to obtain the distribution of strain rate parameter variations in and around the fault zone, comprehensively investigate the tectonic strain in the study area, and identify locations with the potential for large earthquakes. The second method evaluates the fault using the slip deficit rate by comparing the difference between the moment accumulation on the fault obtained from geodetic inversion and the seismic moment release. This difference indicates the magnitude of unreleased energy accumulated in the region during the investigated time span. If the difference is large and positive, the earthquake hazard on the fault is high.
In this study, we integrated these two methods, assessing the seismic hazard using the elapsed time after earthquake occurrence and the periodicity.
The strain field is an indispensable parameter in the study of crustal deformation. It is an important indicator characterizing the deformation of the study area. It is not limited by the choice of reference frame and can reflect the regional deformation characteristics of the study area at different resolutions (Ge et al., 2000; Li et al., 2009). Interseismic strain accumulation is a major feature of large strike-slip faults (Wright et al., 2013a). It can be used to identify the region with the highest strain accumulation rate and thus the location where earthquakes are most likely to occur (Wang et al., 2019; Wright et al., 2013b). However, in practice, the GNSS stations monitoring crustal motion are unevenly distributed in the Ganzi-Yushu fault zone, and their number gradually decreases from west to east along the fault. In particular, GNSS stations are sparse in many areas near the fault; thus, the local strain rates cannot be recorded. Therefore, we used the integrated InSAR-GNSS high-spatial-resolution velocity field and GNSS horizontal velocity field to calculate the strain rate field separately and compared the results.
A continuous strain field was first calculated using the Velocity Interpolation for Strain Rate computer code published by Shen et al. (2015). Note that seismic events were still occurring during the time span of the data. These events may cause errors in the strain rate field, and the strain distribution around the fault is also affected by the current seismic period of the fault in addition to the current tectonic loading. Therefore, the post-seismic slips along the Ganzi-Yushu fault in recent decades all affect strain accumulation along the fault. A continuous strain rate field was calculated from the GNSS velocity field (wang et al., 2020) in the same way, and the data were smoothed during interpolation. Note that because of insufficient near-field observations in the Ganzi-Yushu fault zone, the strain rate field along the fault is actually an average over a wide spatial range, which is an underestimation of the real strain rate field.
Figure 13 shows the integrated InSAR-GNSS strain rate field and GNSS strain rate field. Figures 13A, B show the integrated InSAR-GNSS maximum shear strain rate/principal strain rate field and surface strain rate field, respectively. Figures 13C, D show the GNSS maximum shear strain rate/principal strain rate field and surface strain rate field, respectively. The details of the strain rate fields calculated using InSAR-GNSS data are clearly more precise than those calculated using the GNSS velocity field alone, especially for the near-field stress distribution in the fault zone. Therefore, our analysis is based on Figures 13A, B.
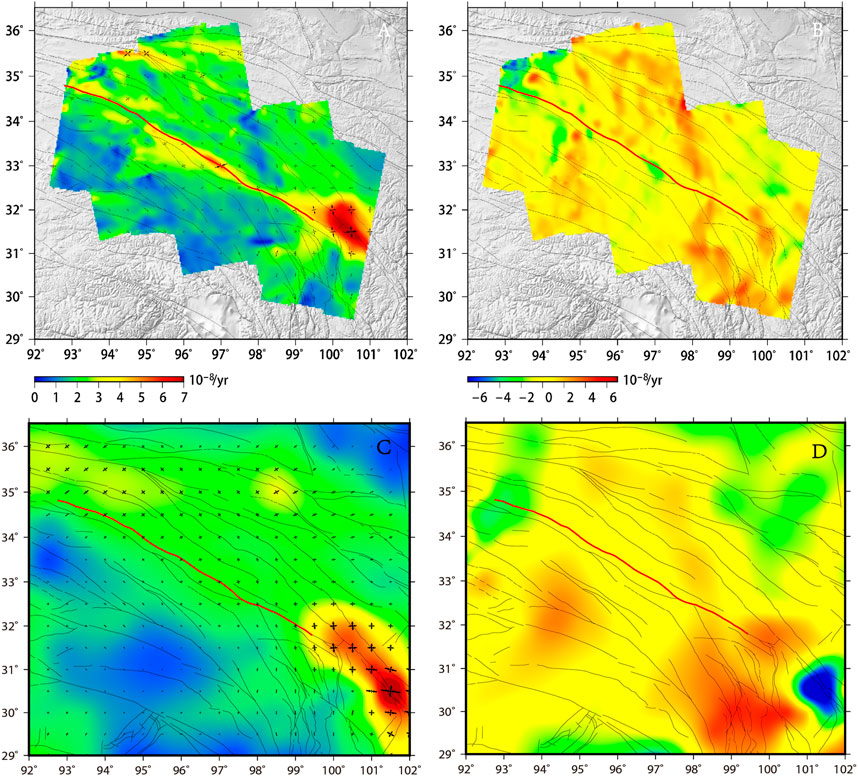
FIGURE 13. Strain rate fields around the Ganzi-Yushu fault zone: (A) integrated InSAR-GNSS maximum shear strain rate/principal strain rate field, (B) integrated InSAR-GNSS surface strain rate field, (C) GNSS maximum shear strain rate/principal strain rate field, and (D) GNSS surface strain rate field.
Figure 13A demonstrates that the Ganzi-Yushu fault as a whole is characterized by left-lateral strike-slip motion. The orientation of the principal extensional strain changes slowly from west to east, from near-EW near the Ganzi-Yushu fault to near-SN near the Xianshuihe fault, and the principal compressional strain pattern also changes gradually from near-SN to near-EW. Both patterns exhibit clear clockwise rotation (Lei et al., 2021). The main reason is that the Ganzi-Yushu fault is the southern boundary of the Bayanhar block, which is compressed by the main body of the Tibetan Plateau from the south, and the northeastward compression has caused apparent eastward material extrusion along this fault. The material flow clearly rotates clockwise around the East Himalayan structural knot, shifting from eastward to southeastward.
The figure reveals high shear stress in the Xianshuihe fault zone, which is thought to result from the blockage of eastward lateral material flow by the South China block to the east (Xu et al., 2022). This result confirms that the Xianshuihe-Xiaojiang fault system marks the northern and eastern boundaries of the large-scale crustal material flow rotating clockwise around the East Himalayan structural knot.
The shear stress in the Ganzi-Yushu fault zone is generally lower than that in the Xianshuihe fault zone; however, the shear stress distribution pattern along the periphery of the fault zone is clear (Zhang et al., 2022a). A high-value anomaly clearly appears at the epicenter of the Yushu earthquake, where the strain rate is more than
The overall kinematic features and slip rate of the Ganzi-Yushu fault structure indicate that the entire fault is dominated by relatively stable left-lateral strike-slip movement; however, the kinematic features and activity level of the fault vary between segments. We estimated the moment magnitude from the fault locking rate using geologic methods and the obtained strain rate fields. Then, we assessed the level of seismic hazard for some sections along the Ganzi-Yushu fault.
The long-term average slip rate of the Ganzi-Yushu fault is 2.5–6.8 mm/yr; however, it is only in an ideal case that the entire fault slips at the same rate. In reality, the fault slip rate varies between segments. It decreases continuously from southeast to northwest; thus, the fault locking pattern and seismic hazard cannot be determined from the slip rate alone. It is necessary to analyze the fault locking rate in subsections of the fault. First, the fault parameters were kept consistent, and the fault zone at depths of 0–20 km was divided into a total of 930 small blocks (Figure 14) to calculate their far-field loading rates using the following equation.
where θ is the locking rate, Vn is the slip rate of the shallow block, and Vm is the deep slip rate at the corresponding position. The calculated θ value lies between 0 and 1; thus, it can highlight the degree of fault locking at shallow depths so that the misidentification of a low slip rate in the shallow part accompanied by a limited deep slip rate can also be avoided. The obtained θ values are presented with the fault division pattern in Figure 14. Furthermore, to better illustrate the degree of fault locking, we marked small earthquakes in the fault zone using the same color scheme as in the previous figures, where green represents small earthquakes in the study area from 1970 to 2009 and blue indicates the results from 2010 to 2019.
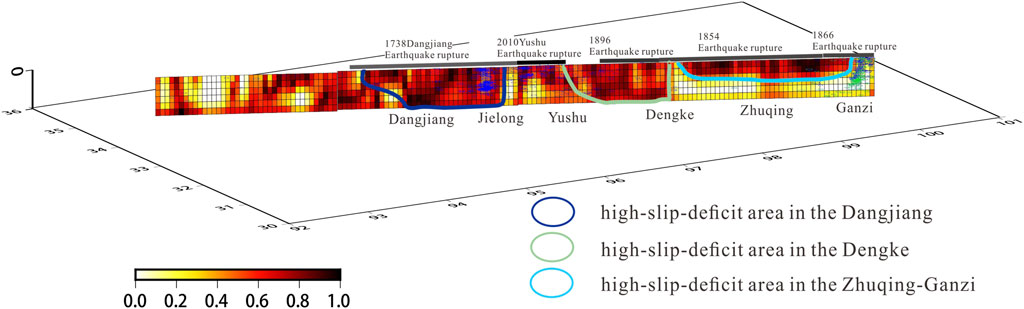
FIGURE 14. Locking rate distribution along the Ganzi-Yushu fault. Green represents small earthquakes in the study area from 1970 to 2009 and blue indicates the results from 2010 to 2019.
The locking rate distribution map clearly shows several areas with high locking degrees, which are the regions with high seismic hazard mentioned above. There is also a high-hazard area at Zhuqing. These regions were identified as high-slip-deficit zones and analyzed individually. First-order calculations were performed on this premise to obtain the moment accumulation (M0) using the following equation (Kostrov, 1974):
where µ is the shear modulus, which is assumed to be 30 GPa; U is the inverted slip deficit; and A is the area of the fault patch. Note that here the slip deficit U is the product of the slip deficit rate and the magnitude of the deep fault slip multiplied by the elapsed time t. The unit of M0 is Newton-meter or dyne-centimeter, as shown in Equations 8) and 9), respectively.
Figure 14 shows a notable high-slip-deficit area extending northwestward from the Dangjiang segment for approximately 130 km along the Ganzi-Yushu fault. Small earthquakes have occurred only at Jielong after the Yushu earthquake, and the number of small earthquakes has decreased sharply in the northwestern segment since 1970. The analysis of the latest fault ruptures in different segments of the Ganzi-Yushu fault reveals that if the unruptured section in the Yushu segment is ignored, the four major seismic events since 1854 exhibit a shift from southeast to northwest. Therefore, it is possible that future large earthquakes on this fault will continually migrate toward the northwestern segment. Figure 13 shows that this area is also a zone of high strain accumulation; therefore, we suspect that the high-slip-deficit area in the Dangjiang segment is at high seismic hazard. The average slip deficit rate in this area is 0.852, and the elapsed time since the last earthquake t is 284 years. The corresponding
The high-slip-deficit area in the Dengke segment is another fault section that has not yet ruptured in the current seismic cycle. The average recurrence interval of characteristic earthquakes in this region calculated using geologic methods is 206–253 years (Working Group of M7, 2012). According to available information, the calm time in this region has far exceeded the average earthquake recurrence interval; thus, strong earthquakes are possible. Although the strain rate map reveals no significant stress accumulation pattern, this fault section lies in a low-stress transition zone between two high-stress regions and exhibits significantly uneven stress accumulation. For the high-slip-deficit region with an average slip deficit rate of 0.78 in Figure 14, it is challenging to determine the elapsed time t. Although historical ruptures in this region can be traced back to the great earthquake in 1,320, most of this slip deficit region is located within the rupture range of the 1896 earthquake. Therefore, the energy released by the 1896
There were frequent small earthquakes in the high-slip-deficit area in the Zhuqing-Ganzi segment from 1970 to 2019. This region has a high rate of seismic moment release; thus, its seismic hazard is low.
(1) The integrated InSAR-GNSS velocity field shows that the magnitude of the east-west velocity component varies significantly between the two sides of the Ganzi-Yushu fault. The eastward component decreases at the intersection of the Ganzi segment with the Xianshuihe fault, and the north-south component shows a rotational orientation, confirming that the Ganzi-Yushu fault zone is characterized by left-lateral strike-slip motion and that the block near the Xianshuihe fault is a rotational structure. We calculated the fault-parallel velocity field and constructed six cross-fault profiles. Present-day slip rates along the fault of 2.5–6.8 mm/yr were obtained, with values of 6.8 mm/yr for the Ganzi to Zhuqing segment, 6.3 mm/yr for the Dengke segment, 4.5–5.3 mm/yr for the Yushu segment, and 2.5–3.0 mm/yr for the Dangjiang segment.
(2) The fault slip rate was inverted using an SDM based on the near-field InSAR data. The slip rate distribution pattern clearly shows that the fault slip rate generally decreases from the Ganzi segment in the southeast toward the northwest. The deep slip rate decreases sharply in the Yushu segment of the Ganzi-Yushu fault west of Dengke, which may be caused in part by the 2010 Yushu earthquake. The fault slip rate varies significantly between segments and is highly correlated with seismic events. Fault locking is common in the shallow parts of the study area.
(3) A high-resolution strain rate map was constructed using the integrated InSAR and GNSS 3D deformation fields. The obtained map contains more accurate details than the strain rate map obtained from the GNSS velocity field alone. The distribution of shear stress along the periphery of the fault zone can be identified. A notable high-value anomaly at the epicenter of the Yushu earthquake is thought to be the result of strain rate concentration around the fault due to elastic relaxation after the Yushu earthquake. The Dangjiang segment also contains a high-strain rate area.
(4) The seismic hazard of the Ganzi-Yushu fault zone was comprehensively assessed using the obtained slip deficit rates and strain rate map. The seismic hazard of the high-slip deficit area in the Dangjiang segment is high, where
The original contributions presented in the study are included in the article/Supplementary Material, further inquiries can be directed to the corresponding author.
NZ and LJ conceived this research. NZ processed the InSAR data and wrote the manuscript. WZ conducted the detailed explanation. XX assisted with the InSAR data processing. JW conducted the use of Software. All authors reviewed and supervised the manuscript and approved it for publication.
This study was funded by the National Key Research and Development Program of China (2017YFC1500501), Project supported by the Natural Science Foundation of Shaanxi Province, China (2021JQ-979).
Sentinel 1A images were provided free by ESA’s Sentinels Scientific Data Hub.
The authors declare that the research was conducted in the absence of any commercial or financial relationships that could be construed as a potential conflict of interest.
All claims expressed in this article are solely those of the authors and do not necessarily represent those of their affiliated organizations, or those of the publisher, the editors and the reviewers. Any product that may be evaluated in this article, or claim that may be made by its manufacturer, is not guaranteed or endorsed by the publisher.
Bamler, R., and Hartl, P. (1998). Synthetic aperture radar interferometry. Inverse problem. 14 (4), R1–R54. doi:10.1088/0266-5611/14/4/001
Bock, Y., and Melgar, D. (2016). Physical applications of GPS geodesy: A review. Reports on Progress in Physics. 79 (10), 106801. doi:10.1088/0034-4885/79/10/106801
Chevalier, M. L., Leloup, P. H., Replumaz, A., Pan, J. W., Metois, M., and Li, H. B. (2018). Temporally constant slip rate along the Ganzi fault, NW Xianshuihe fault system, eastern Tibet. Geological Society of America Bulletin. 130 (3-4), 396–410. doi:10.1130/B31691.1
Dewey, J. F., Shackleton, R. M., Chang, C. F., and Sun, Y. Y. (1988). The tectonic evolution of the Tibetan plateau. Philosophical Transactions of the Royal Society A. 327 (1594), 379–413. doi:10.1098/rsta.1988.0135
Doin, M. P., Lasserre, C., Peltzer, G., Cavalie, O., and Doubre, C. (2009). Corrections of stratified tropospheric delays in SAR interferometry: Validation with global atmospheric models. Journal of Applied Geophysics. 69 (1), 35–50. doi:10.1016/j.jappgeo.2009.03.010
Dong, Y., Yuan, X., Wang, X., and Dou, A. (2012). Analysis of surface ruptures caused by the 2010 M_S7.1 Yushu, Qinghai earthquake using high resolution remote sensing images. Earthquake 32 (1), 82–92. doi:10.3969/j.issn.1000-3274.2012.01.008
England, P., and Houseman, G. (1986). Finite strain calculations of continental deformation: 2. Comparison with the India-asia collision zone. Journal of Geophysical Research. 91. 3664-3676. doi:10.1029/JB091iB03p03664
Gan, W. J., Zhang, P. Z., Shen, Z. K., Niu, Z. J., Wang, M., Wan, Y. G., et al. (2007). Present-day crustal motion within the Tibetan Plateau inferred from GPS measurements. Journal of Geophysical Research: Solid Earth. 112 (8), B08416. doi:10.1029/2005JB004120
Ge, S. M., and Stover, S. C. (2000). Hydrodynamic response to strike- and dip-slip faulting in a half-space. Journal of Geophysical Research: Solid Earth. 105 (B11), 25513–25524. doi:10.1029/2000JB900233
Goldstein, R. M., and Werner, C. L. (1998). Radar interferogram filtering for geophysical applications. Geophysical Research Letters. 25 (21), 4035–4038. doi:10.1029/1998GL900033
Hussain, E., Wright, T. J., Walters, R. J., Bekaert, D. P. S., Lloyd, R., and Hooper, A. (2018). Constant strain accumulation rate between major earthquakes on the North Anatolian Fault. Nature Communications. 9, 1392. doi:10.1038/s41467-018-03739-2
Ji, L., Zhang, W., Liu, C., Zhu, L., Xu, J., and Xu, X. (2020). Characterizing interseismic deformation of the Xianshuihe fault, eastern Tibetan Plateau, using Sentinel-1 SAR images. Advances in Space Research. 66 (2), 378–394. doi:10.1016/j.asr.2020.03.043
Jiang, Z., and Liu, J. (2010). The method in establishing strain field and velocity field of crustal movement using least squares collocation. Chinese Journal of Geophysics-Chinese Edition. 53 (5), 1109–1117. doi:10.3969/j.issn.0001-5733.2010.05.011
Jiang, Z., Shao, Z., Liu, X., Zou, Z., and Wu, Y. (2022). Crustal deformation associated with seismogenic process of Chinese mainland strong earthquakes and identification of approximation to seismogenic process in the late seismogenic stage. Geomatics and Information Science of Wuhan University. 47 (6), 807–819.doi:10.13203/j.whugis20220204
Jiang, Z. S., Ma, Z. J., Zhang, X., Wang, Q., and Wang, S. X. (2003). Horizontal strain field and tectonic deformation of China mainland revealed by preliminary GPS result. Chinese Journal of Geophysics-Chinese Edition. 46 (3), 352–358.doi:10.1002/cjg2.3368
Jouanne, F., Mugnier, J. L., Sapkota, S. N., Bascou, P., and Pecher, A. (2017). Estimation of coupling along the main himalayan thrust in the central himalaya. Journal of Asian Earth Sciences. 133, 62–71. doi:10.1016/j.jseaes.2016.05.028
Kapp, P., Yin, A., Harrison, T. M., and Ding, L. (2005). Cretaceous-Tertiary shortening, basin development, and volcanism in central Tibet. Geological Society of America Bulletin. 117 (7-8), 865–878. doi:10.1130/B25595.1
Kapp, P., Yin, A., Manning, C. E., Harrison, T. M., Taylor, M. H., and Ding, L. (2003). Tectonic evolution of the early Mesozoic blueschist-bearing Qiangtang metamorphic belt, central Tibet. Tectonics 22 (4). doi:10.1029/2002TC001383
King, R. W., Shen, F., Burchfiel, B. C., Royden, L. H., Wang, E. C., Chen, Z. L., et al. (1997). Geodetic measurement of crustal motion in southwest China. Geology 25 (2), 179–182. doi:10.1130/0091-7613(1997)025<0179:gmocmi>2.3.co;2
Kostrov, V. V. (1974). Seismic moment and energy of earthquakes, and seismic flow of rock. Izvestiya, Academy of Sciences, USSR: Physics of the solid earth (1), 13–21. doi:10.1016/0148-9062(76)90256-4
Lei, L., Yu, J. L., Liang, Y. Z., and Ling, Y. J. (2021). [Influence of the 1947 Dari M7.7 earthquake on stress evolution along the boundary fault of the Bayan Har block: insights from numerical simulation]. Chinese Journal of Geophysics (in Chinese). 64 (7), 2221–2231. doi:10.6038/cjg2021P0194
Li, Y., Wang, H., Liu, H., and Chen, L. (2016). The surface rupture remains along the Dangjiang segment of garze-yushu fault and the 1738 AD earthquake. Technologies concerning Disaster Prevention and Mitigation. 11 (2), 207–217. doi:10.11899/zzfy20160204
Li, Y. X., Li, Z., Zhang, J. H., Huang, C., Zhu, W. Y., Wang, M., et al. (2004). Horizontal strain field in the Chinese mainland and its surrounding areas. Chinese Journal of Geophysics-Chinese Edition. 47 (2), 222–231.doi:10.1002/cjg2.480
Li, Y., Zhang, J., Zhou, W., Hu, X., Guo, L., and Zhang, Z. (2009). The mechanism and dynamics of the generation and occurrence for Wenchuan M(S)8.0 earthquake. Chinese Journal of Geophysics-Chinese Edition. 52 (2), 176–187. doi:10.1002/cjg2.1338
Lin, A., Jia, D., Rao, G., Yan, B., Wu, X., and Ren, Z. (2011). Recurrent morphogenic earthquakes in the past millennium along the strike-slip Yushu Fault, central Tibetan plateau. Bulletin of the Seismological Society of America. 101 (6), 2755–2764. doi:10.1785/0120100274
Liu, C., Lay, T., Brodsky, E. E., Dascher-Cousineau, K., and Xiong, X. (2019). Coseismic rupture process of the large 2019 ridgecrest earthquakes from joint inversion of geodetic and seismological observations. Geophysical Research Letters. 46 (21), 11820–11829. doi:10.1029/2019GL084949
Liu, C., Lay, T., and Xiong, X. (2018). Rupture in the 4 may 2018 MW 6.9 earthquake seaward of the kilauea east rift zone fissure eruption in Hawaii. Geophysical Research Letters. 45 (18), 9508–9515. doi:10.1029/2018GL079349
Liu, G., Ma, J., Zhang, H., Wang, J., Yang, Y., and Wang, L. (2013). [Determination of polychlorinated naphthalenes in environmental samples by isotope dilution gas chromatography-triple quadrupole mass spectrometry]. Chinese Journal of Geophysics-Chinese Edition. 56 (3), 878–884. doi:10.3724/sp.j.1123.2013.02012
Liu, Y., Xu, C. J., Li, Z. H., Wen, Y. M., and Forrest, D. (2011). Interseismic slip rate of the Garze-Yushu fault belt in the Tibetan Plateau from C-band InSAR observations between 2003 and 2010. Advances in Space Research. 48 (12), 2005–2015. doi:10.1016/j.asr.2011.08.020
Liu, Y., Zhu, L., Ji, L., Xu, J., Zhang, W., and Xu, X. (2022). Regional Medium Characteristics Based on Post-Earthquake Deformation Analysis of Kangding Ms6.3 Earthquake in 2014. Journal of Geodesy and Geodynamics. 42 (6), 559–564. doi:10.14075/j.jgg.2022.06.002
Ma, Y., Chen, Y., Wang, P., and Liu, W. (2012). Temporal-spatial evolution characteristics of the 2010 Yushu M7.1 earthquake sequence and tendency jugement. Earthquake 32 (3), 109–116.doi:10.3390/ijgi10070465
Moreira, A., Prats-Iraola, P., Younis, M., Krieger, G., Hajnsek, I., and Papathanassiou, K. P. (2013). A tutorial on synthetic aperture radar. IEEE Geoscience and Remote Sensing Magazine. 1 (1), 6–43. doi:10.1109/MGRS.2013.2248301
Peng, H., Ma, X. M., Bai, J. Q., and Du, D. P. (2006). Characteristics of quaternary activities of the garzê-yushu fault zone. International Journal of Geomechanics. 12 (03), 295–304. doi:10.3969/j.issn.02534967.2013.01.004
Qidong, D., Xiang, G., and Guihua, C. (2010). Recent tectonic activity of Bayankala fault-block and the Kunlun-Wenchuan earthquake series of the Tibetan Plateau. Frontiers of Earth Science. 17 (5), 163–178. doi:10.1017/S0004972710001772
Qiu, J., Zhao, Q., and Lin, P. (2018). Characteristics of InSAR coseismic deformation and slip distribution of the akto Ms6.7 earthquake, xinjiang. Journal of Seismology Research. 41 (3), 415–422. doi:10.3969/j.issn.1000-0666.2018.03.010
Savage, J. C., and Burford, R. O. (1973). Geodetic determination of relative plate motion in central California. Journal of Geophysical Research. 78 (5), 832–845. doi:10.1029/JB078i005p00832
Shen, Z., and Liu, Z. (2020). Integration of GPS and InSAR data for resolving 3-dimensional crustal deformation. Earth and Space Science. 7 (4). doi:10.1029/2019EA001036
Shen, Z., Lü, J., Wang, M., and Bürgmann, R. (2005). Contemporary crustal deformation around the southeast borderland of the Tibetan Plateau. Journal of Geophysical Research: Solid Earth. 110 (11). doi:10.1029/2004JB003421
Shen, Z., Wang, M., Zeng, Y., and Wang, F. (2015). Optimal interpolation of spatially discretized geodetic data. Bulletin of the Seismological Society of America. 105 (4), 2117–2127. doi:10.1785/0120140247
Shi, F., He, H., Densmore, A. L., Li, A., Yang, X., and Xu, X. (2016). Active tectonics of the ganzi–yushu fault in the southeastern Tibetan plateau. Tectonophysics 676, 112–124. doi:10.1016/j.tecto.2016.03.036
Wang, E., and Burchfiel, B. C. (2000). Late Cenozoic to Holocene deformation in southwestern Sichuan and adjacent Yunnan, China, and its role in formation of the southeastern part of the Tibetan Plateau. Geological Society of America Bulletin. 112 (3), 413–423. doi:10.1130/0016-7606(2000)112<413:lcthdi>2.0.co;2
Wang, H., Wright, T. J., Liu-Zeng, J., and Peng, L. (2019). Strain rate distribution in south-central Tibet from two decades of InSAR and GPS. Geophysical Research Letters. 46 (10), 5170–5179. doi:10.1029/2019GL081916
Wang, M., and Shen, Z. K. (2020). Present-day crustal deformation of continental China derived from GPS and its tectonic implications. Journal of Geophysical Research: Solid Earth. 125 (2). doi:10.1029/2019JB018774
Wang, R. J., Schurr, B., Milkereit, C., Shao, Z. G., and Jin, M. P. (2011a). An improved automatic scheme for empirical baseline correction of digital strong-motion records. Bulletin of the Seismological Society of America. 101 (5), 2029–2044. doi:10.1785/0120110039
Wang, R., Parolai, S., Ge, M., Jin, M., Walter, T. R., and Zschau, J. (2013). The 2011 M-w 9.0 tohoku earthquake: Comparison of GPS and strong-motion data. Bulletin of the Seismological Society of America. 103 (2), 1336–1347. doi:10.1785/0120110264
Wang, Y., Wang, M., Shen, Z., Ge, W., Wang, K., Wang, F., et al. (2011b). Inter-seismic deformation field of the ganzi-yushu fault before the 2010 yushu earthqauke. Seismology and Geophysics. 33 (3), 525–532.doi:10.1016/j.tecto.2012.03.026
Wen, X., Fang, D., Zhang, P., and Long, F. (2011). Correlation of major earthquake sequences on the northern and eastern boundaries of the Bayan Har block, and its relation to the 2008 Wenchuan earthquake. Chinese Journal of Geophysics-Chinese Edition. 54 (3), 706–716. doi:10.3969/j.issn.0001-5733.2011.03.010
Wen, X. Z., Huang, S. M., and Jiang, Z. X. (1985). Neotectonic features of the Ganzi-Yushu fault zone and assessment of its earthquake hazard. Seismology and Geophysics. 7 (3), 23–32.
Wen, X. Z., Xu, X. W., Zheng, R. Z., Xie, Y. Q., and Wan, C. (2003). Average SlipRate and recent large earthquake ruptures along the garzê-yushu fault. Science In China Series D-Earth Sciences. 46 (S1), 199–208. doi:10.3969/j.issn.1674-7240.2003.z1.022
Werner, C., Wegmüller, U., Strozzi, T., and Wiesmann, A. (2000). “Gamma SAR and interferometric processing software,” in Proceedings of the ERS-Envisat Symposium, Gothenburg, Sweden, October 16–20 2000.
Working Group of M7, (2012). Study on the mid-to long-term potential of large earthquakes on the Chinese continent (in Chinese). Beijing, China: Seismological Press.
Wright, T. J., Elliott, J. R., Wang, H., and Ryder, I. (2013a). Earthquake cycle deformation and the Moho: Implications for the rheology of continental lithosphere. Tectonophysics 609, 504–523. doi:10.1016/j.tecto.2013.07.029
Wright, T. J., Elliott, J. R., Wang, H., and Ryder, I. (2013b). Earthquake cycle deformation and the Moho: Implications for the rheology of continental lithosphere. Tectonophysics 609, 504–523. doi:10.1016/j.tecto.2013.07.029
Wu, J., Huang, X., and Xie, F. (2017). Deformation of the most recent Co-seismic surface ruptures along the garze-yushu fault zone (Dangjiang segment) and tectonic implications for the Tibetan plateau. Acta Geologica Sinica-English Edition. 91 (2), 443–454. doi:10.1111/1755-6724.13110
Wu, Z., Zhou, C., Feng, H., Zhang, K., Li, J., Ye, P., et al. (2014). Active faults and earthquake around Yushu in eastern Tibetan Plateau. Geological Bulletin of China. 33 (4), 419–469. doi:10.3969/j.issn.1671-2552.2014.04.003
Xu, X., Wu, X., Yu, G., Tan, X., and Li, K. (2017). Seismo-geological signatures for identifying M≥7.0 earthquake hazard areas and their premilimary application in mainland China. Seismology and Geophysics. 39 (2), 219–275.doi:10.3969/j.issn.0253-4967.2017.02.001
Xu, X. W., Wen, X. Z., Zheng, R. Z., Ma, W. T., Song, F. M., and Yu, G. H. (2003). Pattern of latest tectonic motion and its dynamics for active blocks in sichuan-yunnan region. Science In China Series D-Earth Sciences. 33 (1), 151–162. doi:10.3969/j.issn.1674-7240.2003.z1.017
Xu, J., Liu-zeng, J., Yuan, Z. D., Yao, W. Q., Zhang, J. Y., and Ji, L. Y. (2022). Airborne LiDAR- Based Mapping of Surface Ruptures and Coseismic Slip of the 1955 Zheduotang Earthquake on the Xianshuihe Fault, East Tibet. Bulletin of the Seismological Society of America. 112 (6), 3102–3120.doi:10.1785/0120220012
Yu, C., Li, Z. H., Penna, N. T., and Crippa, P. (2018). Generic atmospheric correction model for interferometric synthetic aperture radar observations. Journal of Geophysical Research: Solid Earth. 123 (10), 9202–9222. doi:10.1029/2017JB015305
Yuan, D., Lei, Z., He, W., and Liu, X. (2011). Textual research of Yushu earthquake in 1738 A. D. in Qinghai Province and discussion their relationship with Yushu earthquake Ms 7.1 in 2010. Program in Geophysics. 26 (6), 1950–1958.doi:10.3969/j.issn.1004-2903.2011.06.008
Zhang, Z. Q., McCaffrey, R., and Zhang, P. Z. (2013). Relative motion across the eastern Tibetan plateau: Contributions from faulting, internal strain and rotation rates. Tectonophysics 584, 240–256. doi:10.1016/j.tecto.2012.08.006
Zhang, C., Ji, L., Zhu, L., and Xu, J. (2022a). Analysis of the Crustal Deformation of the Eastern Himalayan Syntaxis and Its Adjacent Areas Based on the Earthquake Focal Stress and GPS Strain. Journal of Seismological Research. 45(4), 526–534. doi:10.20015/j.cnki.ISSN1000-0666.2022.0068
Zhang, W. T., Ji, L. Y., Zhu, L. Y., Liu, C. J., Jiang, F. Y., and Xu, X. X. (2022b). Current Slip and Strain Rate Distribution Along the Ganzi-Yushu-Xianshuihe Fault System Based on InSAR and GPS Observations. Front. Earth Sci. 10. doi:10.3389/feart.2022.821761
Zhou, R. J., Ma, S. H., and Cai, C. X. (1996). Late quaternary activie features of the Ganzi-Yushu Fault zone. Earthquakes Research in China 12 (03), 250–260. doi:10.1016/j.jsg.2018.11.004
Zhou, R., Li, Y., Liang, M., Xu, X., He, Y., Wang, S., et al. (2014). Determination of mean recurrence interval of large earthquakes on the Garze-Yushu Fault (Dengke Segment) on the eastern margin of the Qinghai-Tibetan Plateau. Quaternary International. 333, 179–187. doi:10.1016/j.quaint.2013.11.010
Keywords: Ganzi-Yushu fault, InSAR, SDM, slip rate, strain rate field, GNSS
Citation: Zhao N, Ji L, Zhang W, Xu X and Wang J (2023) Present-day kinematics and seismic potential of the Ganzi-Yushu fault, eastern Tibetan plateau, constrained from InSAR. Front. Earth Sci. 11:1123711. doi: 10.3389/feart.2023.1123711
Received: 14 December 2022; Accepted: 09 January 2023;
Published: 18 January 2023.
Edited by:
Huaizhong Yu, China Earthquake Networks Center, ChinaReviewed by:
Chengsheng Yang, Chang an University, ChinaCopyright © 2023 Zhao, Ji, Zhang, Xu and Wang. This is an open-access article distributed under the terms of the Creative Commons Attribution License (CC BY). The use, distribution or reproduction in other forums is permitted, provided the original author(s) and the copyright owner(s) are credited and that the original publication in this journal is cited, in accordance with accepted academic practice. No use, distribution or reproduction is permitted which does not comply with these terms.
*Correspondence: Lingyun Ji, jilingyun@smac.ac.cn
Disclaimer: All claims expressed in this article are solely those of the authors and do not necessarily represent those of their affiliated organizations, or those of the publisher, the editors and the reviewers. Any product that may be evaluated in this article or claim that may be made by its manufacturer is not guaranteed or endorsed by the publisher.
Research integrity at Frontiers
Learn more about the work of our research integrity team to safeguard the quality of each article we publish.