 Faith M. Johnson
 Alejandra C. Ortiz
94% of researchers rate our articles as excellent or good
Learn more about the work of our research integrity team to safeguard the quality of each article we publish.
Find out more
ORIGINAL RESEARCH article
Front. Earth Sci., 10 March 2023
Sec. Quaternary Science, Geomorphology and Paleoenvironment
Volume 11 - 2023 | https://doi.org/10.3389/feart.2023.1123339
Small Island Nations, often comprised of Atolls, are at considerable risk of climate change impacts from sea-level rise to coral acidification to increasing cyclone intensity; understanding how they will change in the coming century is vital for climate mitigation and resiliency. However, the morphology of atolls are not well quantified or summarized. In this work, we calculate modern atoll morphometrics on a global scale including 3,786 motu and 593 reef flats on 154 atolls. Temporal composites of Landsat imagery are created for 4 years (2015–2018), and are classified into motu, reef flat, open water/lagoon via unsupervised classification. Morphometrics, including widths, lengths, and area, are computed for each motu and reef flat of the atoll in Python, creating a database of atolls and their associated morphometrics. Consistency in automated processing of atoll morphometrics removes spatial and user bias, enabling a better understanding of geographic patterns of atoll area and other morphometrics. Distinct differences in the distribution of motu are seen on a regional scale in French Polynesia, while globally, wider reef flats and larger motu are found closest to the equator. Globally, there is a consistent reef flat width in front of large motu (>1 km length) of 184 ± 93 m (n = 724). Our atoll morphometric database creates a baseline of current atoll characteristics that can be expanded upon in the future and used for evaluating temporal changes to atoll islands.
The sub-aerial land found atop atoll carbonate reef platforms, known as reef islands, islets, motu, and cays, often serves as the only home to terrestrial ecosystems and human infrastructure on remote island nations. Despite their essential role, a consistent method for measuring their current morphometrics is lacking (Duvat, 2019). To predict the response of these island nations to rising sea levels and other climate change impacts (Barnett and Adger, 2003; Fletcher and Richmond, 2010; Kumar, 2020), we must first create a baseline of current planform land area and other morphometrics, as well as a reproducible method for measuring change quickly at the global scale.
In this paper, we create a series of Python scripts utilizing Google Earth Engine and Landsat imagery to measure atoll morphometrics such as motu area or reef-flat width. Our robust methodology employs open-source software and allows for a consistent approach to calculating the planform terrestrial area of these island nations and a path for measuring and tracking changes to these landscapes over time. By characterizing the regional and global patterns of atoll morphometrics, we can investigate trends and hypothesize potential processes driving these patterns. Thus, based on our results and previous hydrodynamic modeling (Ortiz and Ashton, 2019), we propose a conceptual model to explain differing pathways of motu and reef flat evolution.
Atolls are found in tropical oceans, consisting of a carbonate reef platform (hereafter called reef flat) surrounding a central lagoon with subaerial islands on top of the reef (hereafter called motu) (Schlager and Purkis, 2013). The exact definition of what constitutes an atoll varies from the simple “annular reef whose rim develops at or near sea level and encircles a deeper lagoon” (Ladd, 2012) to more complex definitions such as proposed by Wiens (1962) in several pages or by Gischler (2016) as an “irregularly shaped, isolated oceanic reef structures at or near sea level that enclose a lagoon.” We take a broad definition for an atoll but focus on the common structures inherent in almost all of the atoll definitions: lagoon, shallow reef-structure, and islets atop the carbonate reef-structure.
Atolls are typically formed from coral reefs growing on subsiding dormant volcanic islands (Darwin, 1842) and are shaped by global changes in sea levels (Daly, 1925; Toomey et al., 2016) over hundreds of thousands of years. Atoll Islands, herein referred to as motu (aka cays or islets), are composed of carbonate sand, coral shingle, and rubble perched on top of the conglomerate reef flat encircling the inner lagoon (Woodroffe et al., 1999). For our satellite based analysis, the term motu encompass islands on atolls of any sediment size (Ortiz and Ashton, 2019), rather than limited to a particular class (Richmond, 1992; Brander et al., 2004; Kench et al., 2017). In addition, since we cannot easily differentiate land types, all sub-aerial landforms are classified as land and called motu in our analysis, regardless of potential elevation differences or sediment characteristics. These subaerial islets form and evolve on a shorter time scale, from decades to centuries (Perry et al., 2013; Hamylton et al., 2014; Kench et al., 2014a; Kench et al., 2014b; Kench et al., 2023), compared to the atoll itself, which operates on the timescale of millennia to hundreds of thousands of years (Toomey et al., 2013; Toomey et al., 2016). Motu initiation, formation, and evolution has occurred under current (Kench et al., 2014a; Sengupta et al., 2021), rising (Kench et al., 2005; Webb and Kench, 2010; McLean and Kench, 2015), and falling sea level conditions (Woodroffe, 2008; Kench et al., 2020). Evolution of motu can be episodic, with island change tied to specific events such as a tropical cyclone adding sediment (Duvat and Pillet, 2017) or land reclamation from human activities (Ford, 2011; Aslam and Kench, 2017; Duvat and Pillet, 2017; Duvat and Magnan, 2019).
Atolls are at risk from climate change due to many factors, including their low elevation, ocean acidification decreasing reef productivity, and changing storm intensities. Many atolls have a maximum elevation of less than 5 m with a mean elevation of 2 m, potentially at risk to estimated global sea level increases. Accelerated rates of sea-level rise (SLR) may outpace vertical reef flat accretion from the coral reefs. In addition, storm driven flooding will be increased by climate change (Storlazzi et al., 2015), driving increased flooding and inundation from swell waves generated by distant storms (Hoeke et al., 2013; Shope et al., 2017). Ocean acidification and other oceanographic stressors such as changing ocean temperature can reduce sediment production from the coral reefs, which puts the ability of motu and reef platforms to keep pace with SLR further at risk (Eyre et al., 2018). However, to understand the potential response of these landforms to changing climate risks, we must first understand the processes driving their evolution and their current status.
Although atolls are often described as circular or annular structures (Wiens, 1962; Ladd, 2012), their morphology varies widely (Stoddart, 1965; Gischler, 2016). The controls on atoll shape are still inconsistently quantified. Previous work by Stoddart (1965) used hand tracing of 99 atolls to measure their shape, demonstrating a “fundamental homogeneity of atoll shapes” including a tendency for elongated and more elliptical atolls, where the length of the atoll is typically 1.5–3 times the width, rather than the oft-described ring or circular shaped atoll. In this paper, we recreate Stoddart’s measurements both at the atoll scale and at the individual motu or reef-flat scale across our global atoll database (n = 154/623 atolls).
Many studies of atoll geomorphology use a combination of field and remote sensing technologies, including historic aerial photography and modern satellite imagery, focusing on one motu to a regional group of atolls. Our analysis provides a consistent method to expand studies of atoll geomorphology and track landscape change over time. Frequently, studies have relied on hand digitation of shorelines and atoll morphology (Webb and Kench, 2010; Kench et al., 2014a; Ford and Kench, 2014; Ford and Kench, 2015; Duvat and Pillet, 2017; Sengupta et al., 2021). Different features are used as a proxy for the shoreline location including edge of vegetation (Ford and Kench, 2015; Albert et al., 2016; Garcin et al., 2016), defining a stability line (Duvat and Pillet, 2017), using a GPS track at the time of the field work (Kench et al., 2014a), using supervised classification (Holdaway et al., 2021), and using an image analysis software with hand digitation to fix errors (Schlager and Purkis, 2013). Studies looking at changes in land area or shoreline position on atolls include (Kench et al., 2014a; 2018; Albert et al., 2016; Aslam and Kench, 2017; Duvat and Pillet, 2017; Duvat and Magnan, 2019; Nunn et al., 2020). For example, Ford and Kench (2014) examined Nadikdik Atoll in the Marshall Islands, and found a net increase of island area from 1945 to 2010. Rather than relying on time-intensive hand-digitization, our automated analysis of Landsat imagery provides a consistent and reproducible method for calculating land area at a given timepoint.
Duvat (2019) re-analyzed 20 different papers studying atoll land area change for 30 atolls (709 motu). They found that 88.6% of the islands were stable (within ± 3% area change) or increased in area over the time period of analysis. All the larger islands (>0.1 km2) were either stable or increased in area. This paper was one of the first studies to collate other published works and compare atoll island changes across decadal changes. However, Duvat (2019) did not create a common assessment protocol for atolls to strengthen data comparability. Our analysis presented herein provides a roadmap for a common protocol to calculate and assess atoll island evolution.
Holdaway et al. (2021) leveraged Landsat satellite imagery to quantify atoll land area change for 221 atolls with a mix of multiyear and annual temporal composites. Supervised classification, with a fluctuating number of landcover classes, was used to segment the images. For comparison between all the sites, a binary land/water class was created and total land area change was calculated on an atoll level. From 2000–2017, land area increased 6.1% for the 221 atolls, primarily in the Maldives and South China Sea mainly due to land reclamation (Holdaway et al., 2021). Their analysis provides one example of leveraging existing satellite imagery to track landcover change on atolls globally but still relied on relatively intensive oversight due to the use of supervised classification with varying landcover classes. In addition, they only investigated land water changes over time and ignored the reef flat. Our method provides a more automated process and measures morphometrics between landscape objects on the atoll (i.e., the width of the reef flat in front of a given motu). Moreover, our large database creates an important baseline for current atoll morphometrics.
Numerical modeling work by Ortiz and Ashton (2019) found that the width of the reef-flat in front of motu (the distance from the oceanside of the motu to the edge of the oceanside of the reef-flat) should reach an equilibrium distance dependent on the offshore wave climate. Using the open-source model XBeach in hydrodynamic mode, they investigated the potential response of sediment transport with the presence of a 1D motu to changing offshore wave climate and changing reef-flat widths in front of the motu. They found that once motu are present on the reef flat (i.e., once the sub-aerial land blocks sediment from reaching the lagoon), the motu would grow and accrete oceanward (thus narrowing the oceanside motu to reef-flat width) up to a certain point where the direction of sediment transport would reverse and direct sediment offshore. Their conceptual model of motu evolution predicts self-organization of motu prograding oceanward to a critical reef-flat width dependent on the offshore wave height. Similarly, 2D modeling by Shope and Storlazzi (2019) found that atoll islands orientated parallel to the deep-water wave direction would accrete towards the lagoon while eroding along shorelines exposed to direct wave action, bolstering the theory that offshore wave climate is key to motu evolution. Our analysis herein enables an initial quantification of global motu morphometrics, enabling us to further investigate the Ortiz and Ashton (2019) conceptual model.
While there are many studies of atolls island evolution, there is a critical need to establish a baseline of atoll morphometrics using a consistent methodology (Duvat, 2019). The aim of this research is to create a reproducible approach to evaluate atoll morphology on a broad spatial scale using satellite imagery and innovative data processing techniques. We use a constant time frame for the temporal composites, an automated classification technique to separate the atoll into parts (motu, reef flat, open water/lagoon), automatically segment the classified imagery, and calculate morphometrics of each object. We create a worldwide database of atolls and their morphometrics. This methodology removes spatial bias and enables a better understanding of current geographic patterns in atoll morphometrics and potentially identify first order patterns between atolls.
We created an atoll database (Figure 1) spanning 623 locations identified in satellite imagery. Our database identifies atolls using a broad and inclusive definition: a carbonate reef-platform encircling or partially surrounding a central lagoon. We applied this broad definition to ensure that all possible atoll island forms are captured in our analysis (Figure 1). Atolls within our database are easily subsetted down based on a range of factors (e.g., only atolls containing motu or only unfilled lagoons). We only calculated morphometric analyses on 154 atolls that have been previously considered atolls by others (Stoddart, 1965; Goldberg, 2016).
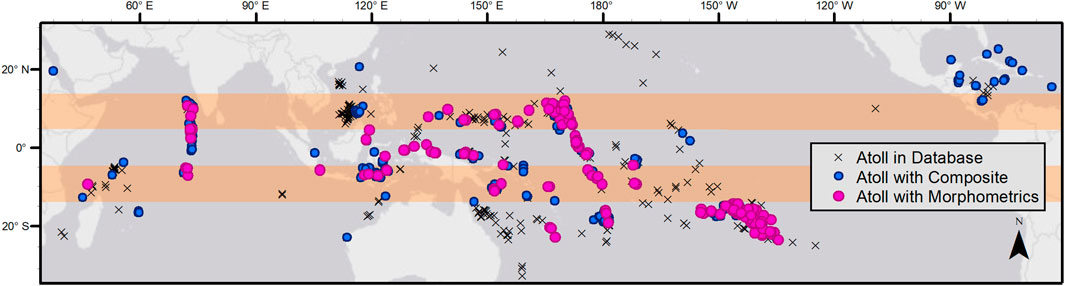
FIGURE 1. Map of atolls worldwide showing locations of atolls in database (black x), atolls with composite imagery created from Landsat (blue dots), and atolls with both composite imagery and morphometrics calculated (pink dots), separated into equatorial (0°–4.7° latitude), mid tropical (4.7°–14° latitude) highlighted in beige strips, and high tropical (14°–27° latitude).
Our code is built on open-source software within Python using common libraries in image analysis (i.e., Google Earth Engine, skimage, and pandas) to create temporal composites, classify into three landcover classes, and segment into objects for morphometric analyses. We have created a suite of Python scripts with discrete functions to calculate specific morphometrics, available on GitHub (AtollGeoMorph), that other users can adapt for their own morphometric analysis. For each atoll, we create temporal composites using Tier one Landsat Images. These composites are then classified into land, water, or reef-flat using k-means unsupervised classification. These landcover classes are then segmented and analyzed for a variety of morphometrics including area, width, centroid, and length (Figure 2). From these morphometrics, we calculate atoll-scale averages as well as bin by cardinal position on the atoll using statistical packages in Python (scipy.stats and scikit posthocs). Our database allows easy comparison at the individual atoll-scale, object-scale (i.e., comparing all the motu widths measured), the regional scale (patterns of motu widths in French Polynesia), or globally. All data are exported as csv and xls files for easy integration into other software for visualization or comparison.
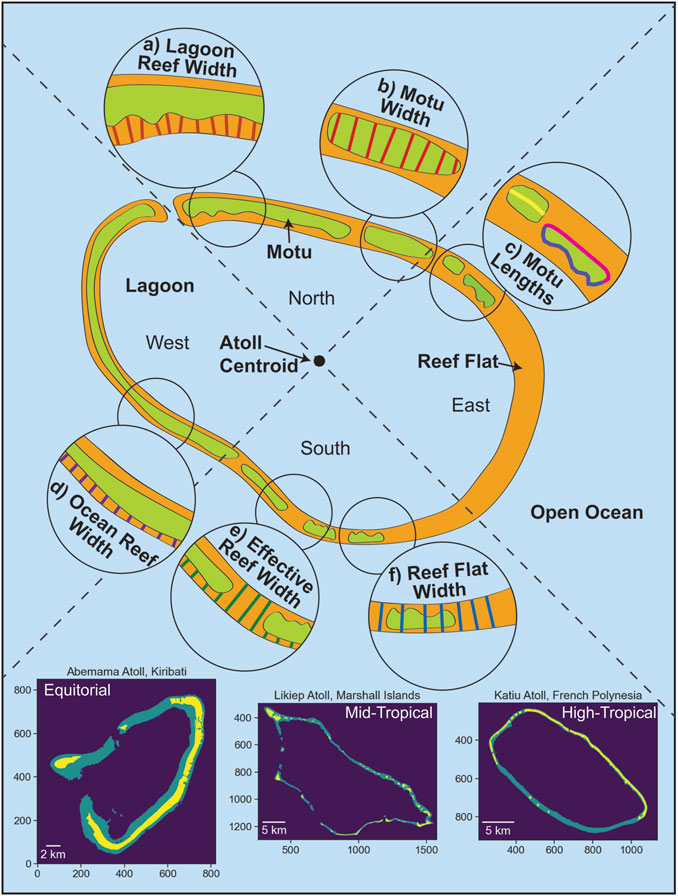
FIGURE 2. Conceptual diagram of morphometrics calculated for idealized atoll classified into three landcovers: light green (subaerial land, motu), light orange (reef flat), and light blue (water). (A) Motu to lagoon-side reef-flat width, herein called lagoon reef width (dark orange lines); (B) motu width (red lines); (C) all motu lengths including motu length (yellow line), ocean-side motu lengths (pink line), and lagoon-side motu length (blue-purple line). (D) motu to ocean-side reef-flat width, herein called ocean reef width (purple lines); (E) effective reef-flat width (green lines); and (F) total reef-flat width, assuming no land on top, herein called reef-flat width (blue lines). Approximate location of center of mass of entire atoll object denoted by atoll centroid with resultant segregation of atoll objects by cardinal directions North, East, South, and West as shown by dashed grey lines. Three example Landsat temporal Composites, k-means segregated, are shown at the bottom from atolls of each region, where reef-flats are teal, water is purple, and land is yellow, shown north-oriented with a scalebar.
Four-year temporal composites (2015–2018) are created from Tier One Landsat Images using the Google Earth Engine library (GEE) in Python similar to the methodology used by Ortiz et al. (2017). For a given atoll, all Tier one Landsat images available from 2015 to 2018 are collected, cloudy pixels are removed using in-built GEE cloud removal functions, and the remaining pixels from each image are composited using the 50th percentile on a per-pixel per-band basis. Tier one Landsat images are georectified, have atmospherically corrected surface reflection, and have a 30 m resolution (Google Earth Engine Team, 2015). Six bands (blue, green, red, NIR, SWIR1, and SWIR2) are retained in our final temporal composite. A count band, indicating the number of images used for the composite per pixel, and a mask band to show the geometry given to GEE are also included. For all 154 atolls, the average number of images used in the temporal composite is 68 with an average minimum number of images equal to 14. By using a 4-year temporal composite, we ensured that per-pixel, each composite is based on at least 14 non-cloudy Landsat images. The temporal composite method has been used by other researchers to remove cloudiness in a given Landsat image, a very common issue for atolls (Ortiz et al., 2017; Mateo-García et al., 2018).
We assume that the primary landcover classes on an atoll are: reef flat, motu (land), and water and use k-means clustering (assuming 3 clusters) for automated image classification. While previous authors have sometimes linked formation mechanisms or sediment type to different atoll island names, such as using sandy cay (Montaggioni et al., 2018) for low-lying sand dominated islets vs. motu for islets with a shingle ridge and gravel dominated (Woodroffe et al., 1999; Woodroffe and Biribo, 2011; Goldberg, 2016; Montaggioni et al., 2018), Landsat satellite imagery (at 30 m resolution) does not easily differentiate these landscapes, as such, we have chosen to combine all sub-aerial landforms be they vegetated, gravel, sand, conglomerate, or infrastructure, into one landcover class called land or motu. Given Landsat’s medium resolution (30 m), the classified image is cleaned by removing small groups of objects with less than eight isolated pixels (i.e., objects <7,200 m2 are not analyzed). All motu smaller larger than 7,200 m2 but smaller than 57,600 m2 (64 isolated pixels) only have basic morphometrics calculated (area, perimeter, and location), while motu larger than 64 pixels have complex morphometrics calculated (such as width and length). The total area across our entire database accounted for by motu between 0.72 and 5.7 ha (i.e. 8-64 connected pixels, n = 2,036), is less than 3% of the total area (47 km2) measured by the remaining large motu (n = 1,752, for a total area of 1,789 km2).
A methodology for determining atoll morphometrics is created and implemented in Python scripts, publicly available on GitHub (https://github.com/ale37911/AtollGeoMorph). Our Python scripts are split into three distinct pieces: 1) create temporal composites (Section 3.1), 2) classify, clean, and segment the image then calculate morphometrics (Section 3.2), and 3) collate saved outputs from each atoll into larger dataframes for analysis and visualization (Section 3.3). For detailed description of the methods used in the morphometric analysis see Supporting Information Text S1.
Once the satellite image is classified, the number and approximate location of lagoons on the atoll is input by the user. Users manually close the lagoon for cases where our automated lagoon finder function is unable to match the lagoon number specified by the user. Morphometrics of the lagoons are calculated: area, perimeter, all the perimeter points (on a per-pixel basis), and the centroid. Atoll level morphometrics are also calculated: outside atoll perimeter (ocean perimeter), the atoll centroid, and shape factors (Horton Form Factor - F, Miller’s Circularity Ratio–Rc, Schumm’s Elongation Ratio–Re, and the Ellipticity Index–Ie) used by Stoddart (1965) (Supplementary Text S2). Area, perimeter, and centroid of each object (i.e., reef flat, motu, or atoll) are calculated and stored in pandas dataframe where each row is the perimeter point per object (motu or reef flat). All points are classified as an ocean-side or lagoon-side point based on relative distances to the lagoon or ocean (Supplemental S1).
For each point on an object, several morphometrics are calculated such as the cardinal position angle, defined relative to the position on the atoll compared to the centroid of the atoll. Multiple width morphometrics are also calculated within each object, i.e., width of a motu (Figure 2B– red lines) or total width of a reef-flat (Figure 2F– blue lines) per point from ocean-side to lagoon-side, or widths between objects, i.e., the width from a motu ocean-side point to a reef-flat ocean side points called the ocean reef width (Figure 2D– purples lines). The length of each motu is calculated using the cumulative distance along the center points of the motu width measurements (Figure 2C– yellow line). The cumulative distance between each of these points is used as the length measurement of a given object. We also calculate the shoreline length of each object by the cumulative distance of all ocean or lagoon side points, these are called the ocean-side and lagoon-side lengths respectively (Figure 2C– pink and purple line respectively).
Atolls are analyzed individually, regionally, and globally with morphometrics summarized at a per-point, per-object, and per-atoll level. At the regional level, morphometrics are also binned by cardinal direction relative to the atoll centroid (cardinal position angle). While at the global scale, morphometrics are binned by absolute latitude. Summary tables are created for each atoll that include the area, mean widths, length, centroid location, cardinal directional bin (i.e., binned by the relative position of the point to the atoll centroid) for each motu, reef flat, and lagoon object. Primary morphometrics for all 154 atolls analyzed are available as a table (Supplementary Table S1). Finally, statistical analysis of our grouping and averaged morphometrics is analyzed using non-parametric variance analysis (Kruskal–Wallis implemented from the scipy. stats Python library) and the significance of the grouping scheme (i.e., cardinal binning of reef flat widths of French Polynesia) is analyzed with a post hoc Dunn Test (implemented from the scikit posthocs Python library) (Supplemental S3). All statistical analysis assumes an alpha of 0.05 and the calculated p-values are shown in the supplemental tables (Supplementary Tables S2–S8).
There are 623 atolls in our inclusive atoll database. There is adequate Landsat coverage to create a temporal composite for 385 of those atolls, of which we calculate morphometrics for 154 (Figure 1). We started with an inclusive list of potential atolls including some with no motu (fully submerged reef flats), interior islands in the lagoon (i.e., Bora, French Polynesia), or that had very small or completely filled in lagoons (i.e., Nikunau, Kiribati). While we were able to create a composite for some of these atolls, they were not included in the morphometrics calculations. Results are presented for Faaite Atoll in French Polynesia (Section 4.1), regionally for French Polynesia (Section 4.2), and globally for all atolls analyzed (Section 4.3).
Faaite Atoll, French Polynesia is located at 16.758°S, 145.238°W in the Pacific Ocean south of the equator and east of the international date line (Figure 3). The atoll has one lagoon, two reef flats, and 27 motu. Faaite has a total lagoon area of 233.37 km2, reef flat area of 52.27 km2, and land area (motu area) of 11.48 km2. The two reef flats are unequal in size with the primary reef flat accounting for more than 99% of the total reef flat area (Figure 3A). The large standard deviation on the effective reef flat width measurements for Faaite occurs because the distribution of widths is not unimodal. Seven of the motu (out of 27) are large enough to calculate complex morphometrics such as length and width measurements (Figure 3C). Similar to many atolls in our database, the lagoon-side motu length are mostly longer than the ocean-side motu length (6/7, Figure 3C). This is exemplified in motu M4, where the lagoon-side motu length is 75% longer than the ocean-side motu length (aka motu shoreline length), due to increased crenulation of the lagoon side shoreline compared to the smoother ocean-side shoreline. The larger motu (plotted in green, Figure 3) are distributed on the northern shoreline while the smaller motu (only simple morphometrics calculated, plotted in yellow in Figure 3) are found primarily on the southern shorelines. To quantify this observation, we also bin all morphometrics relative to relative cardinal position on the atoll (Supplementary Figure S1, Figure 2).
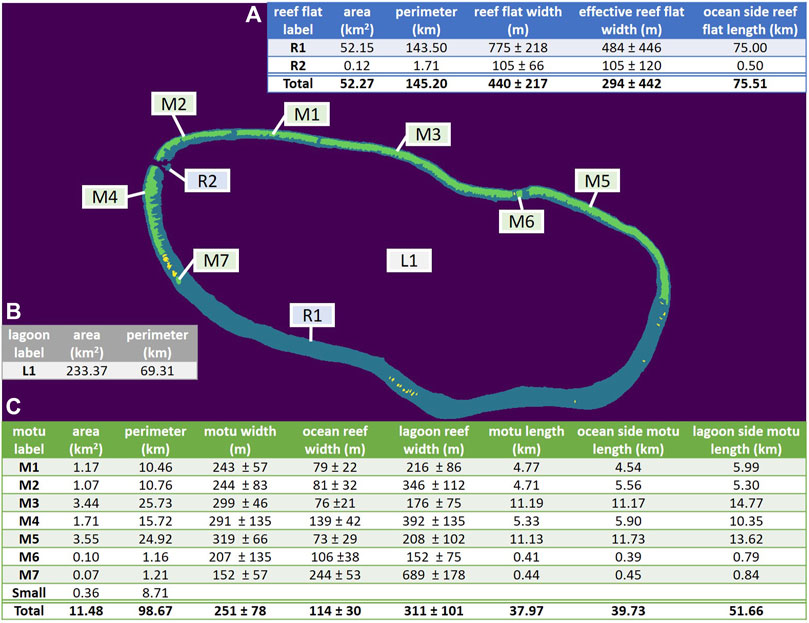
FIGURE 3. Faaite atoll, French Polynesia object level data. Background image is K-means classified with individual objects labeled: motu are green (all morphometrics calculated) and yellow (small motu, only basic morphometrics calculated), reef flat are blue, and water is purple. Motu are labeled starting with M, reef flats with R, and the lagoon with L. This letter is followed by the index number assigned north to south for each class of object based on the northern most point of that object. Morphometric summary tables are included for (A) reef flats, (B) lagoons, and (C) motu. Error in the mean widths is one standard deviation.
There are 60 atolls in French Polynesia with sufficient Landsat coverage to create a temporal composite and calculate morphometrics. These atolls are located between 14° 24′S-23° 21′S and 134° 29′W- 154° 41′W (Figure 1 – the large clump of pink dots south of the equator below the beige stripe on the eastern side of the pacific). These atolls have 1,930 motu (836 motu with full morphometrics calculated with areas >64 connected pixels or 5.76 ha) and 80 reef flats (Supplementary Table S1). In French Polynesia, there is on average 1.3 reef flats per atoll with the number of motu ranging from one to as many as 69 with an average of 14 larger motu per atoll.
On a per-point basis in French Polynesia, the ocean reef width has the most constrained distribution of measured widths (Figures 4A,E) while the total reef-flat width has the widest variation of measured widths (Figures 4A,C). When breaking out the data by cardinal position on the atolls, we see a clear trend that the northern shoreline of these atolls consistently has the smallest variance of widths while the southern and western shorelines tend to have the widest range of measurements. When looking at motu width, ocean reef width, and lagoon reef width, there is a strong unimodal distribution (Figures 4D,E). However, on the southern and western shorelines, the reef flat width measurements show a bimodal distribution (Figures 4C,F). Distinct variations in the distribution of measured widths for French Polynesia atolls highlights the spatial heterogeneity of landforms on these atolls.

FIGURE 4. Density functions for width calculations in French Polynesia on a per-point basis. (A) Atoll wide widths, binned by cardinal directions for (B) motu width, (C) total reef flat width, (D) lagoon reef width, (E) ocean reef width, -and (F) effective reef-flat width.
Analyzing on a per-atoll basis (one data point per-cardinal bin per-atoll) weights small and large atolls equally (Figure 5; Figure 6; Table 1). Median motu widths range from 263 m in the south to 345 m in the west (Figure 5A). The width of the reef flat is narrower on the northern and eastern shores and wider on the southern and western with the largest variation of reef flat widths on the southern shores (Figure 5B). Moreover, in French Polynesia the total reef-flat width is statistically different on the Northern and Eastern sides compared to the southern and western sides (Supplementary Table S2, p-value <0.029). This trend is also observed in the effective reef flat width measurements, with the narrowest distribution of widths in the north and the widest distribution in the south (Figure 5E). The lagoon reef width (Figure 5C) is more variable than the ocean reef width (Figure 5D) with a wider distribution of measurements perhaps driven by increased crenulations of the motu shoreline on the lagoon side compared to their smoother ocean-side shores. The northern shores have the narrowest lagoon reef width of 100 m and the narrowest ocean reef width at 101 m. The south bin has the widest distribution of widths for both the mean lagoon reef width and the mean ocean reef width at 212 m and 185 m respectively. Consistently the northern and eastern shores of French Polynesia atolls have a narrower range of morphometrics than the southern and western shorelines.
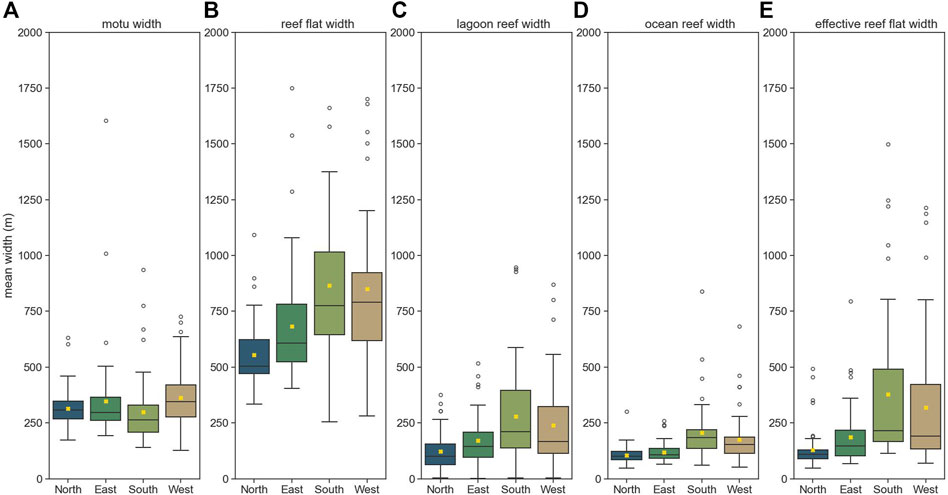
FIGURE 5. Cardinal position within the atoll binned widths in French Polynesia on a per-atoll basis for (A) motu width, (B) reef flat width, (C) lagoon reef width, (D) ocean reef width, and (E) effective reef flat width. One point per atoll is the mean width. Mean value of data shown as yellow x in all subplots, central black line indicating median value. Not shown on total reef flat width (B), two outliers: one point at 2,790 m in the South bin and one at 2,320 m in the West bin.
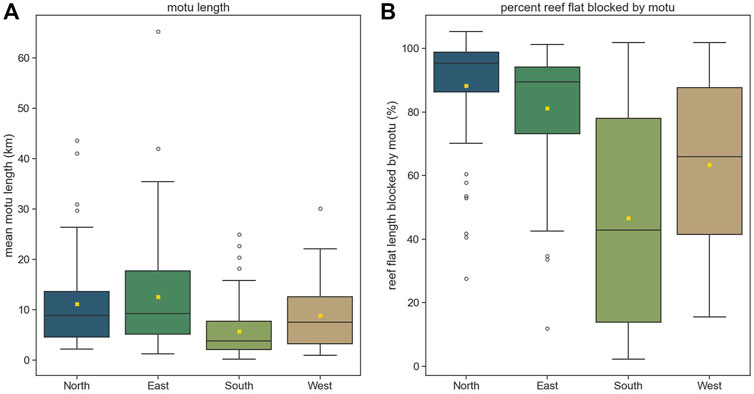
FIGURE 6. (A) Binned cardinally per-atoll total motu length for French Polynesia (n = 231). (B) Percent of total length of reef flat covered by motu separated by cardinal bin, yellow x marks mean values of distribution of data.
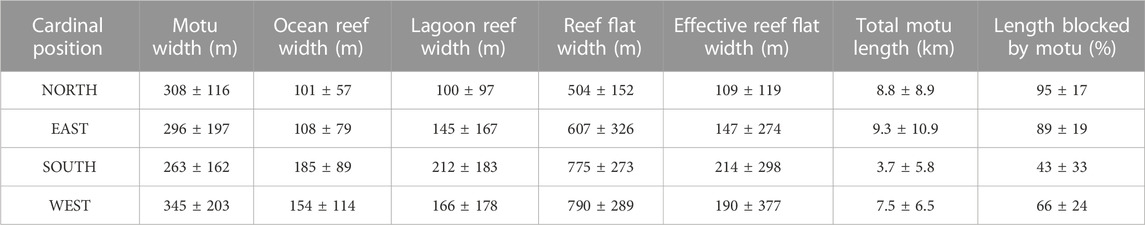
TABLE 1. Median with one standard deviation per atoll cardinal position binned for French Polynesia motu and reef-flat morphometrics.
The east and the north shores of French Polynesian atolls have the longest motu while the south and west shores have shorter ones (Figure 6A) as can be seen qualitatively in the k-means cleaned image of Katiu, French Polynesia (Figures 2 – Tropical Atoll). The north and east sides also have a larger percent of their reef flats covered by motu (Figure 6B), and are statistically distinct from the southern shorelines (p-value <0.001, and 0.003, Supplementary Table S2). In addition, the northern and eastern sides have a narrower overall reef-flat width, which are again statistically different from the southern and western shores (Supplementary Table S2, p-value <0.005). Lastly the southern shores are dominated by statistically distinct morphometrics from any of the other cardinal bins (Supplementary Table S2), with shorter motu and wider reef flats (Table 1). Overall, in French Polynesia the northern and eastern shores have longer motu and narrower reef flats for all reef measurements (reef flat width, lagoon reef width, ocean reef width, and effective reef flat width) compared to the southern and western shores.
On a per-object basis (aka averaging all the points for each motu then analyzing across all motu in French Polynesia categorized into cardinal bins), the ocean reef width (reef width in front of the motu) reaches a near constant width once the motu reaches a certain length (Figure 7). For all French Polynesia motu longer than 1 km, the mean ocean reef width is 150 ± 60 m (n = 324/795), which decreases to 108 ± 50 m for all motu longer than 10 km (n = 54/795, Figure 7B). When grouping purely by cardinal bins (so not per-motu, but per atoll and per cardinal bin) as shown in Figure 7A, for the sum of motu longer than 1 km within each cardinal bin, the mean ocean reef width is 145 ± 85 m (n = 222/231), which decreases to a mean of 131 ± 86 m for motu longer than 10 km (n = 83/231), similar to our analysis as per-motu per atoll per cardinal bin (Figure 7B). In both analyses (Figures 7A,B) analyzing either per motu per cardinal bin or per cardinal bin, we see that the larger motu with the near constant ocean reef flat width are clustered on the northern and eastern shores with fewer on the southern and western shorelines (blue and green dots compared to olive and yellow) and these are statistically distinct populations (Supplementary Table S3).
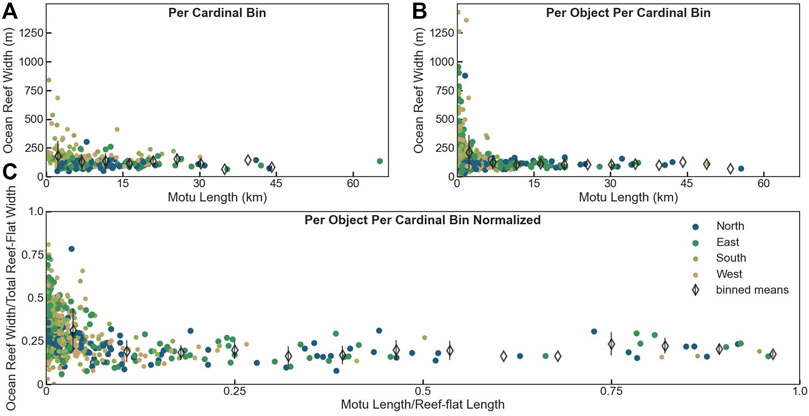
FIGURE 7. (A). Cardinally binned reef flat width in front of motu (ocean reef width) vs. motu length for each cardinal bin per atoll (n = 231) in French Polynesia with mean ocean reef-width (black diamonds) binned per motu length with standard deviation. (B) Reef flat width in front of motu (ocean reef width) vs. motu length for each motu (n = 832) in French Polynesia classified by cardinal position on the atoll with mean ocean reef-width (black diamonds) binned per motu length with standard deviation. (C) Reef flat width in front of the motu normalized by the width of the reef flat the motu is on vs. the motu length normalized by the length of the reef flat the motu is on classified by cardinal position on the atoll for every motu (n = 836) with mean normalized ocean reef-width (black diamonds) binned per normalized motu length with standard deviation.
There are clear trends of increased numbers of the largest motu (>10 km) on the northern and eastern shores of the French Polynesia Atolls (37% and 52% respectively compared to only 4% and 7% on the Southern and Western sides, Figure 7). For smaller motu, i.e., with lengths <1 km (n = 471/795), the mean ocean reef width is larger, 238 ± 73 m. The relative or normalized ocean reef width in front of the motu was calculated to ensure that smaller overall atoll footprints were considered (Figure 7C). The same trend of a near constant ocean reef width is exhibited again, dominated by northern and eastern motu (blue and green dots, Figure 7C). For motu that occupy more than 10% of the total reef-flat length, there is an average of 18% of the total reef-flat width open in front of the motu (n = 97/795), with the majority (70/97) of these motu found on the N and E shores (72%). The consistent pattern of a near constant width in front of large motu implies that self-organization may be driving a critical reef-flat width for French Polynesia Atolls.
Morphometrics are calculated for 154 atolls (Figure 1), and overall, there are 3,786 motu (1,752 with all morphometrics calculated) and 593 reef flats (Table 2) in our analyses. The total land (motu) area is 1,836.47 km2 and the total reef flat area is 7,387.43 km2.
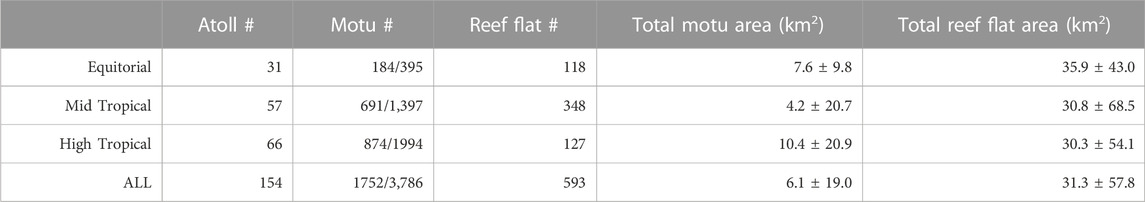
TABLE 2. Median morphometrics with one standard deviation per atoll binned by latitude for all atolls.
Atolls are binned by their absolute latitudes, with the least number of atolls in the equatorial latitudes (Table 2). The equatorial atolls (n = 31) are located from 4.7°S to 4.7°N, the mid tropical atolls (n = 57) are between 4.7°S and 14°S and 4.7°N - 14°N, and the high tropical atolls (n = 66) are located greater than 14°S and 14°N below the Tropics of Capricorn and Cancer respectively (see Figure 2 for an example of an atoll in each region). In our analyses, the high tropical atolls are all located in the Pacific Ocean in the southern hemisphere and are dominated by the atolls of French Polynesia (n=60/66). The equatorial atolls have the least number of motu per atoll with an average of 12.7 motu (5.9 large motu with all morphometrics calculated) and 3.8 reef flats. Mid tropical have an average of 24.5 motu (12.2 large motu) and 6.1 reef flats, while high tropical atolls have an average of 30.2 motu (with 13.2 large motu) and 1.9 reef flats with statistically distinct populations between the latitudinal atoll groups (Supplementary Table S4).
Similar to Stoddart (1965), we see variation across all 154 atolls in the overall morphology of the atoll, i.e., the outer shape of the atoll itself, but with overall homogeneity of morphology (Figure 8; Figure 2–example atolls shown at bottom). We can predict the perimeter of an atoll with high certainty given it is overall surface area (r2 = .96, Supplementary Figure S2). Atolls cluster around a mean elongated shape as shown by the mean of the shape factors (F = 0.39 ± 0.15, Rc = 0.55 ± 0.17, Re = 0.69 ± 0.14, Ie = 2.3 ± 1.3, Figure 8). The distributions of atoll shape do vary across our three latitudinal groupings (equatorial, mid-tropical, and high-tropical) with statistically significant differences for all calculated shape factors except the Ellipticity Index (Supplementary Table S5, p-value <0.029). The mid tropical and equatorial atolls are more elongated than the high tropical atolls as shown by the low Horton Form Factors and Miller Circularity Ratios (Figures 8A,B). The high tropical atolls are dominated by more circular, less complex atoll shapes compared to either of the equatorial or mid tropical atolls.
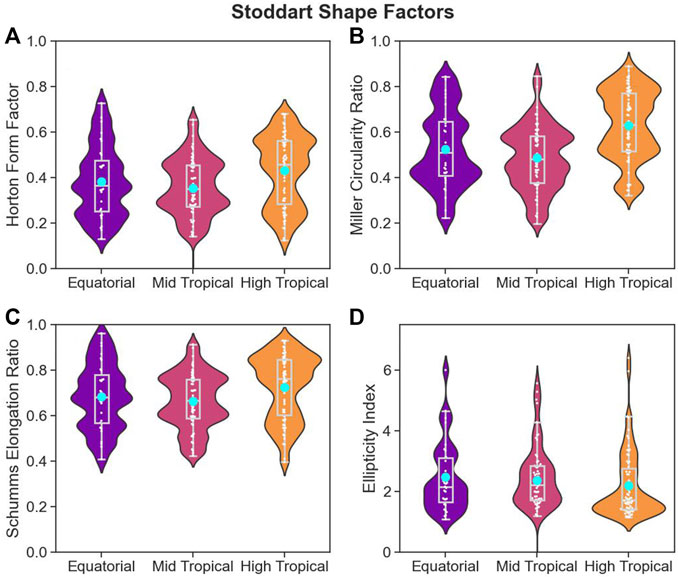
FIGURE 8. Violin plot of shape factors used in Stoddart (1965) for atolls grouped by latitude, with overlain points in white, boxplot showing median and quartiles in light grey, and cyan circular marker indicating the mean of each shape factor the mean of each shape factor: (A) Horton Form Factor, (B) Miller Circularity Ratio, (C) Schumms Elongation Ratio, and (D) Ellipticity Index as specified in Supplementary Text S2.
Across all our atolls analyzed, the ocean reef width (distance between the ocean-side of the motu and the ocean-side of the reef-flat) has the narrowest distribution of widths indicating that it varies the least across all atolls (Figure 9A) in comparison to our other width measurements. The total reef flat width has the widest distribution with the largest range of measurements especially among the equatorial atolls (Figure 9C). Equatorial atolls consistently have lower peak densities, and thus have a wider distribution of widths compared to our other two groups of atolls (Figures 9B–F) and are statistically distinct from mid-tropical and high-tropical atolls (Supplementary Table S6, p-value <0.001). High tropical atolls have the narrowest distributions of widths compared to our other two latitude categories. The mid tropical atoll morphologies lie between the equatorial and high tropical atolls with motu width and ocean reef width more closely aligned with the high tropical atolls, while the effective reef flat width and lagoon reef width more closely match the equatorial atolls. Ocean reef width for the equatorial atolls has a bimodal distribution with a skew toward wider widths. Conversely, both mid and high tropical atolls show unimodal distributions (Figure 9E). The equatorial atolls also exhibit distinctly more skew towards wider motu (Figure 9B). Overall, we see a strong tendency for distinct groupings of atoll morphometrics at these different latitudes.
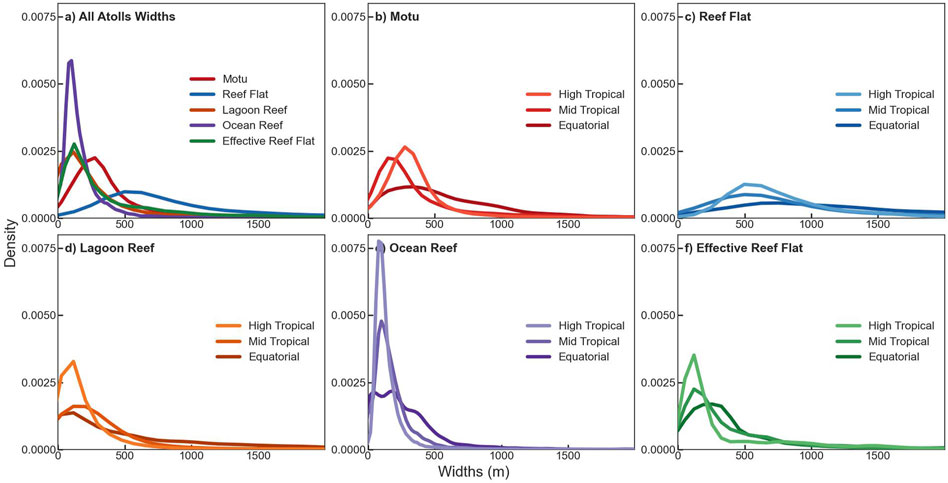
FIGURE 9. Density function of width measurements for all atolls on a per-point basis grouped by latitude. (A) atoll wide widths, (B) motu width, (C) total reef flat width, (D) lagoon reef flat width, (E) ocean reef flat width, and (F) effective reef flat width.
High tropical atolls have a narrower distribution of motu area than either equatorial or mid tropical atolls with the larger motu dominated by longer (up to 20 km) and relatively narrow motu (Figure 10C). However, equatorial motu have a very large range in motu area (Figure 2 - purple line) dominated by very long motu lengths (more than double the lengths of large motu in other regions) (Figure 10A). The mid tropical motu are dominated by relatively short and stubby motu that are less wide and long than either the equatorial or high tropical motu (pink 2D histogram of motu width and length, Figure 10B). The equatorial motu are statistically different for motu area and width compared to both the mid-tropical and high-tropical motu (Dunn Test, p-value <0.016, Supplementary Table S7).
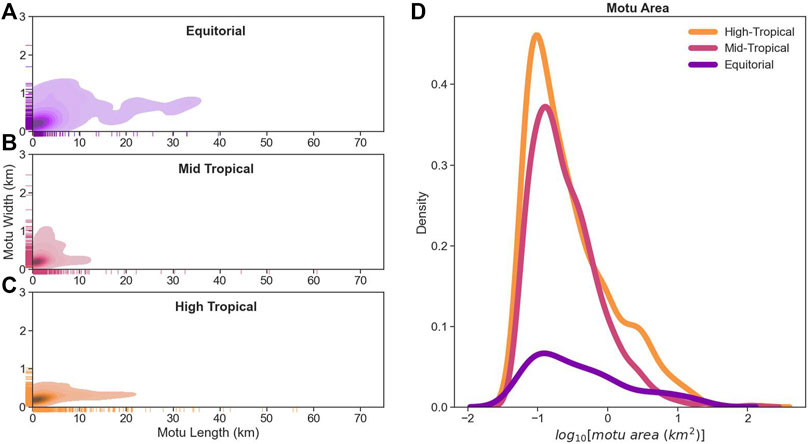
FIGURE 10. Density function of (D) log10 (motu area) for all atolls on a per-motu basis grouped by latitude, with 2D distribution of motu length and motu width for (A) equatorial (purple), (B) mid tropical (pink), and (C) high tropical motu (orange).
In order to validate our methodology, we compared the calculated morphometrics presented in this paper with values reported in previous studies on atolls (Figure 11). Similar to Holdaway et al. (2021), we performed this validation at the atoll scale for the land area, reef-flat area, and lagoon area using the bias (mean error between previously reported morphometrics and our calculated morphometrics) and Brier Skill Score (estimate of error in our morphometrics to variance of previously reported morphometrics) (Gharagozlou et al., 2020). In general, our estimates of area are close to previously reported values especially for total land area and lagoon area (Figure 11). While, our estimates of both reef-flat area and lagoon area (Figures 11B,C) are consistently under-predicting the total area with a bias of 26.5 km2 and 4.4 km2 respectively. Our morphometrics over-predict total land area per atoll on average by 3.1 km2 (Figure 11A). This bias is perhaps driven by the inability of our Landsat composites (at 30 m resolution) and subsequent k-means classification to easily differentiate narrow shallow channels (15–50 m) between motu and instead merge these into one larger motu, as happened with Faaite, M5 (Figure 3). However, all our calculations of total area per atoll have an excellent Brier Skill Score and follow reported landcover areas well.
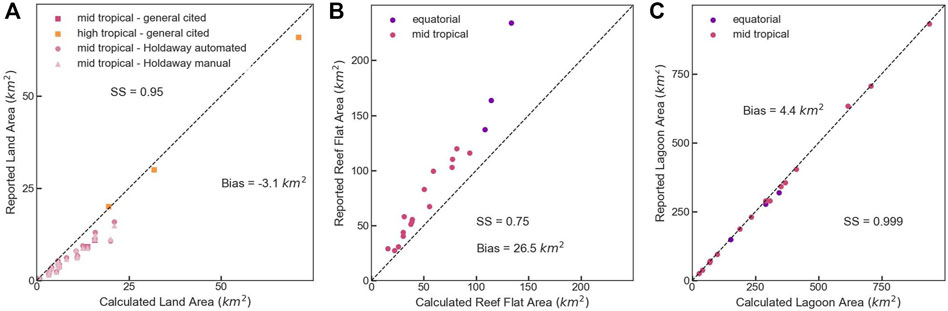
FIGURE 11. Validation of per-atoll morphometrics comparing calculated to previously reported morphometrics for (A) total land area, (B) total reef-flat area, and (C) total lagoon area with calculated Skill Score (SS) and Bias and 1:1 line (black dashed).
Using the data generated, we quantify motu and reef flats morphometrics as well as tease out potential patterns in morphology and possible causes. When a motu is long enough, the distance from the motu to the ocean-side reef flat reaches a near constant width (Figure 7; Figure 12). When considered directionally, the northern and eastern shores of the French Polynesia atolls consistently have more motu that are longer (8–9 km) and block a larger percentage of the reef flat (85%–95%) than the south and western sides (3–7 km and 43%–66%, Figure 6; Table 1). Moreover, the total reef flat tends to be narrower as does the ocean reef width (critical reef-flat width in front of the motu) on the N and E compared to the S and W with less variability in the measurements (Figure 5; Table 1). While on the Southern and Western sides, the reef flat width has a bimodal distribution with a secondary peak occurring at a wider width of ∼1.5 km (Figure 4C). As the north and east have a majority of the reef flat length blocked by motu (>85%), with only 43% percent blocked in the south, there is a clear correlation between length of motu blocked and reef flat width.
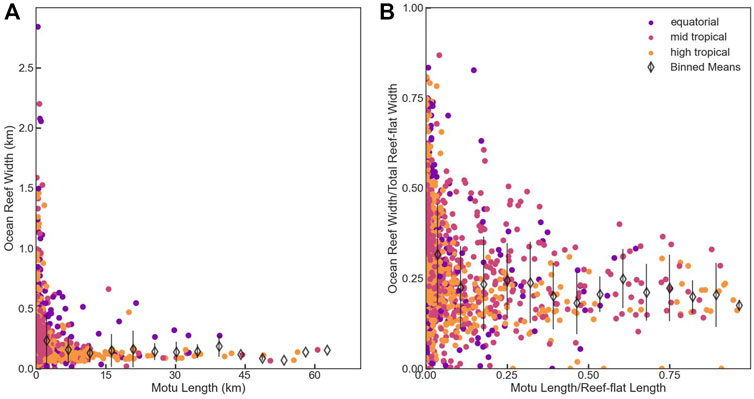
FIGURE 12. (A) Reef flat width in front of motu (ocean reef width) vs. motu length on a per motu basis classified by latitude (n = 1,733) with mean ocean reef-width (black diamonds) binned per motu length with standard deviation. (B) Reef flat width in front of the motu normalized by the width of the total reef flat under the motu vs. the motu length normalized by the length of the reef flat the motu is on classified by latitude with mean normalized ocean reef-width (black diamonds) binned per normalized motu length with standard deviation. Each circular point represents one motu classified as equatorial atolls (purple): 0°–4.7°, mid tropical atolls (pink): 4.7°–14°, and high tropical atolls (orange): >14°.
The trend of a near constant reef-flat width continues when looking at our global morphometrics of motu beyond just French Polynesia (Figure 7; Figure 12A). For all motu, we see a statistically distinct variation in ocean reef flat width of the equatorial motu compared to the mid-tropical and high-tropical motu (p-value <0.001, Supplementary Table S8). For all motu >1 km in length, the mean ocean reef width is 184 ± 93 m (n = 724/1,679); and as the motu increase in length (>10 km), the width decreases to a mean ocean reef width of 143 ± 91 m (n = 88/1,679) (Figure 12A). There is an increased statistical difference between our latitudinal grouping (Supplementary Table S8, p-value <0.011) for our larger motu (>1 km). There are variations between our different groups of atolls, with the equatorial atolls exhibiting a larger and more variable critical reef-flat width for all large motu (>1 km), 282 ± 157 m (n = 87/168), compared to the mid and high tropical atolls, 193 ± 88 m (n = 300/687) and 150 ± 68 m (n = 337/824) respectively (Figure 12A). Based on our statistical analyses (non-parametric Kruskal Wallis Test and posthoc Dunn Test), the mean ocean reef width in front of larger motu (>1 km in motu length) is a statistically distinct population from the measured mean ocean reef width’s in front of the smaller motu (Supplementary Table S9), and this pattern holds true within each region.
However, when we normalize the motu by the size of the atoll (Figure 12B), we find that for motu occupying >10% of the total reef-flat length, the ocean reef width is about 22% of the total reef-flat width (n=329/1,679). Increasing the cutoff for only motu that occupy at least 25% of the reef flat length, the averages remain similar across all atoll groups (equatorial: 23%, mid tropical: 25%, and high tropical: 17%) but the errors decrease slightly, as seen earlier with French Polynesia (Figure 7C). Again, the populations of motu occupying at least 10% of the reef flat length (i.e., large motu) are statistically distinct from the smaller motu across all our locations and within each region (Supplementary Table S9).
Our results highlight that the equatorial atolls have wider reef-flats dominated by larger motu, but still about a fifth of the total width of the reef-flat remains open in front of all large motu across all 154 atolls. This trend of a near constant reef-flat width in front of the motu implies that there may be an equilibrium ocean reef width in front of large motu as suggested by Ortiz and Ashton (2019) modeling in XBeach. A key assumption to their conceptual model is that the motu modeled were long-enough to not be affected by flow around the motu into the lagoon; thus, long motu are the best natural proxy.
Using the data generated, we quantify motu and reef flats morphometrics as well as tease out potential patterns in morphology and possible causes. Building upon Ortiz and Ashton’s (2019) conceptual model of motu formation and evolution, we propose an updated simple model of motu self-organization to account for varying patterns seen in our global dataset (Figure 13). Motu formation starts with the deposition of coarse sediment near the mid-point of the reef-flat evolving to a sub-aerial landmass (Figures 13.1–2). Once there are several motu along a section of reef flat, the system may evolve in two paths. If the motu stay separate, i.e., the shallow channels between the motu (also called by the Polynesian term, hoa) stay active, the sediment supply from ocean-side reefs could cause the reef flat to prograde towards the lagoon and widen over time (Figure 13.3A) as predicted by the XBeach modeling done by Ortiz and Ashton (2019). If the motu merge, such that sediment can no longer pass to the lagoon around the motu, that same sediment supply should prograde the motu oceanward as predicted by Ortiz and Ashton’s XBeach modeling (Figure 13.3B). The progradation and widening of the motu will continue until the reef flat in front of that motu reaches a critical width (our measurement of ocean reef width). The proposed conceptual model of self-organization is one possible explanation for the increased length of the lagoon vs. ocean shoreline as discussed for Faaite (Figure 3). As motu merge both shorelines will be sinusoidal, but as the ocean side progrades the shoreline will start to smooth and parallel the shoreline of the reef flat on the ocean-side, while the lagoon side will stay sinusoidal.
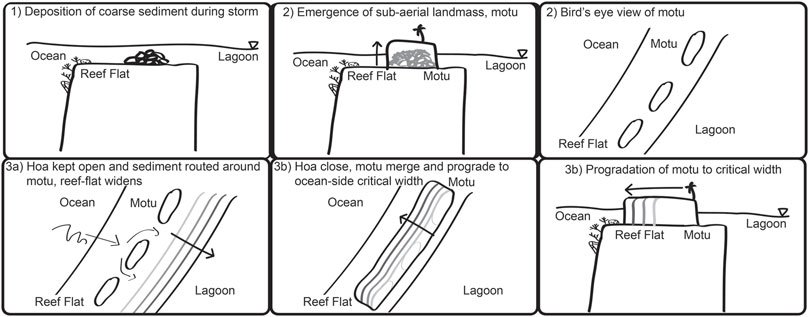
FIGURE 13. Conceptual model of motu formation and evolution on the reef flat adapted from Ortiz and Ashton (2019) from initial motu creation and emergence (1–2) to divergence of motu evolution leading to widening of the underlying reef-flat (3a) or narrowing of the motu to ocean side reef flat (ocean reef width) with elongated motu (3b).
Once a motu exceeds at least 1 km in length, the distance from the motu to the ocean-side reef flat reaches a near constant width (Figure 7 and Figure 12). Our proposed conceptual model helps explain why there are wider reef-flats on the parts of atolls with smaller motu (in area and length). The reef flats continue to prograde and widen over time as sediment continues to reach the lagoon and is not blocked by larger motu. In addition, we see that the sides of atolls dominated by longer and larger motu, consistently have narrower reef-flat widths. Our conceptual model thus can be used as one potential explanation for these morphometric patterns on the different shores of atolls in French Polynesia.
Our proposed simplified model fits with existing motu development models such as that proposed by Montaggioni et al. (2021) based on field work within French Polynesia. Their three-step model focused on reef flat deposition and the roll of storm surges in adding rubble sheets and conglomerates enabling lithification under changing sea-levels. Their model discusses the interplay between the formation of cemented conglomerate platforms and the development of motu (termed reef-rim islands). In particular, they note the key role that larger grain sediment (conglomerates) serve as a foundation for the reef-rim islands. Based on uranium-thorium dating of 57 conglomerate clasts, they found that conglomerates were oldest closest to the lagoon and younger closer to the ocean-side reef flat; thus concluding that these conglomerate sheets were accreted from lagoon side to the ocean side on the underlying reef platform. Thus, their evidence supports the oceanward progradation of the motu on top of these conglomerate foundations (Figures 13–3B). Our current analyses do not differentiate sediment size or type in the Landsat imagery, and we lump all sub-aerial deposits as motu and all shallow sub-aqueous as reef flat. Our proposed conceptual model, therefore, does not address the potential role of sediment type or size in formation once the motu exist. Nor does it address the role of sea-level rise or storms. We aim to explore the potential impact of wave climate and storms on motu evolution in our future work. However, our simplified conceptual model does raise one potential process driving self-organization of these motu (the role of shallow channels between motu and what enables them to remain active or sedimented in leading to larger merged motu) and provides questions for our future research focus.
Similar to Goldberg (2016), we find an asymmetric distribution of motu around the atoll, especially within French Polynesia, that previously has been linked to dominant wind or wave climate (Andréfouët et al., 2012; Yates et al., 2013). Our current analysis, however, does not include comparing our morphometrics to local wind, wave, and storm climates. We are unable to posit why we see these patterns or what processes are driving the spatial patterns in our dataset, however, answering these questions is a key focus of our future research.
As Stoddart (1965) found, atoll morphology is generally not circular, with a mean ratio of 2.1 length to width of the entire atoll. Even across the large range in the magnitude of atoll dimensions, i.e. 3 orders of magnitude for atoll area, we see a consistent pattern in predicted morphometrics for overall shape favoring a more elliptical and elongated rather than annular or circular atoll. Our tightly clustered distribution of atoll shape factors (Figure 8) mirrors Stoddart’s (1965) earlier work (Supplementary Figure S2).
While our database covers an extensive range of atolls and morphometrics, it is limited to less than half of the available temporal composites created. In addition, another 100–200 locations typically considered atolls (Bryan, 1953; Goldberg, 2016), are not currently measured here due to lack of quality temporal composites. Only atolls with sufficient Landsat coverage had temporal composites created, and some atolls with a more fractal-like morphology (i.e., parts of the Maldives) were not able to be run in our morphometric code. This resulted in using atolls primarily from the Pacific Ocean that have clearly defined lagoons. We are also biased towards larger motu due to the 30 m resolution of the Landsat imagery and the size of motu and reef flat necessary to run the full morphometric code. Lastly, several assumptions are made in our current code that limit its flexibility from assuming that largest area in our composite is water to assuming that there are only three dominant landcover classes and that k-means unsupervised classification is the best method for classifying our imagery. Future work is geared towards implementing a more robust and accurate method for image classification and segmentation, i.e., not using k-means unsupervised classification, to enable expansion of our database beyond the initial 154 atolls.
We have developed a global database of atolls along with a methodology to systematically create temporal Landsat composites and measure morphometrics of three landcover classes (land, water, and reef flats). Our code enables quick and easy comparison between different scales of our database from investigating the variability in motu morphometrics at a single atoll to a regional grouping to a global analysis. With the use of pandas dataframes, all the morphometrics can be grouped based on shoreline orientation, relative position on the atoll, or per-object. We have highlighted several potential binning methods to analyze the patterns found in our database (such as using the relative position on the atoll for exploring the spatial heterogeneity of motu distributions in French Polynesia by segregating into N, E, S, and W). Distinct and quantifiable differences were shown in the location of motu on atolls within a region (French Polynesia) and globally based on latitude. The code to create composites and measure morphometrics is available for other researchers to use. This automated analysis will allow for the direct comparison of data, providing one possible answer to Duvat and Magnan’s (2019) call for research priority of creating a common assessment protocol. Further research includes extending the analysis of our dataset by comparing the morphometrics with potential drivers such as waves, storms, and anthropogenic activities to explain differences in the behavior for either directionality for a specific regions or different latitudes (i.e., in French Polynesia wave climate and directionality of the motu widths, presence on the reef flat).
The datasets presented in this study can be found in online repositories. The names of the repository/repositories and accession number(s) can be found in the article/Supplementary Material.
FJ was primarily responsible for data curation, formal analysis, software development, visualization, and writing the original draft. AO was primarily responsible for conceptualization of the project, funding acquisition, investigation, methodology development, validation, project administration and supervision, and reviewing and editing this paper.
The authors acknowledge funding from the Southeast Climate Adaptation Science Center for FJ as a Global Change Fellow. In addition, this work has been supported by AAUW Research Publication Grant in Engineering, Medicine and Science Award as well as by the Colby College Davis AI Institute Sabbatical Fellowship.
The authors would like to thank Sean Daly for the initial creation of the inclusive Atoll Database. The authors would also like to thank Drs. R. Palermo and E. Wallace for their suggestions and comments on the manuscript.
The authors declare that the research was conducted in the absence of any commercial or financial relationships that could be construed as a potential conflict of interest.
All claims expressed in this article are solely those of the authors and do not necessarily represent those of their affiliated organizations, or those of the publisher, the editors and the reviewers. Any product that may be evaluated in this article, or claim that may be made by its manufacturer, is not guaranteed or endorsed by the publisher.
The Supplementary Material for this article can be found online at: https://www.frontiersin.org/articles/10.3389/feart.2023.1123339/full#supplementary-material
Albert, S., Leon, J. X., Grinham, A. R., Church, J. A., Gibbes, B. R., and Woodroffe, C. D. (2016). Interactions between sea-level rise and wave exposure on reef island dynamics in the Solomon Islands. Environ. Res. Lett. 11, 054011. doi:10.1088/1748-9326/11/5/054011
Andréfouët, S., Ardhuin, F., Queffeulou, P., and Le Gendre, R. (2012). Island shadow effects and the wave climate of the Western Tuamotu Archipelago (French Polynesia) inferred from altimetry and numerical model data. Mar. Pollut. Bull. 65, 415–424. doi:10.1016/j.marpolbul.2012.05.042
Aslam, M., and Kench, P. S. (2017). Reef island dynamics and mechanisms of change in huvadhoo atoll, republic of Maldives, Indian ocean. Anthropocene 18, 57–68. doi:10.1016/j.ancene.2017.05.003
Barnett, J., and Adger, W. N. (2003). Climate dangers and atoll countries. Clim. Change 61, 321–337. doi:10.1023/B:CLIM.0000004559.08755.88
Brander, R. W., Kench, P. S., and Hart, D. (2004). Spatial and temporal variations in wave characteristics across a reef platform, Warraber Island, Torres Strait, Australia. Mar. Geol. 207, 169–184. doi:10.1016/j.margeo.2004.03.014
Bryan, E. H. (1953). “Check list of atolls” in Atoll Research Bulletin 19, 1–38. doi:10.5479/si.00775630.19.1
Daly, R. A. (1925). Pleistocene changes of level. Am. J. Sci. s5-10, 281–313. doi:10.2475/ajs.s5-10.58.281
Darwin, C. (1842). On the structure and distribution of coral reefs: Being the first part of the geology of the voyage of the beagle under the command of captain fitzroy, RN during the years 1832 to 1836. Elder: Smith.
Duvat, V. K. E., and Magnan, A. K. (2019). Rapid human-driven undermining of atoll island capacity to adjust to ocean climate-related pressures. Sci. Rep. 9, 15129. doi:10.1038/s41598-019-51468-3
Duvat, V. K. E., and Pillet, V. (2017). Shoreline changes in reef islands of the central pacific: Takapoto atoll, northern tuamotu, French Polynesia. Geomorphology 282, 96–118. doi:10.1016/j.geomorph.2017.01.002
Duvat, V. K. E. (2019). A global assessment of atoll island planform changes over the past decades. Wiley Interdiscip. Rev. Clim. Chang. 10, e557. doi:10.1002/wcc.557
Eyre, B. D., Cyronak, T., Drupp, P., De Carlo, E. H., Sachs, J. P., and Andersson, A. J. (2018). Coral reefs will transition to net dissolving before end of century. Sci. (80-. ) 359, 908–911. doi:10.1126/science.aao1118
Fletcher, B. C. H., and Richmond, B. M. (2010). Climate change in the Federated States OF Micronesia: Food and water secutiy, climate risk management, and adaptive strategies. Available at: http://seagrant.soest.hawaii.edu/sites/default/files/publications/1webfinal_maindocument_climatechangefsm.pdf.
Ford, M. R., and Kench, P. S. (2014). Formation and adjustment of typhoon-impacted reef islands interpreted from remote imagery: Nadikdik Atoll, Marshall Islands. Geomorphology 214, 216–222. doi:10.1016/j.geomorph.2014.02.006
Ford, M. R., and Kench, P. S. (2015). Multi-decadal shoreline changes in response to sea level rise in the Marshall Islands. Anthropocene 11, 14–24. doi:10.1016/j.ancene.2015.11.002
Ford, M. (2011). Shoreline changes on an urban atoll in the central Pacific ocean: Majuro atoll, Marshall Islands. J. Coast. Res. 11–22, 11–22. doi:10.2112/JCOASTRES-D-11-00008.1
Garcin, M., Vendé-Leclerc, M., Maurizot, P., Le Cozannet, G., Robineau, B., and Nicolae-Lerma, A. (2016). Lagoon islets as indicators of recent environmental changes in the South Pacific–The New Caledonian example. Cont. Shelf Res. 122, 120–140. doi:10.1016/j.csr.2016.03.025
Gharagozlou, A., Dietrich, J. C., Karanci, A., Luettich, R. A., and Overton, M. F. (2020). Storm-driven erosion and inundation of barrier islands from dune-to region-scales. Coast. Eng. 158, 103674. doi:10.1016/J.COASTALENG.2020.103674
Gischler, E. (2016). Guyot, atoll BT - encyclopedia of marine geosciences. Editors J. Harff, M. Meschede, S. Petersen, and Jö. Thiede (Dordrecht: Springer Netherlands), 302–309. doi:10.1007/978-94-007-6238-1_130
Goldberg, W. M. (2016). Atolls of the world: Revisiting the original checklist. Atoll Res. Bull. 2016, 1–47. Available at: https://www.researchgate.net/profile/Walter_Goldberg/publication/304573204_Atolls_of_the_World_Revisiting_the_Original_Checklist/links/5a2964670f7e9b63e534f66e/Atolls-of-the-World-Revisiting-the-Original-Checklist.pdf. doi:10.5479/si.0077-5630.610
Hamylton, S. M., Leon, J. X., Saunders, M. I., and Woodroffe, C. D. (2014). Simulating reef response to sea-level rise at lizard island: A geospatial approach. Geomorphology 222, 151–161. doi:10.1016/j.geomorph.2014.03.006
Hoeke, R. K., McInnes, K. L., Kruger, J. C., McNaught, R. J., Hunter, J. R., and Smithers, S. G. (2013). Widespread inundation of Pacific islands triggered by distant-source wind-waves. Glob. Planet. Change 108, 128–138. doi:10.1016/j.gloplacha.2013.06.006
Holdaway, A., Ford, M., and Owen, S. (2021). Global-scale changes in the area of atoll islands during the 21st century. Anthropocene 33, 100282. doi:10.1016/j.ancene.2021.100282
Kench, P. S., McLean, R. F., and Nichol, S. L. (2005). New model of reef-island evolution: Maldives, Indian ocean. Geology 33, 145. doi:10.1130/g21066.1
Kench, P. S., Chan, J., Owen, S. D., and McLean, R. F. (2014a). The geomorphology, development and temporal dynamics of Tepuka Island, Funafuti atoll, Tuvalu. Geomorphology 222, 46–58. doi:10.1016/j.geomorph.2014.03.043
Kench, P. S., Owen, S. D., and Ford, M. R. (2014b). Evidence for coral island formation during rising sea level in the central Pacific Ocean. Geophys. Res. Lett. 41, 820–827. doi:10.1002/2013GL059000
Kench, P. S., Beetham, E., Bosserelle, C., Kruger, J., Pohler, S. M. L. M. L., Coco, G., et al. (2017). Nearshore hydrodynamics, beachface cobble transport and morphodynamics on a Pacific atoll motu. Mar. Geol. 389, 17–31. Available at: https://www.sciencedirect.com/science/article/pii/S0025322716303668. (Accessed December 7, 2018). doi:10.1016/j.margeo.2017.04.012
Kench, P. S., Ford, M. R., and Owen, S. D. (2018). Patterns of island change and persistence offer alternate adaptation pathways for atoll nations. Nat. Commun. 9, 605. doi:10.1038/s41467-018-02954-1
Kench, P. S., Owen, S. D., Beetham, E. P., Mann, T., McLean, R. F., and Ashton, A. (2020). Holocene sea level dynamics drive formation of a large atoll island in the central Indian Ocean. Glob. Planet. Change 195, 103354. doi:10.1016/j.gloplacha.2020.103354
Kench, P. S., Liang, C., Ford, M. R., Owen, S. D., Aslam, M., Ryan, E. J., et al. (2023). Reef islands have continually adjusted to environmental change over the past two millennia. Nat. Commun. 14, 508. doi:10.1038/s41467-023-36171-2
Kumar, L (Editor) (2020). Climate change and impacts in the pacific (Cham: Springer International Publishing). doi:10.1007/978-3-030-32878-8
Ladd, H. S. (2012). Types of coral reefs and their distribution. Biol. Geol. Coral Reefs V4 Geol. 2, 1.
Mateo-García, G., Gómez-Chova, L., Amorós-López, J., Muñoz-Marí, J., and Camps-Valls, G. (2018). Multitemporal cloud masking in the Google Earth engine. Remote Sens. 10, 1079. doi:10.3390/rs10071079
McLean, R., and Kench, P. (2015). Destruction or persistence of coral atoll islands in the face of 20th and 21st century sea-level rise? Wiley Interdiscip. Rev. Clim. Chang. 6, 445–463. doi:10.1002/wcc.350
Montaggioni, L. F., Salvat, B., Aubanel, A., Eisenhauer, A., and Martin-Garin, B. (2018). The mode and timing of windward reef-island accretion in relation with holocene sea-level change: A case study from takapoto atoll, French Polynesia. Geomorphology 318, 320–335. doi:10.1016/j.geomorph.2018.06.015
Montaggioni, L. F., Martin-Garin, B., Salvat, B., Aubanel, A., Pons-Branchu, E., Paterne, M., et al. (2021). Coral conglomerate platforms as foundations for low-lying, reef islands in the French Polynesia (central south Pacific): New insights into the timing and mode of formation. Mar. Geol. 437, 106500. doi:10.1016/j.margeo.2021.106500
Nunn, P. D., Kumar, L., McLean, R., and Eliot, I. (2020). “Islands in the Pacific: Settings, distribution and classification,” in Springer climate (Springer), 33–170. doi:10.1007/978-3-030-32878-8_2
Ortiz, A. C., and Ashton, A. D. (2019). Exploring carbonate reef flat hydrodynamics and potential formation and growth mechanisms for motu. Mar. Geol. 412, 173–186. doi:10.1016/j.margeo.2019.03.005
Ortiz, A. C., Roy, S., and Edmonds, D. A. (2017). Land loss by pond expansion on the Mississippi river delta plain. Geophys. Res. Lett. 44, 3635–3642. doi:10.1002/2017GL073079
Perry, C. T., Kench, P. S., Smithers, S. G., Yamano, H., O’Leary, M., and Gulliver, P. (2013). Time scales and modes of reef lagoon infilling in the Maldives and controls on the onset of reef island formation. Geology 41, 1111–1114. doi:10.1130/G34690.1
Richmond, B. M. (1992). “Development of atoll islets in the central Pacific,” in Proceedings of the 7th international coral reef congress, 1185–1194.
Schlager, W., and Purkis, S. J. (2013). Bucket structure in carbonate accumulations of the Maldive, Chagos and Laccadive archipelagos. Int. J. Earth Sci. 102, 2225–2238. doi:10.1007/s00531-013-0913-5
Sengupta, M., Ford, M. R., and Kench, P. S. (2021). Multi-decadal planform changes on coral reef islands from atolls and mid-ocean reef platforms of the equatorial Pacific Ocean: Gilbert Islands, Republic of Kiribati. Geomorphology 389, 107831. doi:10.1016/j.geomorph.2021.107831
Shope, J. B., and Storlazzi, C. D. (2019). Assessing morphologic controls on atoll island alongshore sediment transport gradients due to future sea-level rise. Front. Mar. Sci. 6, 245. doi:10.3389/fmars.2019.00245
Shope, J. B., Storlazzi, C. D., and Hoeke, R. K. (2017). Projected atoll shoreline and run-up changes in response to sea-level rise and varying large wave conditions at Wake and Midway Atolls, Northwestern Hawaiian Islands. Geomorphology 295, 537–550. doi:10.1016/j.geomorph.2017.08.002
Stoddart, D. R. (1965). The shape of atolls. Mar. Geol. 3, 369–383. doi:10.1016/0025-3227(65)90025-3
Storlazzi, C. D., Elias, E. P. L., and Berkowitz, P. (2015). Many atolls may be uninhabitable within decades due to climate change. Sci. Rep. 5, 14546. doi:10.1038/srep14546
Toomey, M., Ashton, A. D., and Perron, J. T. (2013). Profiles of ocean island coral reefs controlled by sea-level history and carbonate accumulation rates. Geology 41, 731–734. doi:10.1130/G34109.1
Toomey, M. R., Ashton, A. D., Raymo, M. E., and Perron, J. T. (2016). Late Cenozoic sea level and the rise of modern rimmed atolls. Palaeogeogr. Palaeoclimatol. Palaeoecol. 451, 73–83. doi:10.1016/j.palaeo.2016.03.018
Webb, A. P., and Kench, P. S. (2010). The dynamic response of reef islands to sea-level rise: Evidence from multi-decadal analysis of island change in the Central Pacific. Glob. Planet. Change 72, 234–246. doi:10.1016/j.gloplacha.2010.05.003
Woodroffe, C. D., and Biribo, N. (2011). “Atolls,” in Encyclopedia of modern coral reefs: Structure, form and process. Editor D. Hopley (Netherlands: Springer).
Woodroffe, C. D., McLean, R. F., Smithers, S. G., and Lawson, E. M. (1999). Atoll reef-island formation and response to sea-level change: West island, cocos (keeling) islands. Mar. Geol. 160, 85–104. doi:10.1016/s0025-3227(99)00009-2
Woodroffe, C. D. (2008). Reef-island topography and the vulnerability of atolls to sea-level rise. Glob. Planet. Change 62, 77–96. doi:10.1016/j.gloplacha.2007.11.001
Keywords: atoll morphometrics, global database, Landsat, Python, motu
Citation: Johnson FM and Ortiz AC (2023) Finding patterns of atoll morphometrics at a range of spatial scales. Front. Earth Sci. 11:1123339. doi: 10.3389/feart.2023.1123339
Received: 13 December 2022; Accepted: 27 February 2023;
Published: 10 March 2023.
Edited by:
Hema Achyuthan, Anna University, IndiaReviewed by:
Hajime Kayanne, The University of Tokyo, JapanCopyright © 2023 Johnson and Ortiz. This is an open-access article distributed under the terms of the Creative Commons Attribution License (CC BY). The use, distribution or reproduction in other forums is permitted, provided the original author(s) and the copyright owner(s) are credited and that the original publication in this journal is cited, in accordance with accepted academic practice. No use, distribution or reproduction is permitted which does not comply with these terms.
*Correspondence: Alejandra C. Ortiz, YWNvcnRpekBjb2xieS5lZHU=
Disclaimer: All claims expressed in this article are solely those of the authors and do not necessarily represent those of their affiliated organizations, or those of the publisher, the editors and the reviewers. Any product that may be evaluated in this article or claim that may be made by its manufacturer is not guaranteed or endorsed by the publisher.
Research integrity at Frontiers
Learn more about the work of our research integrity team to safeguard the quality of each article we publish.