 Rongrong Sun
 Chaoying Zhao
 Bin Li3
95% of researchers rate our articles as excellent or good
Learn more about the work of our research integrity team to safeguard the quality of each article we publish.
Find out more
ORIGINAL RESEARCH article
Front. Earth Sci. , 20 March 2023
Sec. Environmental Informatics and Remote Sensing
Volume 11 - 2023 | https://doi.org/10.3389/feart.2023.1121868
This article is part of the Research Topic Management and Monitoring of Natural Disasters Using Remote Sensing and Ground-Based Data View all 5 articles
Shuicheng District is a karst mountain area, located in Guizhou Province, China. Its fragile stratum and frequent underground mining activities makes it prone to landslides. Owning to its wide coverage and frequent revisit, the InSAR technology has advantages in potential landslide identification and deformation monitor. However, affected by dense vegetation and atmospheric delay, it is much difficult to get sufficient effective targets to derive the deformation in this area. Besides, deformation derived from single orbit SAR data can result in the missing identification of some potential landslides and the misinterpreting of the real kinematics process of landslides. In this study, the multi-source SAR data, atmospheric error correction by quadratic tree image segmentation method, and phase-stacking method were selected to derive the surface deformation of this area. Besides, DS-InSAR and MSBAS method were combined to derive the deformation of Pingdi landslide. First, the potential landslides in this area were identified, surface deformation result, optical remote sensing images and geomorphological features were jointly considered. Then, the landslide distribution characteristics was analyzed in terms of slope, elevation and stratum. After that, the deformation along the LOS direction was acquired using the DS-InSAR method. The MSBAS method was used to retrieve the two-dimensional deformation of Pingdi landslide. Finally, the comprehensive analysis of triggering factors and failure process were conducted according to the spatial-temporal deformation characteristics and field investigation. The results indicated that landslides in Shuicheng district were mostly located in the junction of T1 and P3 stratum and mining related. Mining activity was the main cause of the Pingdi landslide deformation, the precipitation was the driving factor of the landslide instability. The research provides an insight into the explore the unstable slope distribution characteristic and the failure process of the landslides.
China has the largest karst area in the world, accounting for nearly 1/3 of the total area of karst in China (Wu, 1998). Because of the complex geomorphologic environment, fragile stratum environment and frequent underground mining activities, large-scale landslides and severe casualties occurred frequently in karst mountain areas (Huang et al., 2011; Zhao et al., 2022; Zhong et al., 2022). For example, on 3 December 2004, a catastrophic landslide caused by mining activity occurred at the front edge of the mountain in Zongling town, China, causing 39 deaths, thirteen people injured, and five people missing (Wu et al., 2006; Wang et al., 2020); on 2 August 2017, a combination of rainfall and mining activity led to a catastrophic landslide in the Pusa Village, Nayong Town, China, resulting in nine missing and 26 deaths (Chen et al., 2020a; Chen et al., 2020b); on 8 May 2022 the Baiyan landslide triggered by underground-mining in Zhijin Town, China, causing 3 deaths (CCTV news, 2022). These landslides were all located in high-altitude areas with steep slopes, caused by mining activities, difficult to detect and forecast in advance and mostly failed suddenly with complicated formation mechanisms (Wu et al., 2006; Wang et al., 2020; Chen et al., 2020a; Chen et al., 2020b; CCTV news, 2022). Although several landslides have been managed, those undetected potential landslides are always a threat. Therefore, it is of great significance to accurately identify potential landslides and analyze the deformation characteristics induced by underground mining activities and reveal the formation mechanism of landslides for the prevention and management of geological disasters.
Previous research of karst landslides mainly focused on the occurred landslide (Zheng et al., 2016; Lin et al., 2018; Kong et al., 2020), and the research methodology was mainly field investigation, geological exploration, and physical modeling (Wu et al., 2006; Gao et al., 2008). Few focused on the large-scale potential landslide identification, distribution characteristics and deformation process of landslide, so the distribution characteristics and kinematic process of potentially unstable slopes is still unknown. Since the slope deformation occur before the landslides (McKean and Josh, 2004), surface deformation monitor can be used for potential landslide identification and provides continuous view of deformation process. To this end, the distribution characteristics, spatial extension and temporal evolution of potential landslides can be explored through the deformation of the slopes.
Interferometric synthetic aperture radar (InSAR) technology has widely used in quick identify (Xu et al., 2014; Fobert et al., 2021) and monitor landslide deformation (Achache et al., 1996; Zhao et al., 2012; Kang et al., 2017; Liu et al., 2021), because of its wide coverage, high precision and frequent revisit. In last 2 decades, lots of advanced InSAR technologies have been proposed to increase the precision and accuracy of surface deformation results. The methods used in karst landslide deformation monitor can be divided into two categories according to the type of coherent targets, persistent scatterers (PS) (Ferretti et al., 2000; Ferretti et al., 2000) and distributed scatterers (DS). The PS can be identified from long temporal series of interferometric SAR images even with baselines larger than the so-called critical baseline (Ferretti et al., 2000). The commonly used advanced PS-InSAR technologies include the Interferometric point target analysis (IPTA) (Werner et al., 2003) and the Stanford method for PS (Hooper et al., 2004). The earliest and simplest use of DS point targets for surface deformation monitoring was the small baseline subset method (Berardino et al., 2002), which weakens the effects of decorrelation by selecting the interferograms with short spatial and temporal baseline. After that, many advanced SBAS-InSAR technologies have been proposed, such as new small baseline subset (NSBAS) (López-Quiroz et al., 2009) and Multidimensional small baseline subsets (MSBAS) (Samsonov and d'Oreye, 2017). To address the issue of high accuracy monitoring of surface deformation in areas with heavy vegetation, the SqueeSAR technology was proposed in 2011 (Ferretti et al., 2011). The basic principle of SqueeSAR technology is that to increase the density of observation targets, PS targets and DS targets are combined to derive surface deformation. In recent years, many scholars have extended and improved the selection of homogeneous points and phase enhancement of DS targets based on SqueeSAR technology. They proposed some improved algorithms, such as the Eigenvalue decomposition based Maximum-likelihood-estimator of Interferometric phase (EMI) (Ansari et al., 2018) and the Fast statistically homogeneous pixel selection (FaSHPS) (Jiang et al., 2015). These advanced DS-InSAR technologies can significantly increase the density of monitoring targets in landslide deformation monitor, especially in lush mountain areas (Chen et al., 2022a).
Atmospheric error is the most important source of InSAR deformation monitoring (Doin et al., 2009; Wang et al., 2022). The phase-stacking InSAR (Sandwell and Price, 1998) can weaken the atmospheric delay phase with random variation characteristics. And for the complex topography of the Karst mountains, the vertical stratification of atmospheric delay is very severe, which usually spatially linear or power-law related to topography (Cavalié et al., 2007; Bekaert et al., 2015) and can be expressed as a function of elevation differences. In the existing methods, a single linear model cannot provide an accurate estimate of the atmosphere in the complex topography area, but quadratic tree image segmentation method can effectively correct it very well (Kang et al., 2021; Jiang et al., 2022).
Shuicheng District, Guizhou, China, a typical karst mountain area and one of the largest coal mining areas in southwest China (Yang and Tang, 2014), was taken as an experimental area. In this study, we designed a technologic route to identify the potential unstable slopes based on Multi-source SAR datasets, which can better overcome the shadow and layover problems intrinsic in single track SAR data, and improve the reliability and accuracy of the unstable slope (Grebby et al., 2021). According to the observation conditions and InSAR error characteristics, we corrected the atmospheric error by quadratic tree image segmentation method, and the phase-stacking method to derive the surface deformation. Then, ground surface deformation information and optical remote sensing imagery were combined to map active landslides. The surface cracks, debris and slopes, and mine locations can be extracted from high resolution optical remote sensing. Whilst deformation derived with InSAR technique can quickly identify the active landslides (Fan et al., 2019; Li et al., 2019).
In addition, an improved DS InSAR and MSBAS methods were conducted to derive the two-dimensional deformation time series of the Pingdi landslide, a typical “upper-hard-and-lower-soft” stratum landslide (Chen et al., 2022b). Furthermore, the effects of trigger factors of slope instability were explored. Finally, the failure process of Pingdi landslide was analyzed by combining the lithology, geomorphological features and the landslide deformation.
The exposed karst mountain area (He et al., 2021) in Shuicheng District is located in Yunnan-Guizhou Plateau, Liupanshui City, Guizhou Province, with a total area of 3,054.92 km2 (Figure 1). The topography is high in the northwest and low in the southeast, with an elevation range of 500–2,900 m. This area belongs to humid subtropical monsoon climate, and is characterized by abundant precipitation and lush vegetation. The annual precipitation is from 1,100 to 1,300 mm, with concentration from May to October, accounting for more than 80% of the annual precipitation.
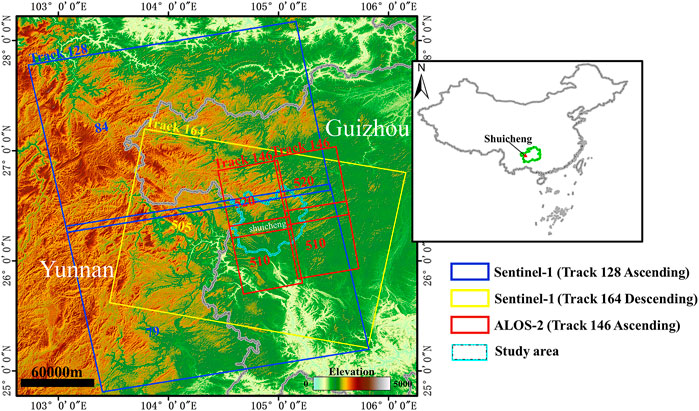
FIGURE 1. The geographic location of the study area and the coverage of Sentinel-1A and ALOS/PALSAR-2 SAR images. The background is the shaded relief of the shuttle radar topography mission (SRTM) digital elevation model. The inset indicates the landslide location in China.
The study area has rich mineral resources, with shallow coal deposits and frequent mining activities (Zhu et al., 2022). Figure 2 is the geological structure of the study area. The Permian, Triassic and Carboniferous strata are well developed and widely distributed, while the Devonian and Jurassic strata are sporadically distributed in blocks. The Permian strata are composed of medium-thick limestone, argillaceous siltstone and coals. Among them the Upper Permian Longtan Formation (P3l) is the primary coal-bearing strata in southwest China (Xiong et al., 2007). The Triassic strata are composed of calcareous dolomite, medium-thick limestone, purplish-red sandstone, and mudstone.
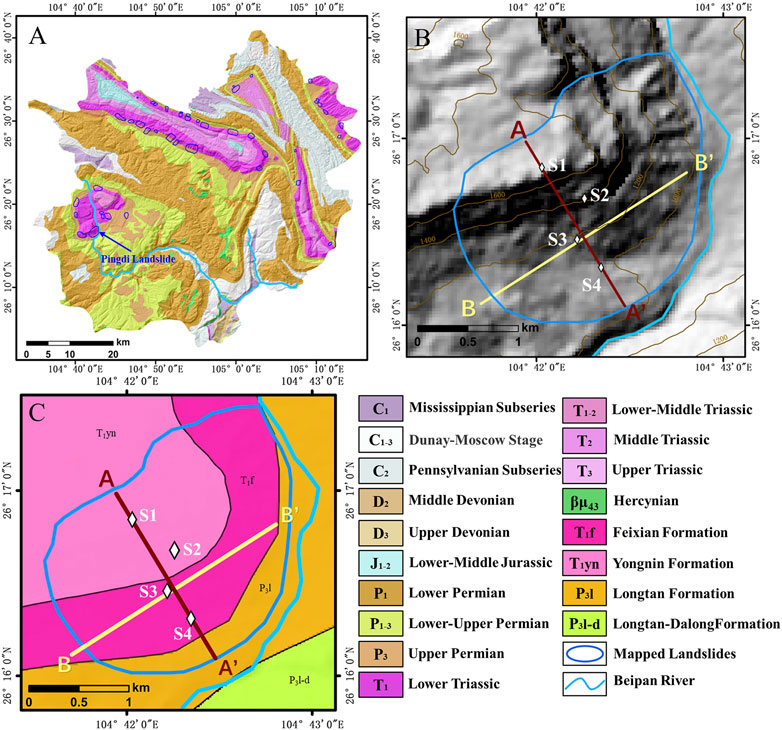
FIGURE 2. (A) Geological settings of the study area, with a scale of 1:250,000, where detected landslides are shown in blue circles. (B) Shaded relief map of the Pingdi landslide, labeled as No.39 in Figure 4D, where two profiles are shown as AA’ and BB’, respectively, and four feature points are labelled. (C) Geological map of the Pingdi landslide with scale of 1:200,000.
Folded deformation and fault structures widespread in this area, and the majority of the rock formations are hard and soft rock layers overlap each other. Weathering on the rocks is severe. Under different weathering conditions, the upper part of the strata forms high steep slopes or cliffs, and the lower part forms gentle slopes. As a result, the area has many high steep slopes and cliffs of hard rocks with soft bases, which constitutes the upper-hard-and-lower-soft stratigraphic structure (Chen et al., 2016). According to such geological factors, coal fields are typically found at the bottom of slopes and coal seams are extracted from within the slopes (Yao, 2020), resulting in thousands of mining-induced landslides in China’s karst mountain areas (Zhu et al., 2022).
The location of the Pingdi landslide is shown in Figure 2A, which is the typical high steep slope landform. The geological map of the Pingdi landslide is shown in Figure 2C. And the geological setting along profile AA’ in Figure 2B is shown in Figure 3, where we can see that the exposed strata from top to bottom are the Lower Triassic Yongning Formation (T1yn), the Lower Triassic Feixianguan Formation (T1f), and the Upper Permian Longtan Formation (P3l). The T1yn and T1f are exposed strata of unstable slope, composed of hard limestone and medium hardness siltstone. The lower layer P3l is the coal-bearing strata, composed of soft argillaceous siltstone, which forms atypical upper-hard-and-lower-soft stratigraphic structure.
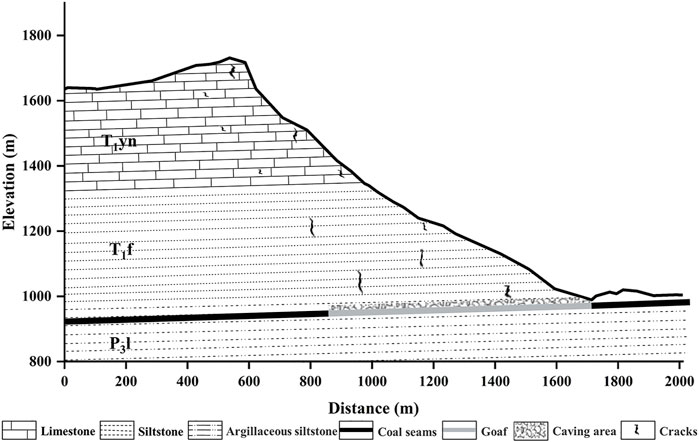
FIGURE 3. Geological settings along profile AA’ of the Pingdi landslide, the location of AA’ is marked in Figure 2B.
With the continuous underground-mining in recent years, the hazardous areas are further expanded. It is necessary to investigate the unstable slopes and to derive its failure process with the influence of underground mining.
In order to detect the distribution of potential landslides in Shuicheng District and to monitor the deformation time series of the Pingdi landslide, a total of 299 SAR images were collected in this study, including three SAR datasets from Sentinel-1A and ALOS/PALSAR-2 satellites. The spatial coverage of the SAR datasets is shown in Figure 1, and the basic parameters of the SAR images are summarized in Table 1.
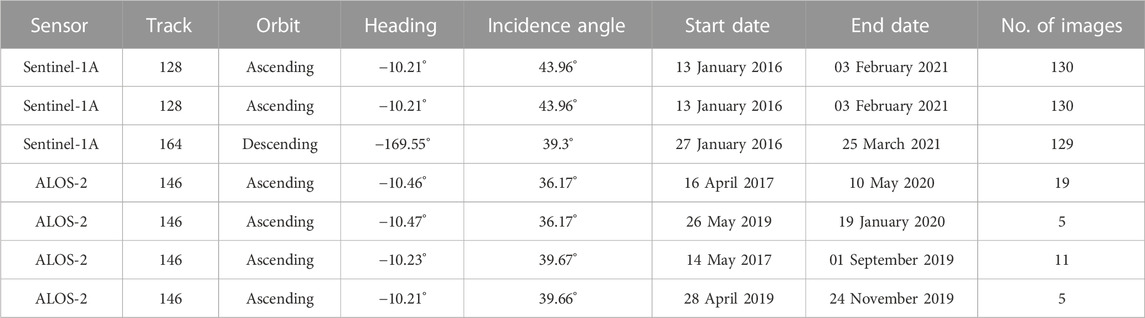
TABLE 1. Basic parameters of the SAR datasets used in this study.
To mitigate the effects of temporal and spatial decorrelation, the Small Baseline Subset (SBAS) strategy (Berardino et al., 2002) was used to generate interferometric pairs. After interferogram filtering (Goldstein and Werner. 1998), phase unwrapping (Costantini, 1997), atmospheric error correction by quadratic tree image segmentation (Kang et al., 2021), and DEM error correction (Liu et al., 2018), we selected high-quality interferograms for large-area unstable slope identification and small-scale monitoring of the Pingdi landslide.
For the large-area unstable slope identification, the SRTM DEM with a resolution of 30 m was employed to remove the topographic phase. Then to implement the precise monitoring of the Pingdi landslide, the ALOS digital surface model (DSM) with a resolution of 12.5 m was applied. The interferograms were multi-looked using factors of 2 × 2 (range × azimuth) for ALOS/PALSAR-2 images and 4 × 1 (range × azimuth) for Sentinel-1A images. And Google earth images were employed to cross-validate the suspected landslides identified by the InSAR deformation map. To explore the correlation between surface deformation and precipitation, the daily precipitation data were collected from the website of global precipitation measurement (GPM).
The technical route to investigate the potential instable slopes within the study area and to derive the spatiotemporal evolution of the Pingdi landslide is shown in Figure 4.
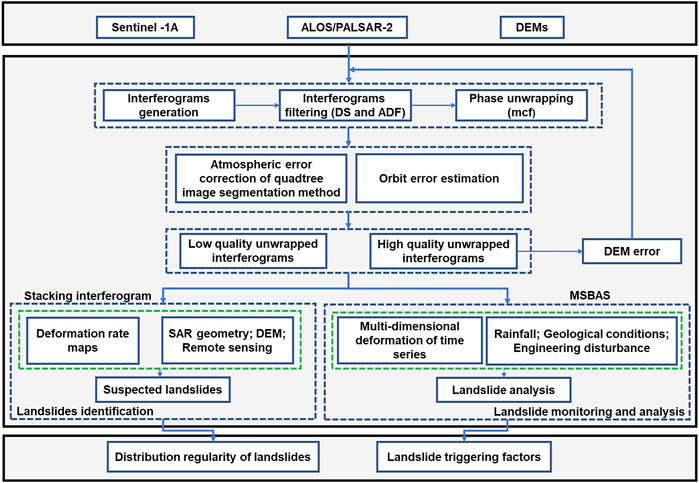
FIGURE 4. Flowchart for the active landslide identification and deformation analysis.
As the atmospheric errors have significant impact on deformation results in the study area, the atmospheric error correction by quadratic tree image segmentation (Kang et al., 2021; Jiang et al., 2022) was used to weakening the effect of the atmosphere. The technical route to identify the unstable slopes is organized as the following steps: calculation of annual deformation rate by phase-stacking InSAR method, quick identification of landslide and type by optical remote sensing and geomorphological information, summary of the distribution characteristics of landslides.
The DS-InSAR method was used to suppress the decorrelation effects caused by dense vegetation and increase the density of point targets, and MSBAS was used to calculate the two-dimensional deformation results. The technical route to derive the spatiotemporal evolution of Pingdi landslides is organized as the following steps: calculation of deformation results by DS-InSAR and MSBAS methods, analysis of the triggering factors of slope instability and simulation the failure process.
Interferograms are strongly influenced by the topography-related tropospheric delay in greatly undulate terrain mountain areas, where landslides occur frequently. Segmenting the interferograms based on the height difference of DEM, and estimating the vertically stratified atmosphere can suppress the influence of tropospheric atmosphere on the deformation results (Kang et al., 2021). The quadratic polynomial fit model is as follow:
where,
In order to improve the efficiency of calculation and to focus on the landslide deformation process, after the identification of landslides, we cropped the SAR images. To reduce vegetation-induced interference decorrelation, the covariance matrix is estimated robustly with homogeneous points to enhance the phase of interferograms. The SAR data satisfy the standard Gaussian distribution (Jiang et al., 2018), of which the complex coherence matrix Τ can be expressed as:
where,
Since the phase of each distributed target is composed of the backscattered signals of multiple ground objects, the different scattered signals can be separated by eigenvalue decomposition of the covariance matrix to achieve the optimized phase corresponding to the largest eigenvalue as follow:
where,
The deformation along the LOS direction is the vector sum of the deformation in the vertical, east-west and north-south directions (Fialko et al., 2001; Wright et al., 2004) as follows:
Due to the limitation of the near-polar orbit of SAR satellites, the projection coefficient in the north-south direction is much smaller than those in the east-west and vertical directions. Therefore, MSBAS (Samsonov and d'Oreye, 2017) is used to calculate the east-west and vertical surface deformation as follow:
where,
Landslide investigation allows us to quickly understand the current status of landslide distributions in an area (Hussain et al., 2021) and guides us to select typical landslides to analyze its deformation process. A total of 42 landslide clusters were identified in this area. Comparing the identified results with the historical landslide sites in the area, we found 15 landslide clusters which were known as historical landslide hazard sites and the other 27 landslide clusters were unknown before (Figure 5). Most of them were related to mining activities, which were consistent with those results by other researchers in this area (Zhu et al., 2022). The basic information of landslides was shown in Table 2.
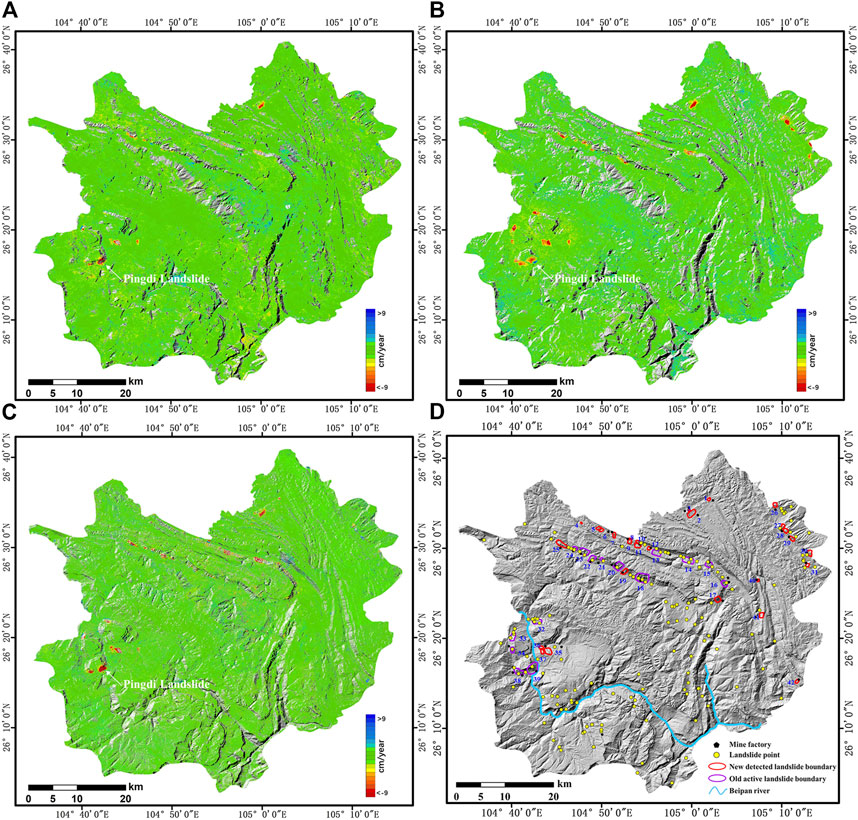
FIGURE 5. (A) InSAR deformation rate map with ascending Sentinel-1A images from January 2016 to February 2021; (B) InSAR deformation rate map with descending Sentinel-1A images from January 2016 to March 2021; (C) InSAR deformation rate map with ascending ALOS/PALSAR-2 images; (D) Landslides identification map.
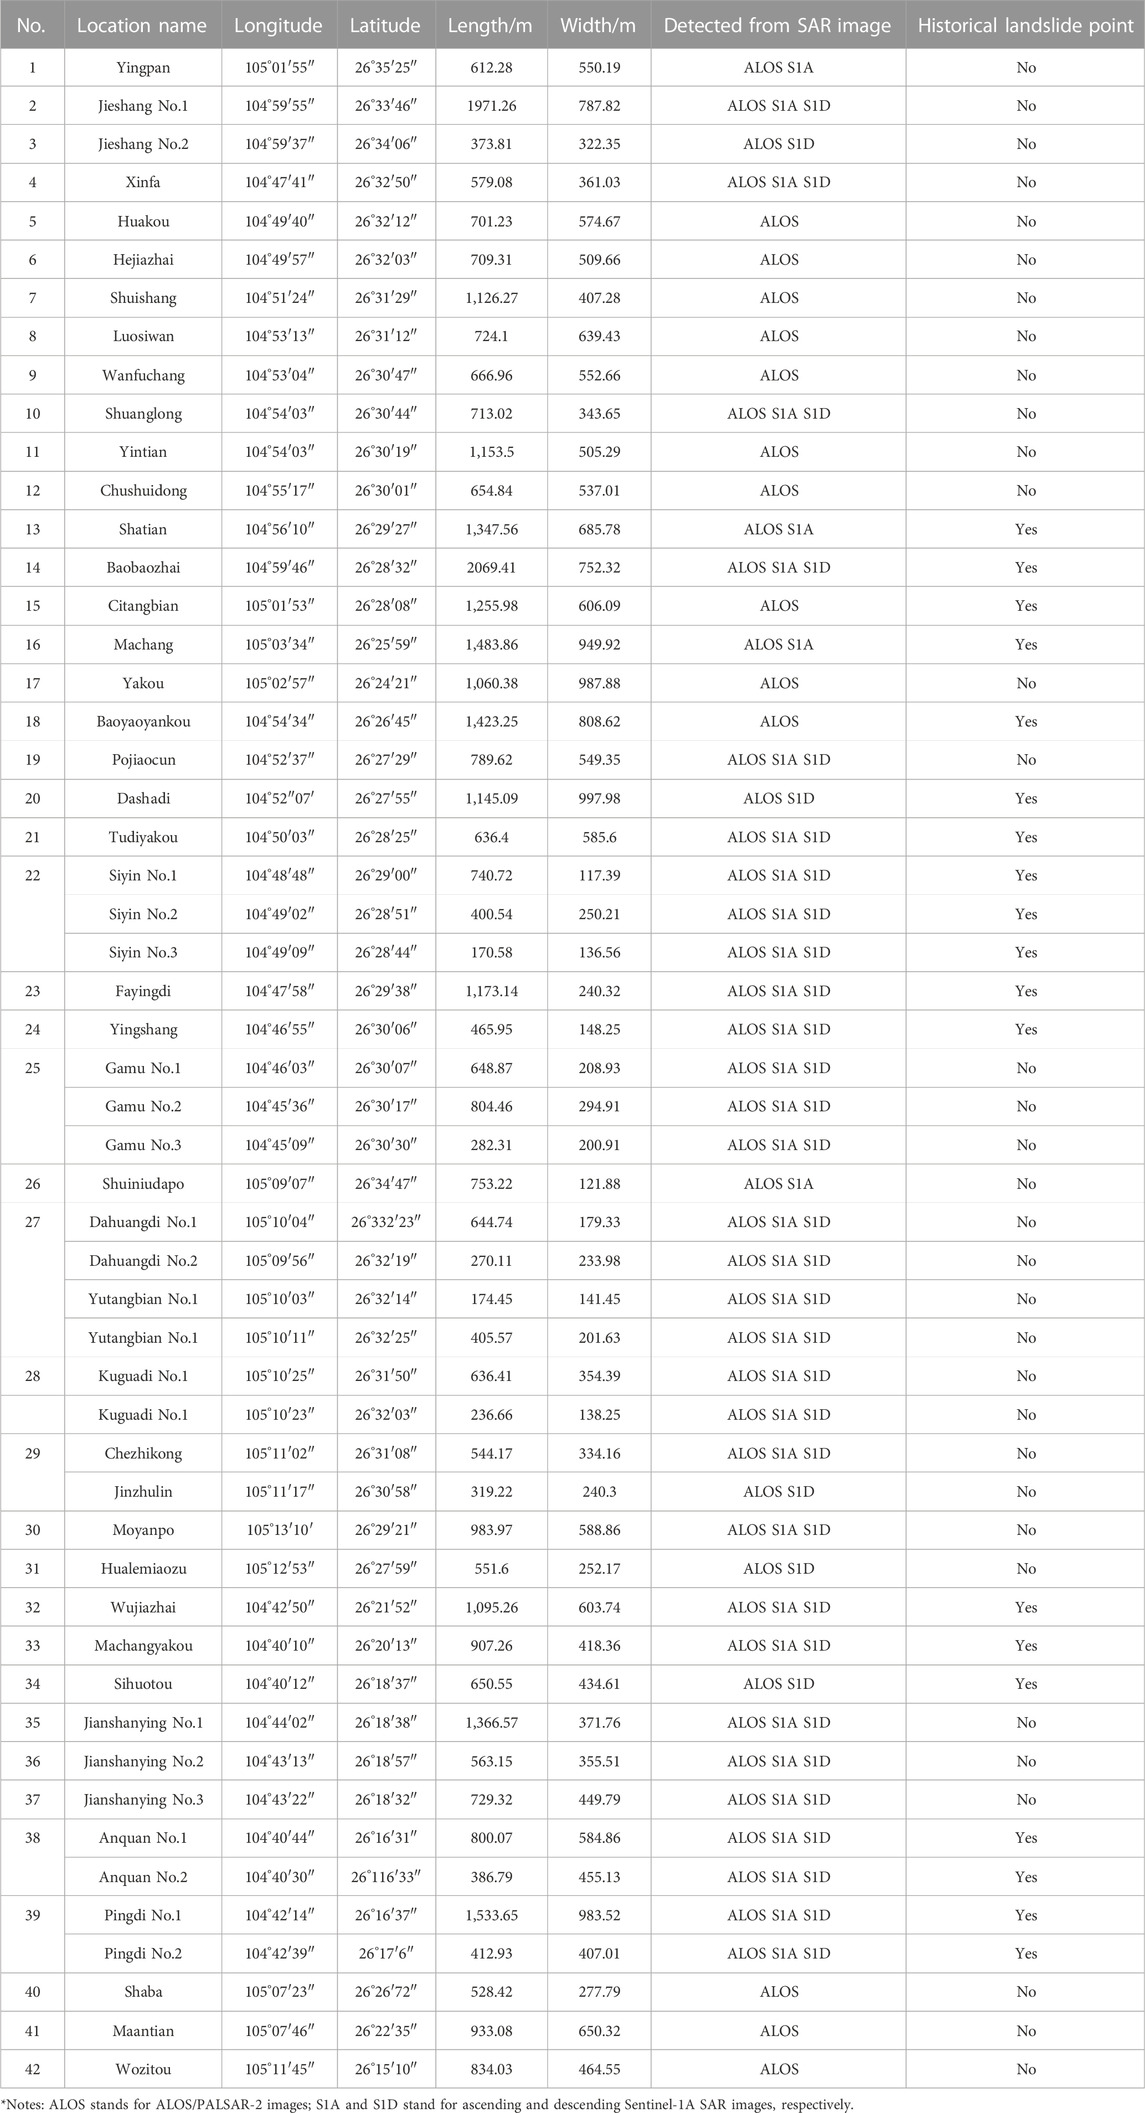
TABLE 2. Basic information of the detected landslides.*
The different number of landslides detected from different SAR datasets are mainly because of these reasons: Since the SAR images were acquired in the side looking acquisition mode typical of SAR sensors, the steep topography of karst mountains inevitably results layover and shadowing geometrical distortions for the InSAR observation (Hanssen, 2001), and different incidence angles form different invisible areas. The slope movement perpendicular to the LOS cannot be monitored, and the descending and ascending geometries are favorable, respectively, for west and east facing slopes (Wasowski and Bovenga, 2014), which would result in large differences in the deformation results obtained from the two data (Liu et al., 2021). And compared to the C-band Sentinel-1A, the L-band ALOS/PALSAR-2 has better penetration of vegetation and can detect more covert landslides (Chen et al., 2022a). Therefore, both descending and ascending acquisitions are available the limitations related to topography (layover, shadowing) can be significantly reduced (Grebby et al., 2021), and can increase the number of identifiable landslides.
The 30 m resolution DEM is employed to calculate the slope and the elevation of the identified active unstable slopes in this area. The percentage of landslide number in each section is defined as Landslide Number Percentage (LNP), while the percentage of the total natural area of landslide in each section is defined as Natural Area Percentage (NAP) (Yao et al., 2017).
Landslides with higher slopes have more potential energy and faster sliding speeds (Guo et al., 2008). According to Figure 6A, there was no landslide on slope below 10° slope angle, and the landslides were mainly distributed in the range of 20°–35°. In this range, the number of landslides increases with the slope. In the range of 30°–35°, the LNP and NAP are 26.19% and 32.72%, respectively.
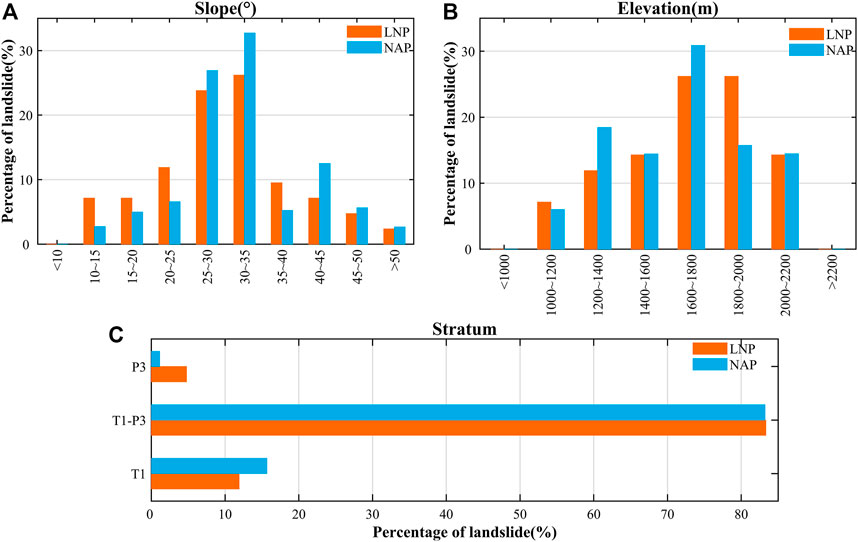
FIGURE 6. Statistics of geomorphological elements of mining-induced active landslides in the study area; Distribution ratio of (A) slope; (B) elevation; (C) stratum.
Different elevation ranges have different vegetation types and vegetation cover. The higher the elevation is, the more severe the weathering will become, resulting in a high correlation between landslides and elevation (Wang et al., 2017). Landslides in this area were mainly developed at the elevation of 1,600–1800m and the LNP and the NAP in this range were 26.19% and 30.88%, respectively. There was no landslide below 1000 m and above 2200 m (Figure 6B).
The lithology of the strata is the material basis for the formation of landslides. Different lithology has different mechanical properties, and different combinations of lithology and slope structure have different stability (Dai and Deng, 2020). Landslides in this area were well developed in the Lower Triassic Formation (T1) and Upper Permian (P3). They were mostly distributed at the junction of T1 and P3. The LNP and NAP were 83.34% and 83.22%, respectively (Figure 6C).
According to the above statistics, many landslides in this area were related to geological and environmental conditions, such as topography and geomorphology, stratigraphic lithology, and geological formations, which are intrinsic to the development of landslides. They were mainly distributed in the junction of T1 and P3, with slope 20°–35°, and elevation between 1,600 and 1800 m.
The Pingdi landslide is located on the west bank of the Beipan River, marked as Landslide No. 38 in Figure 5D. Figure 7 shows the historical optical remote sensing images acquired on Dec.21, 2015, Apr.6, 2017, Nov. 14, 2020 and Nov. 11, 2020, respectively. The cracks could be seen on the slope surface (Figures 7E,F). The white circle indicates the location of the coal factory. As shown in Figure 7D, the slope in the red rectangular area changed obviously, and a large amount of rock debris accumulated at the position shown by the purple arc. With the continuous mining activities, the fragile rock mass will lose its balance, forming rock debris flow (Cui et al., 2020), causing blockage of rivers.
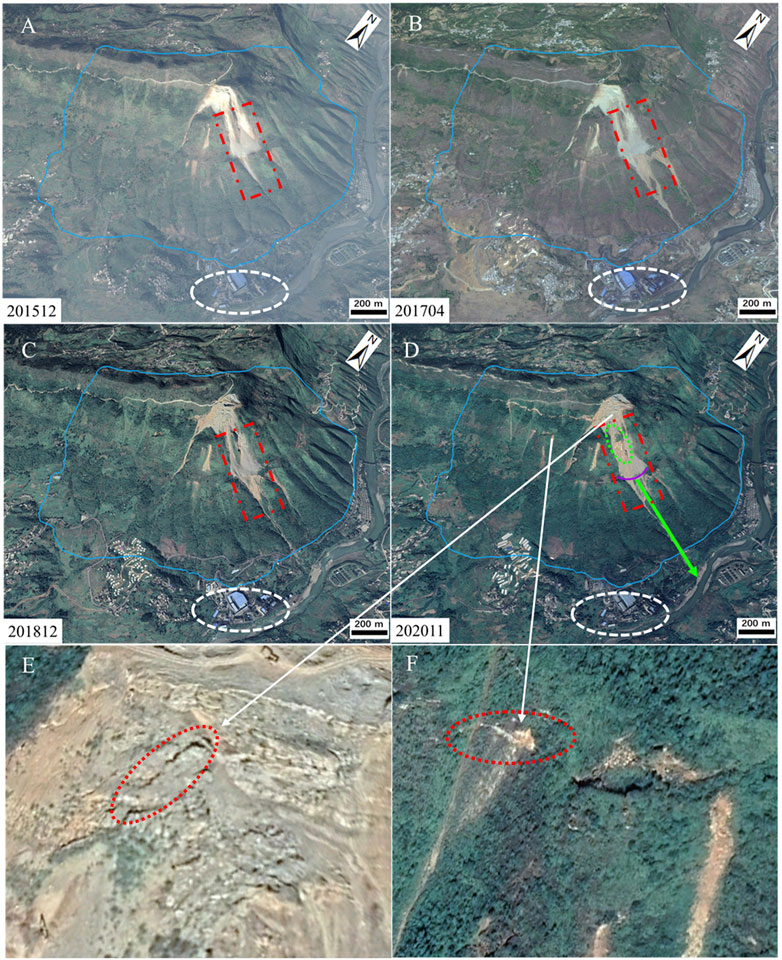
FIGURE 7. Historical optical remote sensing images of the Pingdi landslide. The blue solid polygon in (A–C) and (D) indicates the boundary of the landslide; The white ellipse in (A–C) and (D) indicates the mine site; The red rectangular in (A–C) and (D) is a small debris flow; The green circle in (D) indicates one big exposed rock; The green arrow in (D) indicates the suspected sliding direction; The red circles in (E) and (F) indicate surface cracks.
The LOS deformation of the three orbits were calculated independently based on the DS-InSAR method. Due to the difference of ALOS-2 and Sentinel-1A datasets in quantity and the time of access, instead of calculating the three-dimensional deformation, we calculated the two-dimensional deformation using Sentinel-1A datasets based on MSBAS. The deformation results were sufficient for the subsequent analysis, which could provide valuable information for exploring the dynamic process, analyzing the driving factors and the failure modes.
The two-dimensional deformation rate of the Pingdi landslide was shown in Figures 8C,D, respectively. The red indicated the westward displacement (Figure 8C) or downward displacement (Figure 8D), while the blue indicated the opposite displacement, and the green was corresponding to the stable surface. Figures 8C,D indicated that the greatest vertical and horizontal annual deformation rate was at the lower and part of the slope, near point S3.
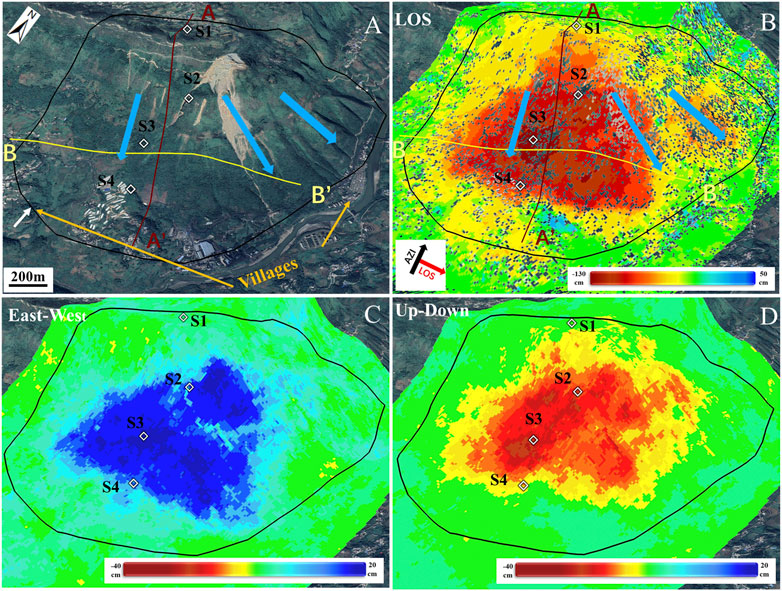
FIGURE 8. Perspective view of optical image and InSAR deformation maps. (A) Google-earth image acquired on 11 November 2020; (B) ALOS/PALSAR-2 LOS cumulative deformation map, where the profiles AA’ and BB’ is show in Figure 11, and the deformation time series at points S1, S2, S3 and S4 are displayed in Figure 10; (C) and (D) are the east-west and vertical annual deformation rate maps derived from ascending and descending Sentinel-1A images, respectively.
To get more two-dimensional time series information about slope deformation, we have selected four points located in the front edge of the slope, the upper, middle and lower part of the slope, near the profile AA' to reflect the deformation of the slope and cross-reference with the results of the profile deformation. The location of four points was shown in Figure 8. The two-dimensional time serious deformation of Point S1, S2, S3 and S4 were shown in Figure 10. In vertical direction, the downward deformation of points S2 and S3 were large, while points S1 and S4 were small. In horizontal direction, the eastward deformation of S3 and S4 were large, while point S1 and S4 were small. Of these points, the cumulative deformation of S3 was the largest, the eastward deformation was 76 cm and the downward deformation was 124 cm. After January 2021, the deformation of S2 was dramatic, especially on vertical, the deformation rate from 24 January 2021 to 3 February2,021 was 2.84 mm/d, very unstable.
As shown in Figure 9, 19 ALOS/PALSAR-2 images were employed to derive the deformation time series in the LOS direction, where negative value (red) indicated the deformation away from the satellite and the positive value (blue) indicated the deformation towards the satellite. To the southeast part of the landslide, the deformation initially occurred at the middle and lower part of the slope, then the front edge of the slope started to deform, the most intensive deformation was at the middle and lower part of the slope, around Point S3, the cumulative maximum deformation of the slope was over 130 cm. From 16 April 2019 to 29 September 2019, the northeast part of the slope did not show significant deformation, but during 29 September 2019 to 10 May 2020, the northeast part of the landslide shown slow deformation and the deformation gradually expanded, connecting to the previous main deformation area. The detail of LOS cumulative deformation of the Pingdi landslide was shown in Figure 8B, and had obvious circle-like deformation on the slope. The similar circle-like deformation also reflects in the two-dimensional annual deformation rate, which will explain subsequently.
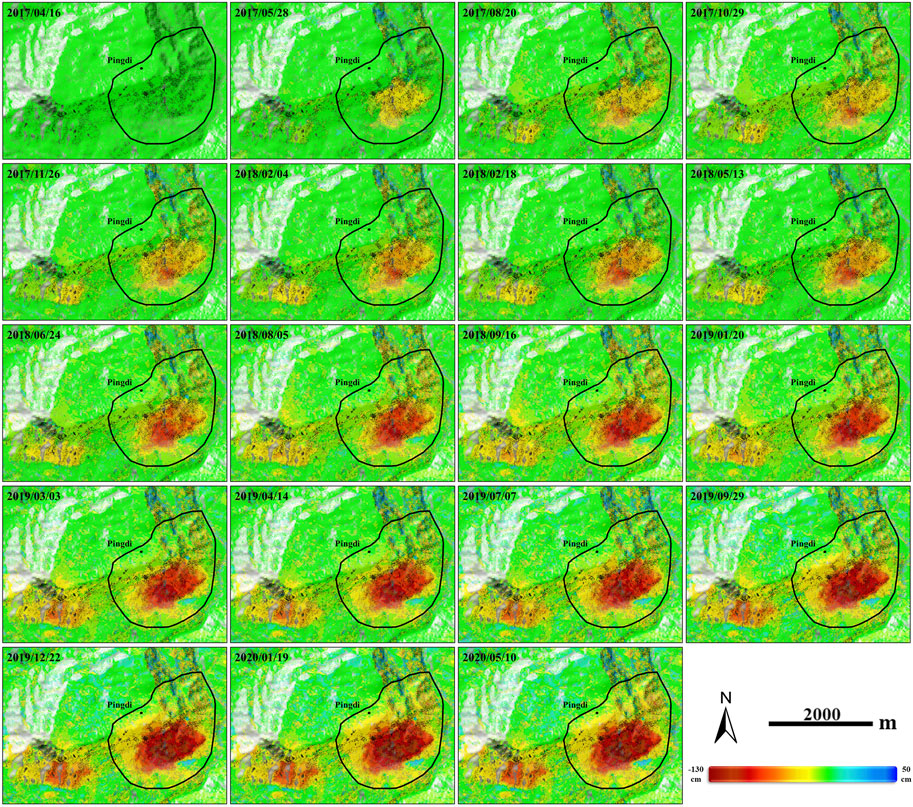
FIGURE 9. The cumulative deformation time series of the Pingdi landslide in the LOS direction from 16 April 2017, to 10 May 2020, where the solid polygons indicate the boundaries of Pingdi landslide.
According to statistics above, most unstable slopes wew mainly distributed in the junction of T1 and P3. The reasons are as follows: First, P3 is the important coal bearing strata in South China, with shallow coal seams, which has the most coal mining activities; Second, as shown in Figure 2A, the T1 stratum in the study area is superimposed on the P3 stratum. And at the junction of T1 and P3, the compose of T1 in this area is mainly T1yn superimposed on the T1l, and the P3 is mainly composed of P3l; Third, rocks in this area are heavily weathered. Under different weathering conditions, the upper part of the strata forms high steep slopes or cliffs, and the lower part forms gentle slopes. The T1yn and T1f are exposed strata of slope, composed of hard limestone and medium hardness siltstone. The lower layer P3l is the coal-bearing strata, composed of soft argillaceous siltstone, which forms an upper-hard-and-lower-soft stratigraphic structure. With frequent mining activity under the slope, mining goat is formed at the lower part of the slope, and the soft rock cannot support the upper slope, resulting in the failure of stress balance, then the slope will become unstable (Chen et al., 2022b). Therefore, these unstable slopes are mainly distributed at the junction of T1 and P3 in this area.
The driving factors of karst slope instability usually can be attributed to natural factors and human activities (Bonacci and Juračić, 2010; Ford and Williams, 2013; Gutierrez et al., 2014). Some studies have shown from a geological point of view that in karst mountain area, precipitation and mining activity are the two important driving factors of slope instability (Xiao et al., 2019; Cui et al., 2022; Emami Meybodi et al., 2022; Zhong et al., 2022). In this section, we have analyzed these two important driving factors in terms of surface deformation.
First, we added the daily precipitation data to determine if there is a correlation between precipitation and the Pingdi landslide deformation. As shown in Figure 10, the vertical deformation rate of these four points was constant or accelerated at the beginning and middle of the rainy season. And there was a sudden increase in deformation rate after heavy precipitation. In times of low precipitation, the rate of deformation became slower. The east-west deformation rate of these four points showed similar phenomenon with vertical deformation rate. In general, changes in slope deformation rate do not occur simultaneously with precipitation, but lag behind it. And there is a significant positive correlation between the magnitude of deformation rate and the magnitude of precipitation (Lin and Guo, 2001).
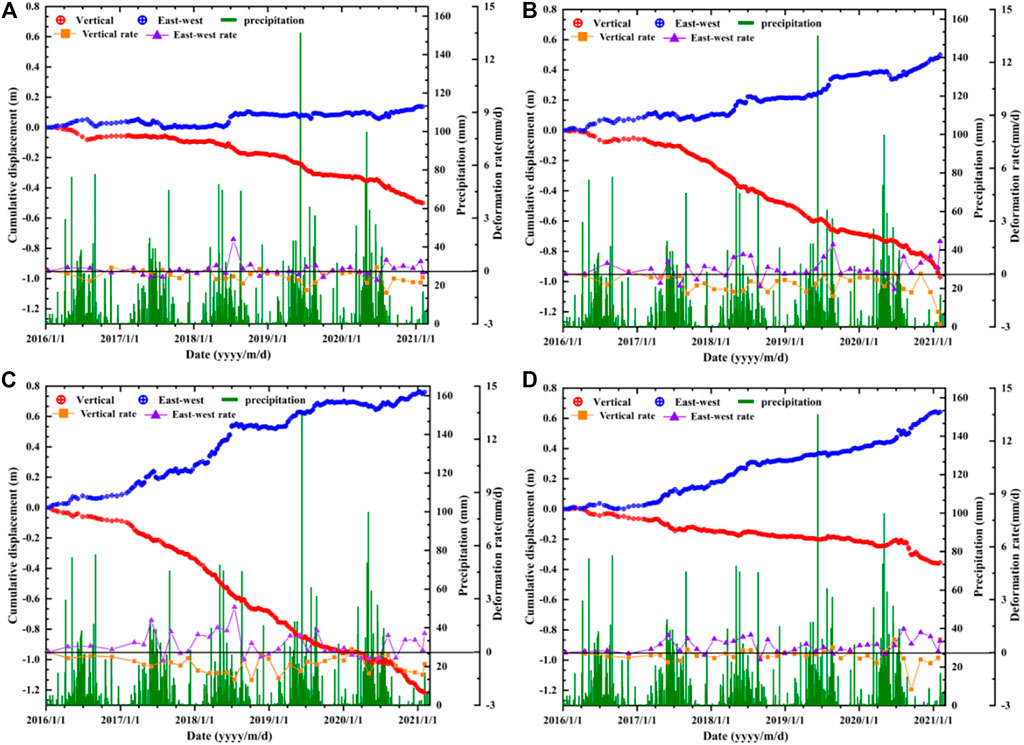
FIGURE 10. Comparison between deformation time series and daily precipitation acquired from GPM. The locations of S1, S2, S3 and S4 are shown in Figure 8. (A, B, C) and (D) are comparison between two-dimensional deformation time series, two-dimensional deformation rate and daily precipitation for S1, S2, S3 and S4, respectively.
Then the time series deformation calculated from ALOS-2 dataset along the profile AA’ and BB’ in Figure 8A was extracted. The profile AA’ was plotted along the landslide movement direction approximately. The deformation in section Ⅲ (Figure 11A) was like a “subsidence funnel”, and the circle-like deformation mentioned above usually relates to mining activities (Modeste et al., 2021). Figure 11A showed that the deformation initially occurred in the position of caving area (section Ⅲ), which also was the position of the maximum downward deformation mainly occurred. As the deformation intensified in section Ⅲ, the upper part of the slope section Ⅱ and the front edge of the slope section Ⅰ began to deform. This deformation conforms to the general performance of slope deformation caused by mining activities (Zheng et al., 2015). Similar deformation characteristic also occurred in Jianshanying landslide (Chen et al., 2021), Zongling landslide (Chen et al., 2022a) and Kaiyang landslide (Chen et al., 2022b), which were all mining related. The reasons for the deformation above are as follows: The downward deformation mainly occurs above the exposed strata T1yn and T1f, which is mainly composed of hard limestone and medium hardness siltstone, as the coal seams stored in stratum P3l which is mainly composed of soft argillaceous siltstone were mined out, the remaining coal pillar cannot bear the pressure of the roof gradually. Since the strength of the upper strata is stronger than that in the lower layer, repeated mining activities can induce the plastic extrusion from the upper strata, resulting in the tension fracture at the back edge of the slope (Chen et al., 2022b).
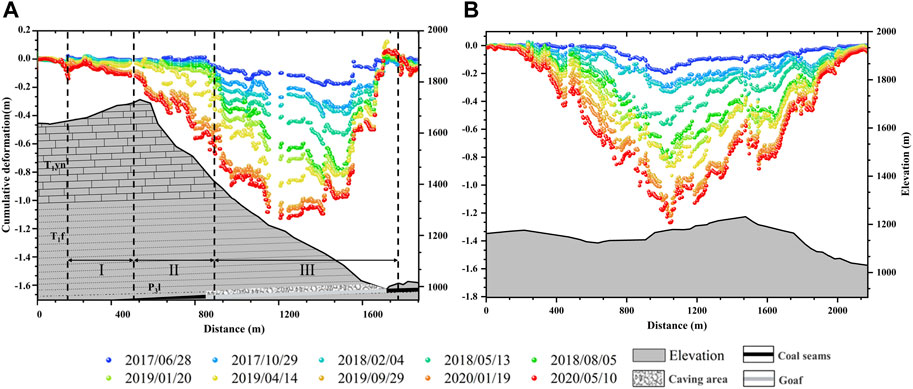
FIGURE 11. Line-of-sight deformation time series obtained from ALOS/PALSAR-2 data along profiles AA’ and BB’. (A) LOS deformation time series along profile AA’; (B) LOS deformation time series along profile BB’. The grey area is the topography profile from ALOS DSM. The location of profiles is shown in Figure 8A.
Through the analysis above, precipitation and mining activity are two important factors of slope instability. Mining activity is the main cause of the slope deformation, and precipitation is the driving factor of the slope instability. The precipitation can intense mining-induced slope deformation.
The spatiotemporal evolution feature of the Pingdi landslide was explored above, and the driving factors such as the precipitation and mining activities were also discussed according to the deformation characteristics. This section will reveal the failure process of the Pingdi landslide and analyze the role of these factors in the process.
As shown in Figure 11B, the maximum deformation was at the middle of the profile BB’, where the initial deformation occurred, then the deformation decreases from the middle to both ends of it. And the maximum deformation was at the lower and middle of the profile AA’ (Figure 11A), where the initial deformation occurred. Combined the deformation characteristic of the Pingdi landslide, we could affirm that the deformation initial occurred at the middle and lower part of the slope, near the point S3, where the maximum deformation occurred, and then the deformation decreased to periphery. This phenomenon is much consistent with the characteristics of retrogressive landslide, which shows that the deformation occurs at lower part of the slope first, causing the change of stressed structure of the upper part of the slope and later the deformation (Pascal et al., 2019).
The coal seams in the Longtan Formation (P3l) were gradually mined out, the roof gradually subsidence, and cracks were subsequently formed. With the exploration of coal mining, ground fissures develop and expand continuously, and the roof subsidence has increased. In addition, the deformation of the mined-out areas could lead to uneven forces across the slope, which would cause the formation of the cracks near the top of the slope (Zheng et al., 2015), even cause the tension fracture at the back edge of the slope. Under the continuous action of gravity and precipitation, the cracks near the top of the slope accelerated cracking, and the dangerous rock mass gradually separated with the mountain. The ground fissures or faults induced by repeated mining activities would enhance the water conductivity of the cracks and stratum, which could further erode the unstable stratum and weaken the rock strength. The rock finally disconnects from the mountain and forms rock fall or avalanche.
Through the analysis above, the failure process of Pingdi landslide can be summarized as Figure 12: (A) Due to precipitation and weathering, there were some cracks at the top of the slope prior to the mining activity. (B) As mining began, deformation and new cracks began to appear on the slope, and heavy precipitation would make cracks expand (Matsuura et al., 2008). (C) With the further expansion of the mining progress, the deformation area of the slope is further expanded and the force balance is broken up. The progressive failures, such as rupture, creeping, rockfall and sliding, was generated. (D) The slope is currently at a relatively stable deformation, continual mining activities and heavy precipitation may break the force equilibrium of the slope, causing a catastrophic landslide.
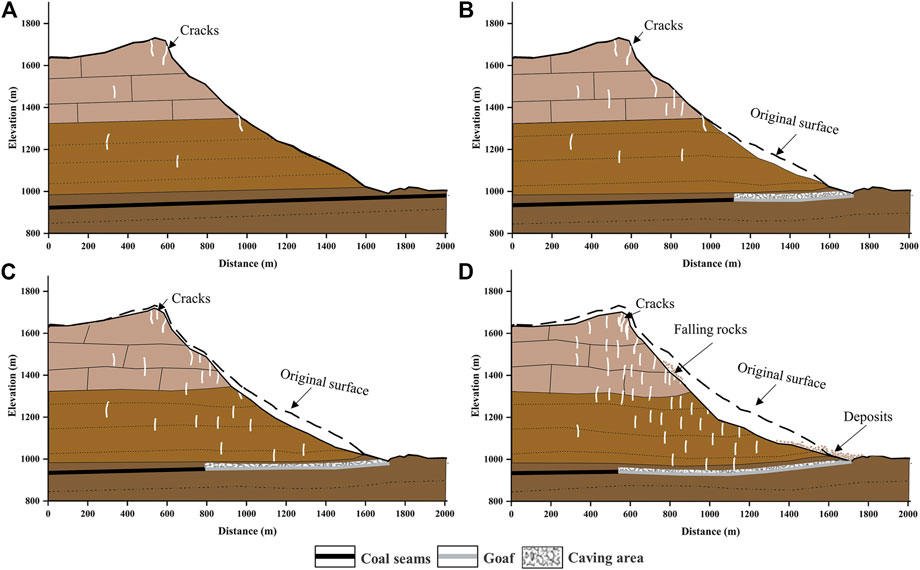
FIGURE 12. The failure process of the Pingdi landslide.
In this study, the distribution characteristic of landslides in Shuicheng district and the failure process of a typical landslide, Pingdi landslide, were explored. On the one hand, the atmospheric error correction by quadratic tree image segmentation methods was conducted to retrieve the surface deformation of Shuicheng district. On the other hand, the DS-InSAR and MSBAS methods were conducted to retrieve the surface deformation of Pingdi landslide. Atmospheric effect on karst mountains was sever, the quadratic tree image segmentation methods can effectively weaken atmospheric effects. The DS-InSAR method can improve the precision and the density of the deformation time series results, which can guarantee the InSAR application in karst mountain areas. The MSBAS method can be successfully applied to retrieve the vertical and east-west deformation time series.
The relationship between landslides distribution and stratum in Shuicheng district was revealed, that landslides were mostly located in the junction of T1 and P3 stratum. And the spatiotemporal characteristics of the surface deformation in Pingd landslide prove that mining activity was the main cause of the slope deformation, and the precipitation was the driving factor of the slope instability. The research provides an insight into the explore the unstable slope distribution characteristic and the failure process of the landslides.
The original contributions presented in the study are included in the article/Supplementary Material, further inquiries can be directed to the corresponding author.
Conceptualization, RS, CZ, and BL; methodology, RS; software, RS; validation, RS; formal analysis, RS; investigation, RS and HC; resources, LC; data curation, RS; writing—original draft preparation, RS; writing—review and editing, RS and CZ; visualization, RS; supervision, CZ; project administration, BL and CZ; funding acquisition, CZ All authors contributed to discussions and manuscript preparation.
This research is funded by the National Natural Science Foundation of China (Grant No. 41929001) and National Key R&D Program of China (No. 2022YFC3004302).
We would like to thank Japan Aerospace Exploration Agency (JAXA) and European Space Agency (ESA) for providing the ALOS/PALSAR-2, AWAD12.5 DSM and Sentinel-1A datasets, respectively. The 30 m shuttle radar topography mission (SRTM) digital elevation model (DEM) is downloaded from the website https://e4ftl01.cr.usgs.gov/MEASURES/. Daily precipitation data is downloaded from the website https://gpm.nasa.gov/.
The authors declare that the research was conducted in the absence of any commercial or financial relationships that could be construed as a potential conflict of interest.
All claims expressed in this article are solely those of the authors and do not necessarily represent those of their affiliated organizations, or those of the publisher, the editors and the reviewers. Any product that may be evaluated in this article, or claim that may be made by its manufacturer, is not guaranteed or endorsed by the publisher.
The Supplementary Material for this article can be found online at: https://www.frontiersin.org/articles/10.3389/feart.2023.1121868/full#supplementary-material
Achache, J., Fruneau, B., and Delacourt, C. (1996). Applicability of SAR interferometry for monitoring of landslides. European Space Agency, (Special Publication) ESA SP. 383. 165.
Ansari, H., De Zan, F., and Bamler, R. (2018). Efficient phase estimation for interferogram stacks. IEEE Trans. Geoscience Remote Sens. 56, 4109–4125. doi:10.1109/TGRS.2018.2826045
Bekaert, D., Hooper, A., and Wright, T. (2015). A spatially-variable power-law tropospheric correction technique for InSAR data. J. Geophys. Res. Solid Earth 120, 1345–1356. doi:10.1002/2014JB011558
Berardino, P., Fornaro, G., Lanari, R., and Sansosti, E. (2002). A new algorithm for surface deformation monitoring based on small baseline differential sar interferograms. IEEE Trans. Geoscience Remote Sens. 40 (11), 2375–2383. doi:10.1109/TGRS.2002.803792
Bonacci, O., and Juračić, M. (2010). Sustainability of the karst environment - dinnaric karst and other karst regions. Geol. Croat. 63, 127. doi:10.4154/gc.2010.08
Cavalié, O., Doin, M.-P., Lasserre, C., and Briole, P. (2007). Ground motion measurement in the Lake Mead area, Nevada, by differential synthetic aperture radar interferometry time series analysis: Probing the lithosphere rheological structure. J. Geophys. Res. 112, B03403. doi:10.1029/2006JB004344
CCTV News (2022). News.cctv. Avilable at: https://news.cctv.com/2022/05/08/ARTIguykTMGrJCksUB6JPeuk220508.shtml.
Chen, H., Zhao, C., Li, B., Gao, Y., Chen, L., and Liu, D. (2022b). Monitoring spatiotemporal evolution of Kaiyang landslides induced by phosphate mining using distributed scatterers InSAR technique. Landslides 20, 695–706. doi:10.1007/s10346-022-01986-5
Chen, H., Zhao, C., Sun, R., Chen, L., Wang, B., and Li, B. (2022a). Two-dimensional deformation monitoring of karst landslides in Zongling, China, with multi-platform distributed scatterer InSAR technique. Landslides 19 (7), 1767–1777. doi:10.1007/s10346-022-01860-4
Chen, L., Zhao, C., Li, B., He, K., Ren, C., Liu, X., et al. (2021). Deformation monitoring and failure mode research of mining-induced Jianshanying landslide in karst mountain area, China with ALOS/PALSAR-2 images. Landslides 18, 2739–2750. doi:10.1007/s10346-021-01678-6
Chen, X., Jin, D., and Li, X. (2016). Spatial correlation analysis of mining disturbance and geological calamities in Guizhou karst area:A case study of Liupanshui city. J. Ecol. Rural Environ. 32 (2), 207–212. doi:10.11934/j.issn.1673-4831.2016.02.006
Costantini, M. (1997). A novel phase unwrapping method based on network programming. IEEE Trans. Geoscience Remote Sens. 36 (3), 813–821. doi:10.1109/36.673674
Cui, F., Li, B., Xiong, C., Yang, Z., Peng, J., Li, J., et al. (2022). Dynamic triggering mechanism of the Pusa mining-induced landslide in Nayong county, Guizhou Province, China. Geomatics, Nat. Hazards Risk 13, 123–147. doi:10.1080/19475705.2021.2017020
Cui, P., Li, B., Yang, Z., Wu, L., Li, N., and Peng, J. (2020). Discrete element modelling on dynamic triggering mechanism of the Pusa landslide in Nayong county, Guizhou Province. Carsologica Sin. 39 (4), 524–534. doi:10.11932/karst20200408
Dai, F., and Deng, J. (2020). Development characteristics of landslide hazards in three-rivers basin of southeast Tibetan plateau. Adv. Eng. Sci. 52 (5), 3–15. doi:10.15961/j.jsuese.202000651
Doin, M.-P., Lasserre, C., Peltzer, G., Cavalié, O., and Doubre, C. (2009). Corrections of stratified tropospheric delays in SAR interferometry: Validation with global atmospheric models. J. Appl. Geophys. 69, 35–50. doi:10.1016/j.jappgeo.2009.03.010
Emami Meybodi, E., Hussain, K., Torabi-, K., and Ali Sajid, M. (2022). Role of karstic features in instability of the wall of an open-pit mine (case study: Sadat Sirize Iron Mine, Iran). Carbonates Evaporites 37, 52. doi:10.1007/s13146-022-00796-z
Fan, X., Xu, Q., Alonso-Rodriguez, A., Subramanian, S. S., Li, W., Zheng, G., et al. (2019). Successive landsliding and damming of the jinsha river in eastern tibet, China: Prime investigation, early warning, and emergency response. Landslides 16, 1003–1020. doi:10.1007/s10346-019-01159-x
Ferretti, A., Fumagalli, A., Novali, F., Prati, C., Rocca, F., and Rucci, A. (2011). A new algorithm for processing interferometric data-stacks: SqueeSAR. IEEE Trans. Geoscience Remote Sens. 49, 3460–3470. doi:10.1109/TGRS.2011.2124465
Ferretti, A., Prati, C., and Rocca, F. (2000). Nonlinear subsidence rate estimation using permanent scatterers in differential SAR interferometry. IEEE Trans. Geeoscience Remote Sens. 38 (5) 2202–2212. doi:10.1109/36.868878
Fialko, Y., Simons, M., and Agnew, D. (2001). The complete (3-D) surface displacement field in the epicentral area of the 1999MW7.1 Hector Mine Earthquake, California, from space geodetic observations. Geophys. Res. Lett. 28, 3063–3066. doi:10.1029/2001GL013174
Fobert, M-A., Singhroy, V., and John, S. (2021). InSAR monitoring of landslide activity in Dominica. Remote Sens. 13, 815. doi:10.3390/rs13040815
Ford, D., and Williams, P. (2013). Karst hydrogeology and geomorphology. John Wiley & Sons, 1–562. doi:10.1002/9781118684986
Goldstein, R., and Werner, C. (1998). Radar interferogram filtering for geophysical applications. Geophys. Res. Lett. 25 (21), 4035–4038. doi:10.1029/1998GL900033
Grebby, S., Sowter, A., Gee, D., Athab, A., De la, B. B., Girindran, R., et al. (2021). Remote monitoring of ground motion hazards in high mountain terrain using InSAR: A case study of the lake sarez area, Tajikistan. Appl. Sci. 11, 8738. doi:10.3390/app11188738
Guo, F., Yang, N., Meng, H., Zhang, Y., and Ye, B. (2008). Application of the relief amplitude and slope analysis to regional landslide hazard assessments. Geol. China 35 (1), 131–143. doi:10.3969/j.issn.1000-3657.2008.01.014
Gutierrez, F., Parise, M., De Waele, J., and Jourde, H. (2014). A review on natural and human-induced geohazards and impacts in karst. Earth Sci. Rev. 138, 61–88. doi:10.1016/j.earscirev.2014.08.002
Hanssen, R. (2001). Radar interferometry: Data interpretation and error analysis. Dordrecht, The Netherlands: Kluwer Academic Publishers.
He, K., Li, B., Zhao, C., Gao, Y., Chen, L., and Liu, P. (2021). Identification of large-scale landslide hazards based on differences of geological structure prone to sliding and multiple-source data in karst mountainous areas. Carsologica Sin. 39 (4), 467–477. doi:10.11932/karst20200402
Hooper, A., Zebker, H., Segall, P., and Kampes, B. (2004). A new method for measuring deformation on Volcanoes and other natural terrains using InSAR Persistent Scatterers. Geophyiscal Res. Lett. 31, 1–5. doi:10.1029/2004GL021737
Huang, M., Qi, S., and Shang, G. (2011). Karst landslides hazard during 1940–2002 in the mountainous region of Guizhou Province, Southwest China. Nat. Hazards 60, 781–784. doi:10.1007/s11069-011-0018-z
Hussain, M., Chen, Z., Wang, R., and Shoaib, M. (2021). PS-InSAR-Based validated landslide susceptibility mapping along karakorum highway, Pakistan. Remote Sens. 13, 4129. doi:10.3390/rs13204129
Jiang, M., Ding, X., Hanssen, R., Malhotra, R., and Chang, L. (2015). Fast statistically homogeneous pixel selection for covariance matrix estimation for multitemporal InSAR. IEEE Trans.53, 1213–1224. doi:10.1109/TGRS.2014.2336237
Jiang, M., Ding, X., and Li, Z. (2018). Homogeneous pixel selection algorithm for multitemporal InSAR. Chin. J. Geophysics- Chin. Ed. 61 (12), 4767–4776. doi:10.6038/cjg2018L0490
Jiang, Z., Zhao, C., Yan, M., Wang, B., and Liu, X. (2022). The early identification and spatio-temporal characteristics of loess landslides with SENTINEL-1A datasets: A case of dingbian county, China. Remote Sens. 14, 6009. doi:10.3390/rs14236009
Kang, Y., Lu, Z., Zhao, C., Xu, Y., Kim, J., and Gallegos, A. (2021). InSAR monitoring of creeping landslides in mountainous regions: A case study in eldorado national forest, California. Remote Sens. Environ. 258 (112400), 112400. ISSN 0034-4257. doi:10.1016/j.rse.2021.112400
Kang, Y., Zhao, C., Zhang, Q., Lu, Z., and Li, B. (2017). Application of InSAR techniques to an analysis of the Guanling landslide. Remote Sens. 9, 1046. doi:10.3390/rs9101046
Kong, J., Tian, S., Cui, Y., and Ni, Z. (2020). Guizhou guanling landslide formation mechanism and its characteristics. Mt. Res. 28 (06), 725–731. doi:10.3969/j.issn.1008-2786.2010.06.012
Li, L., Yao, X., Yao, J., Zhou, Z., Feng, X., and Liu, X. (2019). Analysis of deformation characteristics for a reservoir landslide before and after impoundment by multiple D-InSAR observations at Jinshajiang River, China. Nat. Hazards 98, 719–733. doi:10.1007/s11069-019-03726-w
Lin, F., Wu, L., Huang, R., and Zhang, H. (2018). Formation and characteristics of the xiaoba landslide in fuquan, Guizhou, China. Landslides 15 (4), 669–681. doi:10.1007/s10346-017-0897-5
Lin, X., and Guo, Y. (2001). A study on coupling relation between landslide and rainfall. J. Catastrophology 16 (2), 87–92. doi:10.3969/j.issn.1000-811X.2001.02.017
Liu, X., Zhao, C., Zhang, Q., Peng, J., Zhu, W., and Lu, Z. (2018). Multi-temporal loess landslide inventory mapping with C-X- and L-band SAR datasets—a case study of heifangtai loess landslides, China. Remote Sens. 10, 1756. doi:10.3390/rs10111756
Liu, X., Zhao, C., Zhang, Q., Yin, Y., Lu, Z., Samsonov, S., et al. (2021). Three-dimensional and long-term landslide displacement estimation by fusing C- and L-band SAR observations: A case study in gongjue county, tibet, China. Remote Sens. Environ. 267, 112745. doi:10.1016/j.rse.2021.112745
López-Quiroz, P., Doin, M. P., Tupin, F., Briole, P., and Nicolas, J. M. (2009). Time series analysis of Mexico City subsidence constrained by radar interferometry. Journal of Applied Geophysics 69 (1), 1–15.
Matsuura, S., Asano, S., and Okamoto, T. (2008). Relationship between rain and/or meltwater, pore-water pressure and displacement of a reactivated landslide. Eng. Geol. 101, 49–59. doi:10.1016/j.enggeo.2008.03.007
McKean, J., and Josh, R. (2004). Objective landslide detection and surface morphology mapping using high-resolution airborne laser altimetry. Geomorphology 57, 331–351. doi:10.1016/S0169-555X(03)00164-8
Modeste, G., Doubre, C., and Masson, F. (2021). Time evolution of mining-related residual subsidence monitored over a 24-year period using InSAR in southern Alsace, France. Int. J. Appl. Earth Observation Geoinformation 102, 102392. ISSN 1569-8432. doi:10.1016/j.jag.2021.102392
Pascal, L., Gael, A., James, H., and Edu, T. (2019). Self-entrainment motion of a slow-moving landslide inferred from landsat-8 time series. J. Geophys. Res. Earth Surf. 124, 1201–1216. doi:10.1029/2018JF004920
Samsonov, S., and d'Oreye, N. (2017). Multidimensional small baseline subset (MSBAS) for two-dimensional deformation analysis: Case study Mexico City. Can. J. Remote Sens. 43, 318–329. doi:10.1080/07038992.2017.1344926
Sandwell, D., and Price, E. (1998). Phase gradient approach to stacking interferograms. J. Geophys. Res. 103, 30183–30204. doi:10.1029/1998JB900008
Wang, D., Gui, X., Tan, Z., and Liang, S. (2017). Survey on impact factor research of landslide susceptibility assessment. Highlights Sci. Online 11 (2), 80–91.
Wang, J., Wang, C., Xie, C., Zhang, H., Tang, Y., Zhang, Z., et al. (2020). Monitoring of large-scale landslides in Zongling, Guizhou, China, with improved distributed scatterer interferometric SAR time series methods. Landslides 17, 1777–1795. doi:10.1007/s10346-020-01407-5
Wang, Y., Dong, J., Zhang, L., Zhang, L., Deng, S., Zhang, G., et al. (2022). Refined InSAR tropospheric delay correction for wide-area landslide identification and monitoring. Remote Sens. Environ. 275, 113013. doi:10.1016/j.rse.2022.113013
Wasowski, J., and Bovenga, F. (2014). Investigating landslides and unstable slopes with satellite Multi Temporal Interferometry: Current issues and future perspectives. Eng. Geol. 174, 103–138. doi:10.1016/j.enggeo.2014.03.003
Werner, C., Wegmuller, U., Strozzi, T., and Wiesmann, A. (2003). Interferometric point target analysis for deformation mapping. International Geoscience and Remote Sensing Symposium (IGARSS) 7, 4362–4364. doi:10.1109/IGARSS.2003.1295516
Wright, T., Parsons, B., and Lu, Z. (2004). Toward mapping surface deformation in three dimensions using InSAR. Geophys. Res. Lett. 31, L01607. doi:10.1029/2003GL018827
Wu, C., Qiao, J., Wang, C., Kong, J., and Chen, Z. (2006). Analysis on “12·3” super large-scaled landslide in zongling, Nayong, Guizhou. Res. Soil Water Conservation 2006, 1005–3409. doi:10.3969/j.issn.1005-3409.2006.06.031
Wu, Y. (1998). Overview of the basic characteristics of karst, resources, environment, society and economy in southwest karst region. Carsologica Sinica. CNKI: SUN: ZGYR.0.1998-02-007.
Xiao, D., He, Q., Li, H., and Liu, C. (2019). “Real-time monitoring of mine landslide based on Gaussian mixture model,” in Aics 2019: Proceedings of the 2019 international conference on artificial intelligence and computer science, 468–471. doi:10.1145/3349341.3349452
Xiong, M., Qin, Y., and Yi, T. (2007). Sedimentary patterns and structural controls of late permian coal-bearing strata in Guizhou, China. J. China Univ. Min. Technol. 35 (6), 778–782. doi:10.3321/j.issn:1000-1964.2006.06.016
Xu, C., Xu, X., Yao, X., and Dai, F. (2014). Three (nearly) complete inventories of landslides triggered by the May 12, 2008 Wenchuan Mw 7.9 earthquake of China and their spatial distribution statistical analysis. Landslides 11, 441–461. doi:10.1007/s10346-013-0404-6
Yang, R., and Tang, X. (2014). Analysis of coal bearing strata characteristics in Liupanshui coalfield, Guizhou Province. Coal Geol. China 000 (007), 28–32. doi:10.3969/j.issn.1674-1803.2014.07.07
Yao, J. (2020). Investigation and research on mined-out areas in west Guizhou Province based on InSAR technology. Beijing: China University of Geosciences.
Yao, X., Li, L., Zhang, Y., Zhou, Z., and Liu, X. (2017). Types and characteristics of slow-moving slope geo-hazards recognized by TS-InSAR along Xianshuihe active fault in the eastern Tibet Plateau. Nat. Hazards 88, 1727–1740. doi:10.1007/s11069-017-2943-y
Zhao, C., Lu, Z., Zhang, Q., and Fuente, J. d. l. (2012). Large-area landslide detection and monitoring with alos/palsar imagery data over northern California and southern Oregon, USA. Remote Sens. Environ. 124 (B9), 348–359. doi:10.1016/j.rse.2012.05.025
Zhao, Q., Yang, Z., Jiang, Y., Liu, X., Cui, F., and Li, B. (2022). Discrete element analysis of deformation features of slope controlled by karst fissures under the mining effect: A case study of Pusa landslide, China. Geomatics, Nat. Hazards Risk 14, 1–35. doi:10.1080/19475705.2022.2158376
Zheng, D., Frost, J., Huang, R., and Liu, F. (2015). Failure process and modes of rockfall induced by underground mining: A case study of Kaiyang phosphorite mine rockfalls. Eng. Geol. 197, 145–157. doi:10.1016/j.enggeo.2015.08.011
Zheng, F., Li, B., Cai, Q., and Cao, J. (2016). Initiation mechanism of the jiweishan landslide in chongqing, southwestern China. Environ. Eng. Geoscience, 1078–7275. doi:10.2113/EEG-1750
Zhong, Z., Xu, Y., Wang, N., Liu, X., and Gao, G. (2022). Environmental characteristics and unified failure mode classification system for mining landslides in the karst mountainous areas of southwestern China. Carbonates Evaporites 38, 2. doi:10.1007/s13146-022-00818-w
Keywords: karst landslides, distributed scatterers, SBAS InSAR, deformation monitoring, failure mode
Citation: Sun R, Zhao C, Li B, Chen H and Chen L (2023) Karst landslides detection and monitoring with multiple SAR data and multi-dimensional SBAS technique in Shuicheng, Guizhou, China. Front. Earth Sci. 11:1121868. doi: 10.3389/feart.2023.1121868
Received: 12 December 2022; Accepted: 07 March 2023;
Published: 20 March 2023.
Edited by:
Djamil Al-Halbouni, Helmholtz Association of German Research Centres (HZ), GermanyReviewed by:
Magdalena Vassileva, GFZ German Research Centre for Geosciences, GermanyCopyright © 2023 Sun, Zhao, Li, Chen and Chen. This is an open-access article distributed under the terms of the Creative Commons Attribution License (CC BY). The use, distribution or reproduction in other forums is permitted, provided the original author(s) and the copyright owner(s) are credited and that the original publication in this journal is cited, in accordance with accepted academic practice. No use, distribution or reproduction is permitted which does not comply with these terms.
*Correspondence: Chaoying Zhao, Y3l6aGFvQGNoZC5lZHUuY24=
Disclaimer: All claims expressed in this article are solely those of the authors and do not necessarily represent those of their affiliated organizations, or those of the publisher, the editors and the reviewers. Any product that may be evaluated in this article or claim that may be made by its manufacturer is not guaranteed or endorsed by the publisher.
Research integrity at Frontiers
Learn more about the work of our research integrity team to safeguard the quality of each article we publish.