 Wei Lu1
 Jingguo Du
- 1School of Earth Science and Resources, Chang’an University, Xi’an, China
- 2School of Earth Sciences and Resources, China University of Geosciences, Beijing, China
- 3China Gold Inner Mongolia Mining Co Ltd, Manchuria, China
The Wunugetushan large porphyry Cu–Mo deposit in NE China is hosted by Mesozoic quartz monzonite porphyry and has a Mo-rich core and Cu-rich rim in space. In this paper, melt inclusions in porphyry intrusions and fluid inclusions in different-stage quartz veins were studied to explore potential parameters leading to Cu–Mo decoupling. Melt inclusions in porphyry intrusions have rhyolitic compositions of 71.7–85.3 wt.% SiO2, 1.9–31.3 ppm Cu and 1.7–2.6 ppm Mo. Hydrothermal activity occurred over three stages: 1) Early Mo mineralization at high temperatures (543°C–560°C) and CO2-rich fluids of intermediate salinity (11.0–17.3 wt.% NaCl equivalent), accompanied by biotitization and minor K-feldspathization; 2) Late Mo mineralization involving high-salinity (up to 77.0 wt.% NaCl equiv.) oxidized fluids at intermediate temperatures (400°C–454°C), with K-feldspathization and minor sericitization; 3) A Cu-mineralization stage with high-salinity (up to 45.6 wt.% NaCl equiv.) and CO2-barren fluids characterized by temperature peaks at 250°C–300°C and 400°C–450°C, accompanied by sericitization and illitization. Given possible variations in melt Cu/Mo ratios during magmatic activity and redox conditions, pH, fluid composition, and temperature during the hydrothermal-fluid stage led to the separation of Cu and Mo, we found that integrated parameters including increased Cu/Mo ratios in residual melt, variations in the redox state and more acidic environment of hydrothermal fluids determine spatial separation of two metals.
1 Introduction
Porphyry Cu–(Au–Mo) deposits are main suppliers for various metals and account for 75% of global Cu reserves, 50% of Mo reserves, and 20% of Au reserves (Sillitoe, 2010). In general, the metals Cu, Au, Mo, Ag, Pb, and Zn are temporospatially coupled in Cu–Au ± Mo, Cu–Mo, Zn–Pb ± Ag, and Ag–Au deposits (Pak et al., 2004; Sillitoe, 2010). An understanding of the association and separation of these metals is helpful in practical geological prospecting. In porphyry Cu–Mo deposits, Cu orebodies are usually concentrated in shallow outer areas, and Mo orebodies occur at deeper levels in the core (Redmond and Einaudi, 2010; Sillitoe, 2010; Li et al., 2012; Seo et al., 2012; Chang et al., 2018), but mineralization time is not always consistent with their spatial distributions. In the Bingham Canyon (USA; Seo et al., 2012), Hucunnan (eastern China; Cao et al., 2017), and Yulong (Tibet in southwestern China; Chang et al., 2018) deposits, molybdenite precipitation postdates chalcopyrite crystallization, whereas in the Bangpu (Tibet in southwestern China; Wang et al., 2015) and Wunugetushan (northeastern China; Li et al., 2012) deposits, Mo mineralization predates Cu mineralization. Numerous progresses have been made to explore possible drivers of Cu–Mo decoupling and mainly include 1) saturation temperatures of molybdenite and chalcopyrite in hydrothermal fluids (Li et al., 2012; Seo et al., 2012; Cao et al., 2017); 2) vapour–brine immiscibility (Cao et al., 2017; Chang et al., 2018); 3) changes in fluid compositions (Seo et al., 2011; Kokh et al., 2017) including H2, S, Cl, and CO2 contents; and 4) the degree of magmatic differentiation (Candela and Holland, 1986). Previous studies have focused on changes in physical and chemical conditions during differentiation of metals in melt and the evolution of hydrothermal fluids.
This study intends to explored the causes of Cu–Mo separation during both the magmatic and hydrothermal stages of mineralization, with a focus on melt inclusions in porphyry and fluid inclusions (FIs) in quartz veins in the Wunugetushan porphyry deposit, where Cu and Mo orebodies are typically separated.
2 Geological background
Northeastern (NE) China lies in the southeastern Central Asian Orogenic Belt (CAOB; Safonova, 2009; Xiao and Santosh, 2014), which developed between the Siberian Craton in the north and the North China Craton in the south during the Neoproterozoic–Phanerozoic (Figures 1A,B). The CAOB experienced complex tectonic events and extensive magmatism during the Palaeozoic–Mesozoic, including evolution of the Palaeo-Asian and Mongol–Okhotsk oceans and subduction of the Palaeo-Pacific Plate (Xu et al., 2009; Metelkin et al., 2010; Tan et al., 2013; Xu et al., 2013; Liu et al., 2014). As a consequence, a series of E–W- and NE–NNE-trending faults developed, and massive magmatic–hydrothermal ore deposits formed in NE China (Figure 1B). Most of these deposits are related to the Mesozoic subduction of the Palaeo-Pacific Plate (Metelkin et al., 2010; Wu et al., 2011; Liu et al., 2014), and >20 ore deposits are hosted by Mesozoic magmatic rocks, including the Badaguan porphyry Cu–Mo (Gao et al., 2016), Wunugetushan porphyry Cu–Mo (Qin et al., 1999; Chen et al., 2011), Luming porphyry Mo (Hu et al., 2014), Erentaolegai epithermal Ag (Chen et al., 1997), Jiawula hydrothermal vein-type Pb–Zn–Ag (Zhai et al., 2013) and Chaganbulagen hydrothermal vein-type Ag–Pb–Zn (Pan and Sun, 1990; Wu et al., 2010) deposits. Other ore deposits, such as the Duobaoshan and Tongshan Cu–Mo deposits (Zeng et al., 2014), are related to Palaeozoic magmatic activity.
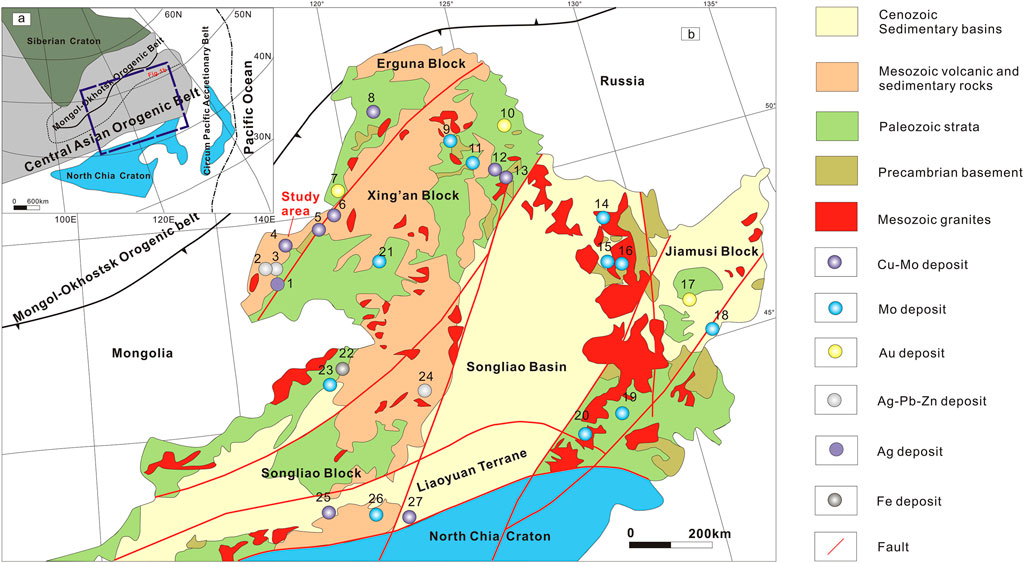
FIGURE 1. (A) Geological map of NE China (after Safonova, 2009), showing (B) distribution of Mesozoic igneous rocks and ore deposits (modified from Wu et al., 2014). Names of ore deposits: 1– Erentaolegai Ag deposit; 2–Chaganbulagen Ag–Pb–Zn deposit; 3–Jiawula Ag–Pb–Zn deposit; 4–Wunugetushan Cu–Mo deposit; 5–Babayi Cu–Mo deposit; 6–Badaguan Cu–Mo deposit; 7–Xiaoyinuogaigou Au deposit; 8–Taipingchuan Cu–Mo deposit; 9–Chalukou Mo deposit; 10–Sandaowanzi Au (Sb)deposit; 11—Xinga Mo deposit; 12–Duobaoshan Cu–Mo deposit; 13–Tongshan Cu–Mo deposit; 14–Huojihe Mo deposit; 15–Cuiling Mo deposit; 16– Luming Mo deposit; 17–Laozhashan Au deposit; 18–Jinchanggou Mo deposit; 19–Dashihe Mo deposit; 20–Daheishan Mo deposit; 21– Taipinggou Mo deposit; 22–Chagan’aobao Fe–Zn deposit; 23– Diyanqinamu Mo deposit; 24–Meng’entaolegai Pb–Zn–Ag deposit; 25—Xiaodonggou Mo deposit; 26–Jiguanshan Mo deposit; 27–Kulitu Mo–Cu deposit.
3 Ore deposit geology
The Wunugetushan porphyry Cu–Mo deposit (Figure 2) has reserves of 1.27 million tonnes (Mt) Cu and 0.42 Mt Mo (Qin et al., 1999). The deposit was first discovered by the Inner Mongolia Geological Survey Bureau in 1960 and has been explored by the Metallurgical and Geological Prospecting Company of Heilongjiang Province and the China National Gold Group Corporation. Exposed strata in the deposit are mainly Quaternary sandstones, mudstones, and conglomerates. Magmatic activity was concentrated in two pulses, as indicated by Late Triassic biotite granite that covers an area of ∼110 km2 and yields a zircon U–Pb crystallization age of 210.0 ± 2.0 Ma (Mi et al., 2014), and Jurassic volcanic–subvolcanic stocks, including quartz monzonite porphyry, rhyolite porphyry, and dacite porphyry (Figure 2). Quartz monzonite porphyry is the main host rock for Cu–Mo mineralization, and it covers an area of ∼0.42 km2 (Figure 3A) and intrudes earlier biotite granite. The crystallization age (180.4 ± 1.4 Ma) of the quartz monzonite porphyry is consistent with the molybdenite ore Re–Os age of 180.5 ± 2.0 Ma (Wang et al., 2015). NE-trending faults and volcanic ring fractures are the major structures in the Wunugetushan mining area, which shape the distribution of Cu–Mo orebodies. Late NW-trending faults and associated rhyolite porphyry dikes (Figures 3B–D) represent post-mineralization events, cutting through or deforming the orebodies.
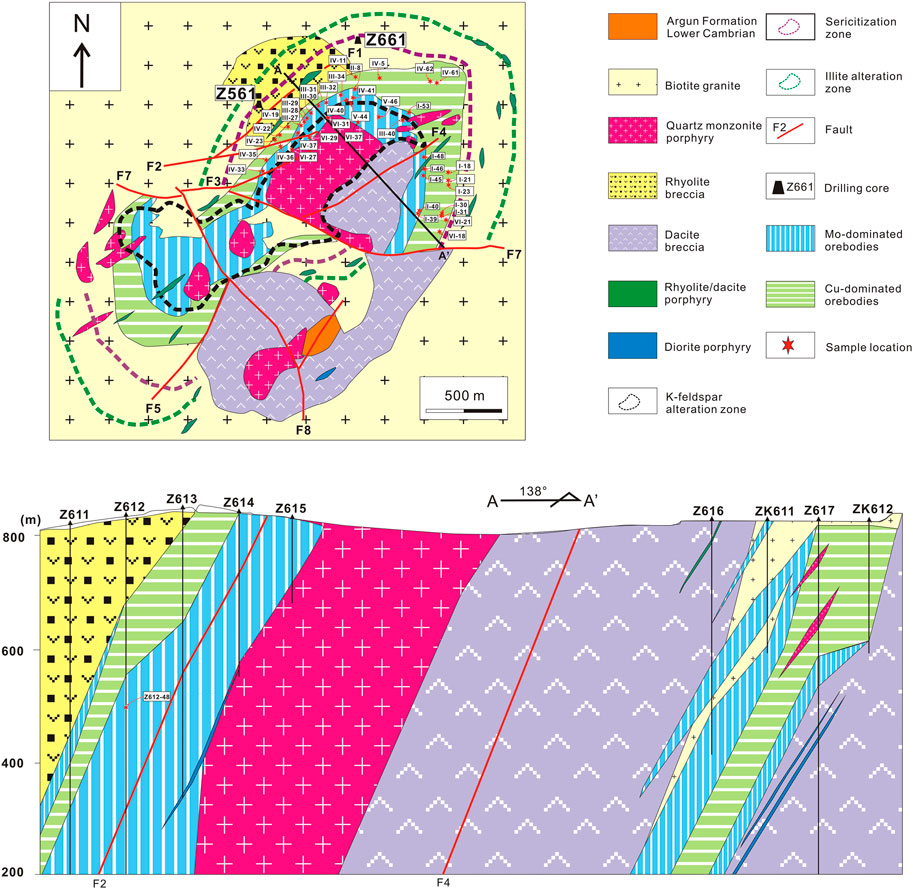
FIGURE 2. Geological map of the Wunugetushan porphyry Cu–Mo deposit geological map (modified from Wang et al. (2015)) including sample locations.
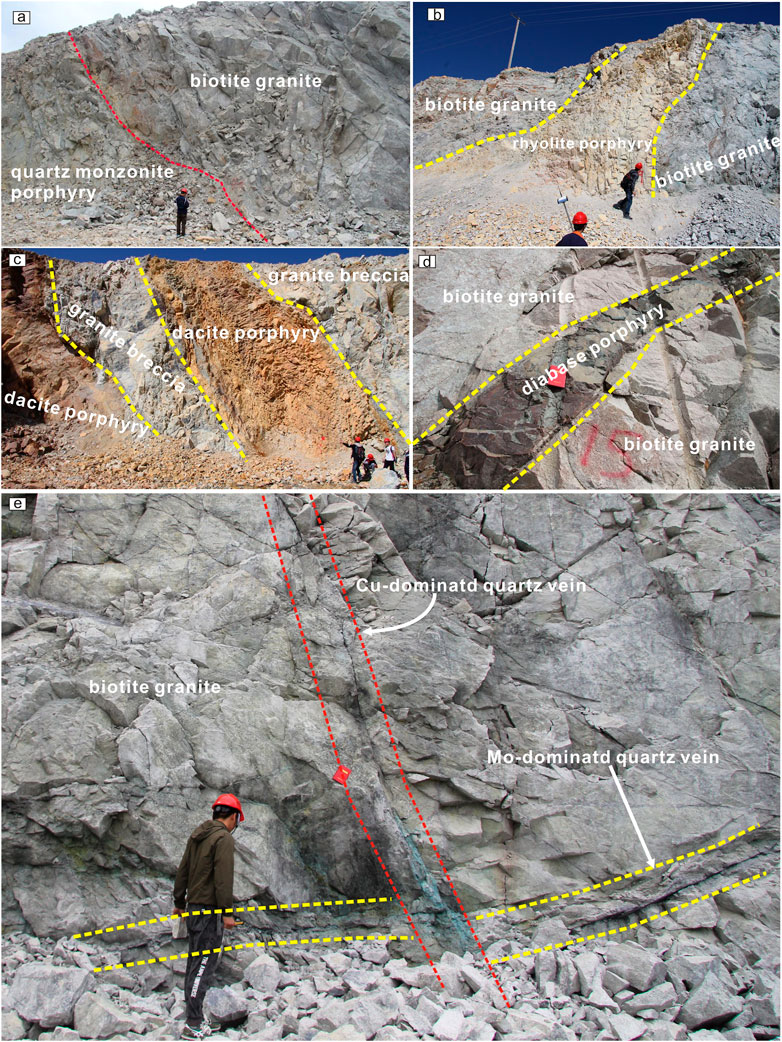
FIGURE 3. Field photographs of magmatic rocks and quartz veins in Wunugetushan porphyry Cu-Mo deposit. (A) quartz monzonite porphyry has a contact with biotite granite by fault; late (B) rhyolite porphyry, (C) dacite porphyry and (D) diabase porphyry dikes distribute along the faults or cracks within biotite granite. (E) Mo-dominated quartz vein is cut by late Cu-dominated quartz vein.
The mining area includes a typical alteration halo of porphyry Cu deposits comprising quartz–K-feldspar (QK), quartz–sericite (QS), and illite–hydromuscovite (IH) zones from core to rim (Qin et al., 1993; Li et al., 2012). The area of alteration in the northern section of the deposit is 2,500–2,800 m long and 200–350 m wide; and that in the southern section is 2000–2,600 m long and 1,000–1800 m wide. The total area of alteration is ∼5 km2. Mo orebodies are 70–400 m thick and occur mainly in the QK and QS zones; Cu orebodies occur mainly in the QS zone, and are up to 500 m thick in the northern section. Molybdenite-dominated quartz veins are commonly cut by chalcopyrite–pyrite-dominated quartz veins (Figure 3E), indicating earlier Mo mineralization.
Based on crosscutting relationships, alteration of mineral assemblages, and the different mineralization types in quartz veins, the formation of quartz veins is inferred to have involved three main stages (Figure 4): I) quartz + biotite ± molybdenite ± K-feldspar + magnetite (Figures 4A–C); II) quartz + K-feldspar ± sericite + molybdenite (Figures 4B,D); and III) quartz + sericite + chalcopyrite + pyrite (Figures 4E,F). Mo mineralization is associated with Stage I and II, with alteration minerals including mainly biotite + magnetite ± K-feldspar + sericite. Biotite predated K-feldspar (biotite ± K-feldspar + quartz veins are cut by K-feldspar + molybdenite + quartz veins; Figure 4B). Stage III was the main period of Cu mineralization, with Cu sulphides (e.g., chalcopyrite and bornite) being precipitated together with pyrite, sericite, and minor illite (Figures 4E,F).
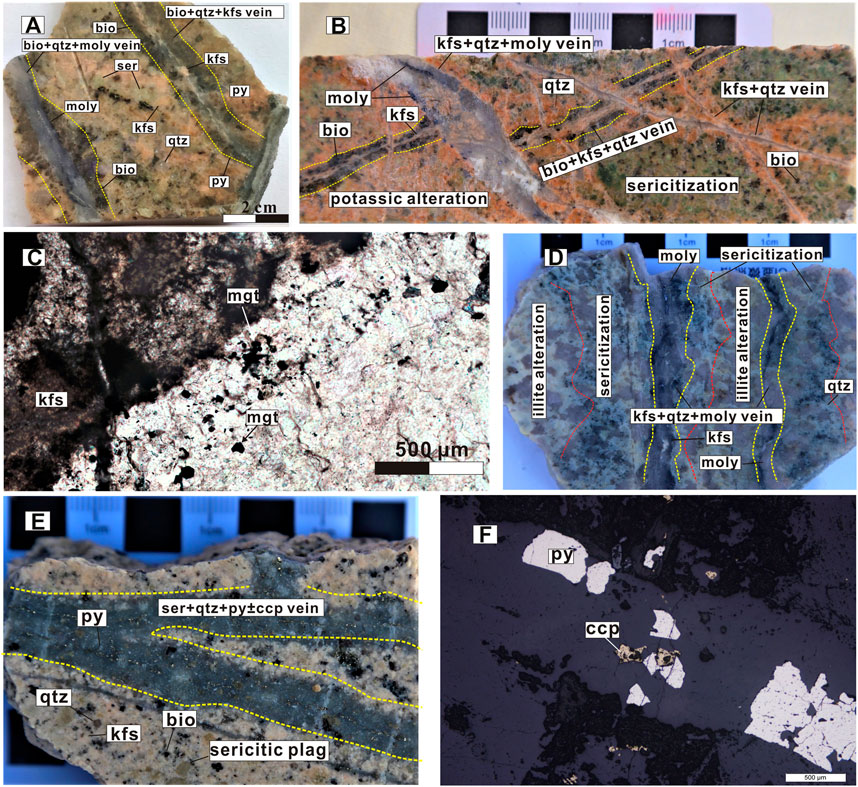
FIGURE 4. Alteration and mineralization hosted in various quartz veins. (A) bio + qtz + moly vein, accompanied with biotitization. (B) early bio + qtz + kfs± moly vein is cut by kfs + qtz + moly vein, early K-feldspathization alteration is overprinted by sericitization. (C) kfs + qtz + moly vein, feldspar is replaced by illite. (D) sericite and illite distribute symmetrically on the two sides of kfs + qtz + moly vein. (E, F) ser+qtz+py±ccp vein. Abbreviations: kfs–K-feldspar; plag–plagioclase; qtz–quartz; ser–sericite; bio–biotite; py–pyrite; moly–molybdenite; ccp–chalcopyrite.
4 Samples and analytical methods
4.1 FI petrography and microthermometry
Representative quartz veins were sampled in the Cu and Mo orebodies (16 and 32 samples, respectively; Figure 2). Up to seven thin sections (70–100 µm thick) from each sample were polished and studied by optical microscopy. Because fluid inclusions may be modified during fracturing to form secondary inclusions, only primary inclusions could represent the physical and chemical conditions of the hydrothermal fluid. Petrographic observations were undertaken at the China University of Geosciences, Beijing, China, using an Olympus BX51 microscope to identify primary FIs. Identification of primary FIs was based on their being isolated and completely enclosed by the quartz host, or growing along quartz growth zones or c axes (Figure 5). Only primary inclusions or inclusion assemblages exhibiting consistent phase proportions at room temperature (Figure 5) were selected for further microthermometric study at the MLR Key Laboratory of Metallogeny and Mineral Assessment, Institute of Mineral Resources, Chinese Academy of Geological Sciences (CAGS), Beijing, China. The analyses employed a Linkham (United Kingdom) THMS600 temperature-control stage with a range of −180°C–580°C (precision ±0.1°C for cooling and ±2°C for heating). Ice melting temperatures were observed at a heating rate of 0.1°C min–1, and homogenization temperatures at 1°C min–1. Salinities (wt.% NaCl equivalent) of aqueous FIs and those containing halite daughter minerals were calculated from ice melting (Bodnar, 1993) and halite dissolution (Sterner et al., 1988) temperatures, respectively.
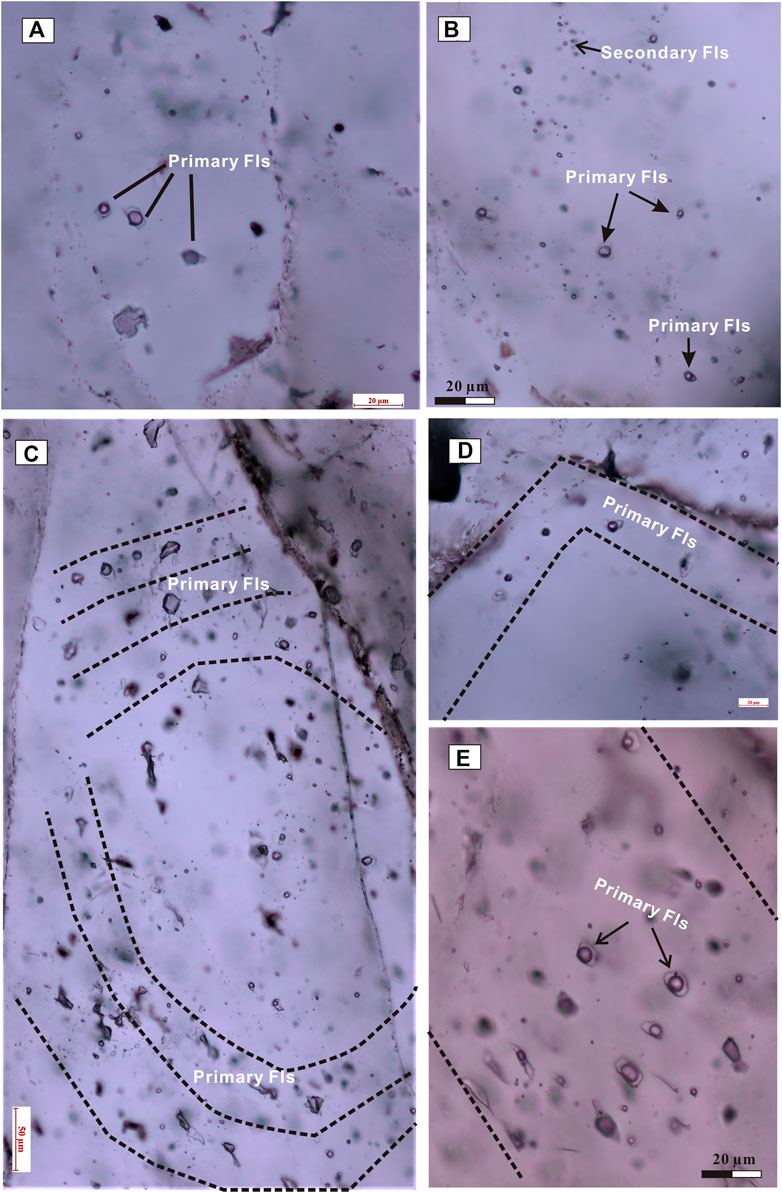
FIGURE 5. The criteria for identifying primary fluid inclusions. (A, B) isolated, totally enclosed by quartz; (C, D) fluid inclusions growing along the growth zoning of quartz; (E) primary fluid inclusion assemblages with the consistent phase ratios.
4.2 Laser Raman microspectroscopy
Laser Raman spectroscopic analysis of FIs employed a LabRAM HR800 (Horiba, Japan) microspectrometer at the Beijing Research Institute of Uranium Geology, Beijing, China. An Ar+ ion laser with a wavelength of 532 nm and a source power of 25 mW were used, with a spectral resolution of ±1 cm−1.
4.3 LA–ICP–MS analysis of melt inclusions
Laser ablation–inductively coupled plasma–mass spectrometry (LA–ICP–MS) analyses of melt inclusions were undertaken at the State Key Laboratory of Ore Deposit Geochemistry, Institute of Geochemistry, China Academy of Science (CAS), Guiyang, using an Agilent 7900 ICP–MS system coupled to a GeoLasPro 193 nm ArF excimer LA system (Lan et al., 2017a; Lan et al., 2017b). Details of instrumental operating conditions can be found in Lan et al. (2017a), Lan et al. (2017b). The sample chamber was flushed with He gas at 0.5 L min–1. A laser spot of diameter of 30–50 μm was applied with repetition rates of 4–10 Hz and energy densities of 8–10 J cm–2, depending on melt-inclusion size. Inclusions connected to micro-cracks or surrounded by late FI trails were excluded. Only entire, isolated, unexposed melt inclusions being drilled out of the host quartz. Signals associated with excess ablated host were subtracted from sample signals following Halter et al. (2004). Elements were quantified against the US National Institute of Standards and Technology Standard Reference Material (SRM) 610 as an external standard, and the constant Al2O3 content (∼14 wt.%) of whole-rock quartz monzonite porphyry was used as an internal standard. A typical LA–ICP–MS signal of melt inclusions ablated through host quartz is provided in Supplementary Figure S1. Melt compositions were finally calculated by subtracting the host until the results fit on whole-rock composition trends (see in Supplementary Figure S2). This approach irreversibly will cause the compositional change that leads to misfits with regard to whole-rock trends (Heinrich et al. 2003). The major elements results from Wunugetushan agree well with trends defined by the whole-rock data (see in Supplementary Figure S2).
5 Results
5.1 Fluid inclusion petrography
FIs are hosted in quartz at Wunugetushan deposit, with four types identified on the basis of phase types and ratios at room temperatures (22.5°C), as follows. 1) C-type FIs contain either pure CO2 vapour or an aqueous phase plus one or two carbonic phases (Figures 6A,B). They are generally small (<12 µm diameter) with a subhedral to irregular crystal morphology (Figure 6A). Most are hosted in early molybdenite + K-feldspar + quartz veins. In the two- and three-phase FIs, CO2-bearing vapour accounts for 10–30 vol.% and 40–60 vol.% of the total inclusion, respectively (Figure 6B). C-type FIs usually homogenize into liquid or occasionally vapour-phase inclusions, while some pure CO2 vapour inclusions are transformed into two- or three-phase CO2 inclusions at room temperatures (23°C–25°C). 2) Solid-bearing S-type FIs contain one or more daughter minerals, an aqueous liquid, and a relatively small vapour bubble (Figures 6C,D). They include negative crystal clusters or isolated individuals hosted in late Stage II and III quartz veins. Daughter minerals include hematite, halite, anhydrite, sylvite, and other opaque minerals (Figures 6C,D). During heating, sylvite disappear first, then halite crystals, the bubbles, and finally the anhydrite. Most S-type inclusions homogenize to a liquid phase. 3) Vapour-dominated V-type FIs (Figure 6E) contain 60–100 vol.% vapour and coexist with other types of FIs. They are round or subhedral in shape with diameters of 7–13 µm (Figure 6E), and usually grow together with S-type FIs in quartz growth zones. V-type fluid inclusions are more abundant in early Stage I and II quartz veins than in later veins. 4) Liquid-rich L-type FIs (Figure 6F) contain 10–30 vol.% vapour and >60 vol.% liquid. They are irregular in shape with diameters of 5–15 µm (Figure 6F). L-type FIs occur mainly in Stage III quartz veins, and commonly coexist with V-type FIs and occasionally S- and C-type FIs.
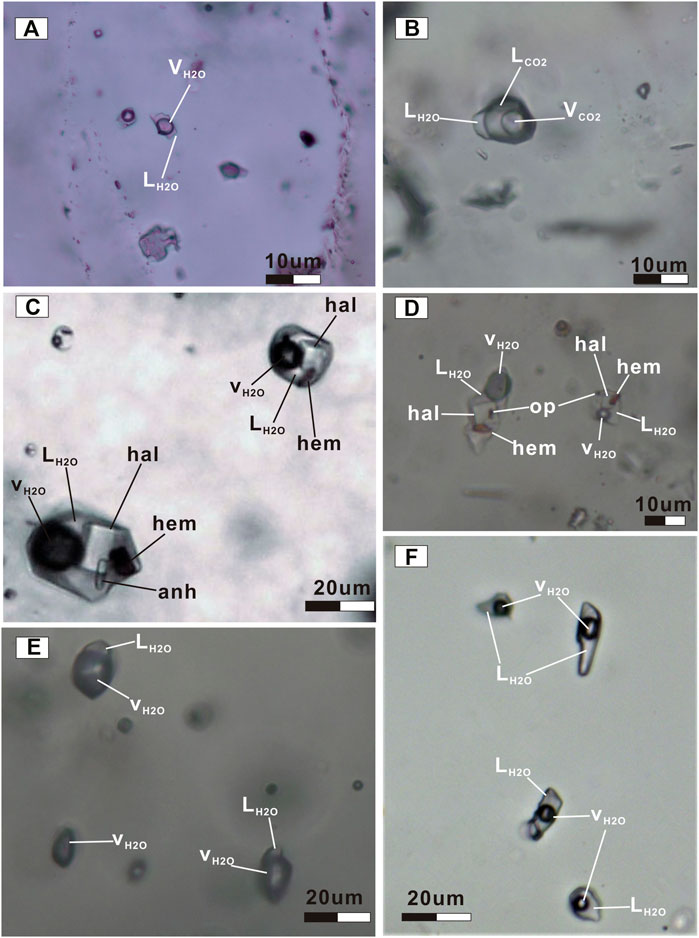
FIGURE 6. Representative fluid inclusion types in Wunugetushan porphyry Cu-Mo deposit. (A) C-type inclusions in early Mo mineralization stage and (B) late Mo mineralization stage. (C) S-type inclusions in late Mo mineralization stage and (D) Cu mineralization stage. (E) V-type inclusions in early Mo mineralization stage and (F) L-type inclusions in Cu mineralization. Abbreviations: LH2O- liquid H2O, LCO2- liquid CO2, VCO2- vapor CO2, VH2O- vapor H2O, hal-halite, hem-hematite, anh-anhydrite, op-opaque mineral.
5.2 Microthermometry
Microthermometric data for FIs are summarized in Table S1 and Figure 7. Relationships between different generations of quartz vein and mineralization type indicate that mineralization stages can be further subdivided into Mo mineralization and Cu mineralization stages, with the former including early and late Mo stages based on alteration type.
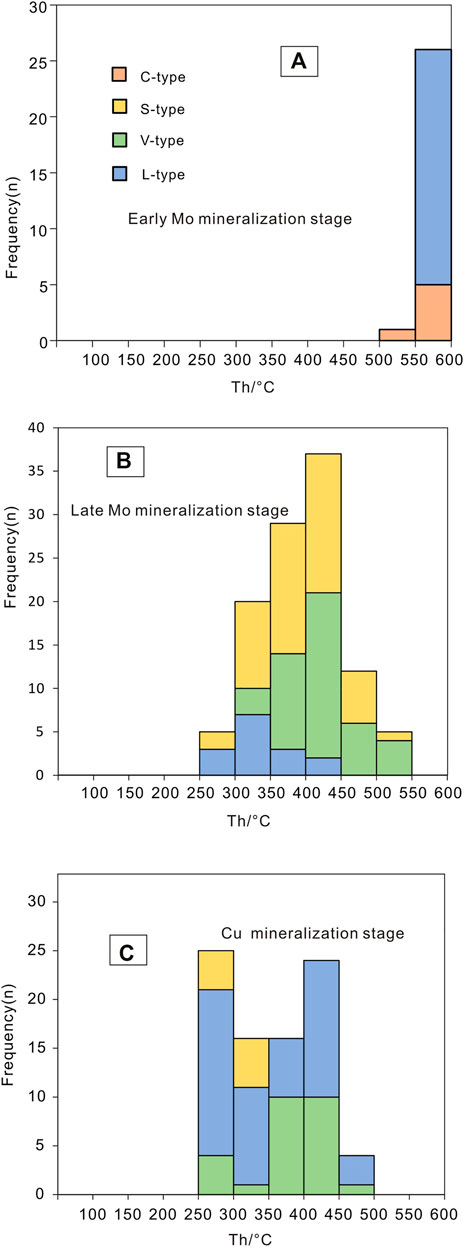
FIGURE 7. Frequency histograms of total homogenization temperatures (Th)for fluid inclusions in different stages. (A) early Mo mineralization stage; (B) late Mo mineralization stage; (C) Cu mineralization stage.
In the early Mo mineralization stage, FIs are mainly of the C- and V-types, with minor L-type FIs. The C-type FIs yield homogenization temperatures of 543°C–560°C and clathrate-melting temperatures of 4.1°C–6.4°C (two yielded carbonic-phase homogenization temperatures of 21.5°C–25.5°C). L-type FIs have homogenization temperatures of 560°C–570°C (Figure 7A) and ice-melting temperatures of −7.4°C to −13.5°C (corresponding to salinities of 11.0–17.3 wt.% NaCl equiv.). V-type FIs of this stage are usually difficult to observe during heating because of their limited liquid content.
In the late Mo mineralization stage, the abundance of FIs follows the order V-type > S-type > L-type. Homogenization temperatures of FIs are clustered at 340°C–460°C (Figure 7B) with peaks at 400°C and 450°C. V-type FIs have homogenization temperatures of 302°C–512°C, ice-melting temperatures of −6.2°C to −19.7°C, and salinities of 9.5–22.5 wt.% NaCl equiv. During heating, the vapour bubbles disappear before dissolution of the daughter-mineral crystal. This is opposite that of other S-type FIs, possibly due to the fluid system being heterogeneously saturated or oversaturated. Homogenization temperatures of S-type FIs are in the range of 291°C–503°C, with salinities of 42.4–77.0 wt.% NaCl equiv.
In the Cu mineralization stage, FI abundance follows the order: L-type > V-type > S-type. Homogenization temperatures are in the range 230°C–500°C with peaks at 250°C–300°C and 400°C–450°C; the latter is similar to that of FIs of the late Mo mineralization stages (Figure 7C). The L-type FIs have homogenization-temperature peaks at 300°C–350°C and 400°C–450°C, and ice-melting temperatures of −7.1°C to −15.4°C (corresponding to salinities of 11.2–19.0 wt.% NaCl equiv.). V-type FIs have homogenization temperatures of 400°C–450°C and ice-melting temperatures of −7.5°C to −16.9°C, with salinities of 7.2–20.1 wt.% NaCl equiv. Vapour bubbles within S-type FIs disappear earlier than the halite (except for two outliers) during heating. The S-type FIs have homogenization temperatures of 244°C–319°C, daughter-mineral melting temperatures of 244°C–315°C, and salinities of 32.9–45.6 wt.% NaCl equiv.
5.3 Laser Raman microspectroscopy
Laser Raman microspectroscopy results (Figure 8) indicate that CO2 is detectable only in FIs from early molybdenite-bearing quartz veins (Figures 8A,B). The red-coloured daughter mineral in FIs from Cu- and Mo-dominated quartz veins is hematite (Figure 8C). H2O is the major liquid phase in all FIs (Figure 8D).
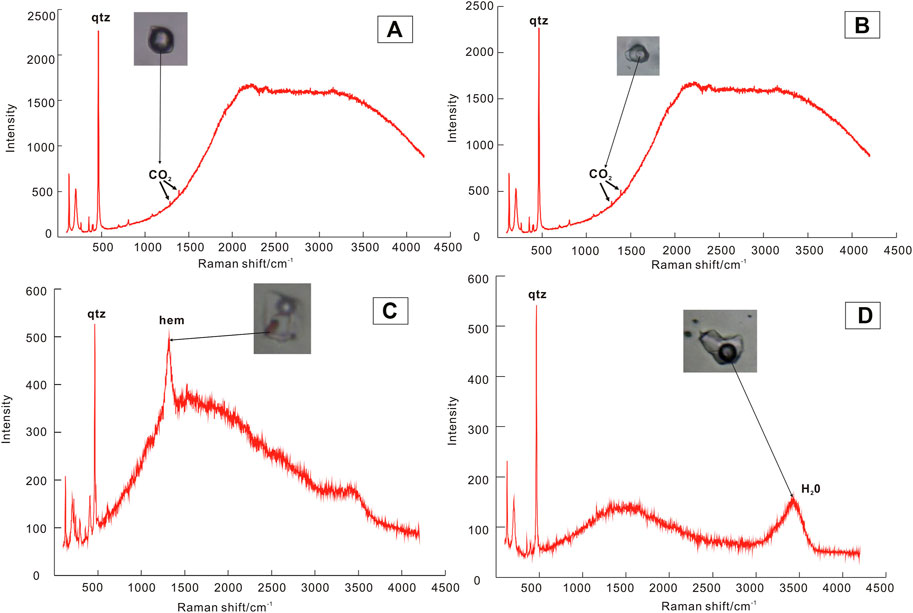
FIGURE 8. Laser Raman spectra of fluid inclusions. (A, B) CO2 in vapor phase of V-type inclusion. (C) hematite daughter mineral in S-type inclusion. (D) H2O in vapor phase of L-type inclusion. Abbreviations: hem-hematite, qtz-quartz.
5.4 Melt inclusion composition
Melt inclusions in quartz from the monzonite porphyry are completely crystallized, and those in dacite porphyry are crystallized or partly glassy (Figure 9). Melt inclusions from monzonite porphyry and dacite porphyry have similar major- and trace-element compositions, including 71.7–85.3 wt.% SiO2, ∼14.0 wt.% Al2O3, <0.7 wt.% FeOt, 3.8–6.1 wt.% K2O, 0.1–0.2 wt.% Na2O, 0.3–1.0 wt.% CaO, 67–79 ppm Rb, 1.4–2.0 ppm Cs, 1.9–41.5 ppm Cu, and 1.0–2.6 ppm Mo (Table S2).
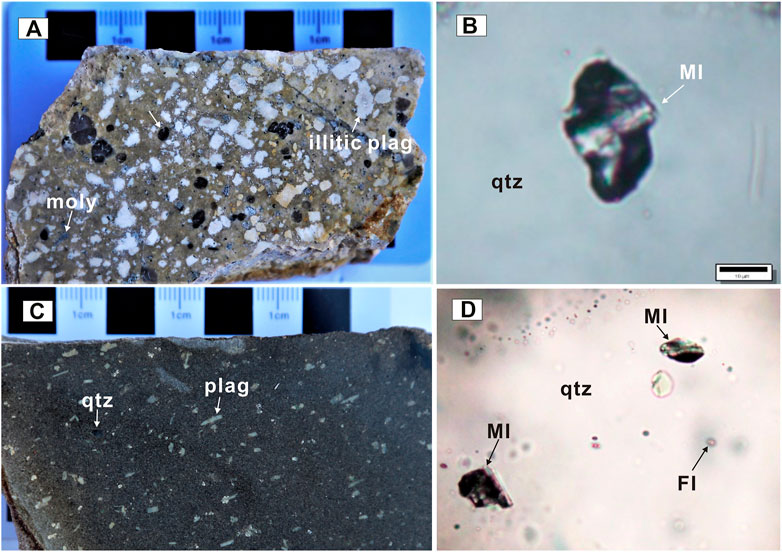
FIGURE 9. Representative hand specimen of quart monzonite porphyry and dacite porphyry and photomicrographs of melt inclusions within them. (A) quart monzonite porphyry comprising of plag (45%), qtz (10%), and matrix (45%). (B) totally isolated crystalline melt inclusion hosted in quartz of monzonite porphyry. (C) dacite porphyry consisting of plag + quartz (10%) and matrix (90%). (D) quartz-hosted melt inclusions in dacite porphyry. Abbreviations: qtz-quartz, plag–plagioclase, melt inclusion–MI, fluid inclusion–FI.
6 Discussion
6.1 Fluid evolution in the wunugetushan ore deposit
The physicochemical evolution of magmatic–hydrothermal fluids depends strongly on emplacement depth. Fluids exsolved from deep granitic intrusions under conditions of high temperature and pressure approximate the granite solidus, and lithostatic initial fluids are typically single-phase, of intermediate salinity, and CO2-rich, as in most porphyry-mineralized systems (Williams-Jones and Heinrich, 2005; Audétat et al., 2008; Kouzmanov and Pokrovski, 2012; Audétat and Li, 2017; Audétat, 2019).
In the early Mo mineralization stage of the Wunugetushan porphyry Cu–Mo deposit, a high-temperature (>550°C), CO2-rich fluid was first exsolved from the magmatic–hydrothermal system. This fluid evolved near the interior of the porphyry host and was similar to the intermediate-density-type fluid of Audétat. (2019), having a variable and relatively low salinity (4.1–17.3 wt.% NaCl equiv.; Figure 10). During this stage, alteration involved strong alkali metasomatism, as indicated by the abundance of biotite and K-feldspar resulting from interaction between hydrothermal fluid and wall rock. The preservation of magnetite coexisting with biotite indicates the high oxygen fugacity (fO2) of the primary fluids (Figure 4C). This resulted in limited sulphur activity, and little molybdenite and pyrite were precipitated.
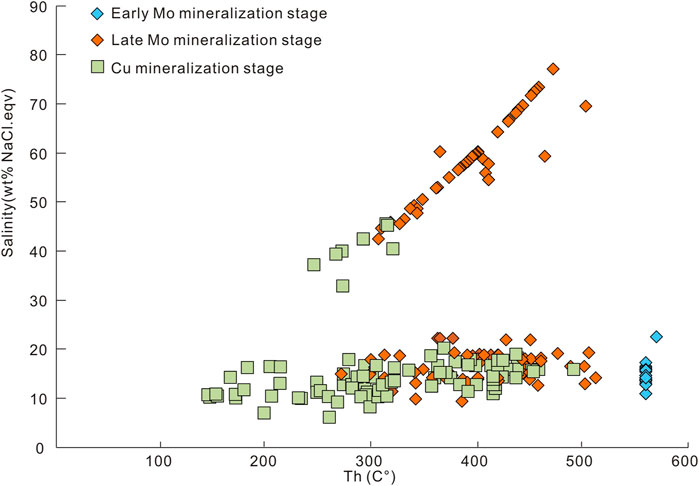
FIGURE 10. Plot of homogenization temperatures (Th) and salinity of individual fluid inclusion in different stages.
Fluids of the late Mo mineralization stage were highly oxidized, alkali-rich and of high salinity, resulting in the growth of high-fO2 minerals (anhydrite and hematite), many daughter minerals within FIs, and strong potassic alteration. In contrast to the early mineralization stage, fluids were depleted in CO2, possibly because of fluid boiling or mixing during local depressurization and the addition of meteoric water into the open hydrothermal system, as indicated by previously published FI δD and δ18O data (Ye and Wang, 1989; Tan et al., 2013). A high H+ activity may also promote CO2 escape through reactions such as 2H+ + CO32− → H2O+ CO2↑. With the gradual assumption of alkali cations and OH−, crystallization of anhydrite and hematite, and escape of CO2, the activity of H+ in fluids would have increased while fO2 decreased (Hu et al., 2002; Ulrich et al., 2001; Heinrich, 2005; Seo et al., 2012). Acidic alteration minerals (sericite and illite) and sulphides (mainly molybdenite) would then have precipitated.
In the late Cu mineralization stage, fluids became more acidic with low fO2, and were CO2-barren after the crystallization of alkali cations (K+) and OH-bearing minerals (e.g., biotite and K-feldspar), anhydrite and hematite, and loss of CO2 (Heinrich, 2005). The low fO2 and high H+ activity of fluids led to extensive deposition of acidic alteration minerals (sericite and illite) and sulphides (mainly chalcopyrite). In the Cu mineralization stages, S-type FIs coexisting with V-type FIs in single quartz grains homogenized to a liquid phase, and the latter homogenized to a vapour phase at similar homogenization temperatures, indicating a boiling-fluid system. Fluid mixing is represented by the two temperature peaks (Figure 7C) with the hot magmatic-hydrothermal fluid adding by cold meteoric water.
6.2 Factors controlling the separation of Cu and Mo
Temporospatial decoupling of Cu and Mo has been documented in many porphyry Cu–(Mo–Au) deposits (Sillitoe, 2010 and reference therein) but the causative factors remain elusive. The Cu content of magma is strongly influenced by early sulphide saturation (Audétat et al., 2011). Because of the high partition coefficient for Cu between sulphide and silicate melt (Dsulphide/melt Cu= 250–900; Audétat et al., 2011) and general sulphide saturation in mantle sources or during early crystal fractionation (Lee et al., 2012; Lee and Tang, 2020), the Cu content of the melt will decrease as magma evolves (e.g., Du and Audétat, 2020). In comparison with the strongly chalcophilic behaviour of Cu, the melt Mo content increases during magma evolution and is less affected by early molybdenite saturation (Audétat et al., 2011) because of the low partition coefficient for Mo between sulphide and silicate melt (Dsulphide/melt Mo= 0.2–10; Audétat et al., 2011). Progressive magma differentiation should therefore lower the Cu/Mo ratio of residual melt in multi-phase porphyry intrusion stocks (Candela and Holland, 1986), and in such a scenario molybdenite-bearing quartz veins are hosted by late porphyry intrusions and molybdenite precipitation generally postdating chalcopyrite crystallization. This is observed in most porphyry Cu–Mo deposits, as in the Bingham Canyon (USA; Seo et al., 2012), Hucunnan (E China; Cao et al., 2017), and Yulong (Tibet in southwestern China; Chang et al., 2018) deposits, where early chalcopyrite precipitation is accompanied with widespread potassic alteration. As a consequence, the contrasting behaviours of Cu and Mo during sulphide saturation will reduce the Cu/Mo ratio in melt, leading to Cu behaving compatibly and Mo incompatibly, with spatial Cu–Mo decoupling. However, early sulphide saturation is limited in relatively basic to intermediate melts with SiO2 contents of 50–65 wt.%, and as magma evolves to more acidic compositions (SiO2 content >70 wt.%) the decrease of melt Cu/Mo ratio will be depressed (Audétat et al., 2011) and a high Cu/Mo ratio might be expected due to the high saturation temperature of molybdenite (close to the granite solidus at >550°C; Audétat and Li, 2017) relative to chalcopyrite.
In the Wunugetushan deposit, the effect of early sulphide saturation is weak and Cu–Mo orebodies tend to be simple, featuring a single orebody related to a single acidic intrusion phase. Early sulphide saturation and the possible injection of mafic magma pulses have negligible effects on the Cu and Mo contents of the magma. This inference is supported by the lack of significant Mo or Cu mineralization in late diabase porphyry at Wunugetushan. Melt-inclusion data indicate that causative magmas of the Wunugetushan deposit have a rhyolitic composition (71.7–83.6 wt.% SiO2), relatively more acidic than other porphyry Cu(–Mo) deposits. The melt Cu/Mo ratio increases with SiO2 content (Figure 11), possibly due to early molybdenite crystallization at high temperatures of 560°C–570°C (approximating the granite solidus) leading to a decrease in Mo content of the evolved melt. The molybdenite saturation also has been observed in many high-silica rhyolite (75–85 wt.% SiO2) worldwide (Audétat et al., 2011). Therefore, for a highly acidic intrusive phase, as in the Wunugetushan example, selective precipitation of two metals with contrasting crystallization temperatures could lead to the separation of Cu and Mo.
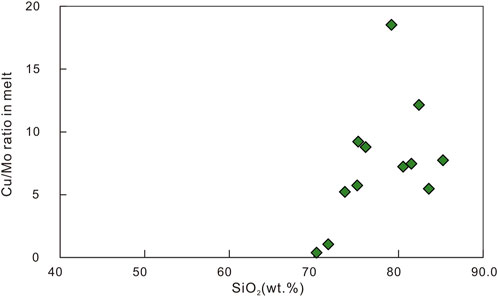
FIGURE 11. Cu/Mo ratios in melt vs. SiO2 in melt.
Molybdenum orebodies in the Wunugetushan deposit are concentrated in the deep interior of the porphyry host, while Cu orebodies occur more towards the exterior, with their spatial distribution being similar to that in many other porphyry Cu–Mo deposits (e.g., the Yulong deposit; Chang et al., 2018). However, the Wunugetushan case differs in the timing of molybdenite and chalcopyrite, with molybdenite precipitating earlier than chalcopyrite, contrary to the situation in other ore deposits. Oxidized fluids generally promote metal transport because the high solubility, but deposition requires a reducing environment, as achieved by the breakdown of oxidized minerals such as anhydrite and magnetite. Chalcopyrite precipitation is promoted by neutral or oxidized fluids, contrasting with molybdenite, which tends to precipitate from more reduced and acidic fluids (Seo et al., 2012). Small changes in the redox state or pH of hydrothermal fluids may thus be responsible for spatial separation of Cu and Mo. In the early molybdenite–quartz veins, molybdenite was first precipitated from alkaline and high-fO2 fluids, but amounts of molybdenite are small due to the high fO2 of the initial fluids. Molybdenite precipitation occurred mainly during the late mineralization stage, when oxidizing minerals were consumed and fluids became more acidic and less oxidized. Chalcopyrite precipitation was accompanied by strong acidic alteration (sericitization and illitization) and the formation of more oxidized minerals such as hematite (Figure 5D). Increasing fluid fO2 and acidity, from the Mo to Cu mineralization stages, thus played a positive role in the spatial separation of the two metals.
Higher CO2 concentrations in aqueous fluids may reduce the solubility of Mo (Kokh et al., 2017). Decompression during emplacement, condensation of magma bodies and CO2 escape may thus cause the early precipitation of molybdenite, but variations in CO2 concentration from the Mo to Cu mineralization stages would merely affect the molybdenite saturation of initial fluids, whether causing the separation of Cu and Mo is not clear. Ascent and decompression of porphyry intrusions would lead to the original single-phase fluids entering brine and vapour phases, which are immiscible in many porphyry Cu systems (Williams-Jones and Heinrich, 2005; Audétat et al., 2008; Kouzmanov and Pokrovski, 2012; Audétat, 2019). Experimental studies have shown that brine inclusions generally host higher Mo concentrations than vapour-rich inclusions (Klemm et al., 2008; Zajacz et al., 2017; Chang et al., 2018), whereas Cu also preferentially be transported by hypersaline brines than vapour-dominated FIs (Lerchbaumer and Audétat, 2012). Both Mo- and Cu-rich brine phases could have condensed from fluids and accumulated deep in the ore deposit due to their high densities. Chang et al. (2018) reported local Cu–Mo decoupling in the Yulong Cu–Mo deposit caused by the sequential deposition of Mo and Cu from a condensed brine phase, but whether vapour/brine immiscibility could be a dominant factor in Cu–Mo separation in an ore-deposit scale is still need explored. In the case of Wunugetushan, vapor-brine immiscibility of FI is not popular and whether such a process affect the Cu/Mo decoupling still need to be explored in the future.
Taken together, the spatial separation of Cu and Mo in the Wunugetushan deposit resulted from the combined effects of multiple factors, including melt Cu/Mo ratios, and the redox state and pH variations of the hydrothermal fluid. It is unclear whether vapor-brine immiscibility predominates in causing Cu–Mo separation, especially on the scale of an ore deposit.
7 Conclusion
Field surveys and melt- and fluid-inclusion studies of the Wunugetushan porphyry Cu–Mo deposit have led to the following conclusions. The Cu and Mo orebodies are hosted by a single monzonite porphyry, with Mo orebodies tending to be concentrated within the porphyry host and Cu orebodies externally. The hydrothermal fluid evolved through three main stages: early and late Mo mineralization and Cu mineralization. Across these stages, fluids changed from initially being of intermediate salinity, CO2-rich, oxidized, and high temperature, to being of high salinity and CO2-depleted, and finally to again being of intermediate salinity but highly oxidized. The separation of Cu and Mo was promoted by a combination of factors including increased Cu/Mo ratios in residual melt, and the changing redox state and acidity of ore-forming fluids.
Data availability statement
The datasets presented in this study can be found in online repositories. The names of the repository/repositories and accession number(s) can be found in the article/Supplementary Material.
Author contributions
JD designed the project and collected the samples; WL wrote the first manuscript and studies the melt inclusions; YZ anticipated the field work and fluid inclusion studies; ZS did the field work.
Funding
This study was supported financially by the National Natural Science Foundation of China (No. 42002072), Fundamental Research Funds for the Central Universities (Grant 300102271304), Natural Science Basic Research Program of Shaanxi (Program No. 2023-JC-QN-0336).
Acknowledgments
We also want to thank associate editor Fan Yang and three reviewers for their constructive suggestions.
Conflict of interest
ZS was employed by China Gold Inner Mongolia Mining Co Ltd.
The remaining authors declare that the research was conducted in the absence of any commercial or financial relationships that could be construed as a potential conflict of interest.
The reviewer LT declared a shared affiliation with the author YZ to the handling editor at time of review.
Publisher’s note
All claims expressed in this article are solely those of the authors and do not necessarily represent those of their affiliated organizations, or those of the publisher, the editors and the reviewers. Any product that may be evaluated in this article, or claim that may be made by its manufacturer, is not guaranteed or endorsed by the publisher.
Supplementary material
The Supplementary Material for this article can be found online at: https://www.frontiersin.org/articles/10.3389/feart.2023.1121856/full#supplementary-material
References
Audétat, A., Dolejs, D., and Lowenstern, J. B. (2011). Molybdenite saturation in silicic magmas: Occurrence and petrological implications. J. Pet. 52, 891–904. doi:10.1093/petrology/egr008
Audétat, A., and Li, W. T. (2017). The Genesis of Climax-type porphyry Mo deposits: Insights from fluid inclusions and melt inclusions. Ore. Geol. Rev. 88, 436–460. doi:10.1016/j.oregeorev.2017.05.018
Audétat, A., Pettke, T., Heinrich, C. A., and Bodnar, R. J. (2008). Special paper: The composition of magmatic-hydrothermal fluids in barren and mineralized intrusions. Econ. Geol. 103, 877–908. doi:10.2113/gsecongeo.103.5.877
Audétat, A. (2019). The metal content of magmatic-hydrothermal fluids and its relationship to mineralization potential. Econ. Geol. 114 (6), 1033–1056. doi:10.5382/econgeo.4673
Bodnar, R. J. (1993). Revised equation and table for determining the freezing point depression of H2O–NaCl solutions. Geochim Cosmochim. Acta. 57, 683–684. doi:10.1016/0016-7037(93)90378-a
Candela, P. A., and Holland, H. D. (1986). A mass transfer model for copper and molybdenum in magmatic hydrothermal systems:the origin of porphyry-type ore deposits. Econ. Geol. 81, 1–19. doi:10.2113/gsecongeo.81.1.1
Cao, Y., Zheng, Z. J., Du, Y. L., Gao, F. P., Qin, X. L., Yang, H. M., et al. (2017). Ore geology and fluid inclusions of the Hucunnan deposit, Tongling, Eastern China: Implications for the separation of copper and molybdenum in skarn deposits. Ore. Geol. Rev. 81, 925–939. doi:10.1016/j.oregeorev.2016.04.013
Chang, J., Li, J. W., and Audétat, A. (2018). Formation and evolution of multistage magmatic-hydrothermal fluids at the Yulong porphyry Cu-Mo deposit, eastern Tibet: Insights from LA-ICP-MS analysis of fluid inclusions. Geochim. Cosmochim. Acta. 232, 181–205. doi:10.1016/j.gca.2018.04.009
Chen, X., Li, H. N., and Duan, G. Z. (1997). Origin of the Erentaolegai granite and its relations with silver deposit, Inner Mongolia. Min. Resour. Geol. 11, 91–98.
Chen, Z. G., Zhang, L. C., Wan, B., Wu, H. Y., and Cleven, N. (2011). Geochronology and geochemistry of the Wunugetushan porphyry Cu–Mo deposit in NE China, and their geological significance. Ore Geol. Rev. 43, 92–105. doi:10.1016/j.oregeorev.2011.08.007
Du, J. G., and Audétat, A. (2020). Early sulfide saturation is not detrimental to porphyry Cu-Au formation. Geology 48, 519–524. doi:10.1130/G47169.17
Gao, B. Y., Zhang, L. C., Jin, X. D., Li, W. J., Chen, Z. G., and Zhu, M. T. (2016). Geochronology and geochemistry of the Badaguan porphyry Cu–Mo deposit in Derbugan metallogenic belt of the NE China, and their geological significances. Int. J. Earth Sci. Geol. Rundsch) 105, 507–519. doi:10.1007/s00531-015-1261-4
Halter, W. E., Pettke, T., and Heinrich, C. A. (2004). Laser-ablation ICP-ms analysis of silicate and sulfide melt inclusions in an andesitic complex I: Analytical approach and data evaluation. Contrib. Mineral. Pet. 147, 385–396. doi:10.1007/s00410-004-0562-6
Heinrich, C. A., Pettke, T., Halter, W. E., Aigner-Torres, M., Audétat, A., Gunther, D., et al. (2003). Quantitative multi-element analysis of minerals, fluid and melt inclusions by laser-ablation inductively-coupled-plasma mass-spectrometry. Geochim. Cosmochim. Acta. 67, 3473–3497. doi:10.1016/s0016-7037(03)00084-x
Heinrich, C. A. (2005). The physical and chemical evolution of low-salinity magmatic fluids at the porphyry to epithermal transition: A thermodynamic study. Min. Deposita. 39, 864–889. doi:10.1007/s00126-004-0461-9
Hu, S. X., Zhao, Y. Y., Sun, J. G., Ling, H. F., Ye, Y., Lu, B., et al. (2002). Fluids and their sources for gold mineralization in the north China platform. J. Nanjing Univ. Nat. Sci. 38, 381–391.
Hu, X. L., Ding, Z. J., Yao, S. Z., He, M. C., Shen, J., Zhu, B. P., et al. (2014). Geochronology and Sr–Nd–Hf isotopes of the mesozoic granitoids from the great xing’an and lesser xing’an ranges: Implications for petrogenesis and tectonic evolution in NE China. Geol. J. 51, 1–20. doi:10.1002/gj.2576
Klemm, L. M., Pettke, T., and Heinrich, C. A. (2008). Fluid and source magma evolution of the Questa porphyry Mo deposit, New Mexico, USA. Min. Deposita 43, 533–552. doi:10.1007/s00126-008-0181-7
Kokh, M. A., Akinfiev, N. N., Pokrovski, G. S., Salvi, S., and Guillaume, D. (2017). The role of carbon dioxide in the transport and fractionation of metals by geological fluids. Geochim. Cosmochim. Acta. 197, 433–466. doi:10.1016/j.gca.2016.11.007
Kouzmanov, K., and Pokrovski, G. S. (2012). Hydrothermal controls on metal distribution in porphyry Cu (-Mo-Au) systems. Soc. Econ. Geol. Special Publ. 16, 573–618. doi:10.5382/SP.16.22
Lan, T. G., Hu, R. Z., Bi, X. W., Mao, G. J., Wen, B. J., Liu, L., et al. (2017b). Metasomatized asthenospheric mantle contributing to the generation of Cu-Mo deposits within an intracontinental setting: A case study of the ∼128 Ma wangjiazhuang Cu-Mo deposit, eastern north China Craton. J. Asian Earth Sci. 160, 460–489. doi:10.1016/j.jseaes.2017.07.014
Lan, T. G., Hu, R. Z., Fan, H. R., Bi, X. W., Tang, Y. W., Zhou, L., et al. (2017a). In-situ analysis of major and trace elements in fluid inclusion and quartz: LA-ICP-MS method and applications to ore deposits. Acta Pet. Sin. 33, 3239–3262 in Chinese with English abstract.
Lee, C.-T., Luffi, P., Chin, E. J., Bouchet, R., Dasgupta, R., Morton, D. M., et al. (2012). Copper systematics in arc magmas and implications for crust–mantle differentiation. Science 336 (6077), 64–68. doi:10.1126/science.121731
Lee, C.-T.-A., and Tang, M. (2020). How to make porphyry copper deposits. Earth Planet. Sci. Lett. 529, 1–11. doi:10.1016/j.epsl.2019.115868
Lerchbaumer, L., and Audétat, A. (2012). The metal content of silicate melts and aqueous fluidsin subeconomically Mo-mineralized granites: Implications for porphyry Mo genesis. Econ. Geol. 108, 987–1013. doi:10.2113/econgeo.108.5.987
Li, N., Chen, Y. J., Ulrich, T., and Lai, Y. (2012). Fluid inclusion study of the Wunugetu Cu–Mo deposit, Inner Mongolia, China. Min. Deposita 47, 467–482. doi:10.1007/s00126-011-0384-1
Liu, J., Mao, J. W., Wu, G., Wang, F., Luo, D. F., Hu, Y. Q., et al. (2014). Fluid inclusions and H–O–S–Pb isotope systematics of the Chalukou giant porphyry Mo deposit, Heilongjiang Province, China. Ore Geol. Rev. 59, 83–96. doi:10.1016/j.oregeorev.2013.12.006
Metelkin, D. V., Vernikovsky, V. A., Kazansky, A. Y., and Wingate, M. T. D. (2010). Late Mesozoic tectonics of Central Asia based on paleomagnetic evidence. Gondwana Res. 18, 400–419. doi:10.1016/j.gr.2009.12.008
Mi, K. F., Liu, Z. J., Li, C. F., Liu, R. B., and Wang, J. P. (2014). U-Pb ages and Hf isotopes of Zircon in biotite granite from Wunugeshan porphyry Cu-Mo deposit. Geol. J. 33, 113–114 in Chinese with English abstract.
Pak, S. J., Choi, S. G., and Choi, S. H. (2004). Systematic mineralogy and chemistry of gold-silver vein deposits in the Taebaeksan district, Korea: Distal relatives of a porphyry system. Mineral. Mag. 68 (3), 467–487. doi:10.1180/0026461046830199
Pan, L. J., and Sun, E. Y. (1990). Geological characteristics of the Chaganbulagen silver–lead–zinc deposit, Inner Mongolia. Min. Explor. 5, 1–9.
Qin, K. Z., Li, H. M., Li, W. S., and Ishihara, S. (1999). Intrusion and mineralization ages of the Wunugetushan porphyry Cu–Mo deposit, Inner Mongolia, Northwestern China. Geol. Rev. 45, 181–185.
Qin, K. Z., Wang, Z. T., Wang, L. J., Bao, Y. H., and Li, Y. M. (1993). Studies on hydrothermal convection, alteration superimposition and ore-forming processes of the Wunugetushan porphyry copper molybdenum deposit, Inner Mongolia. Geol. Explor. Non-Ferrous Metals 2, 136–143.
Redmond, P. B., and Einaudi, M. T. (2010). The Bingham Canyon porphyry Cu-Mo-Au deposit. I. Sequence of intrusions, vein formation, and sulfide deposition. Econ. Geol. 105, 43–68. doi:10.2113/gsecongeo.105.1.43
Safonova, I. Y. (2009). Intraplate magmatism and oceanic plate stratigraphy of the paleo-asian and paleo-pacific oceans from 600 to 140 Ma. Ore. Geol. Rev. 35, 137–154. doi:10.1016/j.oregeorev.2008.09.002
Seo, J. H., Guillong, M., Aerts, M., Zajacz, Z., and Heinrich, C. A. (2011). Microanalysis of S, Cl, and Br in fluid inclusions by LA-ICP-MS. Chem. Geol. 284, 35–44. doi:10.1016/j.chemgeo.2011.02.003
Seo, J. H., Guillong, M., and Heinrich, C. A. (2012). Separation of molybdenum and copper in porphyry deposits: The roles of sulfur, redox, and pH in ore mineral deposition at Bingham Canyon. Econ. Geol. 107, 333–356. doi:10.2113/econgeo.107.2.333
Sillitoe, R. H. (2010). Porphyry copper systems. Econ. Geol. 105, 3–41. doi:10.2113/gsecongeo.105.1.3
Sterner, S. M., Hall, D. L., and Bodnar, R. J. (1988). Synthetic fluid inclusions. V. Solubility relations in the system NaCl–KCl–H2O under vapor–saturated conditions. Geochim.Cosmochim. Acta 52, 989–1005. doi:10.1016/0016-7037(88)90254-2
Tan, G., She, H. Q., Yin, J. P., Yang, Y. C., Li, J. W., Xiang, A. P., et al. (2013). Source and evolution of ore-fluid in wunugetushan large Cu-Mo deposit, inner Mongolia: Evidence from fluid inclusions and hydrogen and oxygen isotopic geochemistry. Glob. Geol. 32 (3), 463–482 in Chinese with English abstract.
Ulrich, T., Gunther, D., and Heinrich, C. A. (2001). The evolution of a porphyry Cu–Au deposit, based on LA-ICP-MS analysis of fluid inclusions: Bajo de la Alumbrera, Argentina. Econ. Geol. 97, 1889–1920. doi:10.2113/gsecongeo.97.8.1889
Wang, L. Q., Tang, J. X., Chen, W. B., Chen, W., Zhang, Z., Lin, X., et al. (2015a). Origin of the ore-forming fluids and metals of the Bangpu porphyry Mo–Cu deposit of tibet, China: Constraints from He–Ar, H–O, S and Pb isotopes. J. Asian Earth Sci. 103, 276–287. doi:10.1016/j.jseaes.2014.07.041
Wang, Y. H., Zhao, C. B., Zhang, F. F., Liu, J. J., Wang, J. P., Peng, R. M., et al. (2015b). SIMS zircon U–Pb and molybdenite Re–Os geochronology, Hf isotope, and whole-rock geochemistry of the Wunugetushan porphyry Cu–Mo deposit and granitoids in NE China and their geological significance. Gondwana Res. 28, 1228–1245. doi:10.1016/j.gr.2014.10.001
Williams-Jones, A. E., and Heinrich, C. A. (2005). 100th anniversary special paper: Vapor transport of metals and the formation of magmatic-hydrothermal ore deposits. Econ. Geol. 100, 1287–1312. doi:10.2113/gsecongeo.100.7.1287
Wu, C., Tian, J., Chang, F., Liu, C., and Liu, W. (2014). Early cretaceous A-type granites and Mo mineralization, aershan area, eastern inner Mongolia, northeast China: Geochemical and isotopic constraints. Int. Geol. Rev. 56, 1357–1376. doi:10.1080/00206814.2014.935965
Wu, F. Y., Sun, D. Y., Ge, W. C., Zhang, Y. B., Grant, M. L., Wilde, S. A., et al. (2011). Geochronology of the Phanerozoic granitoids in northeastern China. J. Asian Earth Sci. 41, 1–30. doi:10.1016/j.jseaes.2010.11.014
Wu, G., Mei, M., and Gao, F. J. (2010). Ore-forming fluid characteristics and Genesis of silver–lead–zinc deposits in the Manzhouli area, Inner Mongolia, China. Earth Sci. Front. 17, 239–255 in Chinese with English abstract.
Xiao, W. J., and Santosh, M. (2014). The Western central asian orogenic belt: A window to accretionary orogenesis and continental growth. Gondwana. Res. 25, 1429–1444. doi:10.1016/j.gr.2014.01.008
Xu, W. L., Ji, W. Q., Pei, F. P., Meng, E., Yu, Y., Yang, D. B., et al. (2009). Triassic volcanism in eastern Heilongjiang and Jilin Provinces,NE China: Chronology, geochemistry, and tectonic implications. J. Asian Earth Sci. 34, 392–402. doi:10.1016/j.jseaes.2008.07.001
Xu, W. L., Pei, F. P., Wang, F., Meng, E., Ji, W. Q., Yang, D. B., et al. (2013). Spatial–temporal relationships of Mesozoic volcanic rocks in NEChina: Constraints on tectonic overprinting and transformationsbetween multiple tectonic regimes. J. Asian Earth Sci. 74, 167–193. doi:10.1016/j.jseaes.2013.04.003
Ye, X., and Wang, L. J. (1989). A study on fluid inclusion and metallogenesis of a porphyry Cu–Mo deposit, Urugetu Hill, Inner Mongolia, China. Sci. Geol. Sin. 33, 84–92.
Zajacz, Z., Candela, P. A., and Piccoli, P. M. (2017). The partitioning of Cu, Au and Mo between liquid and vapor at magmatic temperatures and its implications for the Genesis of magmatic-hydrothermal ore deposits. Geochim. Cosmochim. Acta. 207, 81–101. doi:10.1016/j.gca.2017.03.015
Zeng, Q. D., Liu, J. M., Chu, S. X., Wang, Y. B., Sun, Y., Duan, X. X., et al. (2014). Re–Os and U–Pb geochronology of the Duobaoshan porphyry Cu–Mo–(Au)deposit, northeast China, and its geological significance. J. Asian Earth Sci. 79, 895–909. doi:10.1016/j.jseaes.2013.02.007
Keywords: melt inclusion, fluid inclusion, Cu and Mo decoupling, wunugetushan, porphyry Cu-Mo deposit
Citation: Lu W, Zhang Y, Du J and Song Z (2023) Melt- and fluid-inclusions studies in the Wunugetushan porphyry Cu–Mo deposit, NE China: Constraints on the separation of Cu and Mo. Front. Earth Sci. 11:1121856. doi: 10.3389/feart.2023.1121856
Received: 12 December 2022; Accepted: 19 January 2023;
Published: 02 February 2023.
Edited by:
Fan Yang, Lanzhou University, ChinaReviewed by:
Leilei Dong, University of Science and Technology Beijing, ChinaXiaoqiang Zhu, Anhui Normal University, China
Li Tang, China University of Geosciences, China
Copyright © 2023 Lu, Zhang, Du and Song. This is an open-access article distributed under the terms of the Creative Commons Attribution License (CC BY). The use, distribution or reproduction in other forums is permitted, provided the original author(s) and the copyright owner(s) are credited and that the original publication in this journal is cited, in accordance with accepted academic practice. No use, distribution or reproduction is permitted which does not comply with these terms.
*Correspondence: Jingguo Du, ZHVqZ2N1Z2JAMTYzLmNvbQ==