- 1Science and Technology Research Institute, China Three Gorges Corporation, Beijing, China
- 2State Key Laboratory of Simulation and Regulation of Water Cycle in River Basin, China Institute of Water Resources and Hydropower Research, Beijing, China
- 3State Key Laboratory of Hydraulic Engineering Simulation and Safety, Tianjin University, Tianjin, China
- 4State Key Laboratory of Geohazard Prevention and Geoenvironment Protection, Chengdu University of Technology, Chengdu, China
The cold regions of China (CRC) are important and vulnerable freshwater recharge areas on land, and any changes in them are related to the survival of millions of people in East Asia. However, for nearly half a century, in cold regions, the extreme temperature response to global warming is still poorly understood. In this study, we systematically studied the temperature extreme changes in cold regions of China since 1961 and discussed the possible circulation factors in detail. The results showed that 1) the warming magnitudes in cold nights and warm nights are greater than those in cold days and warm days, and decreases in cold nights and cold days and increases in warm days and warm nights appeared in almost all of cold regions of China. Most of the temperature indices displayed the largest magnitudes of warming in winter. 2) Spatially, for most of the temperature extremes, the stations located at Qinghai–Tibet Plateau (TPC) and Northwest China (NWC) showed a larger warming trend than that shown by the station at Northeast China (NEC). 3) The responses of temperature extremes at different cold regions to each circulation index are variable. Atlantic Multidecadal Oscillation (AMO) has a significant relationship with almost all the indices in cold regions of China. Almost all the temperature extremes of TPC and NWC showed closely relationship with the North Atlantic Oscillation (NAO), especially for diurnal temperature range (DTR), daily maximum temperature, and the cold extremes. Multivariate ENSO Index (MEI) is significantly related to most the temperature indices of Northwest China and Northeast China. However, MEI has a significant impact on only TPC’s diurnal temperature range and warmest night (TNx). 4) Atlantic Multidecadal Oscillation displayed significant relationships with most the temperature extremes in every season in cold regions of China. However, the summer and winter MEI and the summer and winter North Atlantic Oscillation showed significant impacts on only diurnal temperature range, daily minimum temperatures (TNm), and TNx.
1 Introduction
At present, the global average surface temperature is about 1°C higher than that before industrialization, and it is expected that rising temperatures will reach or exceed 1.5°C in the next 20 years (IPCC, 2021), as global warming is an indisputable fact. Climate change has had different impacts on temperature at varying time scales (from seasonal to multidecadal). Compared with the average temperature, the changes in temperature extremes can better reflect the overall situation of climate systems, and great achievements have been achieved in the recent decades with regard to temperature extreme changes (Alexander et al., 2006; You et al., 2013; Alexander and Arblaster, 2017; Dong et al., 2019; Ding et al., 2021). Meanwhile, temperature extremes are also closely related to local ecosystems and human health, as extreme cold waves and heat waves affect the critical temperature tolerance conditions of humans, animals, and plants, resulting in damages to agriculture and pastures and in human life threats (Zhou C. et al., 2020; Yu et al., 2020; Li et al., 2022). In short, studying the changes in temperature extremes is helpful for the accurate grasping of the warming ranges of different regions and for the scientific understanding of the responses of temperature extreme changes to climate system changes.
Previous works have revealed that with the warming of world climate, the frequency and intensity of temperature extreme events dramatically increase, and the temporal and spatial differences become more and more significant. However, some of the researches on the influencing and driving factors of the differences in temperature extreme changes are controversial. Most scholars believe that temperature extreme changes are caused by the combined action of internal and external factors (Gong et al., 2019; Qian and Zhang, 2019), and it is mainly due to the internal factors change of climate systems on the multidecadal time scale (Chan et al., 2009; Watanabe et al., 2014; Wallace et al., 2015; Gong et al., 2018; Dong et al., 2021; Wang et al., 2022). However, there are still debates over whether the Pacific or Atlantic ocean is the dominant climate warming and on the ocean–atmosphere interaction patterns, such as the North Atlantic Oscillation (NAO) (Li et al., 2013; Ding et al., 2018b; Wang et al., 2019; Bardin and Platova, 2020), Arctic Oscillation (Tong et al., 2019), Pacific Decadal Oscillation (Wills et al., 2018; Du et al., 2019; Zhou Z. et al., 2020), Atlantic Multidecadal Oscillation (AMO) (Shi et al., 2018a; Wang et al., 2019), Multivariate ENSO Index (MEI), East Central Tropical Pacific sea surface temperature (Caesar et al., 2011; Rohini et al., 2016; Wills et al., 2018; Tong et al., 2019), and Indian ocean (Rohini et al., 2016), or the joint action between oceans (Wills et al., 2018). In particular, China’s mean surface air temperature has been experiencing warming in the past decade, which has been confirmed in previous studies (Soon et al., 2018). The frequency of high-strength heat waves became higher and higher (Li Q. et al., 2015). Also, many researches have shown that the hot extreme changes in different regions of China exhibit obvious spatial heterogeneity (You et al., 2010; Li S. L. et al., 2015; Shi et al., 2018b) and that hot extremes have significantly increased in the Tibetan Plateau, southwest China, and East China (Shen et al., 2018). In addition, this spatial heterogeneity has indicated that there are some differences in the controlled atmospheric circulation patterns in different regions due to the complexity of China’s climate system. Moreover, the variation of the temperature extreme index is also controlled by different atmospheric circulation patterns. However, it is still controversial to extreme temperature changes how to be controlled by different atmospheric circulation patterns. Therefore, the mechanism of climate change needs to be more fully understood, which is hard for researchers.
The cold regions of China (CRC), including the cold regions of Northeast China (NEC), Northwest China (NWC), and Qinghai–Tibet Plateau (TPC), are vulnerable ecological regions, and they have regions with complex climatic environmental backgrounds with characteristics that are sensitive to climate change. In addition, these regions are the origin of many large rivers in East Asia, and their response to global warming is not only related to ecological and hydrological safety and the balance of the water resources in the region but is also closely related to the survival of billions of people in East Asia to a large extent. This makes the region ideal for researchers to study climate change. However, most previous studies have focused on the changes in the temperature extremes only in some parts of China (Li et al., 2010; Li et al., 2012; You et al., 2013; Deng et al., 2014; Sun W. et al., 2016; Tong et al., 2019; Ding et al., 2021), and the researches on the temperature extremes in the whole CRC are relatively scarce (Yin et al., 2019; Zhou Z. et al., 2020), Moreover, the studies on the latest observational data did not consider the whole CRC. There have only been a few studies on the statistical relationships between temperature extremes and ocean–atmospheric interaction circulation patterns (You et al., 2013; Shi et al., 2018a; Zhou Z. et al., 2020; Ding et al., 2021). To the best of our knowledge, teleconnection patterns significantly contribute to atmospheric circulation systems by influencing the changes in temperature, precipitation, atmospheric pressure, and upper troposphere jet streams, resulting in weather and climate anomalies (Krishnamurthy and Krishnamurthy, 2015; Li and Ma, 2018; Zhou Z. et al., 2020; Dong et al., 2020; Zhang et al., 2022). However, it is not still clear whether and how different atmospheric circulation patterns affect the regional temperature extremes in CRC. Therefore, it is necessary to perform more systematic climate change research in this area. The use of temperature extreme indices is a good research method, as it can systematically reflect the overall characteristics of climate. In addition, the research on the atmospheric circulation patterns affecting regional warming has important theoretical significance and reference values for the accurate prediction of the regional extreme climate change in the future. It also has great reference significance for studying the changes in permafrost, glaciers, snow covers, and ice caps.
In this study, we focused on 1) investigating the temporal trends and spatial distribution characteristics of 11 temperature extreme indices in CRC from 1961 to 2018 and 2) on examining the influence of the ocean–atmosphere interaction circulation patterns that possibly dominate the temperature extreme changes in this region. This, thus study can be helpful in understanding the influencing mechanism of climate change on temperature extremes and in providing important scientific guidelines for water resource prediction and management.
2 Data and analytical methods
2.1 Study area and data sources
2.1.1 Study area
The study area is intended to select CRC. The earliest definition of cold regions in China learned from the definition of Canada (Koppen, 1936; Wilson, 1967; Gerdel, 1969). With the further study of cold regions, Yang et al. (2000) considers that the definition is more suitable for delineating the Canadian region in the high latitude cold regions and does not fully adapt to China. Therefore, 10 suitable climate factors for the cold division of China are proposed. However, Yang et al. (2000) only roughly divided the scope of cold regions, and did not point out the specific location of cold regions in China. Considering the operability of cold regions, Chen et al. (2005) combined with the research results of the predecessors, gave three standards of cold region that is more consistent with the actual situation in China. The three criteria are: 1) the coldest month temperature is less than −3°C; 2) the annual average temperature is no more than 5°C; 3) the monthly average temperature is greater than 10°C for no more than 5 months. This study used Chen’s method to divide CRC. A brief mathematical background of Chen’s method is given in Appendix Method 1. According to the calculation results, CRC can be divides into three subregions (Figure 1). The first part is NEC, including Changbai Mountain, Sanjiang Plain, Mongolian Plateau and Taihang Mountain in Northeast China. The second part is NWC, which mainly includes the Tianshan Mountains, the Bogda Mountains, the Altai Mountains. The third part is TPC, which mainly includes the Qilian Mountains, the Hexi Corridor and other parts of the northwestern Sichuan and most of the Qinghai−Tibet Plateau.
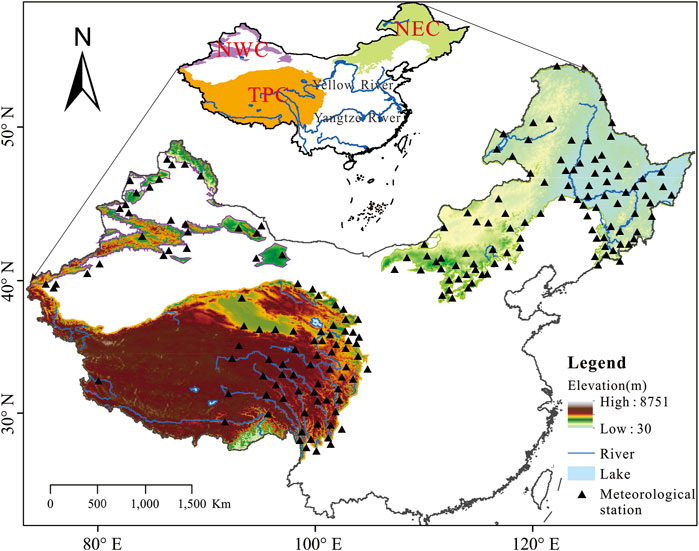
FIGURE 1. Study area and meteorological station locations. NEC: the cold region of Northeast China, NWC: the cold region of Northwest China, TPC: the cold region of the Qinghai−Tibet plateau.
2.1.2 Data sources and their quality control
Daily meteorological data of 192 national meteorological stations (Figure 1) from 1961 to 2018 were downloaded from the National Meteorological Administration of China (http://data.cma.cn). These datasets are available and have been processed with quality control. The criteria are as follows: stations with missing data of more than 30 days were removed, and stations with missing data of less than 30 days were interpolated with the most relevant adjacent stations. These meteorological data are used to calculate temperature extreme indices by the RClimDex 1.9 software package (http://etccdi.pacificclimate.org/software.shtml).
For atmospheric circulation indices, previous studies have confirmed that NAO, AMO, MEI, Arctic Oscillation, the summer and winter Western Pacific Subtropical High Intensity Index have also a significant impact on the temperature in China (Krishnamurthy and Krishnamurthy, 2015; Shi et al., 2018a; Ding et al., 2018c; Zhou Z. et al., 2020). In particular, Shi et al. (2018a) suggest that changes in temperature extremes have the significant correlation with AMO in most of China. Moreover, previous studies further pointed out that Arctic Oscillation and NAO appear to be internally close related (Cuo et al., 2013), which implicated as a predictor of Northern Hemisphere mean temperature multidecadal variability and significantly contributes to the extreme temperature variability in northeastern China, northern Xinjiang, the northern parts of northern China and eastern China (Li et al., 2013; Ding et al., 2018b). El Niño–Southern Oscillation is usually reflected by Southern Oscillation Index, MEI, and East Central Tropical Pacific sea surface temperature, which exert a similar and important influence on global climate change (Huang and Chen, 2014). These findings will provide useful information in exploring the relationship between temperature extremes and atmospheric circulation indices. Therefore, we selected NAO, AMO, and MEI. All selected atmospheric circulation indices, which have a month scale resolution, are publicly available for downloading from authorities and research centers. They are obtained through the Earth System Research Laboratory of the Physical Sciences Division of the United States National Oceanic and Atmospheric Administration (https://www.esrl.noaa.gov/psd/data/climateindices/list/).
2.2 Analytical methods
2.2.1 Temperature extreme calculations
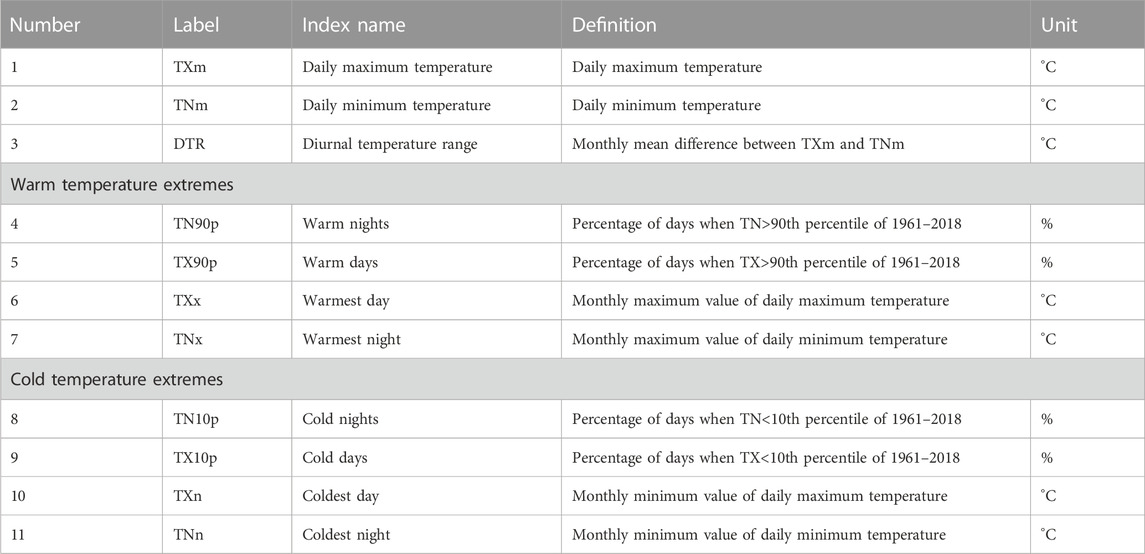
Before the indices were calculated, a quality control step (including a test for outliers and a time consistency test) was carried out using the RClimDex 1.9 software package (http://etccdi.pacificclimate.org/software.shtml) developed by Zhang and Yang, (2004). After the quality control step, 11 temperature indices (Table 1) were calculated for each year at each station using this software. The extreme indices used in this study are divided into three types (Ding et al., 2018c): the cold temperature extreme indices are the numbers of cold days and nights (TX10 and TN10), the lowest daily maximum and minimum temperatures (TXn and TNn); the warm temperature extreme indices are the numbers of warm days and nights (TX90p and TN90p), the highest daily maximum and minimum temperatures (TXx and TNx); and the third type is the daily maximum temperature (TXm), the daily maximum temperature (TNm), and the diurnal temperature range (DTR).
2.2.2 Trend calculations
The Mann–Kendall test is a nonparametric test for detecting trends in a time series (Mann, 1945; Kendall, 1975), and which is used to detect monotonic trends of temperature extreme index. In addition, Sen’s estimator of slope (Sen, 1968; Gilbert, 1987) was used to estimate the true slope of an existing trend in terms of the change per year, and it is usually used to together with the Mann–Kendall trend analysis method to determine the magnitudes of the trends (Ding et al., 2018c; Xi et al., 2018; Zhou Z. et al., 2020).
Furthermore, the regional averages of each temperature extreme indices were calculated as the arithmetic means of values at all of the selected stations. The seasons are defined as follows: December to the following February for winter; March to May for spring; June, July, and August for summer; and September to November for autumn.
2.2.3 Correlation analysis
The wavelet transform coherence (WTC), which combines wavelet transform with cross spectrum analysis, is a new signal analysis technology to effectively analyze the degree of linear relationship between two nonstationary series in time-frequency domain from multiple time scales (Torrence and Compo, 1998; Jevrejeva et al., 2003; Su et al., 2017; Asong et al., 2018; Jiang et al., 2019; Su et al., 2019). In this study, WTC is used to perform the correlation between temperature extremes and large-scale atmospheric circulation. Given two time series x and y, whose continuous wavelet transforms are Wnx and Wny respectively, thus the cross wavelet transform between x and y is expressed as:
WTC of two time series x and y is defined as:
where * denotes the complex conjugate. S is a smoothing operator, which represents time delay. Rn2 (s)takes a value between 0 and 1, where 0 indicates no correlation between two time series and 1 indicates that two time series are perfectly correlated with each other. A detailed mathematical background of WTC is given in Grinsted et al. (2004).
To identify the factors that influence temperature extremes, a Pearson’s correlation analysis was also performed between temperature extremes and the primary atmospheric circulation patterns in CRC (Zhong et al., 2017; Ding et al., 2018c). A detailed description of the calculation of Pearson’s correlation analysis is given in Zhong et al. (2017). In the present work, Pearson’s correlation and wavelet analysis are used to investigate the interaction and feedback characteristics of temperature extreme and large-scale ocean-atmosphere circulation patterns.
3 Results
3.1 Trend variability of TXm, TNm, and DTR in CRC
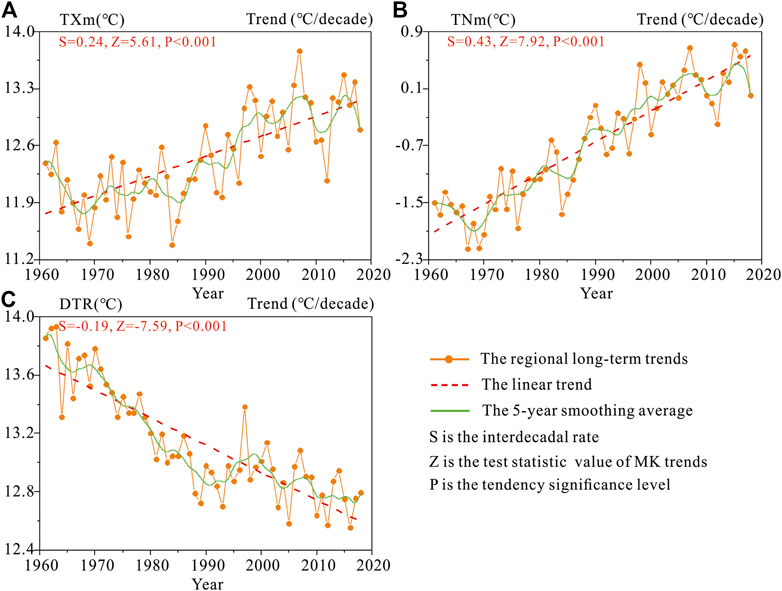
Figure 2 shows the average trends in TXm, TNm, and DTR across CRC. The subregional variations in TXm, TNm, and DTR are shown in Table 2. During the past 58 years, for TXm (Figure 2A), the annual mean warming rate was 0.24°C/decade. The subregions showed a large difference, as the highest warming trend occurred in TPC at a mean rate of 0.28°C/decade, followed by 0.22°C/decade in NEC and 0.21°C/decade in NWC. For TNm (Figure 2B), the annual mean warming rate was 0.43°C/decade, which is obviously higher than that of TXm. NWC had the largest warming trend (0.47°C/decade), followed by NEC (0.44°C/decade) and TPC (0.40°C/decade), respectively. In general, the trends of DTR should approximately be the difference between TXm and TNm due to the small difference in the trends of those two, as the annual mean decline rate was just −0.19°C/decade, and the subregional DTR trends showed the highest decline in NWC (−0.25°C/decade), followed by NEC (−0.22°C/decade) and TPC (−0.10°C/decade), respectively.
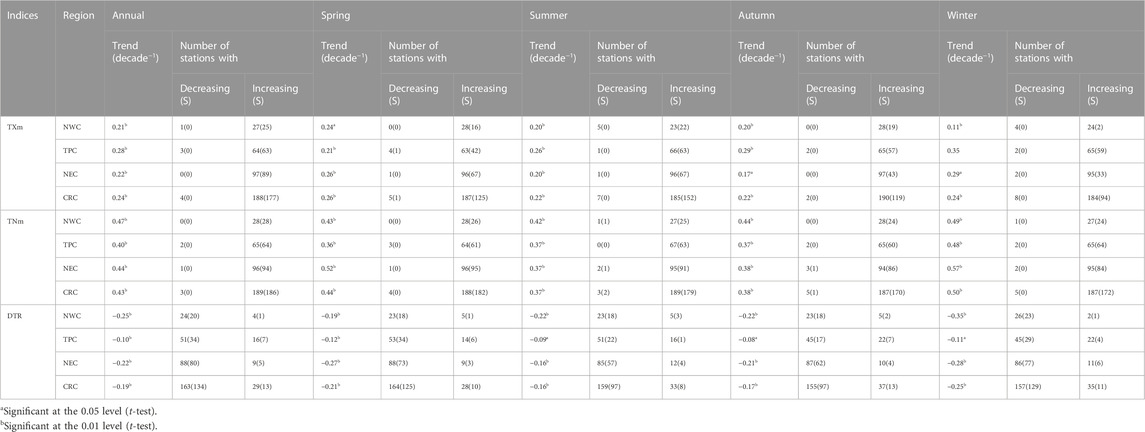
TABLE 2. Regional decadal changes in temperature extremes and the number of stations with statistically significant (S) trends in temperature indices.
In terms of the seasonal trends in TXm, TNm, and DTR from 1961 to 2018 (Table 2), the change trend of the same index was consistent, and the proportion of the significant sites was significantly different only in winter. TXm and TNm maintained a continuous growth trend, while DTR kept decreasing in each season. For TXm, spring had the largest warming trend, with a mean rate of 0.26°C/decade, followed by winter (0.24°C/decade). Compared with NWC and NEC, the annual mean, summer, autumn, and winter TXm warming rate in TPC were larger, and winter had the largest warming trend (0.24°C/decade). For TNm, the highest warming trend occurred in winter (0.50°C/decade), while autumn had the least warming rate (0.37°C/decade). By comparing the trend changes of NWC, TPC, and NEC in different seasons, we could infer that the change in the average temperature in CRC is likely affected by different driver factors. The seasonal DTR trends showed the highest decline in winter with a rate of −0.25°C/decade, but it showed the least decline trend in summer (−0.17°C/decade). In addition, the variation between TXm and TNm caused the seasonal mean DTR significant decline in NWC and pronounced the declines of −0.35, −0.22, −0.22, and −0.19°C/decade in winter, summer, autumn, and spring, respectively. The variation trends of DTR in different seasons in NWC, TPC, and NEC were similar and with relatively high variations in winter and spring, followed by autumn and summer.
Figure 3 shows the spatial distribution pattern of the trends in the time series of the annual means of TXm, TNm, and DTR during 1961–2018. The annual mean TXm clearly shows warming trends across CRC, except for the four stations located in the southwest of TPC (3) and NWC (1) (Figure 3A; Table 2), which show an insignificant cooling trend. One hundred and seventy-seven stations have significant warming trends at the 5% level, and most of the stations located in the central and western region have a larger warming trend than that of the other stations (Figure 3A). Meanwhile, the stations with a smaller warming trend are mainly located in the eastern part of NEC, including the insignificant eight stations at the 5% level. Similarly, the warming trends in the annual mean TNm were observed at almost all the locations across CRC (Figure 3B), and their warming rates are slightly greater than those at TXm. Most of the stations located in NWC show the most remarkable warming trend, while many stations located in NEC and TPC have a relatively weaker trend (Figure 3B). In particular, twenty-eight stations have significant warming trends at the 5% level (Figure 3B; Table 2). For the annual mean DTR (Figure 3C), it has a relatively complex spatial distribution of its variation trends. Although there are significant decreasing trends in most regions, one-sixth of the stations show an increasing trend, and thirteen stations show a significant increasing trend (Table 2). These stations are mainly located in the eastern junction of TPC and the central part of NEC (Figure 3C; Table 2).
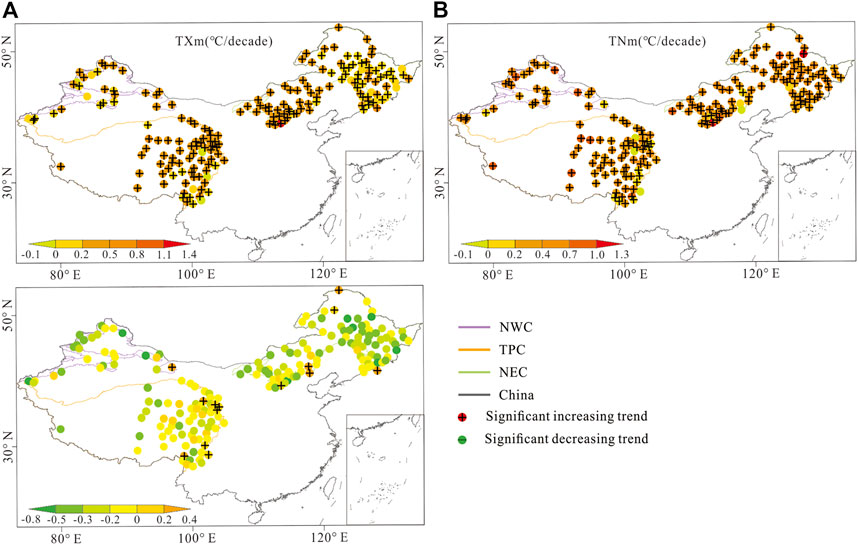
FIGURE 3. Trends of annual means of (A) TXm, (B) TXm, (C) DTR during 1961–2018. Plus sign represent a significant increasing trend at the 5% level, while subtraction sign represent a significant decreasing trend at the 5% level.
3.2 Trend variability of TN90p, TX90p, TXx, and TNx in CRC
All the warm temperature extreme indices that could be calculated based on annual time scales are displayed in Figure 4, and the subregional annual series for these indices are shown in Table 3. For the past 58 years, all the warm temperature extremes showed a warming trend at different degrees. The annual mean amounts of TN90p andTX90p showed increasing trends (1.90% and 1.17%/decade, respectively). The amount of the annual TXx and TNx showed increasing trends by 0.22°C and 0.34°C/decade, respectively, and all these four indices are significant trends at the 0.1% level (Figures 4A–D). The subregions showed a large difference. For TN90p and TX90p, the highest warming trend occurred in TPC at the mean rates of 2.11% and 1.46%/decade (p < 0.01), followed by 1.90% and 1.00%/decade (p < 0.01) in NWC, and 1.71% and 0.90%/decade (p < 0.01) in NEC, respectively. For the subregional TXx, TPC had the largest warming trend, with a mean rate of 0.33°C/decade (p < 0.01). The subregional TNx trends showed the highest increasing trend in NWC, with a rate of 0.36°C/decade (p < 0.01), followed by 0.35°C/decade (p < 0.01) in NEC. Also, TPC had the least decline trend [0.33°C/decade (p < 0.01)].
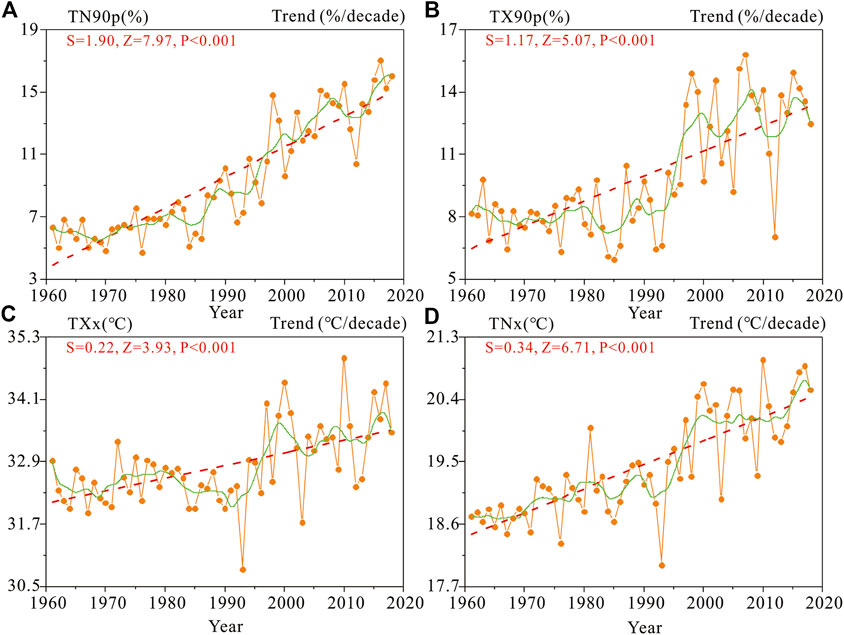
FIGURE 4. Same as in Figure 2 but for the temperature extreme indices of the warm indices (TN90p, TX90p, TXx, and TNx).
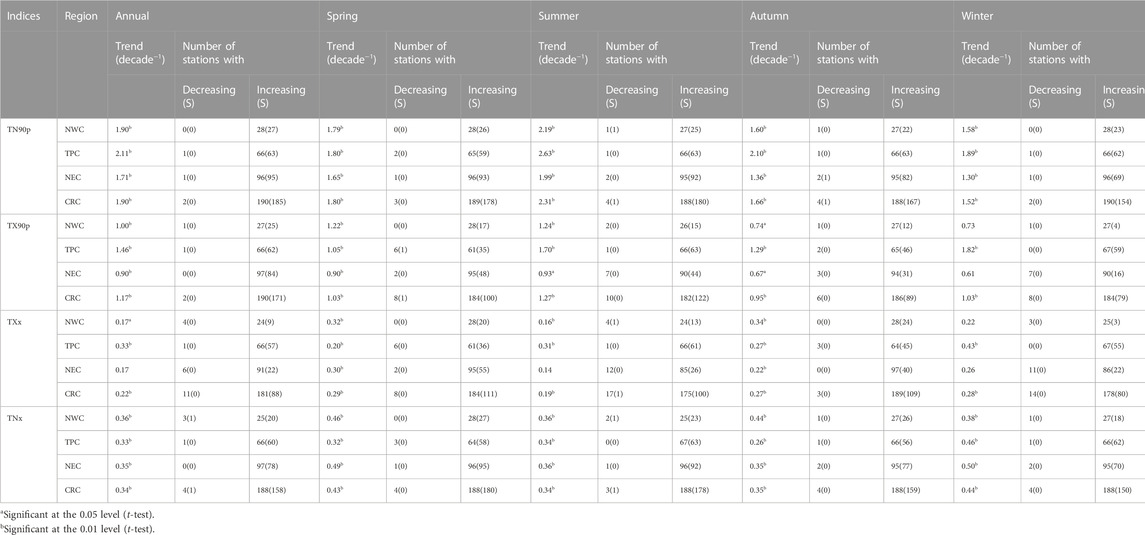
TABLE 3. Regional decadal changes in temperature extremes and the number of stations with statistically significant (S) trends in temperature indices.
In the seasonal scales (Table 3), during the past 58 years, all the extreme indices showed robust warming trends in all seasons in each subregion (the most significant stations in spring and the least significant stations in winter). TN90p showed a warming trend and showed the greatest warming rate (2.31%/decade) in summer. Similarly, the largest warming trend of TX90p was also in summer (1.27%/decade). However, for TX90p, the proportion of significant stations is much lower than that of TN90p, which is more obvious in NWC and NEC. For TXx, the most obvious increase trend was in spring (0.29°C/decade), and the smallest warming trend occurred in summer (0.19°C/decade). In addition, TNx showed the largest increasing trend in winter, with a warming rate of just 0.44°C/decade, and summer had the smallest warming trend (0.34°C/decade). TNx and TXx showed the most significant increase in summer and winter in TPC. Moreover, TXx had the most significant growth in spring and autumn in NWC and NEC, while TNx had the most significant increase in spring and summer. Speculatively, this may also be caused by large-scale atmospheric circulation patterns and anthropogenic aerosols.
In terms of the spatial variation of the annual mean trend (Figure 5; Table 3), most stations of the warm temperature extreme indices showed warming trends across CRC. TN90p clearly showed significant warming trends at 185 stations, and most of the stations located in TPC had a larger warming trend than that of the other stations (Figure 5A). Similarly, the most remarkable warming trends in TX90p were observed in TPC (Figure 5B), but its warming rates were slightly greater than those in TN90p. For TXx (Figure 5C; Table 3), there were significant increasing trends in most regions, and the sites with the most significant increases are located in TPC (Table 3). In addition, 11 sites showed a decreasing trend, and they are mainly located in the center of NWC and the western junction of NEC (Figure 5C; Table 3). The difference is that the increasing trend of TNx is particularly significant in the northern part of the study area (Figure 5D; Table 3). Based on the above differences, we speculated that the temperature extremes may be caused by the influence of atmospheric circulation factors.
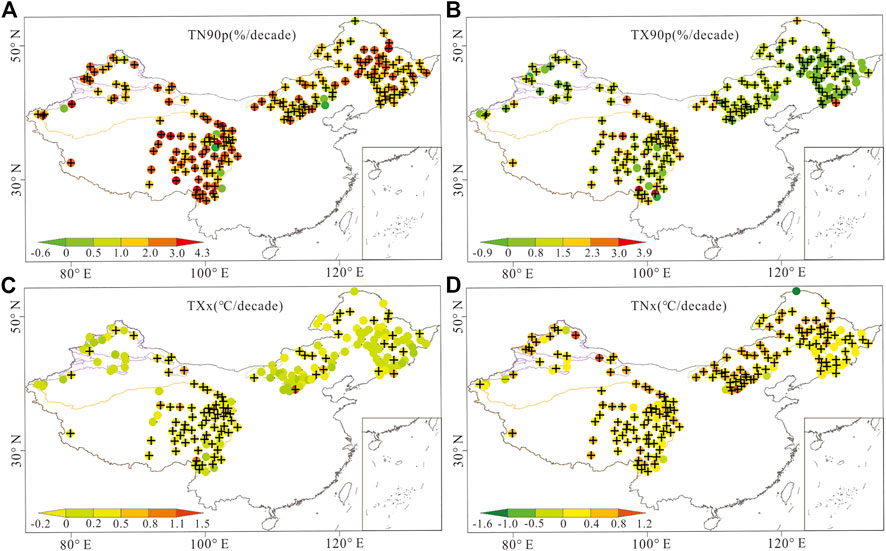
FIGURE 5. Same as in Figure 3 but for the temperature extreme indices of the warm indices (TN90p, TX90p, TNx, and TXx).
3.3 Trend variability of TN10, TX10, TXn, and TNn in CRC
Figure 6 shows all the cold temperature extreme indices that could be calculated on an annual time scale within the region, and Table 4 shows the subregional annual indices. For the past 58 years, the annual mean amounts of TN10p and TX10p showed decreasing trends (−2.52 and −1.02%/decade, respectively). However, the amounts of the annual TXn and TNn increased by 0.27°C and 0.55°C/decade, respectively, and all these four indices are significant trends at the 5% level (Figure 6A–D). The subregions showed a large difference. For TN10p and TX10p, the highest decreasing trend occurred in TPC at the mean rates of −2.77 and −1.23%/decade (p < 0.01), followed by −2.54 and −1.01%/decade (p < 0.01) in NEC and −2.36 and −0.81%/decade (p < 0.01) in NWC, respectively. Regarding the subregions of TXn, TPC had the largest warming trend, with a mean rate of 0.31°C/decade (p < 0.01). Moreover, the subregional TNn trends showed the highest increasing trend in NWC, with a rate of 0.56°C/decade (p < 0.01), followed by 0.51°C/decade (p < 0.01) in TPC. NEC had the least decline trend of 0.50°C/decade (p < 0.01). In general, the cold extreme indices showed an obvious warming trend from 1961 to 2018.
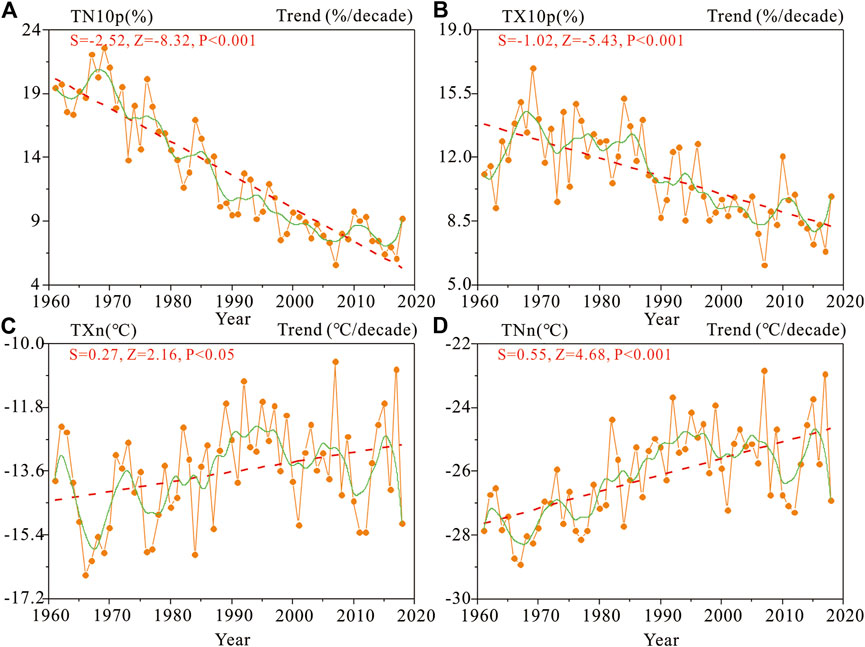
FIGURE 6. Same as in Figure 2 but for the temperature extreme indices of the cold indices (TN10p, TX10p, TNn, and TXn).
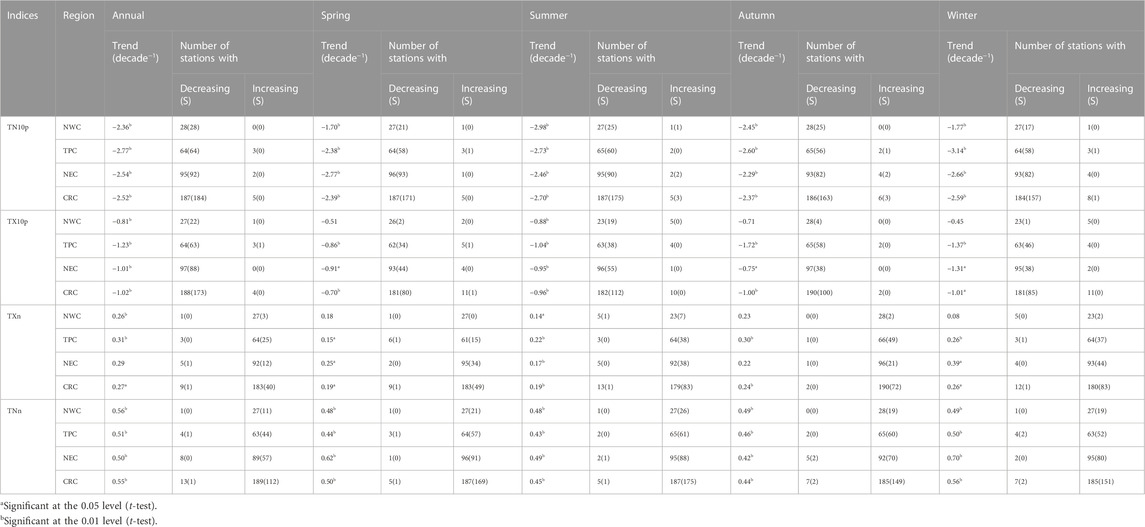
TABLE 4. Regional decadal changes in temperature extremes and the number of stations with statistically significant (S) trends in temperature indices.
In the seasonal scales (Table 4), TN10p showed a decreasing trend in each season. The proportion of the significantly stations is the most in summer and the least in winter. Also, most of the stations in the different subregions in each season had a decreasing trend. For TX10p, the change trend of the stations in each season are similar to that of TN10p, but the proportion of the significantly stations compared with TN10p is lower. For TXn and TNn, the change trend of most stations in each season was exactly opposite to that of TN10p and TX10p. At the same time, in each season, TNn had a higher proportion of the significant stations compared with TXn. Overall, the cold extreme indices showed an obvious warming trend in all seasons, and the change trend of the cold extreme indices varied greatly in different seasons, especially in summer and winter. We believe that this is inseparable from the impacts of global warming and atmospheric circulation.
Figure 7 shows the spatial distribution pattern of the annual average cold temperature extreme indices during 1961–2018. The annual average TN10p clarifies the warming trend of the entire CRC except for five stations that showed a cooling trend. However, the trends in the southwest of TPC (3) and NEC (2) were insignificant (Figure 7A; Table 4). The warming trend of 184 stations was obvious at the level of 1%. Most of the stations located in TPC had a larger warming trend than that of the other stations (Figure 7A), while the stations with a smaller warming trend were mainly located in NWC. Similarly, almost all the locations of the CRC had a warming trend in the annual mean TX10p (Figure 7B), which is slightly larger than the warming rate of TN10p. Most of the stations located in TPC showed the most obvious warming trend, while many of the stations located in NEC and TPC had relatively weak trends. For the annual average TXn (Figure 7C), an increasing trend was observed in most regions, but there were only a few sites with a significant increasing trend. These stations are mainly located in the eastern part of TPC (Figure 7C; Table 4), and even nine stations showed a downward trend (Table 4). For the annual average TNn (Figure 7D), a significant increasing trend was observed in most regions, especially in the stations in the western parts of the three subregions and the stations in the eastern parts of TPC and NEC.
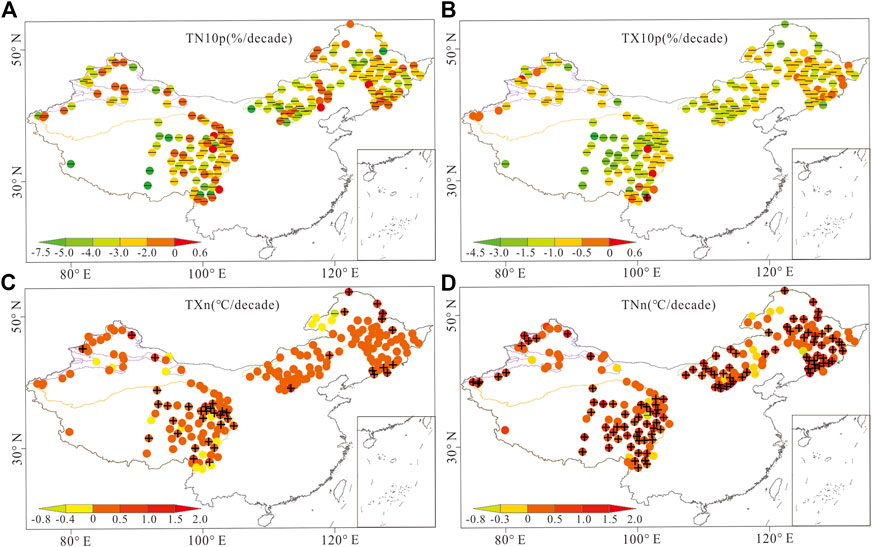
FIGURE 7. Same as in Figure 3 but for the temperature extreme indices of cold indices (TN10p, TX10p, TXn, and TNn).
3.4 Possible linkage between the large-scale circulation patterns and the changes in temperature extremes
WTC and Pearson’s correlation analysis were used to comprehensively examine the correlation results between the temperature extreme indices and the large-scale climate circulations (Figures 8–10, Supplementary Figures S1–S5). Some differences were found between the results of WTC and Pearson’s correlation coefficient analysis. One possible reason for this is that Pearson’s correlation coefficient analysis is linear, while WTC is nonlinear. Both indicated that the temperature extremes in CRC are controlled by different circulation patterns. To simplify and limit the length of this paper, only the WTC results for the large-scale climate indices with the strongest correlations with the temperature extreme indices by Pearson’s correlation coefficient analysis were exhibited. The other results are included in the Supplementary Material.
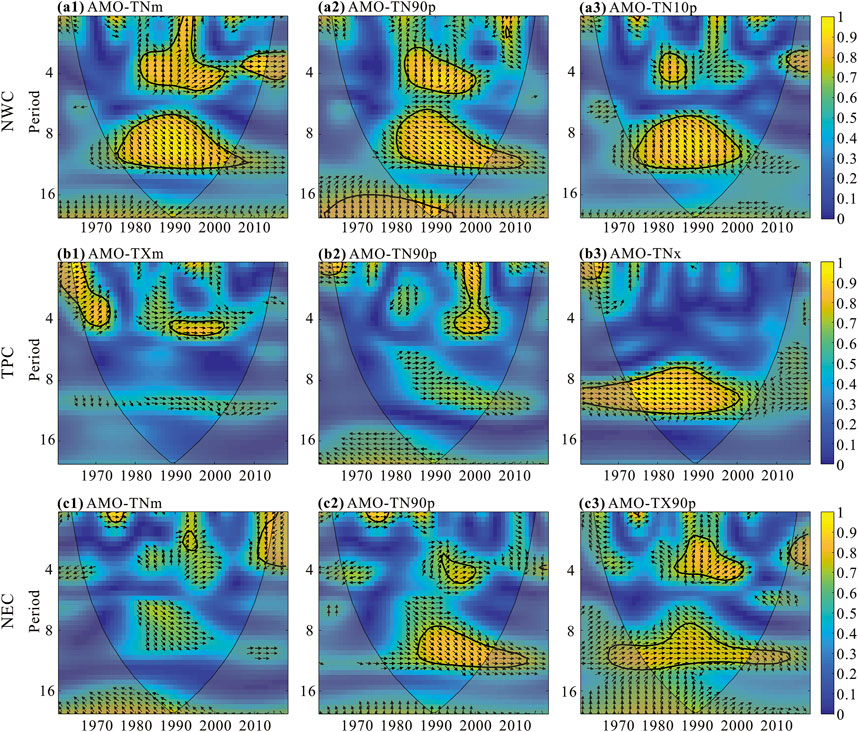
FIGURE 8. Wavelet transform coherence for AMO and the temperature extremes (The color is closer to yellow, and the relationship is stronger; The color is closer to blue, and the relationship is weaker; The thin black line is the boundary of the cone of influence (COI), which is the effective spectral value area; The thick black line is the 95% confidence interval of the significance level α=0.05; The arrow indicates a phase difference; → indicates that the change phases of the two time series are consistent, and ← indicates that the change phases of the two time series are opposite, that is, the in-phase (positive) points to right, and antiphase (negative) points to left.).
Figure 8 and Supplementary Figure S3 show the WTC results for AMO and the time series of the temperature extreme indices. For NWC, AMO had a significant in-phase relationship (positive) with TXm, TX90p, and TX10p, which primarily concentrated in the 6–10-year band from 1961 to 2018 and in the 16-year band but outside the cone of influence (COI) over the past 58 years [Supplementary Figure S3(a1, a3, a6)]. In theory (Jevrejeva et al., 2003), the wavelet power outside the COI did not pass the Monte Carlo test, indicating that these coherences may not be reliable (Grinsted et al., 2004). Nevertheless, the significant regions in the large-scale circulation patterns are so extensive and consistent that it is unlikely to be an accident (Grinsted et al., 2004), which possibly indicates a ∼16-year periodicity since the 1960s in the phase relationship between TXm, TX90p and TX10p, and AMO. This can be confirmed by existing research results indicating a close correlation between AMO and East Asian temperature on an interdecadal scale (Sun et al., 2012; Li Q. et al., 2015). In addition, a strong coherence between AMO and TNm, TN90p, and TN10p occurred at the 6–10-year scale spanning (1970s–2010s) and the 3–5-year scale spanning (1980s–2000s) [Figure 8(a1–a3)]. Furthermore, sporadic apparent coherences between AMO and the other temperature extreme indices were observed, primarily distributed in the 1–9-year bands and spanning 1970s–2000s [Supplementary Figure S3(a2, a4–a5, a7–a8)].
For TPC, a dominant high-energy in-phase coherence between TNx, TNn, and AMO occurred at the 8–10-year scale spanning (1960s–2000s) [Figure 8(b3), S3 (b8)]. In the other frequency bands, the resonance energies of TNx, TNn, and AMO were weak, and only the scattered areas passed the significance test. For the other temperature extreme indices, a sporadically significant coherence with a scattered distribution on the 1–10-year bands could be observed from the 1960s to the 2010s [Figure 8(b1–b2), S3(b1–b7)].
For NEC, a sporadically significant coherence with a scattered distribution on the 1–6-year periodic scales could be observed from the 1980s to the 2010s [Figure 8(c1), S3(c1–c2)]. A significant positive correlation between AMO and the warm extreme indices was found, ranging between 1 and 8 years and primarily concentrated in the period from the 1970s to the 2000s, and it occurred at the 8–10-year scale spanning (1970s–2010s) and the 3–5-year scale spanning (1980s–2000s) [Figure 8(c2–c3), S3(c3–c4)]. In addition, a sporadically significant coherence with a scattered distribution on the other periodic scales could be observed from the 1970s to the 2010s. The WTCs between the AMO and the cold extreme indices significantly differed from the warm extreme indices. A significant relationship between AMO and the cold extreme indices could be observed at the 16-year scale from the 1960s to the 2010s [Supplementary Figure S3(c5–c8)].
We believe that the main mechanism by which AMO affects extreme temperatures in CRC is the abnormal warming of the Atlantic Ocean surface temperature, which heats the upper and middle troposphere of the Northern Hemisphere, thereby warming the Eurasian continent, strengthening the thermal differences between land and sea, and ultimately affecting the monsoon. Previous studies have also suggested (Li S. L. et al., 2015; Hao and He, 2017; Zhang Q. et al., 2020) that the warm (positive) phase of AMO will cause warming in most parts of East Asia, leading to weakened winter monsoons and overall higher winter temperatures. This relationship also exists throughout the year; However, it is not yet clear how Atlantic sea surface temperature affects the upper and middle troposphere, and further in-depth analysis is needed.
The relationships between the time series of the temperature extreme indices and NAO are shown in Figure 9 and S4. For NWC, sporadic significant coherence patterns the NAO and TXm, and TNm was primarily observed with a scattered distribution between 1 and 9 years over the period from the 1960s to the 2010s [Supplementary Figure S4(a1–a2)]. In the case of NAO–DTR, discontinuous significant in-phase coherence patterns were detected in the 10–16-year bands from 1961 to 2017 [Figure 9(a1)]. Furthermore, sporadic apparent coherences between NAO and the warm and cold temperature extreme indices were observed, primarily distributed in the 1–9-year bands and spanning (1960s–2000s) [Figure 9(a2–a3), Supplementary Figure S2(a3–a8)].
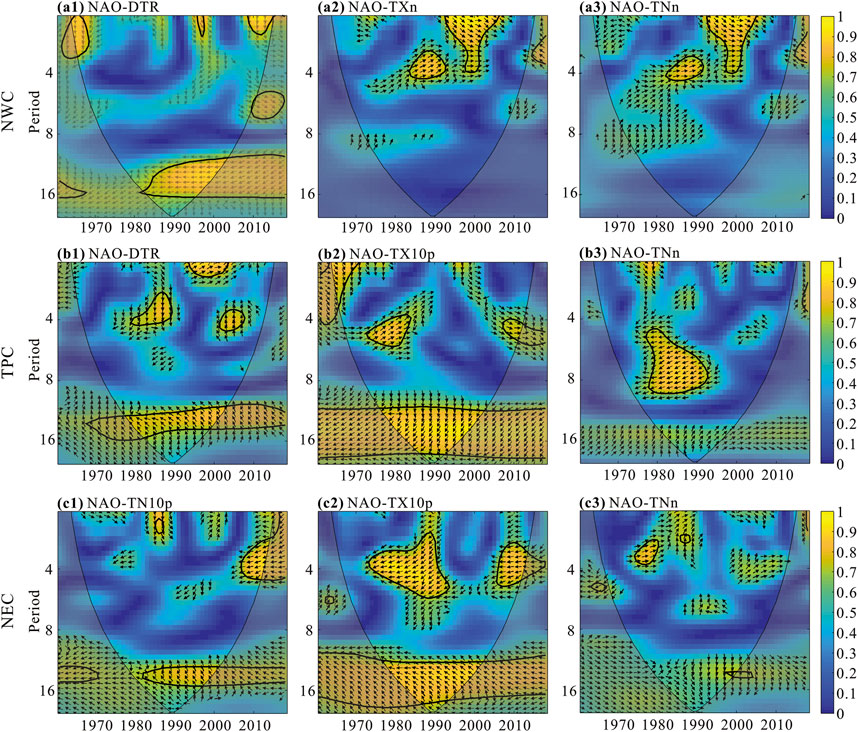
FIGURE 9. Same as in Figure 8 but for NAO and the temperature extremes.
For TPC, a dominant and strong antiphase coherence occurred between 12 and 16 years from the late 1960s to the early 1990s [Figure 9(b1)]. TXm showed a strong in-phase relationship with NAO over the 12–16-year scale over the period of 1961–2017 [Supplementary Figure S4(b1)]. In addition, a sporadically significant coherence with a scattered distribution on the 6–10-year scale could be observed from the 1970s to the 2000s for NAO–TXm and NAO–TNm. For the warm temperature extreme indices [Supplementary Figure S4(b3–b6)], a significant coherence also existed from 1961 to 2017, and scattered 1–16-year periodicities occurred. For the cold temperature extreme indices within the COI zone, primarily scattered 1–8-year periodicities occurred in the period from the 1970s to the 2000s [Figure 9(b2–b3), Supplementary Figure S2(b7–b8)]. Moreover, TX10p significantly covaried with NAO during the study period, suggesting that this relationship may be robust [Figure 9(b2)].
For NEC, relationships between TXm, TNm, and NAO were found from 1961 to 2018, where a significant coherence was primarily concentrated in the 1–5-year and 12–16-year bands, respectively [Supplementary Figure S4(c1–c2)]. Moreover, the significant coherence between DTR and NAO was scarce, and it was only distributed in the 1–5-year band and spanning (1961–1990) [Supplementary Figure S4(c3)]. In addition, it was clear that NAO had a sporadically significant coherence with the warm temperature extreme indices with a scattered distribution on the 1–5-year band from the 1960s to the 1990s [Supplementary Figure S4(c3–c7)]. For the cold temperature extreme indices, a strong negative relationship between TN10p, TX10p, and NAO was observed, primarily distributed in the 12–16-year band and spanning (1961–2017), while a scattered distribution was noticed at a significant negative coherence, ranging between 2 and 6 years and primarily concentrated over the periods of 1970–1990 and 2003–2018 [Figure 9(c1–c2)]. The other cold temperature extreme indices had weak relationships with NAO [Figure 9(c3), S4(c8)].
Figure 10 and Supplementary Figure S5 show the WTC results for the temperature extreme indices and MEI. For NWC, MEI was sporadic, but it in-phase covaried with TXm during the period of 1967–2010 at the 6–10-year band and during the period of 1961–2018 at the 14–16-year band [Supplementary Figure S5(a1)]. TNm also has a similar relationship with TXm but in the 6–10-year band [Supplementary Figure S5(a2)]. Additionally, DTR and MEI mainly have a significant relationship in the 5–7-year and 9–11-year bands and spanning (1987–2018). However, the 9–11-year scale lagged the 5–7-year scale by 135° [Figure 10(a1)]. For the warm temperature extreme indices [Figures S5(a3–a6)], TN90p, TX90p, and TXx have a scattered high power ranging from 1 to 16 years with variable phase angles from 0° to 90°, intermittently during the 1961–2018 period, showing variable phases and periodicity patterns over that time. Therefore, we concluded that for the warm extreme indices, WTC and MEI show strong decadal periodicities. The WTCs between MEI and the cold extreme indices significantly vary from the warm extreme indices [Figure 10(a2–a3), S5(a7–a8)]. Within the COI zone, scattered interannual periodicities occurred from the 1960s–2010s, both in TX10p and TXn, which phase angle are also opposite to the warm indices, showing the antiphase relationship of these indices and MEI. Furthermore, for TX10p, there is a 16-year band of wavelet coherence from 1961 to 2018. For TN10p, a significant high-power region was slightly observed throughout the study period.
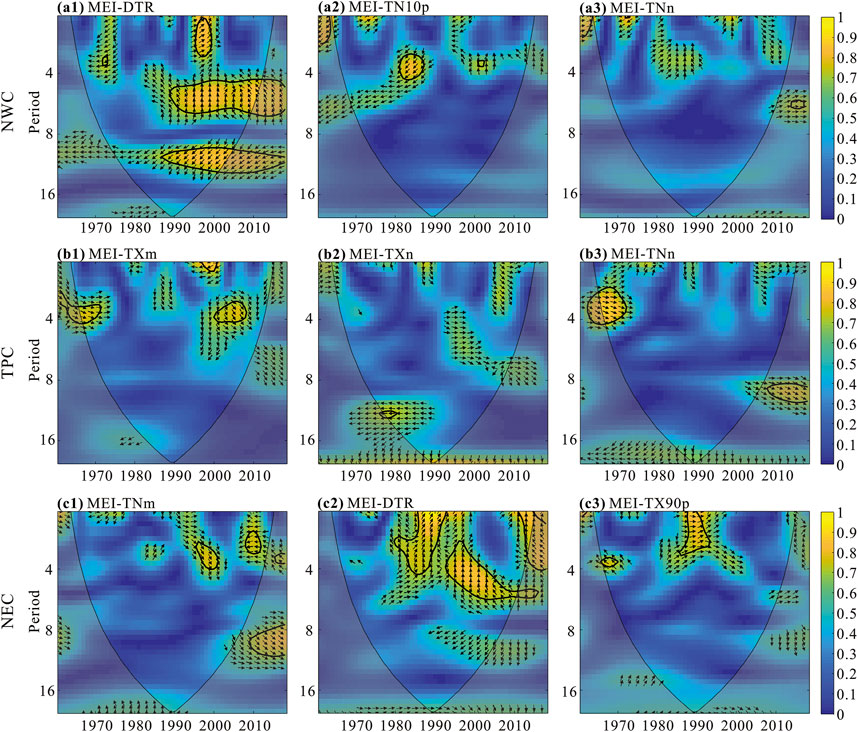
FIGURE 10. Same as in Figure 8 but for MEI and the temperature extremes.
For TPC, the WTCs between MEI and the temperature extreme indices are shown in Figure 10(b1–b3), Supplementary Figure S5(b1–b8). For TXm, a lower wavelet power was observed for all the scales throughout the study period (Figure 10b1). TNm had scattered interannual periodicities from the 1990s to the 2000s [Supplementary Figure S55(b1)]. DTR had significant high power in the 13–16-years periodicities oscillation band from 1961 to 2000, where the phase angle in this zone was 315°, showing the positive influence of MEI on the DTR variability during these years [Supplementary Figure S5(b2)]. For TN90p and TX90p, there was a remarkable interannual oscillation in the 1–5-year band from the 1980s to the 2000s with a rather stable phase behavior (by approximately 0°) and with a rather low coherency outside of this period [Supplementary Figure S5(b3–b4)]. It is noteworthy that no regions showed significant wavelet coherence within COI in TXx [Supplementary Figure S5(b5)]. Unlike the other warming indices, MEI and TNx showed high coherency in the 7–11-year bands from 1961 to 2000 with a rather stable phase behavior by approximately 0° [Supplementary Figure S5(b6)]. For the cold extreme indices over the past 58 years, there were low power regions within COI, except for a few significant high coherences with TN10p and TX10p in different scales [Supplementary Figure S5(b7–b8), Figure 10(b2–b3)].
For NEC, The WTCs between MEI and the temperature extreme indices are shown in Figure 10(c1–c3), Supplementary Figure S5(c1–c8). For TXm, a lower wavelet power was observed for all the scales throughout the study period except for the 0–4-year band (high power) from the 1980s to the 2010s at the significant 5% level [Supplementary Figure S5(c1)]. However, TNm was scattered in the 1–4-year band from the 1990s to the 2000s, and it had complicated and varying phase angles [Figure 10(c1)]. DTR had a significant discontinuation power at the 5% level in the 0–6-year periodicities oscillation band from 1980 to 2018, where the phase angle in this zone was complicated [Figure 10(c2)]. In terms of the warming indices, for TN90p, a remarkable interannual oscillation with the 8–12-year band occurred from the 1980s to the 2010s and with a rather low coherency outside of this period [Supplementary Figure S5(c2)]. Noteworthy, a few regions showed a significant wavelet coherence within COI in TX90p [Figure 10(c3)]. For TXx, there was a significant high coherency in the 4–16-year band from 1961 to 1990 with an in-phase behavior [Supplementary Figure S5(c3)]. In addition, MEI and TNx showed high coherency in the 8–12-year bands from 1977 to 2010 [Supplementary Figure S5(c4)]. For the cold extreme indices, there were significant high power regions within COI in different scales. For TN10p and TX10p, scattered and weak periodicities in the 1–3-year band with a complicated phase relationship were observed from 1970 to 1990 and from 2005 to 2018 [Supplementary Figure S5(c5–c6)]. For TXn and TNn, there were high negative coherence regions in the interannual and decadal scales, especially in the decadal scale periodicities, with a 16-year band from 1961 to 2018 [Supplementary Figure S5(c7–c8)].
4 Discussion
4.1 Variation characteristics of the temperature extremes and their regional differences
4.1.1 Temporal variation characteristics of the temperature extremes
In previous studies, the used methods, data types, and study periods in the temperature extremes were slightly different. Thus, only the change trends of temperature extreme were discussed. A significant warming trend of the temperature extreme indices was observed in CRC from 1961 to 2018; the warming magnitudes of the cold temperature indices (TN10p, TNx, TNx) were much greater than those of the warm temperature indices (TN90p, TXx, TNx). From the perspective of seasonal change trends, the warming magnitudes of the cold temperature indices (TX10p, TXn, TNn) in winter were obviously higher than those in summer. The physical mechanism of this change is that the water vapor content in air in winter is less than that in summer. Thus, the radiative forcing effect of greenhouse gases is enhanced in winter, resulting in a greater increase in temperature in winter than in summer (Aguilar et al., 2009). Additionally, the magnitude of the changes of the night temperature extreme indices (TN90p, TN10p) is obviously greater than that of the daily temperature indices (TX90p, TX10p), which is consistent with the results of previous studies (Peterson et al., 2002; Choi et al., 2009; Wang et al., 2013), and reflects that the frequency and intensity of the events of “warm winter” have had a tendency to increase in the past 58 years. This phenomenon has led to the shrinkage of glaciers and to the accelerated melting of snow and frozen soil in CRC, and reduced the amount of melting snow in summer and autumn to a certain extent, which is not conducive to the rational use of water resources by the agricultural industry. Also, this has negatively affected regional agricultural, industries and animal husbandry production (Ding et al., 2018b; Zhou Z. et al., 2020). Moreover, based on a comparative analysis of the magnitude of changes in TNm and TXm, it was found that the former was much higher than the latter in spring, summer, autumn, and winter. Especially, the difference was significant in winter, and the warming magnitude of TNm was 2.1 times larger than that of TXm. To sum up, the changes in the warm and cold temperature indices are asymmetrical, for example, the magnitude of the changes in the annual mean minimum temperatures is obviously greater than that in the annual mean maximum temperatures, and the magnitude of changes of the cold extremes is obviously greater than that in the warm indices. The rangeability of night indices are larger than those of daily indices. This result is consistent with the mean warming trend of China, the Northern Hemisphere, and the globe (Seneviratne et al., 2014; Shen et al., 2018; Du et al., 2019; Zhou Z. et al., 2020; Ding et al., 2021; IPCC, 2021), which reflects the overall warming trend of climatic systems and complex warming patterns.
4.1.2 Regional differences in temperature extreme
On an annual scale, further analysis has revealed that the warming trend of all the temperature extreme indices in CRC is basically consistent with that of the world and China in a national scale in previous studies (Ding J. et al., 2018; Ding et al., 2018c; Wang et al., 2019). However, there still were some differences (Shi et al., 2018a; Shen et al., 2018). Among them, the warming trends in the cold extreme indices were most significant. For example, the national average warming trends of TN10p and TX10p were 1.87% and 0.67%/decade, respectively (1961–2015) (Shi et al., 2018a), while those of CRC reached 2.52% and 1.02%/decade in this study (trends from 1961 to 2018). Nevertheless, for TNn and TXn, the increase rates of 0.55°C and 0.27°C/decade in CRC were significantly lower than those in China (0.63°C and 0.35°C/decade) and the world (0.71°C and 0.37°C/decade) (Alexander et al., 2006; You et al., 2010). The national average warming trends of TXx and TNx were 0.22°C and 0.34°C/decade in CRC, respectively, and they were significantly higher than those of China (0.07°C and 0.21°C/decade) (You et al., 2010) and the world (0.21°C and 0.30°C/decade) (Alexander et al., 2006). Similar to TN90p and TX90p, the warming trends of CRC were 1.90% and 1.17%/decade, respectively, which were higher than those of China (1.84% and 1.15%/decade) computed by Shi et al., 2018a. In addition, the warming trends of TXm and TNm were 0.24°C and 0.43°C/decade in CRC, respectively, which were significantly higher than those of China [0.20°C and 0.37°C/decade (1961–2012)] (Li Q. et al., 2015). DTR significantly decreased at −0.19°C/decade in CRC. However, it was −0.18°C/decade in China in a national scale (You et al., 2010; Li S. L. et al., 2015) and was −0.08°C/decade in the world. (Alexander et al., 2006). In summary, the warming magnitudes of most temperature extreme indices have vitally larger changes than those of global and China, it indicates that CRC is a more sensitive area to climate change, which is also consistent with the results of previous studies (Shen et al., 2018).
For NWC, TPC, and NEC, the warming magnitudes of the temperature extreme indices showed significant regional differences. TXm, TN90p, TX90p, TXx, TN10p, TX10p, and TXn had the largest changes in TPC, while NEC and NWC had relatively small changes. As for TNm, DTR, TNx, and TNn, their changing trend was similar, but these indices had the largest variation in NWC and the smallest variation in TPC. The main reason for these differences may be the diversity of the main influencing factors of the regions. Large scale climate change is the main cause of the increase in extreme temperature events in CRC, such as MEI, NAO, AMO, and ENSO, which are important factors affecting extreme temperature events in China. For example, Wang J. et al. (2017) pointed out that the ElNiño event caused a low daily average temperature in Northeast China during winter, resulting in an increase in the frequency of extreme low temperature events, while the LaNiña event had a weaker impact on extreme low temperatures; At the same time, human activities, especially high-intensity and large-scale urbanization, have also played an important role; In addition, latitude, longitude, and altitude also profoundly affect the spatiotemporal differentiation pattern of extreme temperatures. In this study, the extreme temperature changes of TPC and NWC are closely related to large-scale climate change, topography, and altitude. For example, plateau and mountainous areas such as the Qinghai Tibet Plateau affect the extreme climate in eastern China in terms of heat and power, resulting in significant differences in extreme temperature changes between TPC, NWC, and NEC. In addition, the degree of urbanization in NEC also has a certain impact on extreme temperature, increased the difference in extreme temperature changes between NEC and other cold regions. Overall, CRC warming is consistent with previous research results (Kong, 2020; Yan et al., 2020), and more importantly, the results of this study indicate that the magnitude of extreme temperature changes in CRC is more significant than in other regions, and the dominant factor causing differences in extreme temperature changes is large-scale climate change.
Moreover, previous studies have also shown that the magnitude of the temperature extreme indices is affected by climate change (You et al., 2013; Ding et al., 2018b; Yang et al., 2019), anthropogenic aerosol (Mascioli et al., 2016; Samset et al., 2018; Wei and Buwen, 2019), and urbanization (Sun et al., 2019; Tysa et al., 2019; Zhang Q. et al., 2020; Qian et al., 2022). China is located at the eastern end of the Eurasian continent, where the interannual variability of temperature is large, mainly controlled by the strength and weakness of the winter monsoon from the upstream North Asian continent. It can be explained by climate change dynamics theories such as “Arctic warm-continental cold” (Cohen, et al., 2014; Yan et al., 2020), that is, the warming of the Arctic often corresponds to an increase in the meridional direction of the circumpolar westerly circulation, which means that the Arctic Oscillation (AO) is weak, making it easier for polar cold air activities to spread to some continental regions, causing these areas to be slightly cold. In particular, the continuous enhancement of human activities in recent decades has led to a soar in anthropogenic aerosol, which has been confirmed by numerous studies (Sun et al., 2019; Wang et al., 2019; IPCC, 2021). Temperature extremes are highly sensitive to anthropogenic aerosol (Samset et al., 2018), whose increase causes induced atmosphere cloud feedback, which will trigger a continuous increase in the hot extreme climate events (Mascioli et al., 2016; Samset et al., 2018; Chen and Dong, 2019). However, aerosol forcing did not well explain that the cold temperature extreme indices in winter and summer have shown patterns of slowing warming and even weak cooling in NEC, the arid area of NWC, NEC, and entire China since the 1960s (Li S. L. et al., 2015; Wang et al., 2019; Zhou Z. et al., 2020). In addition, the urbanization effect may be obvious in the changes of some extreme temperature indicators. Previous research shows that urbanization has contributed to the increase of regional extreme high temperature events (Sun Y. et al., 2016), and there is positive feedback between urban heat island and heat wave weather (Wang Z. Q. et al., 2017); On the other hand, with the increase of regional aerosol pollution in the process of urbanization, it has a certain cooling effect on temperature, while heatwave weather often favors aerosol dissipation and has negative feedback. In this study, human activities, such as urbanization, are more frequent in NEC (Zhou Z. et al., 2020), but from the spatial distribution of temperature extreme indices (Figures 3, 5, 7; Table 2, 3, 4), the warming trend of temperature extreme changes has not been great. Previous studies have also shown that the physical mechanism of aerosols on climate warming still has great uncertainties (Yang et al., 2016; IPCC, 2021), and our analysis of the CRC observations also verified this view. Therefore, the contribution of urbanization and aerosols to temperature warming trends is uncertain in observation and mechanism analysis, but it can be confirmed that they are not the dominant contributing factor (Jones et al., 2008; Yan et al., 2020).
4.2 Large-scale circulation factors affecting temperature extremes
The natural variability of the Earth’s climate system has an undeniable impact on climate warming, which is mainly manifested in the interannual and interdecadal changes of the large-scale ocean–atmosphere coupled mode (Deser et al., 2012; Huber and Knutti, 2014; IPCC, 2021). Previous researches have shown that large-scale atmosphere circulation patterns are likely among the most potential contributors to the changes in climate extremes (Shi et al., 2018a; Li et al., 2019; Ding et al., 2021; Ye and Qian, 2021). The temperature extremes in CRC have statistical relationships with ENSO, NAO, and AMO. In general, cross-wavelet analyses have shown that the influence of the large-scale atmosphere circulation patterns on climate extremes varies not only based on the temporal scale but also on the spatial scale. In fact, the correlations between climate extremes and large-scale atmospheric circulation patterns are even more complicated than the results shown in this study.
ENSO is one of the strongest ocean–atmosphere coupling signals on Earth, and its strength has a significant impact on climate in most parts of the world (Cai et al., 2015). MEI is an important index with regard to characterizing the strength of ENSO, which is considered an important large-scale atmosphere circulation pattern with regard to climate change in the Northern Hemisphere, especially for the regions in or around the Pacific Ocean (Rogers and Coleman, 2003; Jin et al., 2016; Thirumalai et al., 2017). Previous studies have pointed out that MEI is closely related to the temperature extremes at different regional scales around the world (Cai et al., 2015; Fasullo et al., 2018). From a previous analysis, it could be clearly seen that although the relationship between MEI and different temperature extreme indices is different in CRC, almost all the temperature extreme indices have obvious 2–4-year periodic oscillations with MEI. Furthermore, we calculated the WTCs between MEI and the temperature extremes in different spatial scales (Supplementary Figure S5). The results showed that since the 1990s, most of the temperature extreme indices have had interannual and decadal high-energy spectra of 2–13-year in the three regions. In particular, the cold temperature extreme indices have shown a high coherence with the in-phase relationship in the 7–13-year bands since the late 1990s, and TXn has reached a significant level of 5%. These results have also shown once again that the whole CRC is affected by ENSO. It is worth noting that there are still certain differences in the degree and mode of response to ENSO in different regions. The reason may be that different CRC regions are located in different geographical locations and have different sensitivities to ENSO (Shi et al., 2018a). Also, besides ENSO, CRC are also affected by other oceanic and atmospheric circulation patterns.
The Atlantic Meridional Overturning Circulation (AMOC), as an important ocean–atmosphere interaction mode in the North Atlantic region, plays an important role in the transmission of global ocean heat from the low latitudes to high latitudes in the North Atlantic (Chen and Tung, 2014; England et al., 2014). As a vital characterization of AMOC, AMO represents the strength change of AMOC (Wang and Zhang, 2013). Previous studies have revealed that AMO has significant influences on global climate and regional climate. For example, East Asia is a critial region due to its influence (Lu et al., 2006). Also, a recent study based on both observations and numerical simulations has shown that in recent decades the temperature extreme events in most of northern China are closely related to the transition from the negative phase to the positive phase of AMO and that they dominate the frequency and intensity of heat extreme events (Zhang G. et al., 2020). The WTC results in Figure 8, Supplementary Figure S3 demonstrate that AMO has a strong in-phase relationship with TXm, TNm, and DTR and with the warm indices in the interannual and decadal oscillation cycles. In terms of cold temperature extreme indices, AMO has shown strong interannual and interdecadal antiphase periodic oscillations with TN10p from 1994 to 2005 and with TX10p from the 1980s to the 2000s. However, the wave spectrum of interannual cycles is low and extremely scattered with the other two cold temperature extreme indices, indicating that AMO has a strong antiphase relationship with some indices. In other words, in addition to ENSO, AMO also has a certain impact on the temperature extreme warming in CRC, which is consistent with the research results of other scholars (Jaccard and Galbraith, 2012; McGregor et al., 2014).
In addition, as for to the large-scale ocean–atmosphere modes, such as AMO and ENSO, which affect temperature extremes through teleconnection in China, the atmospheric oscillation impact on climate cannot be ignored (You et al., 2013; Wang et al., 2019; Wu et al., 2019). Studies have shown that NAO has a significant impact on China’s climate, especially on the temperature extremes (Liu et al., 2019; Tong et al., 2019; Li et al., 2022). NAO is a seesaw phenomenon in the Northern Hemisphere, and it is the change in the pressure difference between Icelandic low pressure and Azores high pressure (Wanner et al., 2001). When NAO is in the negative phase, it is easy to generate a strong north wind anomaly in the lower troposphere; cold air is transferred from the high latitude to the low latitude, resulting in a temperature drop in the middle latitude, and vice versa (Visbeck et al., 2001). Therefore, when NAO is in the positive phase, the temperature theoretically increases in most regions of China. On the contrary, the temperature drops when NAO is in its negative phase. However, some studies have shown that the impact of NAO on temperature in the Northern Hemisphere is mainly reflected in winter (Wang et al., 2005), and this feature is particularly obvious in China (Liu et al., 2019). According to the analysis results of Supplementary Figure S2, it can be clearly seen that almost all the temperature extreme indices in the whole CRC show that the correlation in winter is significantly higher than that in other seasons. Also, the correlation between NAO and cold temperature extreme indices is particularly obvious in winter, and some indices have reached the significance level of 5%. The main reason is that China is located at the downstream of the circulation system associated with NAO, and the negative phase of NAO can lower the temperature in most parts of China in winter by influencing the Siberian high pressure and Asian winter monsoon, which causes an increase in the frequency of low-temperature extremes (Wu et al., 2009). These characteristics indicate that the influence of NAO on the temperature extreme of CRC may be mainly manifested in winter, while its influence in the other seasons is minimal. In addition to the influence of large-scale circulation patterns, such as ENSO, NAO, and AMO, global warming, anthropocene activities, land cover, land reclamation, urbanization, and other human activities can also give rise to changes in climate extremes. Thus, a fully comprehensive assessment of the influence of the climatic and nonclimatic factors in this region would require further research.
5 Conclusion
In this study, we calculated and divided the distribution of CRC and presented spatial and temporal variations in temperature extremes and their associations with atmospheric and oceanic circulation patterns from 1961 to 2018. We found that DTR, TN10p, and TX10p dramatically decreased, while the other temperature extremes increased obviously. Also, the trend magnitudes in cold nights and warm nights were found to be greater than those in cold days and warm days. Moreover, decreases in cold nights and cold days and increases in warm nights and warm days appeared in almost all of CRC. In the seasonal scales, more than half the temperature indices displayed the largest trend magnitudes in winter, while the warming trends in spring and summer were relatively low. Additionally, the variation trends in most of the cold extremes were significantly higher than those in the warm extremes. Spatially, for most of the temperature extremes, the stations located in TPC and NWC showed larger warming trends than those in NEC.
Through further analyses, it was found that the variations of TXm, TX90p, and TX10p, which are related to AMO, were greater than those of TNm, TN90p, and TN90p in NWC, while those of DTR, TNx, and TNn were related to AMO mainly in TPC. For NEC, AMO had a significant relationship with the variations of the warm and cold extremes, but their relationship was opposite. NAO was related to almost all the temperature extreme indices in NWC and TPC, especially to DTR, TXm, and the cold extremes, while NAO only had a significant impact on TXm, TN10p, and TX10p in NEC. MEI were significantly correlated with most of the temperature indices in NWC (except for TNx and TNn) and NEC. However, MEI showed significant impacts only on DTR and TNx in TPC. In addition, AMO displayed significant relationships with most of the temperature extremes in every season, but the summer and winter MEI and the summer and winter NAO showed significant impacts only on DTR, TNm, and TNx. The above results can provide references for a better understanding of the influencing mechanism of global warming on the extreme temperatures in CRC, which can be useful to water resource prediction and management and to the agricultural development of cold regions.
Data availability statement
The original contributions presented in the study are included in the article/Supplementary Material, further inquiries can be directed to the corresponding authors.
Author contributions
YD, JZ, YZ, ZD contributed to the conception of the study; QY, SJ, ZyL contributed significantly to analysis and manuscript preparation; YD, QY performed the data analyses and wrote the manuscript; ZwL, ZyL, DY, KL helped perform the analysis with constructive discussions. All authors listed have made a substantial, direct, and intellectual contribution to the work and approved it for publication. All authors contributed to the article and approved the submitted version.
Funding
This research was supported by the National key Research and Development Program of China (Grant No.2021YFC3200205), the National Natural Science Foundation of China (Grant No.U2040212, 51979284), and the National Science Fund for Distinguished Young Scholars (Grant No.52025093).
Conflict of interest
Authors YD, ZwL, ZyL, DY, was employed by the company Three Gorges Corporation.
The remaining authors declare that the research was conducted in the absence of any commercial or financial relationships that could be construed as a potential conflict of interest.
Publisher’s note
All claims expressed in this article are solely those of the authors and do not necessarily represent those of their affiliated organizations, or those of the publisher, the editors and the reviewers. Any product that may be evaluated in this article, or claim that may be made by its manufacturer, is not guaranteed or endorsed by the publisher.
Supplementary material
The Supplementary Material for this article can be found online at: https://www.frontiersin.org/articles/10.3389/feart.2023.1120800/full#supplementary-material
References
Aguilar, E., Aziz, B. A., Brunet, M., Ekang, L., Fernandes, A., Massoukina, M., et al. (2009). Changes in temperature and precipitation extremes in Western central Africa, Guinea Conakry, and Zimbabwe, 1955–2006. J. Geophys. Res. 114 (D2), D02115. doi:10.1029/2008jd011010
Alexander, L. V., and Arblaster, J. M. (2017). Historical and projected trends in temperature and precipitation extremes in Australia in observations and CMIP5. Weather. Clim. Extreme. 15, 34–56. doi:10.1016/j.wace.2017.02.001
Alexander, L. V., Zhang, X., Peterson, T. C., Caesar, J., Gleason, B., Klein Tank, A. M. G., et al. (2006). Global observed changes in daily climate extremes of temperature and precipitation. J. Geophys. Res. 111 (D5), D05109. doi:10.1029/2005jd006290
Asong, Z. E., Wheater, H. S., Bonsal, B., Razavi, S., and Kurkute, S. (2018). Historical drought patterns over Canada and their teleconnections with large-scale climate signals. Hydrol. Earth. Syst. Sci. 22 (6), 3105–3124. doi:10.5194/hess-22-3105-2018
Bardin, M. Y., and Platova, T. V. (2020). Long-period variations in extreme temperature statistics in Russia as linked to the changes in large-scale atmospheric circulation and global warming. Russ. Meteorol. Hydrol. 44 (12), 791–801. doi:10.3103/s106837391912001x
Caesar, J., Alexander, L. V., Trewin, B., Tse-ring, K., Sorany, L., Vuniyayawa, V., et al. (2011). Changes in temperature and precipitation extremes over the Indo-Pacific region from 1971 to 2005. Int. J. Climatol. 31 (6), 791–801. doi:10.1002/joc.2118
Cai, W., Santoso, A., Wang, G., Yeh, S., An, S. K., Cobb, K. M., et al. (2015). ENSO and greenhouse warming. Nat. Clim. Change. 5 (9), 849–859. doi:10.1038/nclimate2743
Chan, J. C. L., Zhou, W., Chen, W., Ling, J., Pinto, J. G., and Shao, Y. (2009). Synoptic-scale controls of persistent low temperature and icy weather over southern China in January 2008. Mon. Weather. Rev. 137 (11), 3978–3991. doi:10.1175/2009mwr2952.1
Chen, R., Kang, E., Wu, L., Yang, J., Ji, X., Zhang, Z., et al. (2005). Cold regions in China. J. Glaciol. Geocryol. 27 (4), 469–475. (in Chinese).
Chen, X., and Tung, K. K. (2014). Varying planetary heat sink led to global-warming slowdown and acceleration. Science 345 (6199), 897–903. doi:10.1126/science.1254937
Chen, W., and Dong, B. (2019). Anthropogenic impacts on recent decadal change in temperature extremes over China: relative roles of greenhouse gases and anthropogenic aerosols. Clim. Dynam. 52 (5-6), 3643–3660
Choi, G., Collins, D., Ren, G., Trewin, B., Baldi, M., Fukuda, Y., et al. (2009). Changes in means and extreme events of temperature and precipitation in the Asia-Pacific Network region, 1955–2007. Int. J. Climatol. 29 (13), 1906–1925. doi:10.1002/joc.1979
Cohen, J., Screen, J. A., Furtado, J. C., Barlow, M., Whittleston, D., Coumou, D., et al. (2014). Recent Arctic amplification and extreme mid-latitude weather. Nat. Geosci. 7 (9), 627–637. doi:10.1038/ngeo2234
Cuo, L., Zhang, Y., Wang, Q., Zhang, L., Zhou, B., Hao, Z., et al. (2013). Climate change on the northern Tibetan Plateau during 1957–2009: Spatial patterns and possible mechanisms. J. Clim. 26 (1), 85–109. doi:10.1175/jcli-d-11-00738.1
Deng, H., Chen, Y., Shi, X., Li, W., Wang, H., Zhang, S., et al. (2014). Dynamics of temperature and precipitation extremes and their spatial variation in the arid region of Northwest China. Atmos. Res. 138, 346–355. doi:10.1016/j.atmosres.2013.12.001
Deser, C., Knutti, R., Solomon, S., and Phillips, A. S. (2012). Communication of the role of natural variability in future North American climate. Nat. Clim. Change. 2 (11), 775–779. doi:10.1038/nclimate1562
Ding, J., Cuo, L., Zhang, Y., and Zhu, F. (2018a). Monthly and annual temperature extremes and their changes on the Tibetan Plateau and its surroundings during 1963–2015. Sci. Rep. 8 (1), 11860. doi:10.1038/s41598-018-30320-0
Ding, Z., Ge, Y., and Jilili, A. (2018b). Spatiotemporal variation characteristics of extreme temperature and its influencing factors in recent 53 years in northern Xinjiang, China. J. Earth. Environ. 9 (2), 159–171. (in Chinese).
Ding, Z., Pu, J., Meng, L., Lu, R., Wang, Y., Li, Y., et al. (2021). Asymmetric trends of extreme temperature over the Loess Plateau during 1998–2018. Int. J. Climatol. 41 (S1), E1663–E1685. doi:10.1002/joc.6798
Ding, Z., Wang, Y., and Lu, R. (2018c). An analysis of changes in temperature extremes in the Three River Headwaters region of the Tibetan Plateau during 1961–2016. Atmos. Res. 209, 103–114. doi:10.1016/j.atmosres.2018.04.003
Dong, L., Leung, L. R., Song, F., and Lu, J. (2021). Uncertainty in el niño-like warming and California precipitation changes linked by the interdecadal pacific oscillation. Nat. Commun. 12 (1), 6484. doi:10.1038/s41467-021-26797-5
Dong, X., Zhang, S., Zhou, J., Cao, J., Jiao, L., Zhang, Z., et al. (2019). Magnitude and frequency of temperature and precipitation extremes and the associated atmospheric circulation patterns in the Yellow River basin (1960–2017), China. Water 11 (11), 2334. doi:10.3390/w11112334
Dong, Y., Zhai, J., Zhao, Y., Li, H., Wang, Q., Jiang, S., et al. (2020). Teleconnection patterns of precipitation in the Three-River Headwaters region, China. Environ. Res. Lett. 15 (10), 104050. doi:10.1088/1748-9326/aba8c0
Du, Q., Zhang, M., Wang, S., Che, C., Ma, R., and Ma, Z. (2019). Changes in air temperature over China in response to the recent global warming hiatus. J. Geog. Sci. 29 (4), 496–516. doi:10.1007/s11442-019-1612-3
England, M. H., McGregor, S., Spence, P., Meehl, G. A., Timmermann, A., Cai, W., et al. (2014). Recent intensification of wind-driven circulation in the Pacific and the ongoing warming hiatus. Nat. Clim. Change. 4 (3), 222–227. doi:10.1038/nclimate2106
Fasullo, J. T., Otto-Bliesner, B. L., and Stevenson, S. (2018). ENSO’s changing influence on temperature, precipitation, and wildfire in a warming climate. Geophys. Res. Lett. 45 (17), 9216–9225. doi:10.1029/2018gl079022
Gerdel, R. W. (1969). “Characteristics of the cold regions,” in CRREL monograph 1-A, cold regions research and engineering laboratory (U.S.A. New Hampshire: Army Corps of Engineering), 51.
Gilbert, R. O. (1987). Statistical methods for environmental pollution monitoring. New York: Van Nostrand Reinhold.
Gong, H., Wang, L., Chen, W., and Wu, R. (2019). Attribution of the East Asian winter temperature trends during 1979–2018: Role of external forcing and internal variability. Geophys. Res. Lett. 46 (19), 10874–10881. doi:10.1029/2019gl084154
Gong, H., Wang, L., Zhou, W., Chen, W., Wu, R., Liu, L., et al. (2018). Revisiting the northern mode of East Asian winter monsoon variation and its response to global warming. J. Clim. 31 (21), 9001–9014. doi:10.1175/jcli-d-18-0136.1
Grinsted, A., Moore, J. C., and Jevrejeva, S. (2004). Application of the cross wavelet transform and wavelet coherence to geophysical time series. Nonlinear. Proc. geoph. 11 (5/6), 561–566. doi:10.5194/npg-11-561-2004
Hao, X., and He, S. P. (2017). Combined effect of ENSO-like and atlantic multidecadal oscillation SSTAs on the interannual variability of the East Asian winter monsoon. J. Clim. 30, 2697–2716. doi:10.1175/jcli-d-16-0118.1
Huang, Q., and Chen, Z. S. (2014). Regional study on the trends of extreme temperature and precipitation events in the Pearl River Basin. Adv. Earth. Sci. 29 (8), 956–961. (in Chinese). doi:10.11867/j.issn.1001-8166.2014.08.0956
Huber, M., and Knutti, R. (2014). Natural variability, radiative forcing and climate response in the recent hiatus reconciled. Nat. Geosci. 7 (9), 651–656. doi:10.1038/ngeo2228
IPCC (2021). “Summary for policymakers,” in Climate change 2021: the physical science basis. Contribution of working group to the sixth assessment report of the Intergovernmental Panel on Climate Change (Cambridge, UK, New York, NY, USA: Cambridge University Press).
Jaccard, S. L., and Galbraith, E. D. (2012). Large climate-driven changes of oceanic oxygen concentrations during the last deglaciation. Nat. Geosci. 5 (2), 151–156. doi:10.1038/ngeo1352
Jevrejeva, S., Moore, J. C., and Grinsted, A. (2003). Influence of the arctic oscillation and el niño-southern oscillation (ENSO) on ice conditions in the baltic sea: The wavelet approach. J. Geophys. Res. Atmos. 108 (21). doi:10.1029/2003jd003417
Jiang, R., Wang, Y., Xie, J., Zhao, Y., Li, F., and Wang, X. (2019). Assessment of extreme precipitation events and their teleconnections to el niño southern oscillation, a case study in the Wei river basin of China. Atmos. Res. 218, 372–384. doi:10.1016/j.atmosres.2018.12.015
Jin, D., Hameed, S. N., and Huo, L. (2016). Recent changes in ENSO teleconnection over the Western Pacific impacts the eastern China precipitation dipole. J. Clim. 29 (21), 7587–7598. doi:10.1175/jcli-d-16-0235.1
Jones, P. D., Lister, D. H., and Li, Q. (2008). Urbanization effects in large-scale temperature records, with an emphasis on China. J. Geophys. Res. Atmos. 113 (D16), D16122. doi:10.1029/2008jd009916
Kong, F., Sun, Y., Song, W., Zhou, Y., and Zhu, S. (2020). MiR-216a alleviates LPS-induced acute lung injury via regulating JAK2/STAT3 and NF-κB signaling. Water. Res. hydro. Eng. 51 (4), 67–78. (in Chinese). doi:10.1007/s13577-019-00289-7
Krishnamurthy, L., and Krishnamurthy, V. (2015). Teleconnections of Indian monsoon rainfall with AMO and Atlantic tripole. Clim. Dynam. 46 (7-8), 2269–2285. doi:10.1007/s00382-015-2701-3
Li, J., Sun, C., and Jin, F. F. (2013). NAO implicated as a predictor of Northern Hemisphere mean temperature multidecadal variability. Geophys. Res. Lett. 40 (20), 5497–5502. doi:10.1002/2013gl057877
Li, J., Xie, T. J., Tang, X. X., Wang, H., Sun, C., Feng, J., et al. (2022). Influence of the NAO on wintertime surface air temperature over East Asia: Multidecadal variability and decadal prediction. Adv. Atmos. Sci. 39 (4), 625–642. doi:10.1007/s00376-021-1075-1
Li, M., Luo, D., Yao, Y., and Zhong, L. (2019). Large-scale atmospheric circulation control of summer extreme hot events over China. Int. J. Climatol. 40 (3), 1456–1476. doi:10.1002/joc.6279
Li, M., and Ma, Z. (2018). Decadal changes in summer precipitation over arid Northwest China and associated atmospheric circulations. Int. J. Climatol. 38 (12), 4496–4508. doi:10.1002/joc.5682
Li, Q., Yang, S., Xu, W., Wang, X. L., Jones, P., Parker, D., et al. (2015a). China experiencing the recent warming hiatus. Geophys. Res. Lett. 42 (3), 889–898. doi:10.1002/2014gl062773
Li, S. L., Jing, Y. Y., and Luo, F. F. (2015b). The potential connection between China surface air temperature and the Atlantic Multidecadal Oscillation(AMO) in the Pre-industrial Period. Sci. China. Earth Sci. 45, 1814–1826. (in Chinese). doi:10.1007/s11430-015-5091-9
Li, Z., Zheng, F. L., Liu, W. Z., and Flanagan, D. C. (2010). Spatial distribution and temporal trends of extreme temperature and precipitation events on the Loess Plateau of China during 1961–2007. Quat. Int. 226 (1-2), 92–100. doi:10.1016/j.quaint.2010.03.003
Li, Z., Zheng, F. L., Liu, W. Z., and Jiang, D. J. (2012). Spatially downscaling GCMs outputs to project changes in extreme precipitation and temperature events on the Loess Plateau of China during the 21st Century. Glob. Planet. Change. 82-83, 65–73. doi:10.1016/j.gloplacha.2011.11.008
Liu, X., Xu, Z., Peng, D., and Wu, G. (2019). Influences of the North Atlantic Oscillation on extreme temperature during the cold period in China. Int. J. Climatol. 39 (1), 43–49. doi:10.1002/joc.5779
Lu, R., Dong, B., and Ding, H. (2006). Impact of the atlantic multidecadal oscillation on the asian summer monsoon. Geophys. Res. Lett. 33 (24), L24701. doi:10.1029/2006gl027655
Mann, H. B. (1945). Nonparametric tests against trend. Econometrica 13 (3), 245–259. doi:10.2307/1907187
Mascioli, N. R., Fiore, A. M., Previdi, M., and Correa, G. (2016). Temperature and precipitation extremes in the United States: Quantifying the responses to anthropogenic aerosols and greenhouse Gases,+. J. Clim. 29 (7), 2689–2701. doi:10.1175/jcli-d-15-0478.1
McGregor, S., Timmermann, A., Stuecker, M. F., England, M. H., Merrifield, M., Jin, F. F., et al. (2014). Recent Walker circulation strengthening and Pacific cooling amplified by Atlantic warming. Nat. Clim. Change. 4 (10), 888–892. doi:10.1038/nclimate2330
Peterson, T., Taylor, M. A., Demeritte, R., Duncombe, D. L., Burton, S., Thompson, F., et al. (2002). Recent changes in climate extremes in the Caribbean region. J. Geophys. Res. Atmos. 107 (D21), ACL 16-1–ACL 16-9. doi:10.1029/2002jd002251
Qian, C., and Zhang, X. (2019). Changes in temperature seasonality in China: Human influences and internal variability. J. Clim. 32 (19), 6237–6249. doi:10.1175/jcli-d-19-0081.1
Qian, Y., Chakraborty, T. C., Li, J., Li, D., He, C., and Sarangi, C. (2022). Urbanization impact on regional climate and extreme weather: Current understanding, uncertainties, and future research directions. Adv. Atmos. Sci. 39 (6), 819–860. doi:10.1007/s00376-021-1371-9
Rogers, J. C., and Coleman, J. S. M. (2003). Interactions between the atlantic multidecadal oscillation, el niño/La niña, and the PNA in winter Mississippi valley stream flow. Geophys. Res. Lett. 30 (10).
Rohini, P., Rajeevan, M., and Srivastava, A. K. (2016). On the variability and increasing trends of heat waves over India. Sci. Rep. 6, 26153. doi:10.1038/srep26153
Samset, B. H., Sand, M., Smith, C. J., Bauer, S. E., Forster, P. M., Fuglestvedt, J. S., et al. (2018). Climate impacts from a removal of anthropogenic aerosol emissions. Geophys. Res. Lett. 45 (2), 1020–1029. doi:10.1002/2017gl076079
Sen, P. K. (1968). Estimates of the regression coefficient based on Kendall’s Tau. J. Am. Stat. Assoc. 63 (324), 1379–1389. doi:10.1080/01621459.1968.10480934
Seneviratne, S. I., Donat, M. G., Mueller, B., and Alexander, L. V. (2014). No pause in the increase of hot temperature extremes. Nat. Clim. Change. 4 (3), 161–163. doi:10.1038/nclimate2145
Shen, X., Liu, B., and Lu, X. (2018). Weak cooling of cold extremes versus continued warming of hot extremes in China during the recent global surface warming hiatus. J. Geophys. Res. Atmos. 123 (8), 4073–4087. doi:10.1002/2017jd027819
Shi, J., Cui, L., Ma, Y., Du, H., and Wen, K. (2018a). Trends in temperature extremes and their association with circulation patterns in China during 1961–2015. Atmos. Res. 212, 259–272. doi:10.1016/j.atmosres.2018.05.024
Shi, J., Cui, L., Wen, K., Tian, Z., Wei, P., and Zhang, B. (2018b). Trends in the consecutive days of temperature and precipitation extremes in China during 1961–2015. Environ. Res. 161, 381–391. doi:10.1016/j.envres.2017.11.037
Soon, W. W. H., Connolly, R., Connolly, M., O'Neill, P., Zheng, J., Ge, Q., et al. (2018). Comparing the current and early 20th century warm periods in China. Earth. Sci. Rev. 185, 80–101. doi:10.1016/j.earscirev.2018.05.013
Su, L., Miao, C., Borthwick, A. G. L., and Duan, Q. (2017). Wavelet-based variability of Yellow River discharge at 500-100-and 50-year timescales. Gondwana. Res. 49, 94–105. doi:10.1016/j.gr.2017.05.013
Su, L., Miao, C., Duan, Q., Lei, X., and Li, H. (2019). Multiple-wavelet coherence of world's large rivers with meteorological factors and ocean signals. J. Geophys. Res. Atmos. 124 (9), 4932–4954. doi:10.1029/2018jd029842
Sun, W., Mu, X., Song, X., Wu, D., Cheng, A., and Qiu, B. (2016a). Changes in extreme temperature and precipitation events in the Loess Plateau (China) during 1960–2013 under global warming. Atmos. Res. 168, 33–48. doi:10.1016/j.atmosres.2015.09.001
Sun, Y. B., Clemens, S. C., Morrill, C., Lin, X., Wang, X., and An, Z. (2012). Influence of Atlantic meridional overturning circulation on the East Asian winter monsoon. Nat. Geosci. 5, 46–49. doi:10.1038/ngeo1326
Sun, Y., Hu, T., Zhang, X., Li, C., Lu, C., Ren, G., et al. (2019). Contribution of global warming and urbanization to changes in temperature extremes in Eastern China. Geophys. Res. Lett. 46 (20), 11426–11434. doi:10.1029/2019gl084281
Sun, Y., Zhang, X. B., Ren, G. Y., Zwiers, F. W., and Hu, T. (2016b). Contribution of urbanization to warming in China. Nat. Clim. Change. 6 (7), 706–709. doi:10.1038/nclimate2956
Thirumalai, K., DiNezio, P. N., Okumura, Y., and Deser, C. (2017). Extreme temperatures in Southeast Asia caused by El Niño and worsened by global warming. Nat. Commun. 8 (1), 15531. doi:10.1038/ncomms15531
Tong, S., Li, X., Zhang, J., Bao, Y., Bao, Y., Na, L., et al. (2019). Spatial and temporal variability in extreme temperature and precipitation events in Inner Mongolia (China) during 1960–2017. Sci. Total. Environ. 649, 75–89. doi:10.1016/j.scitotenv.2018.08.262
Torrence, C., and Compo, G. P. (1998). A practical guide to wavelet analysis. Bull. Am. Meteorol. Soc. 79 (1), 61–78. doi:10.1175/1520-0477(1998)079<0061:apgtwa>2.0.co;2
Tysa, S. K., Ren, G., Qin, Y., Zhang, P., Ren, Y., Jia, W., et al. (2019). Urbanization effect in regional temperature series based on a remote sensing classification scheme of Stations. J. Geophys. Res. Atmos. 124 (20), 10646–10661. doi:10.1029/2019jd030948
Visbeck, M. H., Hurrell, J. W., Polvani, L., and Cullen, H. M. (2001). The North atlantic oscillation: Past, present, and future. P. Natl. Acad. Sci. USA. 98 (23), 12876–12877. doi:10.1073/pnas.231391598
Wallace, J. M., Deser, C., Smoliak, B. V., and Phillips, A. S. (2015). “Attribution of climate change in the presence of internal variability,” in book: Climate change: multidecadal and beyond, world scientific series on Asia-Pacific weather and climate (Singapore: World Scientific), 1–29.
Wang, B., Zhang, M., Wei, J., Wang, S., Li, S., Ma, Q., et al. (2013). Changes in extreme events of temperature and precipitation over Xinjiang, northwest China, during 1960–2009. Quat. Int. 298, 141–151. doi:10.1016/j.quaint.2012.09.010
Wang, C., and Zhang, L. (2013). Multidecadal ocean temperature and salinity variability in the tropical north Atlantic: Linking with the AMO, AMOC, and subtropical cell. J. Clim. 26 (16), 6137–6162. doi:10.1175/jcli-d-12-00721.1
Wang, C. Z., Zheng, J. Y., Lin, W., and Wang, Y. (2022). Unprecedented heatwave in Western North America during late June of 2021: Roles of atmospheric circulation and global warming. Adv. Atmos. Sci. 40, 14–28. doi:10.1007/s00376-022-2078-2
Wang, D., Wang, C., Yang, X., and Lu, J. (2005). Winter northern hemisphere surface air temperature variability associated with the Arctic Oscillation and North Atlantic Oscillation. Geophys. Res. Lett. 32 (16), L16706. doi:10.1029/2005gl022952
Wang, J., Yan, Z. W., Quan, X. W., and Feng, J. (2017a). Urban warming in the 2013 summer heat wave in eastern China. Clim. Dyn. 48 (9), 3015–3033. doi:10.1007/s00382-016-3248-7
Wang, Y., Ding, Z., and Ma, Y. (2019). Spatial and temporal analysis of changes in temperature extremes in the non-monsoon region of China from 1961 to 2016. Theor. Appl. Clim. 137 (3-4), 2697–2713. doi:10.1007/s00704-019-02767-2
Wang, Z. Q., Zhang, W. J., and Geng, X. (2017b). Different influences of two types of ENSO on winter temperature and cold extremes in north-ern China. Acta. meteo. Sin. 75 (4), 564–580. (in Chinese).
Wanner, H., Brönnimann, S., Casty, C., Gyalistras, D., Luterbacher, J., Schmutz, C., et al. (2001). North Atlantic oscillation–concepts and studies. Surv. Geophys. 22 (4), 321–381. doi:10.1023/a:1014217317898
Watanabe, M., Shiogama, H., Tatebe, H., Hayashi, M., Ishii, M., and Kimoto, M. (2014). Contribution of natural decadal variability to global warming acceleration and hiatus. Nat. Clim. Change. 4 (10), 893–897. doi:10.1038/nclimate2355
Wei, C., and Buwen, D. (2019). Anthropogenic impacts on recent decadal change in temperature extremes over China: Relative roles of greenhouse gases and anthropogenic aerosols. Clim. Dynam. 52, 1–18. doi:10.1007/s00382-018-4342-9
Wills, R. C., Schneider, T., Wallace, J. M., Battisti, D. S., and Hartmann, D. L. (2018). Disentangling global warming, multidecadal variability, and el niño in pacific temperatures. Geophys. Res. Lett. 45 (5), 2487–2496. doi:10.1002/2017gl076327
Wilson, C. (1967). Cold regions climatology. Hoboken: John Wiley and Sons. CRREL Monograph 1-A3a, Cold Regions Research and Engineering Laboratory, U.S.A. New Hampshire: Army Corps of Engineering.
Wu, X., Hao, Z., Hao, F., and Zhang, X. (2019). Variations of compound precipitation and temperature extremes in China during 1961–2014. Sci. Total. Environ. 663, 731–737. doi:10.1016/j.scitotenv.2019.01.366
Wu, Z., Wang, B., Li, J., and Jin, F. F. (2009). An empirical seasonal prediction model of the East Asian summer monsoon using ENSO and NAO. J. Geophys. Res. Atmos. 114 (D18), D18120. doi:10.1029/2009jd011733
Xi, Y., Miao, C., Wu, J., Duan, Q., Lei, X., and Li, H. (2018). Spatiotemporal changes in extreme temperature and precipitation events in the Three-Rivers Headwater region, China. J. Geophys. Res. Atmos. 123 (11), 5827–5844. doi:10.1029/2017jd028226
Yan, Z. W., Ding, Y. H., Zhai, P. M., Song, L. C., Cao, L. J., Li, Z., et al. (2020). Re-assessing climatic warming in China since the last century. Acta. meteo. Sin. 78 (3), 370–378. (in Chinese).
Yang, S., Ding, Z., Li, Y., Wang, X., Jiang, W., and Huang, X. (2016). Reply to Yu et al.: Global temperature change as the ultimate driver of the shift in the summer monsoon rain belt in East Asia. P. Natl. Acad. Sci. USA. 113 (16), E2211–E2212. doi:10.1073/pnas.1601768113
Yang, Y., Xie, N., and Gao, M. (2019). The relationship between the wintertime cold extremes over East Asia with large-scale atmospheric and oceanic teleconnections. Atmosphere 10 (12), 813. doi:10.3390/atmos10120813
Yang, Z. N., Liu, X. R., Zeng, Q. Z., Chen, Z. T., et al. (2000). Hydrology in cold regions of China. Beijing: Science Press, 54–121. (in Chinese).
Ye, Y., and Qian, C. (2021). Conditional attribution of climate change and atmospheric circulation contributing to the record-breaking precipitation and temperature event of summer 2020 in southern China. Environ. Res. Lett. 16 (4), 044058. doi:10.1088/1748-9326/abeeaf
Yin, H., Sun, Y., and Donat, M. G. (2019). Changes in temperature extremes on the Tibetan Plateau and their attribution. Environ. Res. Lett. 14 (12), 124015. doi:10.1088/1748-9326/ab503c
You, Q., Kang, S., Aguilar, E., Pepin, N., Flügel, W. A., Yan, Y., et al. (2010). Changes in daily climate extremes in China and their connection to the large scale atmospheric circulation during 1961–2003. Clim. Dynam. 36 (11-12), 2399–2417. doi:10.1007/s00382-009-0735-0
You, Q., Ren, G., Fraedrich, K., Kang, S., Ren, Y., and Wang, P. (2013). Winter temperature extremes in China and their possible causes. Int. J. Climatol. 33 (6), 1444–1455. doi:10.1002/joc.3525
Yu, X., Ren, G., Zhang, P., Hu, J., Liu, N., Li, J., et al. (2020). Extreme temperature change of the last 110 years in Changchun, northeast China. Adv. Atmos. Sci. 37 (4), 347–358. doi:10.1007/s00376-020-9165-z
Zhang, G., Zeng, G., Li, C., and Yang, X. (2020a). Impact of PDO and AMO on interdecadal variability in extreme high temperatures in north China over the most recent 40-year period. Clim. Dynam. 54 (5), 3003–3020. doi:10.1007/s00382-020-05155-z
Zhang, J., You, Q., Wu, F., Cai, Z., and Pepin, N. (2022). The warming of the Tibetan plateau in response to transient and stabilized 2.0°C/1.5°C global warming targets. Adv. Atmos. Sci. 39, 1198–1206. doi:10.1007/s00376-022-1299-8
Zhang, Q., Wu, Z., Yu, H., Zhu, X., and Shen, Z. (2020b). Variable urbanization warming effects across metropolitans of China and relevant driving factors. Remote. Sens-Basel. 12 (9), 1500. doi:10.3390/rs12091500
Zhang, X., and Yang, F. (2004). RClimDex (1.0) user manual. Climate research branch environment Canada downsview: Ontario Canada. Wuhan: Scientific Research Publishing, 22.
Zhong, Y., Wang, B., Zou, C. B., Hu, B. X., Liu, Y., and Hao, Y. (2017). On the teleconnection patterns to precipitation in the eastern Tianshan Mountains, China. Clim. Dynam. 49 (9-10), 3123–3139. doi:10.1007/s00382-016-3500-1
Zhou, C., Chen, D., Wang, K., Dai, A., and Qi, D. (2020a). Conditional attribution of the 2018 summer extreme heat over Northeast China: Roles of urbanization, global warming, and warming-induced circulation changes. Bull. Am. Meteorol. Soc. 101 (1), S71–S76. doi:10.1175/bams-d-19-0197.1
Keywords: cold regions of China, temperature extremes, AMO, NAO, MEI, global warming
Citation: Dong Y, Zhai J, Zhao Y, Liu Z, Yang Q, Jiang S, Lv Z, Yan D, Liu K and Ding Z (2023) Impacts of large-scale circulation patterns on the temperature extremes in the cold regions of China with global warming. Front. Earth Sci. 11:1120800. doi: 10.3389/feart.2023.1120800
Received: 10 December 2022; Accepted: 26 April 2023;
Published: 11 May 2023.
Edited by:
Shanshui Yuan, Hohai University, ChinaReviewed by:
Kaiming Hu, Chinese Academy of Sciences (CAS), ChinaXiaoli Yang, Hohai University, China
Copyright © 2023 Dong, Zhai, Zhao, Liu, Yang, Jiang, Lv, Yan, Liu and Ding. This is an open-access article distributed under the terms of the Creative Commons Attribution License (CC BY). The use, distribution or reproduction in other forums is permitted, provided the original author(s) and the copyright owner(s) are credited and that the original publication in this journal is cited, in accordance with accepted academic practice. No use, distribution or reproduction is permitted which does not comply with these terms.
*Correspondence: Jiaqi Zhai, amlhcWl6aGFpQDE2My5jb20=; Zhiyong Ding, ZGluZ3poaXlvbmcxNEBtYWlscy51Y2FzLmFjLmNu
 Yiyang Dong
 Jiaqi Zhai2*