 Tao Qin
 Xiangang Hou
95% of researchers rate our articles as excellent or good
Learn more about the work of our research integrity team to safeguard the quality of each article we publish.
Find out more
ORIGINAL RESEARCH article
Front. Earth Sci. , 16 February 2023
Sec. Structural Geology and Tectonics
Volume 11 - 2023 | https://doi.org/10.3389/feart.2023.1120344
This article is part of the Research Topic Multiple Field/Scale Rock Mechanics in Coordinated Exploitation of Coal and its Associated Resources View all 11 articles
Energy is an internal variable during rock deformation and failure, and its dissipation and conversion law can reflect the rock’s internal damage and deterioration state. Analysis of rock deformation and failure process from the perspective of energy is helpful to deeply understand the mechanism of rock damage, fracture and instability failure, and has important theoretical and practical significance for the stability evaluation and support control of surrounding rock. In this study, through single cyclic loading and unloading (SCLU) experiments, cyclic triaxial loading and unloading (CTLU) experiments and conventional triaxial compression (CTC) experiments, the equivalent elastic modulus method based on elastic strain energy is proposed to analyze the energy conversion of rock. The results show that the error of the elastic strain energy calculated by the strain energy formula method is generally higher than 10% with the secant and tangent modulus of the loading and unloading curve as input parameters. Taking the equivalent elastic modulus proposed in this study as an input parameter, more accurate elastic strain energy can be obtained by the strain energy formula. During the rock failure process, the equivalent elastic modulus shows a three-stage characteristic of increase, steady and decrease. The equivalent elastic modulus can be estimated by the quadratic function between the equivalent elastic modulus and confining pressure and axial strain. Under the same deformation and deviatoric stress, the elastic strain energy stored in rock increases with increasing confining pressure. The local maximum energy dissipation rate corresponds to stress drop, and the peak energy dissipation rate appears near the peak strength. High energy dissipation mainly occurs in a short time after peak strength, and energy release and dissipation are more sudden and severe under high confining pressure.
The nature of rock mass deformation and failure is damage degradation and instability driven by energy. Energy is an internal variable in the whole process of rock mass deformation and failure, and its dissipation and conversion law can reflect the internal damage degradation state of rock mass (Xie et al., 2009; Peng et al., 2014). Under loading conditions, the transformation of rock from uniform deformation to local deformation, from disorderly failure to orderly failure, and from macroscopic homogeneity to macroscopic heterogeneity is accompanied by the transformation of energy accumulation to energy dissipation (Wang et al., 2019). Taking underground mining as an example, the excavation and support change the original stress field, and the surrounding rock accumulates, dissipates and releases energy (Cai et al., 2019; Keneti and Sainsbury, 2020; Xiao et al., 2021). Partial input energy of the rock mass is transformed into elastic strain energy (releasable strain energy) and released during instability failure, and some energy is transformed into plastic energy corresponding to plastic deformation, surface energy corresponding to crack initiation and expansion, kinetic energy of the failure surrounding rock mass, acoustic emission (microseismic) and radiation energy, etc., (Lu et al., 2021; Meng et al., 2021; Shirani Faradonbeh et al., 2021). During the process of rock mass excavation, stress redistributes and strain energy accumulates in surrounding rock, and the gathered energy is easily released along the face of caving, resulting in damage and fracture of surrounding rock and even sudden instability of surrounding rock (Li et al., 2018; Jiang et al., 2020; Liu et al., 2021; Tu et al., 2021; Zhang et al., 2021). Revealing the deformation and failure mechanism of rock mass from the perspective of energy is one of the research hotspots in the field of rock mechanics.
Many scholars (Huang and Li, 2014; Gong et al., 2019; Zhang et al., 2019; Qin et al., 2020) have systematically carried out laboratory experiments to study the laws of rock energy conversion under different loading conditions such as cyclic loading and unloading test, conventional compression test, unloading test, etc., and achieved many beneficial research results. Currently, two methods are widely used in calculating and analyzing rock energy, especially elastic strain energy. Firstly, the area method is based on the stress-strain curve under cyclic loading and unloading (Gong et al., 2021; Xu et al., 2021; Ding et al., 2022; Gong et al., 2022). This method has high accuracy, but it is generally applicable to laboratory experiments that can obtain cyclic loading and unloading curves, and it is difficult to be popularized and applied to engineering rock masses. Secondly, the traditional strain energy formula method based on elasticity theory is simple and fast, but the calculation accuracy depends on the value of elastic modulus (Gong and Wang, 2022; Qiao et al., 2022). Therefore, how to establish a simple, fast and easy method to calculate the elastic strain energy of engineering rock mass needs further study.
In this study, the quantification method of energy in the process of rock deformation and failure and its applicable conditions were discussed. Based on the single cyclic loading and unloading (SCLU) experiments, the influence of the method of calculating elastic modulus on the elastic strain energy calculated by the strain energy formula method was analyzed. On this basis, cyclic triaxial loading and unloading (CTLU) experiments were performed, and an equivalent elastic modulus characterization method of rock based on elastic strain energy was established. Based on the proposed equivalent elastic modulus estimation formula, the evolution characteristics of elastic strain energy and energy dissipation were analyzed through conventional triaxial compression (CTC) experiments. The research results have important theoretical and practical significance for the mechanism analysis, stability evaluation and support control of surrounding rock in the stope.
The process of rock deformation and failure under load is accompanied by energy input, energy accumulation, energy dissipation and energy release. The energy transformation process of rock under external load is shown in Figure 1.
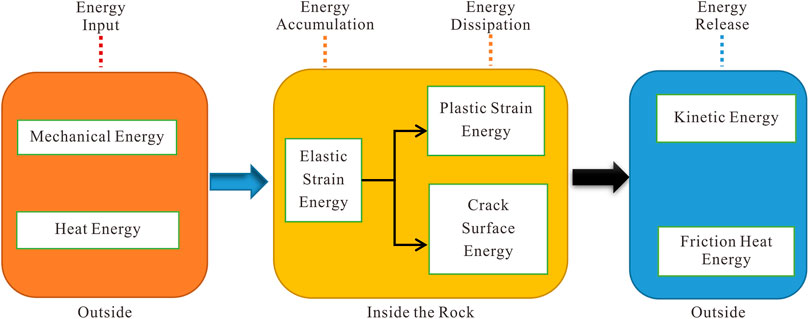
FIGURE 1. Energy transformation of rock under external load.
The change of rock state can be considered as the change from one energy balance state to another new energy balance state. If ignoring the temperature effect, part of the energy input by the external force working on the rock is accumulated in the form of elastic strain energy inside the rock, and this part of energy is reversible. The other part is mainly used for internal dissipated plastic strain energy and crack surface energy, released kinetic energy and friction heat energy.
In this study, the plastic strain energy is defined as irreversible internal dissipated energy which is not dissipated in the form of cracks. Before the macroscopic fracture, the kinetic energy released to the outside is mainly in the form of acoustic emission waves, while in the post-peak stage, it is mainly in the form of macroscopic movement of rock blocks. The frictional heat energy is the heat generated by the friction between rock substrates on both sides of the crack. During the process of rock deformation and failure, there are energy transformation processes such as external energy input, internal accumulation and dissipation, and release to the outside, and the specific bearing state corresponds to the specific energy transformation state.
The total input energy can be separated into two parts: reversible elastic strain energy and irreversible dissipated energy, assuming that there is no heat exchange with the environment. The elastic strain energy is primarily stored in the rock during the pre-peak stage of rock deformation and failure, whereas the dissipated energy is primarily in the form of plastic deformation and damage energy dissipation. The elastic strain energy is primarily released in the rock during the post-peak period, and the energy is primarily used for macroscopic crack fracture, friction between rock substrates on both sides of the crack, and kinetic energy of fragments. According to the law of energy conservation, the energy relationship during the process of rock deformation and failure can be expressed as follows:
where,
The input energy density can be calculated by the following formula:
where,
Elastic strain energy and dissipated energy during the process of rock deformation and failure can be determined by the area method or strain energy formula method.
As shown in Supplementary Figure S1, the area below the loading curve is the total input energy, the area below the unloading curve is the elastic strain energy
In the strain energy formula method, the elastic strain energy is calculated through the elastic theory formula, and the total input energy is calculated by the integral of stress-strain curve, and the difference between the above two is the dissipated energy.
The elastic strain energy
From the Generalized Hooke’s Law:
Substitute Eq. 4 into Eq. 3 to obtain:
Where,
For the conventional triaxial compression test, the Eq. 5 can be written as:
For the uniaxial compression test, the Eq. 5 can be written as:
For loading and unloading tests, the elastic strain energy corresponding to each cycle can be calculated by the area method, but for monotonic loading tests, the elastic strain energy can only be calculated by the strain energy formula method. In this case, the elastic modulus has a very important influence on the accuracy of the calculation results. Therefore, this section discusses the influence of several methods of calculating elastic modulus on theoretical calculation results of elastic strain energy.
As shown in Figure 2, the calculation methods of elastic modulus can mainly be concluded as follows:
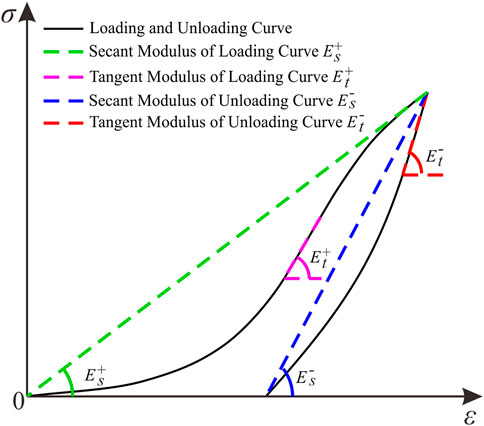
FIGURE 2. Schematic diagram of different calculation methods for elastic modulus.
Method 1: Secant modulus of loading curve (SMLC), denoted as
Method 2: Tangent modulus of loading curve (TMLC), denoted as
Method 3: Secant modulus of unloading curve (SMUC), denoted as
Method 4: Tangent modulus of unloading curve (TMUC), denoted as
The specimens adopted in this study are cylindrical yellow sandstone with Φ50 mm × H100 mm, in which quartz, potash feldspar and clay minerals account for 76.12%, 20.93% and 2.95%, respectively, with an average density of 2.10 g/cm3 and no obvious joints on the surface, as shown in Supplementary Figure S2. The Sonic Viewer-SX ultrasonic wave velocity test system was used to screen the sandstone samples. The samples with similar wave velocities were selected for testing to reduce the dispersion of the samples. The loading device was TOP INDUSTRIE Rock 600–50 automatic servo rheometer. Two linear variable displacement transducer (LVDT) were used to collect axial strain, and annular electronic strain gauge was used to collect annular strain, as shown in Supplementary Figure S3.
In this study, single cyclic loading and unloading (SCLU) experiments, cyclic triaxial loading and unloading (CTLU) experiments and conventional triaxial compression (CTC) experiments were performed, which were discussed in more detail in Section 3.2.2, Section 4.2 and Section 5, respectively.
The SCLU experiments were carried out under confining pressure of 0 MPa and 20 MPa, i.e., single cyclic uniaxial loading and unloading (SCULU) experiments and single cyclic triaxial loading and unloading (SCTLU) experiments. Seven SCULU experiments were performed with the unloading stress of 10 MPa, 20 MPa, 30 MPa, 40 MPa, 50 MPa, 60 MPa and 70 MPa. For SCULU experiments, the specimens were loaded to the preset unloading stress with an axial loading rate of 0.5 MPa/s, and then the specimens were completely unloaded with an axial unloading rate of 0.5 MPa/s. In the seventh experiment, the rock specimen failed when it was loaded to 66.0 MPa, and the unloading stress-strain curve was not obtained. Eight SCTLU experiments were performed with the unloading deviatoric stress of 10 MPa, 20 MPa, 40 MPa, 60 MPa, 90 MPa, 120 MPa, 150 MPa, 180 MPa. For SCTLU experiments, the experimental procedure was as follows: (a) the hydrostatic pressure (
The CTLU experiments were performed under the confining pressure of 0 MPa, 5 MPa, 10 MPa, 15 MPa and 20 MPa. Firstly, the hydrostatic pressure (
The CTC experiments were performed under the confining pressure of 0 MPa, 5 MPa, 10 MPa, 15 MPa and 20 MPa. The loading procedure was as follows: firstly, the hydrostatic pressure was applied with a loading rate of 0.5 MPa/s; then, the specimen was subsequently loaded to failure with an axial loading rate of 0.5 MPa/s.
As shown in Figure 3, the stress-strain curves of sandstone under uniaxial compression show obvious non-linear characteristics regardless of unloading at low-stress or high-stress levels, and the elastic modulus calculated by different methods are different. With the increase of confining pressure, the non-linear characteristics of stress-strain curve reduce, and the difference of calculated elastic modulus also decreases. Supplementary Tables S1, S2 list the elastic modulus in each SCLU experiment calculated by the abovementioned method. Under the same stress limit, the elastic modulus calculated by the four methods can be listed in descending order: TMUC
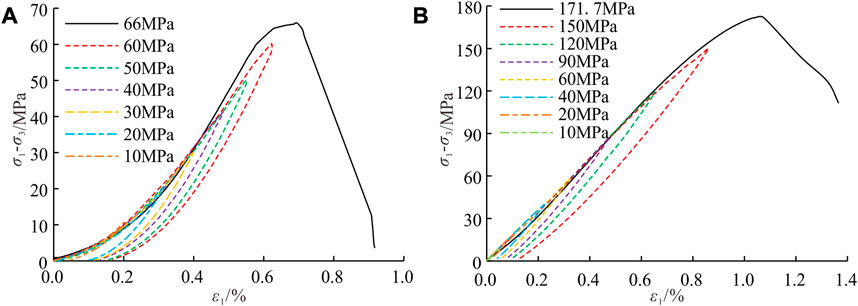
FIGURE 3. Stress-strain curves of sandstone under SCLU. (A) Confining pressure
In order to compare the accuracy of elastic strain energy calculated by different elastic modulus, the elastic strain energy was calculated by using the area method and strain energy formula method, respectively. Based on the results of the area method, the calculation deviation corresponding to different values of elastic modulus was obtained, as shown in Tables 1, 2. As can be seen from the tables, the calculation deviation of elastic strain energy using different elastic modulus is large. For SCULU experiment, the calculation deviation of elastic strain energy using SMLC
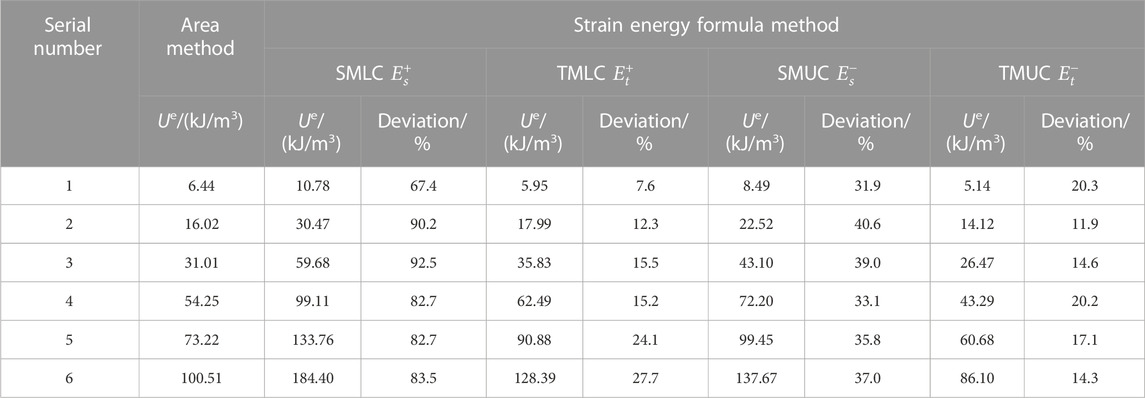
TABLE 1. Results of elastic strain energy calculated by different elastic modulus (
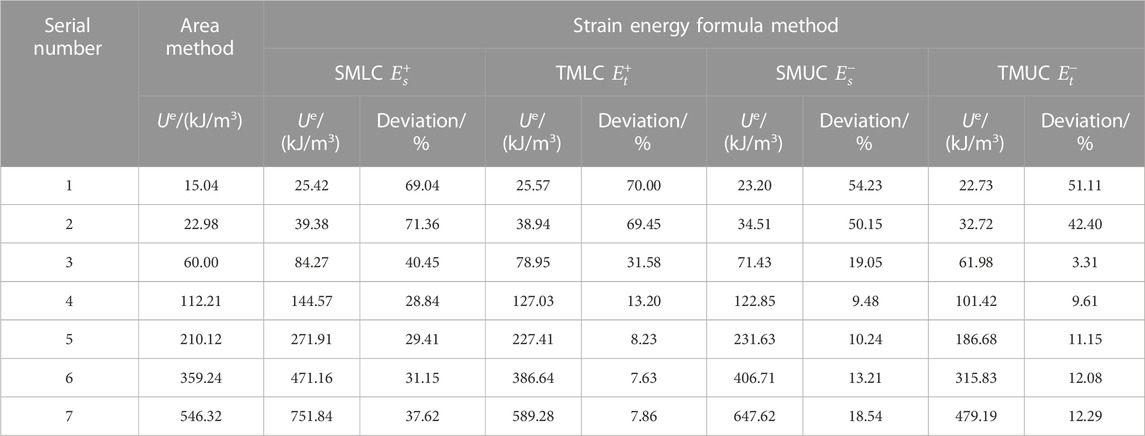
TABLE 2. Results of elastic strain energy calculated by different elastic modulus (
As shown in Figure 4A, the main reasons for the calculation deviation of elastic strain energy can be concluded: the elastic strain energy calculated by SMUC
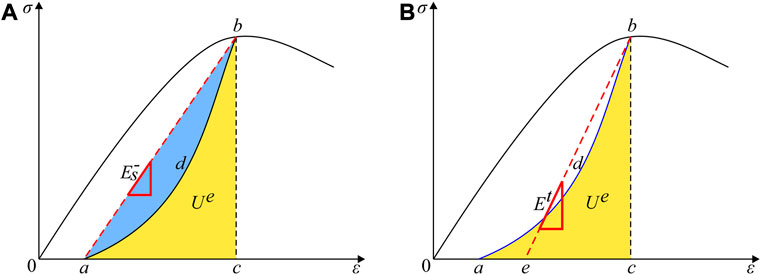
FIGURE 4. Schematic diagram of elastic strain energy and equivalent elastic modulus. (A) Elastic strain energy. (B) Determination of equivalent elastic modulus.
Based on the above analysis, this study put forward the equivalent elastic modulus (the slope of the line be in Figure 4B based on elastic strain energy, defined as
For triaxial compression, the elastic strain energy can be calculated through the axial and radial unloading curve, and the equivalent elastic modulus can be calculated as follows:
where,
In this study, the characterization method for equivalent elastic modulus is proposed from the perspective of energy, which aims to better quantify the elastic strain energy stored in rock. It is essentially different from the elastic modulus defined by the stress-strain curve, and more suitable for the analysis of energy conversion law during rock failure.
Based on the CTLU experiments, the equivalent elastic modulus proposed above (Formula 9) was used to determine the equivalent elastic modulus of rock under different confining pressure and cyclic limit stress, as shown in Table 3.
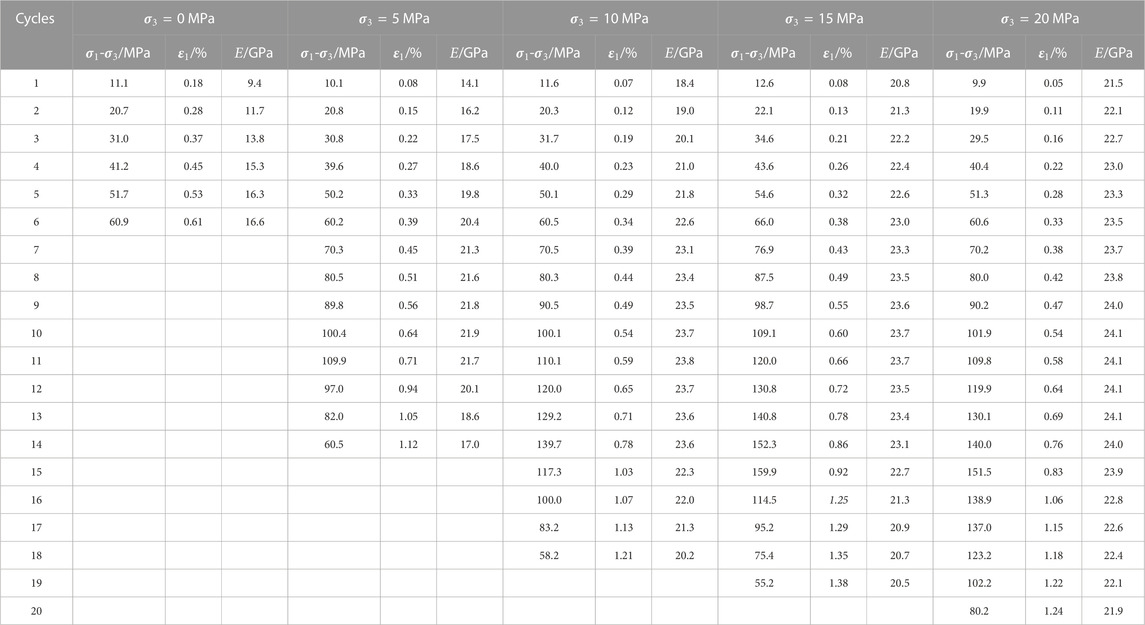
TABLE 3. Results of equivalent elastic modulus.
Figure 5 shows the change of equivalent elastic modulus under different confining pressure. Figure 5A shows that the post-peak unloading curve was not obtained under confining pressure of 0 MPa, and the equivalent elastic modulus increases gradually with the increase of cycles and axial strain. Theoretically, the storage capacity of elastic strain energy decreases after the specimen reaches the yield stage, leading to the decrease of the equivalent elastic modulus. The difference between peak stress and yield stress is less than cyclic stress increment (10 MPa) under confining pressure of 0 MPa, therefore the maximum stress of a cyclic loading is difficult to be exactly between the yield stress and peak stress, and the decrease of equivalent elastic modulus before the peak stress is not observed. It can be seen from Figures 5B–D that for triaxial cyclic loading and unloading tests, the equivalent elastic modulus shows a three-stage with the increase of cycles and axial strain, i.e., increasing, stabilizing and decreasing.
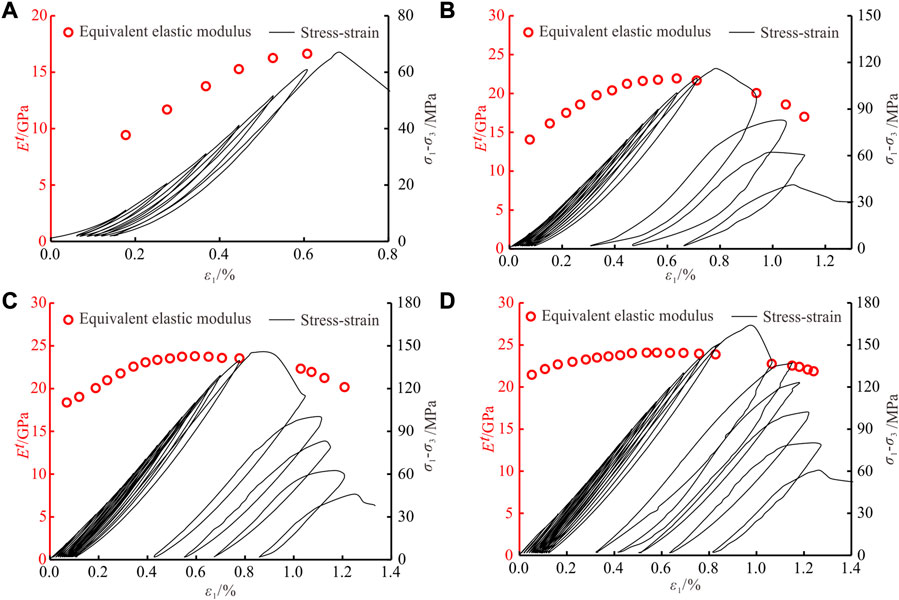
FIGURE 5. Evolution of equivalent elastic modulus under CTLU. (A)
In order to further analyze the effect of confining pressure on the equivalent elastic modulus of rock, the evolution of equivalent elastic modulus for CTLU experiment under different confining pressure was shown in Figure 6. With the increase of confining pressure, the equivalent elastic modulus increases under the same deviatoric stress and axial strain, and the variation of equivalent elastic modulus decreases obviously with the increase of deviatoric stress and axial strain, indicating that the confining pressure has a strengthening effect on the elastic modulus of rock. It can be seen from Figure 6B that the quadratic polynomial fitting of equivalent elastic modulus with axial strain is fairly good, and the fitting formula can be used to estimate the equivalent elastic modulus of rock under different confining pressure and axial strain:
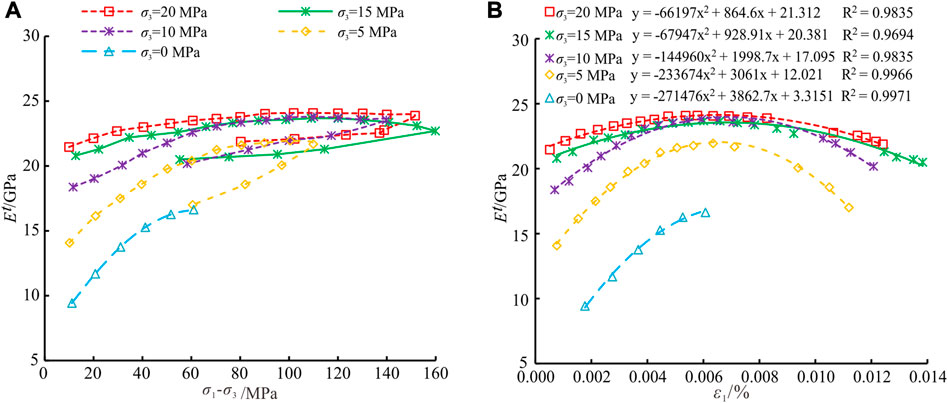
FIGURE 6. Equivalent elastic modulus under different confining pressure. (A) Relationship between equivalent elastic modulus and deviatoric stress. (B) Quadratic polynomial fitting of equivalent elastic modulus.
Based on the CTC experiments, the characteristic stresses such as crack closure stress, crack initiation stress and crack damage stress of sandstone under different confining pressure were calculated from the perspective of the crack activity inside the rock (Diederichs et al., 2004). As shown in Supplementary Figures S5, S6, it can be seen that the crack initiation stress and crack damage stress increase with increasing confining pressure, while the effect of confining pressure on crack closure stress is obvious under low confining pressure. When the confining pressure increases to 10 MPa, the crack closure stress tends to be stable. This is mainly due to: there is a limit stress for original cracks and voids inside rock, i.e., when the stress reaches a certain limit, the cracks and voids fully closed. As shown in Supplementary Figure S6B, the normalized characteristic stress (characteristic stress/peak strength) is less affected by confining pressure, and the normalized crack closure stress, crack initiation stress and crack damage stress are stable at about 0.31, 0.65 and 0.81, respectively.
On the basis of the above analysis, the equivalent elastic modulus of sandstone under different confining pressures is used for the subsequent analysis of energy conversion process. It should be pointed out that in the subsequent energy analysis, the calculation of energy takes the hydrostatic stress state as the starting point. Although there is energy dissipation and transformation during the loading process from initial state to hydrostatic stress state, this part of energy is small and does not affect the overall law of energy dissipation and transformation during the process of rock failure. Therefore, this part of energy is not considered in this study.
According to the theory of elasticity, the elastic strain energy depends only on elastic modulus and the final value of external load, and has nothing to do with the loading sequence. Based on the equivalent elastic modulus obtained in section 4, elastic strain energy is calculated according to stress-strain data collected during the CTC experiment, and the results are shown in Figure 7. Under constant confining pressure, elastic strain energy is only affected by elastic modulus and external load. Therefore, the curve of elastic strain energy is similar to the curve of stress. During sandstone deformation and failure process, the elastic strain energy gradually accumulates and increases with increasing external input energy, and reaches the maximum value at the peak strength, namely, the elastic energy storage limit. When the elastic strain energy accumulated inside the rock reaches this limit, the rock will show macroscopic fracture. The greater the energy storage limit of the rock, the less likely it is to be damaged driven by energy. In the post-peak stage, the elastic strain energy decreases as the axial stress decreases. Under the same stress, the elastic strain energy in the post-peak stage is bigger than pre-peak stage, the main reason is that the fractured rock contains a large number of microcracks, the elastic strain energy calculated by the equivalent elastic modulus includes the elastic strain energy accumulated in rock microcracks.
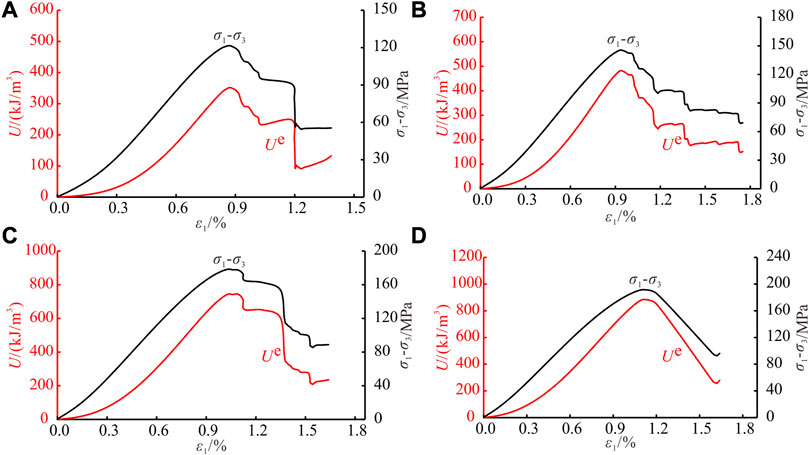
FIGURE 7. Evolution of elastic strain energy under CTC. (A)
In order to analyze the storage characteristics of elastic strain energy in the pre-peak stage, the elastic strain energy storage efficiency
Where,
Figure 8 shows the curve of elastic strain energy storage efficiency under different confining pressure. It can be seen that the elastic strain energy storage efficiency first increases gradually, and reaches the peak at the crack damage stress. After crack damage stress, the elastic strain energy storage efficiency decreases gradually. The comparison of elastic strain energy storage efficiency under different confining pressure shows that the elastic strain energy storage efficiency increases with increasing confining pressure. For example, the peak elastic strain energy storage efficiency increases from 80,000 kJ/m3 under
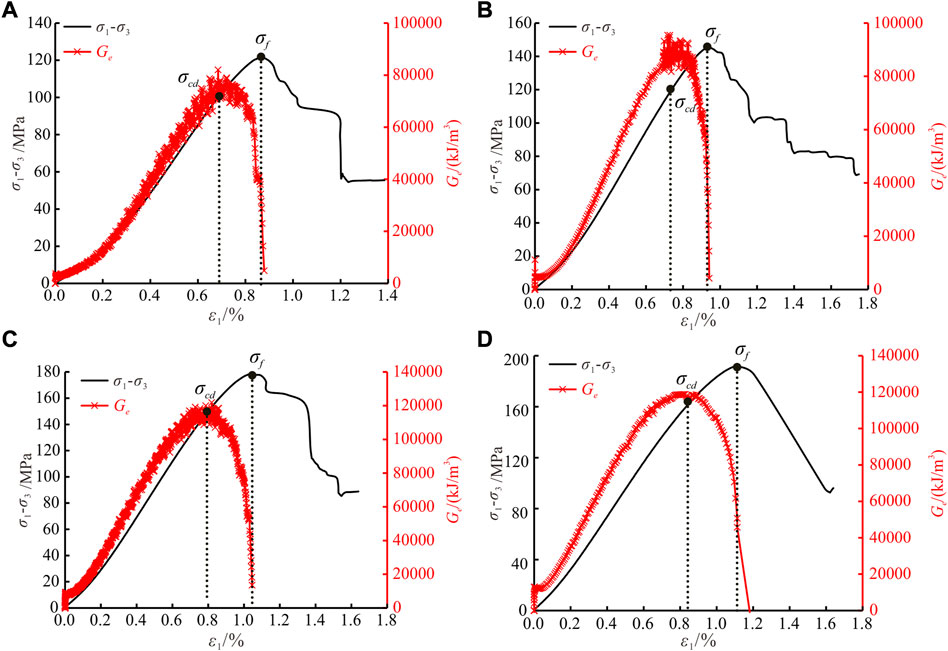
FIGURE 8. The elastic strain energy storage efficiency under CTC. (A)
For sandstone under compression, the process of internal primary microcrack closure, new crack initiation and propagation is always accompanied by energy dissipation, that is, the damage and fracture of rock are driven by energy. Therefore, this section will analyze the characteristics of energy dissipation under different stress states.
Figure 9 shows the curve of energy dissipation under CTC. It can be seen that the dissipated energy increases continuously with the increase of rock deformation. In the pre-peak stage, the dissipated energy is small, and the corresponding curve is relatively gentle and flat, i.e., the damage of rock develops steadily, and there is no sudden release and dissipation of energy. After reaching the peak strength, the dissipated energy increases rapidly with large-scale deformation and macroscopic fracture of rock. Furthermore, the dissipated energy increases suddenly to a certain extent at the stress drop point, i.e., when the local fracture occurs.
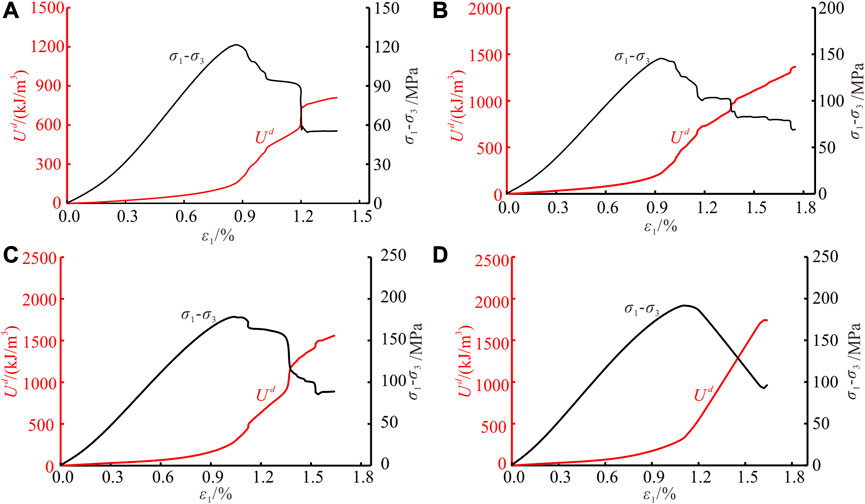
FIGURE 9. The curves of dissipated energy under CTC. (A)
To measure the speed of rock energy dissipation in different loading stages, this study introduces the energy dissipation rate
Where,
Based on the above formula, the energy dissipation rate of rock under CTC is calculated, as shown in Figure 10. It can be seen that the local maximum energy dissipation rate appears at the stress drop point, and the peak energy dissipation rate appears near the peak strength. Outside the peak strength region, the energy dissipation rate is generally at a low level. Therefore, the energy dissipation rate can not only quantify the energy dissipation speed, but also can be used to evaluate the local failure and macroscopic failure of rock.
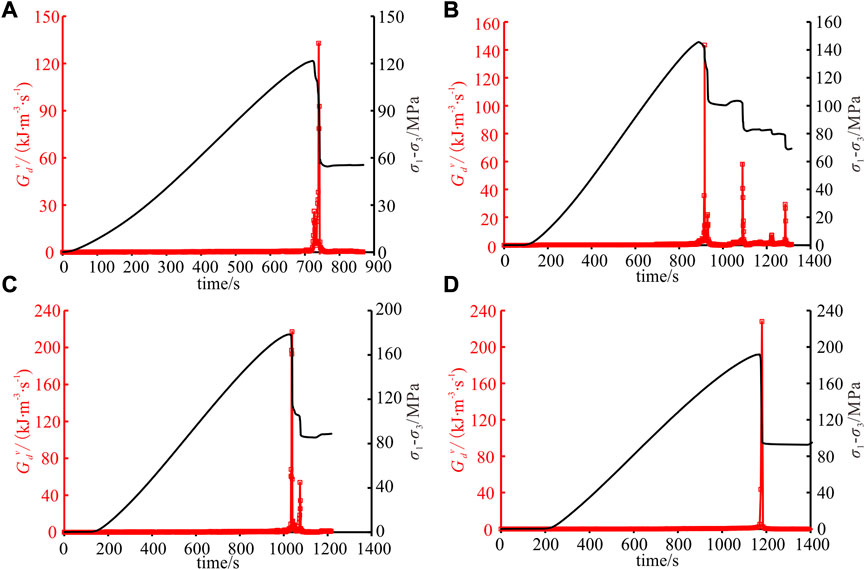
FIGURE 10. Evolution of energy dissipation rate under CTC. (A)
The above analysis demonstrated that high-rate energy dissipation is mainly concentrated near the peak strength, so the dissipated energy near the peak strength is listed in Figure 11. The time = 0 in the figure represents the moment of peak strength, the negative value represents the pre-peak stage and the positive value represents the post-peak stage. Figure 11 shows that the energy dissipation rate presents an obvious hysteresis effect and confining pressure effect.
(1) Hysteresis effect. Before the peak strength, the energy dissipation rate is at a low level. After reaching the peak strength, the energy dissipation rate increases rapidly to a higher level, i.e., the high-rate of energy dissipation lags behind the peak strength. Under CTC, the peak energy dissipation rate usually occurs within 10–30 s after the peak strength.
(2) Confining pressure effect. Before the peak strength, the energy accumulated in the rock increases as the confining pressure increases. After reaching the peak strength, the amount and rate of energy dissipation during the rock failure process increase correspondingly. For example, the peak energy dissipation rate increases from 132.9 kJ m−3·s−1 under
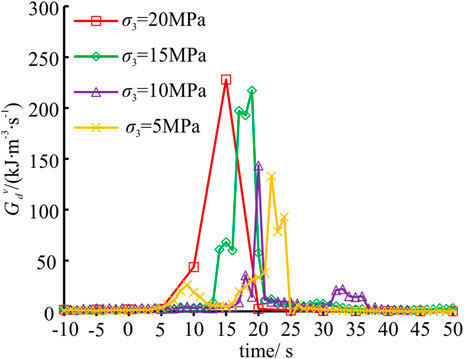
FIGURE 11. Energy dissipation rate near peak strength.
To summarize, energy release and dissipation of rock under load mainly occur in a short time after the peak strength. Under high confining pressure, energy release and dissipation are more sudden and severe, i.e., the engineering rock mass under high confining pressure will be easier to induce dynamic disasters.
During the process of rock deformation and fracture, the dissipation and release of energy are accompanied by elastic waves, namely, acoustic emission (AE). AE can reflect the process of energy dissipation inside rock, and AE energy is a part of dissipated energy. Based on this, this section analyzes the evolution characteristics of dissipated energy and AE count (Grosse and Ohtsu, 2008), as shown in Figure 12.
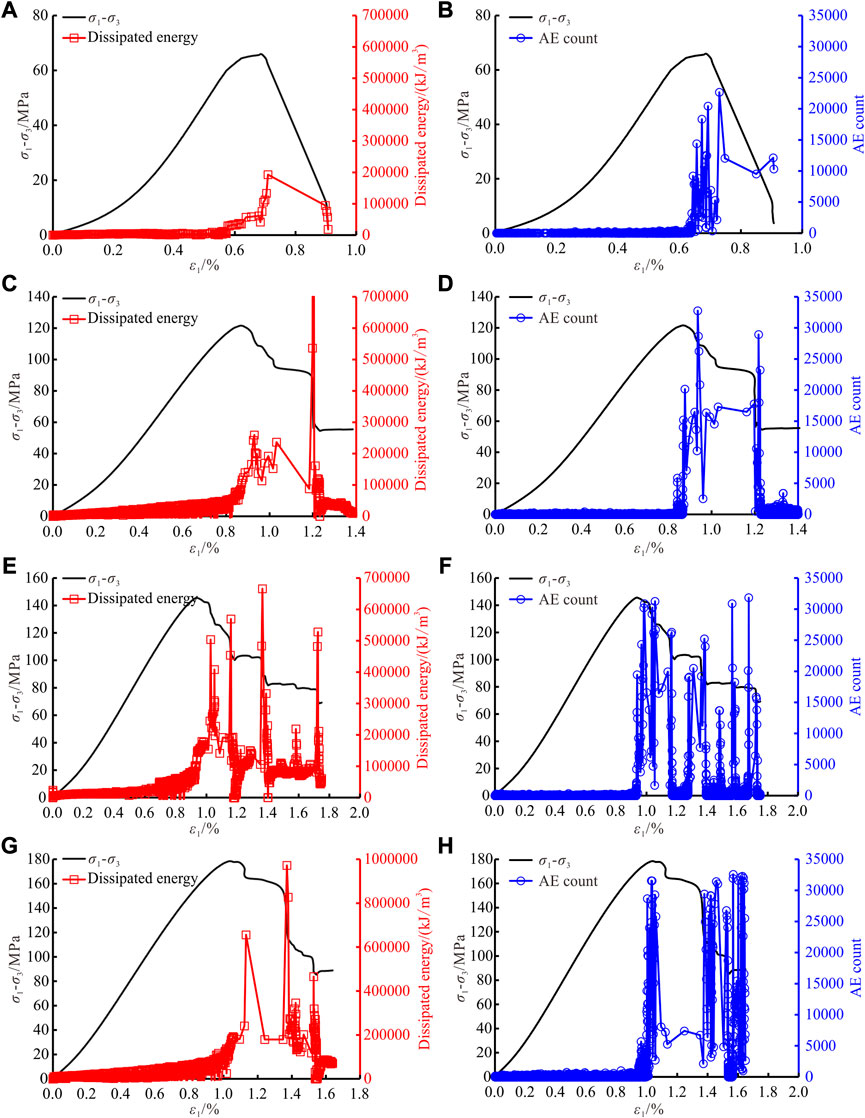
FIGURE 12. Evolution characteristics of dissipated energy and AE count. (A) Dissipated energy under
Figure 12 shows that there is a good correspondence between dissipated energy and AE count, i.e., the sudden increase of AE count corresponds to high dissipation of energy. In the pre-peak stage, the dissipated energy and AE count are both at a low level. Near the peak strength, the dissipated energy and AE count increase rapidly and reach a high level. In the post-peak stage, after the formation of the main fracture surface, cracks continue to initiate, propagate and coalesce, and acoustic emission activities are relatively active. When the local fracture occurs, an obvious stress drop appears with a sudden increase of AE count.
From the perspective of energy dissipation, it can be seen that there are many local maximum energy dissipation points corresponding to stress drop points near and after the peak strength. This is mainly due to the initiation and propagation of secondary fracture surfaces along with the development of principal fracture surface. The initiation and propagation of secondary fracture surfaces will lead to the reduction of rock bearing capacity and the occurrence of stress drop, resulting in a sharp increase of energy dissipation. In addition, there is a confining pressure effect on energy dissipation: the greater the confining pressure, the greater the energy dissipation at the peak strength. For example, the energy dissipation at peak strength increases from 1.9 × 10⁵ kJ/m3 under
Based on the theory of energy balance and elasticity, energy transformation and quantification of energy for sandstone are discussed. In view of elastic strain energy quantification, the reasonable value of elastic modulus in the strain energy formula method is analyzed with reference to the calculation results of the area method, and then the characterization method for equivalent elastic modulus based on elastic strain energy is proposed. Through the CTLU experiments of sandstone under different confining pressure, the fitting quadratic function between equivalent elastic modulus, confining pressure and axial strain is determined. The proposed equivalent elastic modulus is applied to analyze the evolution characteristics of elastic strain energy and energy dissipation. The following main points are concluded from this study.
(1) Taking the secant and tangent modulus of loading and unloading curve as input parameters respectively, the elastic strain energy under different confining pressure is calculated by using the strain energy formula method. Compared with the calculation results of area method, when the tangent modulus of loading curve or unloading curve is used as input parameter, the deviation of elastic strain energy calculated by the strain energy formula method is smaller, but the deviation is still generally higher than 10%.
(2) A characterization method for equivalent elastic modulus based on elastic strain energy is proposed to obtain more accurate calculation of energy when using the strain energy formula method. The elastic strain energy is calculated firstly by the area between the unloading stress-strain curve and the abscissa axis, and then the equivalent elastic modulus under specific confining pressure and axial strain is inversely calculated by using the theoretical calculation formula of elastic strain energy.
(3) The mechanical parameters such as elastic modulus, peak strength and residual strength show an obvious confining pressure effect, that is, they increase with increasing confining pressure. However, there are limit closure stress and limit closure amount. When the confining pressure increases to 10 MPa, the crack closure stress tends to be stable, but the crack initiation stress and crack damage stress increase with increasing confining pressure; The normalized characteristic stress is less affected by the confining pressure, that is, the normalized crack closure stress, crack initiation stress and crack damage stress are stable at about 0.31, 0.65 and 0.81, respectively.
(4) The elastic strain energy storage limit and elastic strain energy storage efficiency increase with increasing confining pressure. The local maximum energy dissipation rate point corresponds to an stress drop, and the peak energy dissipation rate appears near the peak strength. The energy dissipation rate presents hysteresis effect and confining pressure effect, i.e., high energy dissipation mainly occurs in a short time after the peak strength, and rock fracture and energy dissipation are more sudden and severe under high confining pressure.
The original contributions presented in the study are included in the article/Supplementary Material, further inquiries can be directed to the corresponding author.
TQ and XH conceived and designed the study. YW and YD performed the experiments. TQ and XH wrote the original manuscript. XH and YW participated in the data analysis and manuscript modification.
This study was financially supported by the Scientific and technological key project of “Revealing the List and Taking Command” in Heilongjiang Province: Study on geological model and ventilation model of intelligent mining in extremely thin coal seam (2021ZXJ02A03), Intelligent mining demonstration of fully mechanized working face in extremely thin coal seam (2021ZXJ02A04). In addition, this study was also financially supported by the Fundamental Research Funds for the Higher Education Institutions of Heilongjiang Province (2022-KYYWF-0538) and the High Level Introduction of Talent Research Start-up Fund of Heilongjiang University of Science and Technology.
We would like to acknowledge the editors and reviewers for their comments and suggestions.
The authors declare that the research was conducted in the absence of any commercial or financial relationships that could be construed as a potential conflict of interest.
All claims expressed in this article are solely those of the authors and do not necessarily represent those of their affiliated organizations, or those of the publisher, the editors and the reviewers. Any product that may be evaluated in this article, or claim that may be made by its manufacturer, is not guaranteed or endorsed by the publisher.
The Supplementary Material for this article can be found online at: https://www.frontiersin.org/articles/10.3389/feart.2023.1120344/full#supplementary-material
Cai, W., Dou, L. M., Si, G. Y., Cao, A. Y., Gong, S. Y., Wang, G. F., et al. (2019). A new seismic-based strain energy methodology for coal burst forecasting in underground coal mines. Int. J. Rock Mech. Min. Sci. 123, 104086. doi:10.1016/j.ijrmms.2019.104086
Diederichs, M. S., Kaiser, P. K., and Eberhardt, E. (2004). Damage initiation and propagation in hard rock during tunnelling and the influence of near-face stress rotation. Int. J. Rock Mech. Min. Sci. 41 (5), 785–812. doi:10.1016/j.ijrmms.2004.02.003
Ding, Z. W., Jia, J. D., Tang, Q. B., and Li, X. F. (2022). Mechanical properties and energy damage evolution characteristics of coal under cyclic loading and unloading. Rock Mech. Rock Eng. 55, 4765–4781. doi:10.1007/s00603-022-02884-x
Gong, F. Q., and Wang, Y. L. (2022). A new rock brittleness index based on the peak elastic strain energy consumption ratio. Rock Mech. Rock Eng. 55, 1571–1582. doi:10.1007/s00603-021-02738-y
Gong, F. Q., Yan, J. Y., Luo, S., and Li, X. B. (2019). Investigation on the linear energy storage and dissipation laws of rock materials under uniaxial compression. Rock Mech. Rock Eng. 52, 4237–4255. doi:10.1007/s00603-019-01842-4
Gong, F. Q., Zhang, P. L., Luo, S., Li, J. C., and Huang, D. (2021). Theoretical damage characterisation and damage evolution process of intact rocks based on linear energy dissipation law under uniaxial compression. Int. J. Rock Mech. Min. Sci. 146, 104858. doi:10.1016/j.ijrmms.2021.104858
Gong, F. Q., Ni, Y. X., and Ren, L. (2022). Effects of loading rate on rockburst proneness of granite from energy storage and surplus perspectives. Rock Mech. Rock Eng. 55, 6495–6516. doi:10.1007/s00603-022-02990-w
Grosse, C., and Ohtsu, M. (2008). Acoustic emission testing: Basics for research-applications in civil engineering. Berlin Heidelberg: Springer.
Huang, D., and Li, Y. R. (2014). Conversion of strain energy in triaxial unloading tests on marble. Int. J. Rock Mech. Min. Sci. 66, 160–168. doi:10.1016/j.ijrmms.2013.12.001
Jiang, L. S., Kong, P., Zhang, P. P., Shu, J. M., Wang, Q. B., Chen, L. J., et al. (2020). Dynamic analysis of the rock burst potential of a longwall panel intersecting with a fault. Rock Mech. Rock Eng. 53, 1737–1754. doi:10.1007/s00603-019-02004-2
Keneti, A., and Sainsbury, B.-A. (2020). Development of A Semi-Quantitative risk matrix for strain-burst hazard assessment – a numerical modelling approach in the absence of micro-seismic data. Eng. Geol. 279, 105893. doi:10.1016/j.enggeo.2020.105893
Li, Z. Y., Wu, G., Huang, T. Z., and Liu, Y. (2018). Study on shale energy evolution law and strength failure criterion under triaxial cyclic loading. Chin. J. Rock Mech. Eng. 37 (3), 662–670. doi:10.13722/j.cnki.jrme.2017.0927
Liu, X. B., Zhang, Z. Y., Ge, Z. L., Zhong, C. L., and Liu, L. (2021). Brittleness evaluation of saturated coal based on energy method from stress–strain curves of uniaxial compression. Rock Mech. Rock Eng. 54, 3193–3207. doi:10.1007/s00603-021-02462-7
Lu, Z. G., Ju, W. J., Gao, F. Q., Yi, K., and Sun, Z. Y. (2021). Bursting liability index of coal based on nonlinear storage and release characteristics of elastic energy. Chin. J. Rock Mech. Eng. 40 (8), 1559–1569. doi:10.13722/j.cnki.jrme.2020.1204
Meng, Q. B., Liu, J. F., Huang, B. X., Pu, H., Wu, J. Y., and Zhang, Z. Z. (2021). Effects of confining pressure and temperature on the energy evolution of rocks under triaxial cyclic loading and unloading conditions. Rock Mech. Rock Eng. 55, 773–798. doi:10.1007/s00603-021-02690-x
Peng, R. D., Ju, Y., Wang, J. G., Xie, H. P., Gao, F., and Mao, L. T. (2014). Energy dissipation and release during coal failure under conventional triaxial compression. Rock Mech. Rock Eng. 48 (2), 509–526. doi:10.1007/s00603-014-0602-0
Qiao, L., Hao, J. W., Liu, Z. Y., Li, Q. W., and Deng, N. F. (2022). Influence of temperature on the transformation and self-control of energy during sandstone damage: Experimental and theoretical research. Int. J. Min. Sci. Technol. 32, 761–777. doi:10.1016/j.ijmst.2022.02.008
Qin, T., Duan, Y. W., Sun, H. R., Wang, L., and Liu, H. L. (2020). Mechanical characteristics and energy dissipation characteristics of sandstone under triaxial stress conditions. J. China Coal Soc. 45 (S1), 255–262. doi:10.13225/j.cnki.jccs.2019.1393
Shirani Faradonbeh, R., Taheri, A., and Karakus, M. (2021). Failure behaviour of a sandstone subjected to the systematic cyclic loading: Insights from the double-criteria damage-controlled test method. Rock Mech. Rock Eng. 54, 5555–5575. doi:10.1007/s00603-021-02553-5
Tu, Q. Y., Cheng, Y. P., Xue, S., Ren, T., and Cheng, X. (2021). Energy-limiting factor for coal and gas outburst occurrence in intact coal seam. Int. J. Min. Sci. Technol. 31 (4), 729–742. doi:10.1016/j.ijmst.2021.05.009
Wang, F. T., Liang, N. N., and Li, G. (2019). Damage and failure evolution mechanism for coal pillar dams affected by water immersion in underground reservoirs. Geofluids 2019, 2985691–2985712. doi:10.1155/2019/2985691
Wang, A. W., Gao, G. S., Pan, Y. S., Song, Y. M., and Li, L. (2021). Impact liability and energy dissipation of prefabricated borehole coal samples. J. China Coal Soc. 46 (3), 959–972. doi:10.13225/j.cnki.jccs.2020.1364
Xiao, P., Li, D. Y., Zhao, G. Y., and Liu, H. X. (2021). New criterion for the spalling failure of deep rock engineering based on energy release. Int. J. Rock Mech. Min. Sci. 148, 104943. doi:10.1016/j.ijrmms.2021.104943
Xie, H. P., Li, L. Y., Peng, R. D., and Ju, Y. (2009). Energy analysis and criteria for structural failure of rocks. J. Rock Mech. Geotechnical Eng. 1 (1), 11–20. doi:10.3724/SP.J.1235.2009.00011
Xu, L., Gong, F. Q., and Liu, Z. X. (2021). Experiments on rockburst proneness of pre-heated granite at different temperatures: Insights from energy storage, dissipation and surplus. J. Rock Mech. Geotechnical Eng. 14 (5), 1343–1355. doi:10.1016/j.jrmge.2021.08.004
Zhang, Y., Feng, X. T., Zhang, X. W., Wang, Z. F., Sharifzadeh, M., and Yang, C. X. (2019). A novel application of strain energy for fracturing process analysis of hard rock under true triaxial compression. Rock Mech. Rock Eng. 52, 4257–4272. doi:10.1007/s00603-019-01868-8
Keywords: characterization method, equivalent elastic modulus, elastic strain energy, energy dissipation, sandstone
Citation: Qin T, Wang Y, Hou X and Duan Y (2023) A characterization method for equivalent elastic modulus of rock based on elastic strain energy. Front. Earth Sci. 11:1120344. doi: 10.3389/feart.2023.1120344
Received: 09 December 2022; Accepted: 08 February 2023;
Published: 16 February 2023.
Edited by:
Fangtian Wang, China University of Mining and Technology, ChinaReviewed by:
Anxiu Liu, Taiyuan University of Technology, ChinaCopyright © 2023 Qin, Wang, Hou and Duan. This is an open-access article distributed under the terms of the Creative Commons Attribution License (CC BY). The use, distribution or reproduction in other forums is permitted, provided the original author(s) and the copyright owner(s) are credited and that the original publication in this journal is cited, in accordance with accepted academic practice. No use, distribution or reproduction is permitted which does not comply with these terms.
*Correspondence: Xiangang Hou, eGlhbmdhbmdob3VAMTI2LmNvbQ==
Disclaimer: All claims expressed in this article are solely those of the authors and do not necessarily represent those of their affiliated organizations, or those of the publisher, the editors and the reviewers. Any product that may be evaluated in this article or claim that may be made by its manufacturer is not guaranteed or endorsed by the publisher.
Research integrity at Frontiers
Learn more about the work of our research integrity team to safeguard the quality of each article we publish.