- 1State Key Laboratory of Petroleum Resources and Prospecting, China University of Petroleum, Beijing, China
- 2College of Mechanical Engineering, Xi’an Shiyou University, Xi’an, Shannxi, China
- 3Xi’an Qing’an Electrical Control Co., Ltd, Xi’an, Shannxi, China
Unlike normal-pressure gas wells, wellbore instability is more likely to occur during testing for high-pressure gas wells. Gas acceleration effect exists in gas flow during high-pressure gas well testing, which was ignored in previous wellbore instability analysis. In this paper, the developments of effective circumferential stress and effective radial stress are analyzed in the near-wellbore area of high-pressure gas well, considering the influence of in-situ stress non-uniformity and acceleration effect. To analyze the effective circumferential stress and the effective radial stress more accurately, it is established that the fluid-structure coupling stress field of the finite large thick wall cylinder The flow field considers three cases, namely Darcy’s law, Darcy–Forchheimer model and Darcy-Forchheime model considering gas acceleration. The results show that in-situ stress non-uniformity has a similar influence on tensile failure and shear failure. It is observed that the location of occurring shear failure and tensile failure may not be on the wellbore wall. When the formation fluid is under abnormally high pressure, it is more likely to have a tensile failure, while when the formation fluid is under abnormally low pressure, it is more likely to have a shear failure. The Biot parameter has the same effect on tensile failure and shear failure. These results are helpful to control sand production during testing and production for high-pressure gas wells.
1 Introduction
High-pressure gas reservoirs are characterized by natural fractures, high formation pressure and large variation of a production pressure difference which is on account of depletion production. In the process of gas test production, the non-Darcy characteristic of high speed is the prominent characteristic of high-pressure gas flow, which is not only manifested in the inertial resistance, but also in the significant gas acceleration effect induced by the rapid expansion of the gas volume (Jin et al., 2011a; Chen et al., 2011; Jin et al., 2012). The characteristic makes the spatio-temporal evolution of gas pressure more complex (Jin et al., 2019; Zhang et al., 2021; Hou et al., 2022a; Zhang et al., 2022). Traditionally, the inertial effect of near-wellbore gas flow is simply expressed by adding the Forchheimer inertial drag to Darcy’s Law. However, this description of the inertial effects of compressible fluid flows is incomplete. Wooding (1957) might be the first to add an accelerated-inertial term to the gas momentum equation. The model with the accelerated-inertial term has been discussed in detail for a high-speed compressible flow in porous media (Nield, 1994; Levy et al., 1995; Chang and Hou, 2022). Jiang et al. (2015a; 2015b; 2015c; 2016) finds the reason why the gas acceleration effect was ignored in the past literature and analyzes the importance of the gas acceleration effect in detail. Jin et al. (2011b) establishes a plane radial model considering the acceleration effect and presents a method for quantitative evaluation of the gas acceleration effect. Tensile stress is easy to form in the surrounding rock stress of the wellbore wall considering the acceleration effect by analyzing the fluid-structure coupling stress equation in the infinite thick-walled cylinder. The relationship of effective radial stress under different seepage models is not pointed out. Wellbore instability failure is usually divided into two categories, one is a shear failure, and the other is a tension failure. The current research focuses on shear failure (Zhao et al., 2021; Hou et al., 2022b; Hou et al., 2022c; Warsitzka et al., 2022), while the strength of extension is frequently used in analyzing tensile failure for wellbore instability during testing and production (Tan et al., 2021; Hou et al., 2022d; Sun et al., 2022; Hou et al., 2022e; Huang et al., 2023).
In this paper, we investigate the properties of near-wellbore stress using a set of equations that is built in the finite thick-walled cylinder in the non-uniform in-situ stress field. It is proved that the acceleration effect increases the possibility of tensile and shear failure. It is shown that the two types of failure do not necessarily occur on the wellbore wall. It is also shown that when the formation fluid is under abnormally high pressure, it is more likely to have a tensile failure, while when the formation fluid is under abnormally low pressure, it is more likely to have a shear failure. The Biot parameter has the same effect on tensile failure and shear failure.
2 Wellbore stress distributions in the finite large thick wall cylinder model
The stratum is assumed to be a uniform isotropic, linear elastic porous material, and the surrounding rock is considered to be in a plane strain state.
where
When
where
The dimensionless effective stress distributions are:
where
3 Analysis of the influence of acceleration effect on the wellbore stress
The traditional Darcy–Forchheimer model is not suitable for characterizing the flow of high-pressure gas into the well, so the acceleration effect of gas should be considered (Jin et al., 2011; Chen et al., 2011; Jin et al., 202). The acceleration effect of near-wellbore gas can be characterized by the dimensionless quantity
1) With the decrease of bottomhole pressure, there is a maximum mass flow rate of fluid into the well,
2) The gas pressure gradient of the three flow models which are Darcy’s law, the Darcy-Forchheime model and the Darcy-Forchheime model considering gas acceleration has the following relation when the mass flow is the same. The subscript AC stands for the Darcy-Forchheime model considering gas acceleration, DF is the Darcy-Forchheime model, and D points to Darcy’s law.
3) Under the same mass flow rate, the bottomhole pressure of the three models has the following relationship.
3.1 Comparative analysis of effective radial stress
Jin et al. (2011b) believed that the effective radial stress in the near-wellbore zone is more likely to change into tensile stress after considering the acceleration effect, but he did not give the relative size for the effective radial stress of the three flow models. To facilitate the analysis of this relationship, the inhomogeneity of in-situ stress is ignored, i.e., B=0, and the Biot parameter is equal to 1. According to Eq. 3,
The derivative of effective radial stress for Darcy’s law is:
where
The derivative of effective radial stress for the Darcy–Forchheimer model can be given by
where
The derivative of effective radial stress for the Darcy–Forchheimer model considering gas acceleration becomes
The difference in derivative of effective stress on the wellbore between Darcy’s law and Darcy–Forchheimer model with the same mass flow rate is:
where,
We can obtain
The given distance
The difference in derivative of effective stress on the wellbore between Darcy–Forchheimer model and Darcy–Forchheimer model considering gas acceleration with the same mass flow rate is:
where
We can find
As well, the given distance
Combining equation 11 and 12, we can get
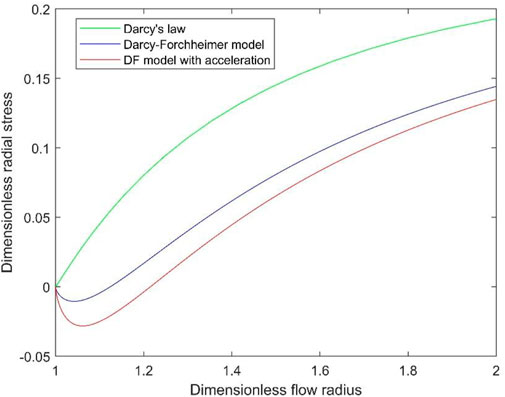
It is quite clear that
Effective radial stress near the wellbore must be a negative value when
According to Equations 7 and 8 and 9, we can obtain
To better observe the variation in tensile stress, a case is presented. The mass flow rate,
3.2 Difference between effective circumferential stress and effective radial stress
For the convenience of comparative analysis, the inhomogeneity of in-situ stress is not considered here, and the Biot parameter is assumed to be one.
From Equation 2, we can conclude that
where
When the mass flow rates of the three flow models are the same, the wellbore pressure can be written as
Because the effective radial stresses on the wellbore for the three flow models are zero, it can be obtained that
It is quite clear that Equation 13 is correct, even if
When
As long as
To better observe the variation in the difference between effective circumferential stress and effective radial stress, a case is presented. When the other parameters are set to
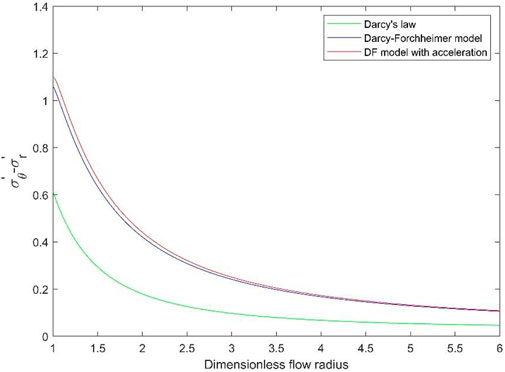
FIGURE 2. Difference between effective circumferential stress and effective radial stress for the three flow models.
4 Analysis of the influence of in situ stress on the wellbore stress
4.1 Comparative analysis of effective radial stress
Since
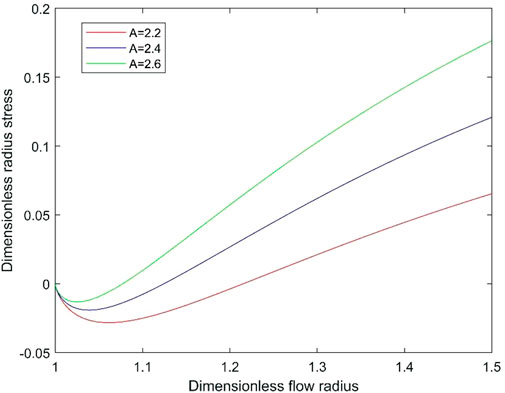
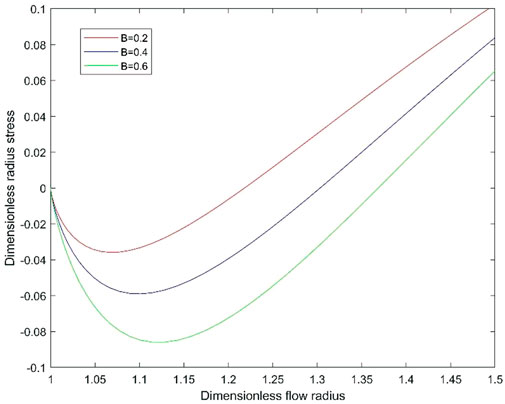
We plot the effective radial stress for
Thus,
In Figure 4, we plot the effective circumferential stress for
4.2 Difference between effective circumferential stress and effective radial stress
From Equation 3, the difference between effective circumferential stress and effective radial stress in the acceleration flow is given by
It is obvious that
The parameters in Figure 5 are the same as that in Figure 3. When A=2.0, the maximum stress is 0.9014 at r=1.0142. When A=2.4, when r= 1.0036, the value,
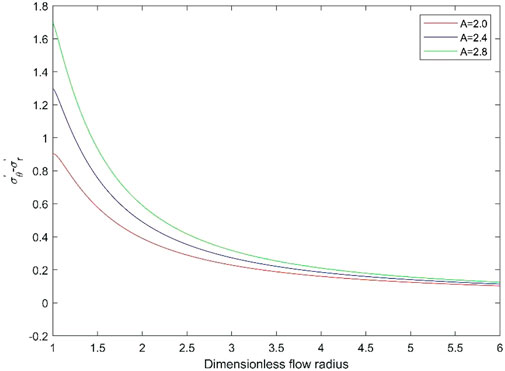
FIGURE 5. Difference between effective circumferential stress and effective radial stress in the acceleration flow for various A.
It can be written as
When
In Figure 6, we plot the difference between effective circumferential stress and effective radial stress in the acceleration flow for
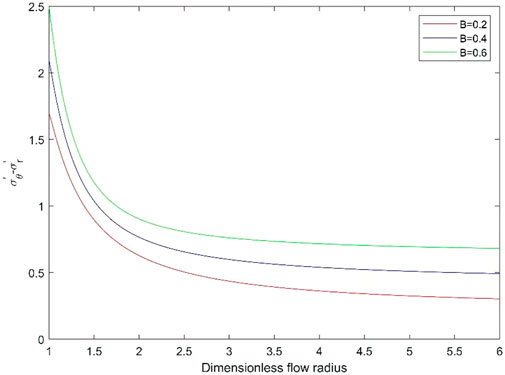
FIGURE 6. Difference between effective circumferential stress and effective radial stress in the acceleration flow for various B.
5 Wellbore stability of uncased hole in the high-pressure gas wells
5.1 Tensile fracture
According to the analysis in section 3.1 of this paper, when the stress of the surrounding rock near the wellbore reaches the tensile strength, the acceleration flow requires less mass flow than the Darcy model and the Darcy-Forhheimer model, that is, the surrounding rock near the wellbore is the first to fail in the s acceleration flow. According to the analysis in section 4.1 of this paper, tensile failure occurs first in the surrounding rock near the wellbore in the direction of maximum horizontal principal stress.
We will assume the Biot parameter
The critical bottomhole pressure,
5.2 Shear failure
It is assumed that the shear failure of rock follows the weak surface failure criterion (Zeng et al., 2021). The Mohr-Coulomb failure criterion for
where
Only the case is discussed where
Thus, when r=1, Equation 13 can be written as
Thus,
The critical bottomhole pressure is proportional to the Biot parameter, that is, when the Biot parameter increases, the mass flow required for shear failure decreases. When the Biot parameter increases, the effective radial stress decreases, the tensile stress increases and the required pore pressure gradient decreases. In other words, when the Biot parameter increases, the mass flow rate required for tensile failure decreases. Therefore, the Biot parameter has the same effect on tensile failure and shear failure.
6 Conclusion
Considering the dual effects of non-uniformity of in-situ stress and acceleration effect in the process of seepage, the stress state of surrounding rock suitable for high-pressure gas well and its influence on tensile failure and shear failure in the process of gas test of the high-pressure gas well are analyzed, and the following conclusions are as following.
1) Considering the acceleration effect, the difference between effective circumferential stress and effective radial stress at any flow radius is larger than that in the other two flow models, which is more likely to cause shear failure. The difference between the effective circumferential stress and the effective radial stress does not reach the maximum value at the wellbore wall.
2) The pore pressure gradient plays a decisive role in the effective radial stress. Considering the acceleration effect, the minimum effective radial stress is smaller than that of the other two flow models, which is more likely to lead to tensile failure. The conditional expression of tensile stress generation considering the non-uniformity of in-situ stress is given.
3) The influence of Biot parameter on tensile failure and shear failure is the same.
Data availability statement
The original contributions presented in the study are included in the article/supplementary material, further inquiries can be directed to the corresponding author.
Author contributions
HJ and MC contributed to conception and design of the study. CH organized the database. XL performed the statistical analysis. YZ wrote the first draft of the manuscript. All authors contributed to manuscript revision, read, and approved the submitted version.
Funding
This study is supported by the Open Fund (Program No. PRP/open-2009) of State Key Laboratory of Petroleum Resources and Prospecting, National Natural Science Foundation of China (Grant No. 52104005), Natural Science Basic Research Plan in Shaanxi Province of China (Program No. 2021JM-407), Key Research and Development Program of Shaanxi Province (grant number 2023-YBGY-312).
Conflict of interest
Author CH was employed by the company Xi’an Qing’an Electrical Control Co., Ltd., China.
The remaining authors declare that the research was conducted in the absence of any commercial or financial relationships that could be construed as a potential conflict of interest.
Publisher’s note
All claims expressed in this article are solely those of the authors and do not necessarily represent those of their affiliated organizations, or those of the publisher, the editors and the reviewers. Any product that may be evaluated in this article, or claim that may be made by its manufacturer, is not guaranteed or endorsed by the publisher.
References
Chang, Z., and Hou, B. (2022). Numerical simulation on cracked shale oil reservoirs multi-cluster fracturing under inter-well and inter-cluster stress interferences. Rock Mech. Rock Eng. In Press. doi:10.1007/s00603-022-03145-7
Chen, K. P. (2011). A new mechanistic model for prediction of instantaneous coal outbursts—dedicated to the memory of prof. Daniel D. Joseph. Int. J. Coal Geol. 87 (2), 72–79. doi:10.1016/j.coal.2011.04.012
Fjaer, E., Holt, R. M., Horsrud, P., Raaen, A. M., and Risnes, R. (2008). Petroleum related rock mechanics. 2nd ed. Amsterdam: Elsevier.
Hou, B., Chang, Z., and Wu, A. (2022b). Simulation of competitive propagation of multi-fractures on shale oil reservoir multi-clustered fracturing in Jimsar sag. Acta Pet. Sin. 43 (01), 75–90. doi:10.7623/xyxb202201007
Hou, B., Cui, Z., Ding, J. H., Zhang, F. S., Zhuang, L., and Elsworth, D. (2022a). Perforation optimization of layer-penetration fracturing for commingling gas production in coal measure strata. Petroleum Sci. 19 (4), 1718–1734. doi:10.1016/j.petsci.2022.03.014
Hou, B., and Cui, Z. (2022e). Vertical fracture propagation behavior upon supercritical carbon dioxide fracturing of multiple layers. Eng. Fract. Mech., 108913. In Press. doi:10.1016/j.engfracmech.2022.108913
Hou, B., Dai, Y., Fan, M., Zhang, K., Wick, T., and Lee, S. (2022c). Numerical simulation of pores connection by acid fracturing based on phase field method. Acta Pet. Sin. 43 (6), 849–859. doi:10.7623/syxb202206009
Hou, B., Zhang, Q., Liu, X., Pang, H., and Zeng, Y. (2022d). Integration analysis of 3D fractures network reconstruction and frac hits response in shale wells. Energy 260, 124906. doi:10.1016/j.energy.2022.124906
Huang, L., He, R., Yang, Z., Tan, P., Chen, W., Li, X., et al. (2022). Exploring hydraulic fracture behavior in glutenite formation with strong heterogeneity and variable lithology based on DEM simulation. Eng. Fract. Mech. 278, 109020. doi:10.1016/j.engfracmech.2022.109020
Jiang, H., Chen, M., Jin, Y., and Chen, K. P. (2015a). Analytical modeling of acceleration-induced conductivity damage in a propped hydraulic fracture of a high-pressure gas well. J. Nat. Gas Sci. Eng. 26, 185–192. doi:10.1016/j.jngse.2015.06.019
Jiang, H., Chen, M., Jin, Y., and Chen, K. P. (2015c). Gas expansion-induced acceleration effect of a highly compressible gas flow in porous media. J. Porous Media 18 (8), 825–834. doi:10.1615/jpormedia.v18.i8.70
Jiang, H., Chen, M., Jin, Y., and Chen, K. P. (2015b). Importance of gas acceleration near the wellbore in radial compressible porous media flows for a vertical gas well. Transp. Porous Media 110 (1), 127–140. doi:10.1007/s11242-015-0559-9
Jiang, H., Dou, Y., Xi, Z., Chen, M., and Jin, Y. (2016). Microscopic choked flow for a highly compressible gas in porous media. J. Nat. Gas Sci. Eng. 35, 42–53. doi:10.1016/j.jngse.2016.08.039
Jin, Y., Chen, K. P., and Chen, M. (2011b). Development of tensile stress near a wellbore in radial porous media flows of a high pressure gas. Int. J. Rock Mech. Min. Sci. 48 (8), 1313–1319. doi:10.1016/j.ijrmms.2011.09.013
Jin, Y., Chen, K. P., Chen, M., and Grapsas, N. (2012). Gas expansion-induced acceleration effect in high-pressure gas flows near a wellbore. J. porous media 15 (4), 317–328. doi:10.1615/jpormedia.v15.i4.20
Jin, Y., Chen, K. P., Chen, M., Grapsas, N., and Zhang, F. X. (2011a). Short-time pressure response during the start-up of a constant-rate production of a high pressure gas well. Phys. Fluids 23 (4), 043101. doi:10.1063/1.3571494
Jin, Y., and Chen, K. P. (2019). Fundamental equations for primary fluid recovery from porous media. J. Fluid Mech. 860, 300–317. doi:10.1017/jfm.2018.874
Levy, A., Sorek, S., Ben-Dor, G., and Bear, J. (1995). Evolution of the balance equations in saturated thermoelastic porous media following abrupt simultaneous changes in pressure and temperature. Transp. Porous Media 21 (3), 241–268. doi:10.1007/BF00617408
Nield, D. A. (1994). Modelling high speed flow of a compressible fluid in a saturated porous medium. Transp. porous media 14 (1), 85–88. doi:10.1007/BF00617029
Sun, S., Wang, J., Le, H., Fan, H., and Wang, W. (2022). Experimental and numerical investigation on compressive strength and crack behavior of rock-like specimens with open flaws under confining loads. Front. Earth Sci. 10. doi:10.3389/feart.2022.972194
Tan, P., Jin, Y., and Pang, H. (2021). Hydraulic fracture vertical propagation behavior in transversely isotropic layered shale formation with transition zone using XFEM-based CZM method. Eng. Fract. Mech. 248, 107707. doi:10.1016/j.engfracmech.2021.107707
Warsitzka, M., Kukowski, N., and May, F. (2022). Patterns and failure modes of fractures resulting from forced folding of cohesive caprocks–comparison of 2D vs. 3D and single-vs. Multi-layered analog experiments. Front. Earth Sci. 10. doi:10.3389/feart.2022.881134
Wooding, R. (1957). Steady state free thermal convection of liquid in a saturated permeable medium. J. Fluid Mech. 2 (3), 273–285. doi:10.1017/S0022112057000129
Zeng, Y., Jiang, H., Ding, S., Chen, J., Wang, Y., and Zheng, J. (2021). Analytical and experimental investigations on mechanical properties of weak plane bedding in mudstone. Geofluids 2021, 5408701–5408705. doi:10.1155/2021/5408701
Zhang, Q., Hou, B., Lin, B., Liu, X., and Gao, Y. (2021). Integration of discrete fracture reconstruction and dual porosity/dual permeability models for gas production analysis in a deformable fractured shale reservoir. J. Nat. Gas Sci. Eng. 93, 104028. doi:10.1016/j.jngse.2021.104028
Zhang, W., Xue, X., Zhang, C., Qu, Y., Ke, K., Pan, S., et al. (2022). A drilling wellbore pressure calculation model considering the effect of gas dissolution and suspension. Front. Earth Sci. 10. doi:10.3389/feart.2022.993876
Keywords: acceleration effect, non-uniform in situ stress, wellbore instability, tensile failure, shear failure
Citation: Jiang H, Chen M, Hua C, Li X and Zhang Y (2023) Analysis of influencing factors on wellbore instability for high-pressure gas well during testing and production. Front. Earth Sci. 11:1119946. doi: 10.3389/feart.2023.1119946
Received: 09 December 2022; Accepted: 10 January 2023;
Published: 25 January 2023.
Edited by:
Peng Tan, CNPC Engineering Technology R & D Company Limited, ChinaReviewed by:
Xian Shi, China University of Petroleum, Huadong, ChinaHao Yang, China University of Geosciences, China
Zhang Yan, Yangtze University, China
Copyright © 2023 Jiang, Chen, Hua, Li and Zhang. This is an open-access article distributed under the terms of the Creative Commons Attribution License (CC BY). The use, distribution or reproduction in other forums is permitted, provided the original author(s) and the copyright owner(s) are credited and that the original publication in this journal is cited, in accordance with accepted academic practice. No use, distribution or reproduction is permitted which does not comply with these terms.
*Correspondence: Mian Chen, Y2hlbm1AY3VwLmVkdS5jbg==
 Hailong Jiang1,2
 Mian Chen