 Emmanuel A. Njinju
 Max Moorkamp
 D. Sarah Stamps
- 1Department of Geosciences, Virginia Tech, Blacksburg, VA, United States
- 2Department of Earth and Environmental Sciences, Ludwig Maximilians University of Munich, Munich, Germany
Density perturbations in the subsurface are the main driver of mantle convection and can contribute to lithospheric deformation. However, in many places the density structure in the subsurface is poorly constrained. Most geodynamic models rely on simplified equations of state or use linear seismic velocity perturbations to density conversions. In this study, we investigate the density structure beneath the Rungwe Volcanic Province (RVP), which is the southernmost volcanic center in the Western Branch of the East African Rift (EAR). We use shear-wave velocity perturbations (
1 Introduction
Geodynamic models suggest the interaction of buoyancy-driven mantle convection and plate tectonics. In fact, large-scale topography features on Earth depend on density variations in the upper mantle (Steinberger, 2016) and buoyancy of the lithosphere due to thermochemical heterogeneities (Kelly et al., 2003; Lee et al., 2005; Shulgin and Artemieva, 2019) contribute to the long stability of cratons over geological times (Lee et al., 2005; Eaton and Claire Perry, 2013). Despite the importance of subsurface density structure in mantle convection and lithospheric deformation, the density structure in the subsurface is poorly constrained. Gravity and seismic techniques are the two main methods employed to investigate the density structure in the subsurface (e.g., Darbyshire et al., 2000; Vacher and Souriau, 2001; Tondi et al., 2012; Deng et al., 2014; Kaban et al., 2016). However, there is intrinsic non-uniqueness in gravity modeling, thus the solutions need to be constrained, which introduces uncertainties in the final model. For example, due to the expected high heterogeneity in the crust, it is assumed that short wavelength features in the gravity field generally have a crustal origin while long wavelength anomalies have a deeper source. On the other hand, tomography models provide increasingly detailed images of the seismic velocity structure of the upper mantle.
In order to quantitatively investigate the implications of existing tomography models for the dynamics of the upper mantle, most geodynamic models use simple conversions of seismic velocity perturbations to density anomalies through the design of a conversion factor (e.g. Karato and Wu, 1993; Becker, 2006; Conrad and Lithgow-Bertelloni, 2006; Steinberger and Calderwood, 2006; Conrad et al., 2007; Karato, 2008; Conrad and Behn, 2010; Ghosh et al., 2010; 2017; Wang et al., 2015; Liu and Zhong, 2016; Adam et al., 2021). Previous studies assume a positive constant value for this factor for the entire mantle (e.g., Becker, 2006; Conrad and Lithgow-Bertelloni, 2006; Conrad et al., 2007; Conrad and Behn, 2010; Ghosh et al., 2010; 2017; Wang et al., 2015; Liu and Zhong, 2016). For example, Becker (2006), Conrad and Lithgow-Bertelloni (2006), and Conrad and Behn (2010) use a conversion factor between shear velocity anomalies and density anomalies of 0.15, while Ghosh et al. (2010, 2017) and Wang et al. (2015) assume a conversion factor of 0.25. Some studies consider the mineral physics approach of Stixrude and Lithgow-Bertelloni (2005a, 2005b, 2007, 2011) to derive depth-dependent values for the conversion factor typically varying between 0.2 and 0.4 (e.g., Steinberger and Calderwood, 2006; Adam et al., 2021). Other studies determine the conversion factor through laboratory experiments to range between 0.2 and 0.4 (Karato and Wu, 1993; Steinberger and Calderwood, 2006; Karato, 2008). An important observation is that these cited studies all derive positive values for the conversion factor, which implies that every positive velocity perturbation will convert to positive density anomalies and vice versa, which is not always true in nature. For example, the ultra-low velocity zones (ULVZs) at the core-mantle boundary have extremely low seismic velocities but have higher density than their surroundings in order to remain stable on the core-mantle boundary. Another example is given by cratonic keels, which are mostly characterized by negative density anomalies due to compositional effects (e.g., Kaban et al., 2003; 2016; this study) and by very high seismic velocities due to low temperatures.
In this study, we investigate the density structure beneath the Rungwe Volcanic Province (RVP; Figure 1A, B) and surroundings, which is the southernmost volcanic center in the magma-poor Western Branch of the East African Rift (Figure 1A). The RVP lies within the Ubendian-Usagaran mobile belts that circumvent the thick lithosphere of the Tanzanian and Bangweulu cratons (Figure 1B; e.g.; Corti et al., 2007; Fritz et al., 2013) and consists of three large volcanoes, Ngozi, Rungwe, and Kyejo, that were last active about 500 years ago (Fontijn et al., 2010; black triangles; Figure 1B). Magmatism in the RVP is highly localized with past eruptions covering ∼1,500 km2 (Figure 1B; Ebinger et al., 1989; 1997; Fontijn et al., 2012). 40Ar/39Ar radiometric dating of samples from the RVP suggest that magmatism in the RVP started by 19 Ma (Mesko et al., 2014; Mesko, 2020) and possibly as early as ∼25 Ma (Roberts et al., 2012) which predates rifting in the northern Malawi Rift at ∼8.6 Ma (Ebinger et al., 1993). These ages suggest that magmatism in the RVP might have played an important role in thermally weakening the lithosphere, thereby facilitating rifting.
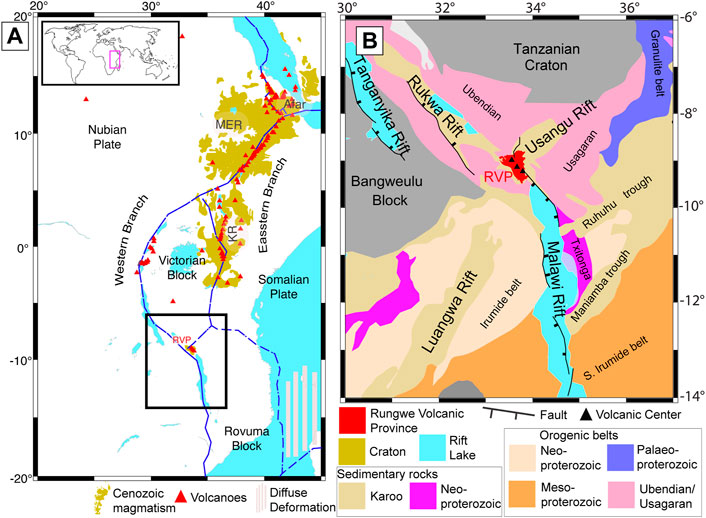
FIGURE 1. (A). Map of the East African Rift (EAR) showing the Eastern and Western Branches. The Western Branch of the EAR has fewer volcanic centers (red triangles are Holocene volcanoes) than the Eastern Branch. The Holocene volcanoes are from the Smithsonian Global Volcanism Program (Global Volcanism Program, 2013). The Cenozoic volcanic rocks (yellow) are outlined after Thiéblemont et al., 2016 and indicate the large igneous province (LIP) in East Africa. RVP = Rungwe Volcanic Province. KR = Kenyan Rift. MER = Main Ethiopian Rift. The black rectangle shows the location of Figure 1B. Dashed blue lines represent plate boundaries from Stamps et al. (2008). The inset map shows the relative location of part of the EAR (pink rectangle) on Earth. The diffuse deformation offshore of the Eastern Branch is based on geodetic study by Stamps et al. (2021). (B). Map of major terranes and geological features in the southern part of the Western Branch of the EAR that are based on Fritz et al. (2013). The major rift faults are extracted from Muirhead et al. (2019). Black triangles from north to south represent the three large active volcanoes (Ngozi, Rungwe and Kyejo; Harkin, 1962; Fontijn et al., 2010) of the RVP.
A number of previous studies have been conducted to investigate the crustal and upper mantle structures beneath the RVP and surrounding using controlled-source seismic (lake-bottom seismometers), body and surface wave tomography, receiver function stacking and from the analysis of gravity and aeromagnetic data (O’Donnell et al., 2013; Accardo et al., 2017; Grijalva et al., 2018; Njinju et al., 2019a; Njinju et al.; 2019b; Emry et al., 2019). O’Donnell et al. (2013) used Rayleigh wave phase velocities to invert for a 3-D shear wave velocity model and observed pronounced velocity lows beneath the RVP. Grijalva et al. (2018) used P and S wave seismic tomography to also image the low velocity zones (LVZ) beneath the RVP and the northern Malawi Rift and interpret it to represent the flow of warm, mantle superplume upwelling from the southwest, beneath, and around the thick lithosphere of the Bangweulu Cratonic Block. Although the source of these LVZs still remains enigmatic, their presence suggests density perturbations beneath the RVP and surroundings. Lateral and vertical variability of in situ density structure beneath the RVP may be inferred from a joint inversion of seismic and gravity data (Forte and Claire Perry, 2000; Deschamps et al., 2002; Tondi et al., 2012), however, the main limitation is the non-uniqueness of the relationship between seismic velocities and density (Barton, 1986; Deschamps et al., 2001; Lee, 2003; Brocher, 2005).
We use shear-wave velocity perturbations (
2 Input data and reference model
2.1 Gravity data
In this study, we use the Bouguer gravity data extracted from the Experimental Global Gravity Field Model (XGM 2016; Pail et al., 2018) which is publicly available via the International Center for Global Earth Models (ICGEM) website (http://icgem.gfz-potsdam.de/tom_longtime). XGM2016 is a combination of satellite gravity information and terrestrial gravity data parameterized as a spherical harmonic series expansion resolved to degree and order (d/o) 719, which is the maximum resolution supported by the 15’ × 15’ terrestrial gravity grid with an application of a regionally dependent weighting strategy in order to cope with the varying data quality of the ground data. The terrestrial gravity data is provided by the United States National Geospatial-Intelligence Agency (NGA). The Bouguer gravity data are already terrain corrected using topographic heights calculated from the spherical harmonic model of topography (ETOPO1) used up to the same maximum degree as the gravity field model; we therefore seek to extract Bouguer gravity data close to mean sea level. The Bouguer gravity data were extracted with a resolution of 0.1° at a constant height of 30 cm above sea level in order to prevent divergence in the numerical code, which in rare circumstances will occur if the measurement height is directly at the surface. Although the divergence problem can be avoided by shifting the nominal measurement height a few centimeters above mean sea level, we chose 30 cm in order to account for differences in the cumulative height anomalies between XGM2016 and the Earth Gravitational Model 2008 (EGM 2008; Pavlis et al., 2012), which is ∼26 cm in Africa (Pail et al., 2018). Within the RVP area, the Bouguer gravity data vary within −252 to −12 mGal with a mean value of −132 mGal. We subtract the mean gravity from the gravity data in order to obtain the required gravity anomalies which range within ±120 mGal. The gravity anomalies are plotted on a 0.1°×0.1° geographical grid in Figure 2. The gravity data domain has dimensions of ∼890 x ∼780 km along latitude (i.e., −14° to −6°), and longitude (i.e., 30°–37°), respectively (Figure 2). The satellite gravity component of XGM2016 uses the satellite-only gravity field model GOCO05s (Mayer-Guerr, 2015), which is based on more than 10 years of data of the Gravity Recovery and Climate Experiment (GRACE; Tapley et al., 2004) mission, the complete period of the Gravity field and steady-state Ocean Circulation Explorer (GOCE; Drinkwater et al., 2003) mission, kinematic orbits of 9 low-flying satellites, and 6 satellite laser ranging (SLR) satellites.
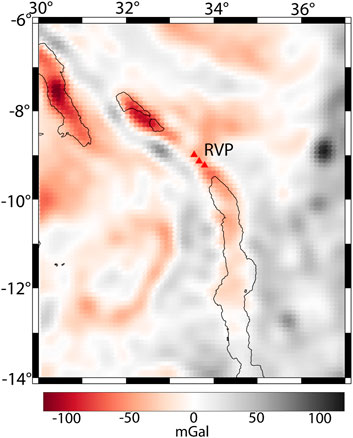
FIGURE 2. Bouguer gravity anomaly map extracted from the Experimental Global Gravity Field Model (XGM 2016; Pail et al., 2018). RVP = Rungwe Volcanic Province. Red triangles from north to south represent the three active Holocene volcanoes (Ngozi, Rungwe, and Kyejo; Harkin, 1962; Fontijn et al., 2010) of the RVP. The Holocene volcanoes are from the Smithsonian Global Volcanism Program (Global Volcanism Program, 2013). Black lines indicate the outline of rift lakes.
2.2 3D tomography model
As a reference model for our constrained inversion, we use shear-wave velocity anomalies in the upper mantle (>33 km depth) beneath the RVP and surroundings which is part of the 3D seismic tomography model of the upper mantle of the African continent developed by Emry et al. (2019). Although there are several seismic tomography models of the upper mantle beneath the RVP and surroundings (O’Donnell et al., 2013; Accardo et al., 2017; Grijalva et al., 2018; Emry et al., 2019), we use shear-wave velocity anomalies from Emry et al. (2019) mainly because the model has a rich dataset covering the entire African continent. Emry et al. (2019) used full-waveform tomography on data collected from 186 broadband seismic stations throughout Africa and surrounding regions to determine the 3D seismic tomography model from long-period ambient noise constrained by fundamental mode Rayleigh waves. The shear-wave velocity anomalies (Figures 3A,B) are derived from the perturbation of shear-wave velocities relative to the AK135 global average Earth Model (Kennett et al., 1995). At 150 km depth, a region of lowest velocity anomaly (−7%) is focused beneath the RVP and the highest velocity anomaly (+7%) occurs in the southern part of the Malawi Rift (Figure 3A). In order to account for edge-effects, we choose a model space that extends 0.5° outward at all the edges of the data space. Thus, our model domain has dimensions of ∼1,000 x ∼890 x 660 km along latitude (i.e., −14.5° to −5.5°), longitude (i.e., 29.5°–37.5°), and depth, respectively (Figure 3B). Figure 3B shows a 3D representation of the shear-wave velocity anomalies in our model space, which indicates that the low velocity zone (−2%) beneath the RVP is generally shallow (<200 km depths) but extends to ∼600 km depth at the westernmost edge of the model.
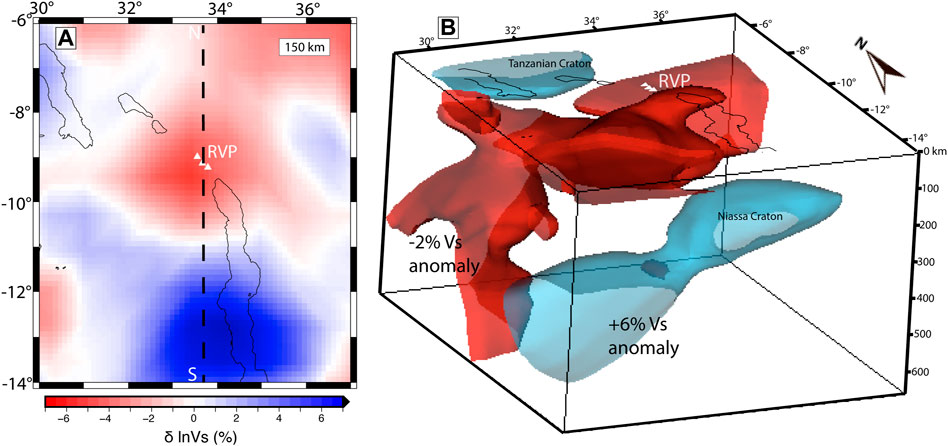
FIGURE 3. (A). 150 km depth slice of shear-wave velocity anomaly beneath the Rungwe Volcanic Province and surroundings derived from Emry et al. (2019). The velocities are relative to the AK135 global average Earth Model (Kennett et al., 1995). RVP = Rungwe Volcanic Province. White triangles represent the RVP. Black lines indicate the outline of rift lakes. The N-S dashed line represents the cross-section in Figure 5A. (B). A 3D representation of the shear-wave velocity anomaly beneath the Rungwe Volcanic Province and surroundings derived from Emry et al. (2019).
3 Constrained inversion
Gravity exploration has the advantages of low cost and high efficiency but its low vertical resolution hampers the inversion process. Therefore, some a priori information can be used as constraints to enhance the inversion accuracy. Here, we used seismic velocity perturbations (
We use the code jif3D (Moorkamp et al., 2011) with a
We use a kernel density approach with a Gaussian kernel to calculate the MI between
(1) We estimate the probability density distribution (pdd) for the joint parameters and the marginal distributions for each parameter. If we denote the pairs of transformed parameters in each model cell as (
where
From the joint pdd we can also calculate the marginal pdd’s:
and
(2) We then calculate the Shannon Entropy of the marginal and joint pdd’s:
(3) We finally retrieve the MI, which is given by:
The full objective function that we minimize iteratively includes the data misfit term for the gravity anomaly data (Φd,grav), the regularization term (Φreg,ρ), and the mutual-information term (MI):
Details of each term in the objective function is given in Moorkamp et al. (2011). The gravity data misfit (Φd,grav) is defined as the l2 norms of the data residuals weighted by the uncertainties (10 mGal). The data misfit for the density model ρ with respect to the gravity data set d is given by:
where
The regularization term (Φreg,ρ) is included in the objective function in order to stabilize the inversion and yield smooth models and possibly coherent and geologically meaningful structures (e.g., Jupp and Vozoff 1975; Zhdanov 2002). Φreg,ρ is the ρ-model norm, which in our case is defined as the second spatial derivative of the
The model regularization term is obtained by summing over the three axis directions i = {x, y, z} and weight the contribution for each direction by a weight
The objective function is minimized iteratively using the limited memory quasi-Newton approach (L-BFGS, Avdeev and Avdeeva, 2009) for parallel forward solvers; flexible model parametrization and large-scale model optimization. Each model cell (rectangular prism with dimensions ∼16 x 14 x 10 km) is assigned a value from the starting density model
4 Results
The shear-wave velocity anomalies beneath the RVP and surroundings from Emry et al. (2019) that we use as our reference model exist only for the upper mantle (>33 km depth down to 660 km). Thus, the density structure in the crust (<33 km) is only from the gravity inversion without a seismic constraint. However, an extraction of the crustal density structure at 20 km and 30 km depths (Supplementary Figures S6A, B) reveals geologically meaningful structures like negative density anomalies (<−50 kg/m3) beneath rift basins, possibly due to the low density of rift basin sedimentary covers and a positive density anomaly (∼+200 kg/m3) beneath the Mughese Shear Zone. We note again that only subsurface density anomalies >11 km can be properly resolved by the gravity data, thus more heterogeneous smaller wavelength (<11 km) crustal density structures will be unresolved by our technique. We focus our interpretation of the vertical and lateral variability of in situ density structures beneath the RVP and surroundings at depths >33 km. Figures 4A–D respectively show 100, 150, 200, and 250 km depth slices of density anomalies resulting from our constrained inversion of gravity data with
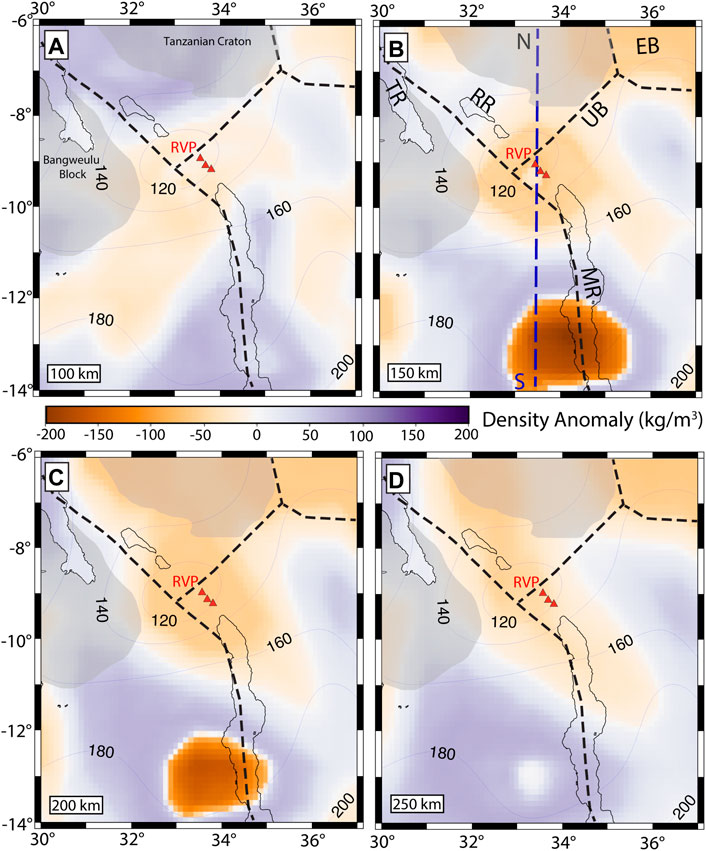
FIGURE 4. Depth slices showing in situ density anomalies beneath the RVP and surroundings at (A) 100 km, (B) 150 km, (C) 200 km and (D) 250 km depth. Red triangles represent the Rungwe Volcanic Province (RVP). Black lines indicate the outline of rift lakes. Blue contours show lines of equal lithospheric thickness at 20 km intervals from Fishwick (2010). Black dotted lines delineate plate boundaries from Stamps et al. (2008). Blue profile N-S in Figure 4B is the profile location for Figure 5B.
Our results reveal a conspicuous negative density anomaly (−200 kg/m3) in the sublithospheric mantle (with depth extending from ∼100 to ∼250 km) beneath the central part of the Malawi Rift extending to the west, beneath the Niassa Craton. This negative density anomaly beneath the Niassa Craton is coincident with locations with positive seismic velocity perturbations (+7%). At depths >100 km, there is a region of negative density anomalies (−50 to −10 kg/m3) that extend from the Eastern Branch, through the Usangu Basin (Figure 1B), to focus beneath the RVP, which is coincident with locations with low seismic velocity anomalies (−7%). This result suggests a possible linkage of the Western Branch and the Eastern Branch through the Usangu Basin (Figure 1B; Mulibo, 2022).
Within the low-density region beneath the RVP, we highlight a denser anomaly that is highly focused beneath the volcanic centers (denoted by red triangles in Figure 4B). In order to better visualize the density anomaly at depth, we extract a cross-section along a N-S profile that cut across the RVP (Figure 5) and observe that the denser anomaly beneath the RVP is confined at shallow depths within the asthenosphere (∼110–150 km) where the lithosphere is thinnest (∼110 km; Fishwick, 2010; Njinju et al., 2019a). Figure 5 also indicates the fit between gravity observations and the forward calculated gravity and shows that the Niassa Craton extends to depths reaching ∼350 km, however, the buoyant cratonic nucleus is restricted at a depth range of 100 to 250 km. We suggest that the denser anomaly in the lithospheric mantle beneath the RVP is possibly due to compositional heterogeneity from metasomatization, while the negative buoyancy of the Niassa Craton contributes to its long stability. See Section 5 in which we discuss a possible origin of these density anomalies.
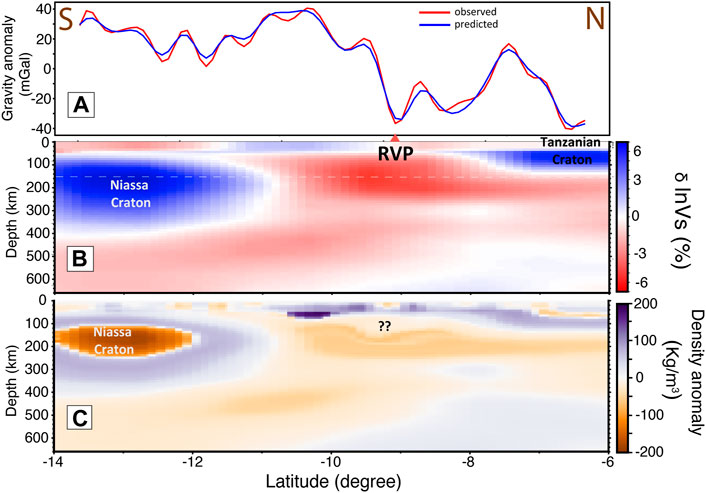
FIGURE 5. Profile across the Rungwe Volcanic Province (RVP) and the Niassa Craton (profile N-S; Figure 3A) showing (A) fit between observed (red) and forward calculated gravity (blue). (B) The shear-wave velocity perturbation from Emry et al. (2019) along profile N-S used as the reference model for the constrained inversion. The lowest shear-wave velocity occurs beneath the RVP at depths of ∼33–300 km. (C) Profile showing the derived density anomaly (profile N-S; Figure 4B). Beneath the RVP, the lowest density anomaly (∼-50 kg/m3) occurs at depths between 200 and 250 km. At shallower depths beneath the RVP corresponding to the lithospheric mantle, the density anomaly is more positive (??) probably due to compositional heterogeneity.
5 Discussion
5.1 Velocity-density conversion factor: Implications for thermal versus compositional effects on the density structure
Studies suggest that S-wave velocity perturbations in the upper mantle relate more to temperature variations (e.g., Goes and Van der Lee, 2002; Stixrude and Lithgow-Bertelloni, 2005a) than compositional variations. We examine the assumption that S-wave velocity perturbations in the upper mantle are controlled only by temperature effects (e.g., Goes and Van der Lee, 2002; Stixrude and Lithgow-Bertelloni, 2005b) and that the S-wave velocity anomalies can be converted to density anomalies through a constant conversion factor of 0.15 (e.g., Becker, 2006; Conrad and Lithgow-Bertelloni, 2006; Conrad et al., 2007; Conrad and Behn, 2010). With these assumptions, the calculated density anomalies (dρ) beneath the RVP and surrounding region are given by (Eq. 7):
where ρ is the reference mantle density (we use 3,300 kg/m3) and
The assumption of only temperature control on the density structure in the upper mantle and the use of a uniform positive conversion factor of 0.15 results in density anomalies ranging between −150 kg/m3 and 150 kg/m3 (Figure 6A). We observe that all regions with negative S-wave velocity perturbations (Figure 3A) convert to negative density anomalies (Figure 6A) and vice versa. The resultant density structure based on these assumptions is unable to fit the observed gravity data (Figure 2) because it generates predicted gravity anomalies (Figure 6B) and gravity residuals (Figure 6C) that are double and very different from the observed gravity (Figure 2). Since the resultant density structure does not fit the observed gravity data, we suggest that the use of a positive and uniform conversion factor between S-wave velocity perturbations and density anomalies is not a valid assumption for the upper mantle. This comparison also suggests that the density structure does not depend strictly on temperature variations. In contrast, our inverted density variations in the upper mantle beneath the RVP fit the observed gravity in the region (Figure 7). These comparisons suggest S-wave velocity perturbations are affected by both thermal and compositional anomalies (Root et al., 2017).
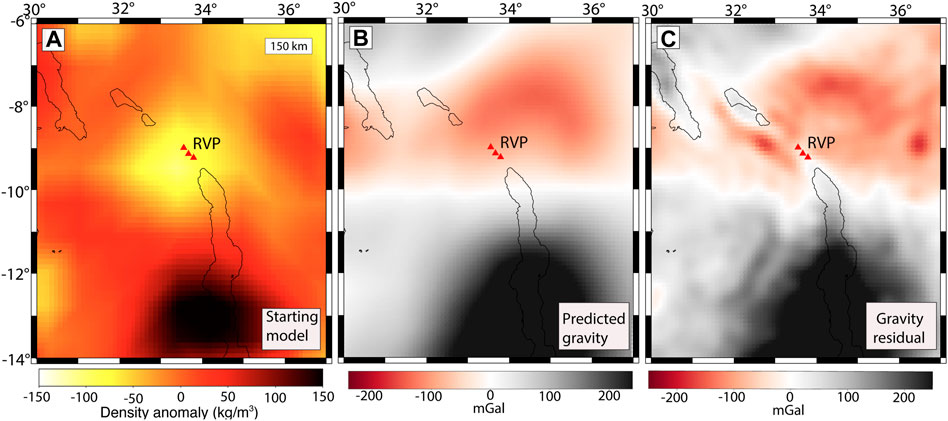
FIGURE 6. (A) A 150 km depth slice of the density anomaly beneath the RVP and surrounding regions based on Eq. 7 assuming strictly temperature control. (B) The predicted gravity anomaly using the derived density anomaly from Eq. 7 as the starting model. (C) The residual gravity, which is the difference between the observed gravity anomalies (Figure 2) and the predicted gravity anomaly (Figure 6B) showing a poor fit between the predicted and observed gravity data.
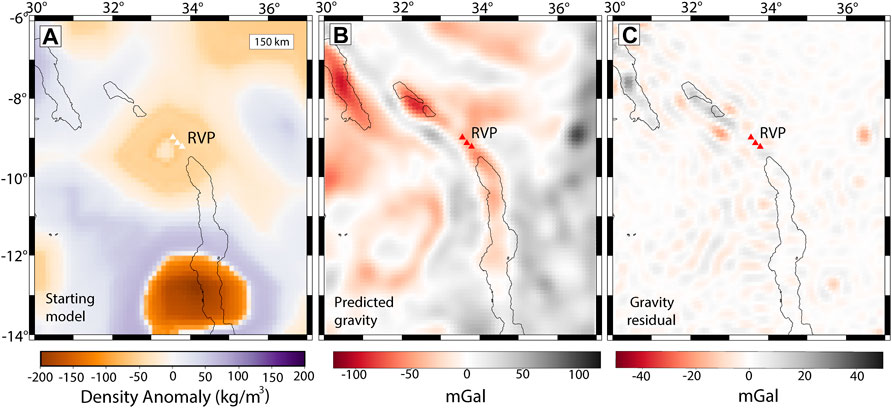
FIGURE 7. (A) 150 km depth slice of the resultant density anomaly beneath the Rungwe Volcanic Province and surroundings derived from constrained inversion of gravity data with shear-wave velocity perturbations from Emry et al. (2019) as reference model. (B) The predicted gravity calculated from our resultant density anomaly. (C) Residual gravity, which is the difference between the observed gravity anomalies (Figure 2) and the predicted gravity anomaly (Figure 7B) showing a good fit between the predicted and observed gravity data. RVP = Rungwe Volcanic Province. White and red triangles represent the RVP. Black lines indicate the outline of rift lakes.
In order to investigate the effect of temperature versus composition in our inverted density structure, we estimate a 3D model of velocity-to-density conversion factor (f) for the study area (Figure 8 and Supplementary Figure S5) (Eq. 8).
where dρ is the inverted density anomaly in this study, ρ is the reference mantle density (we use 3,300 kg/m3) and
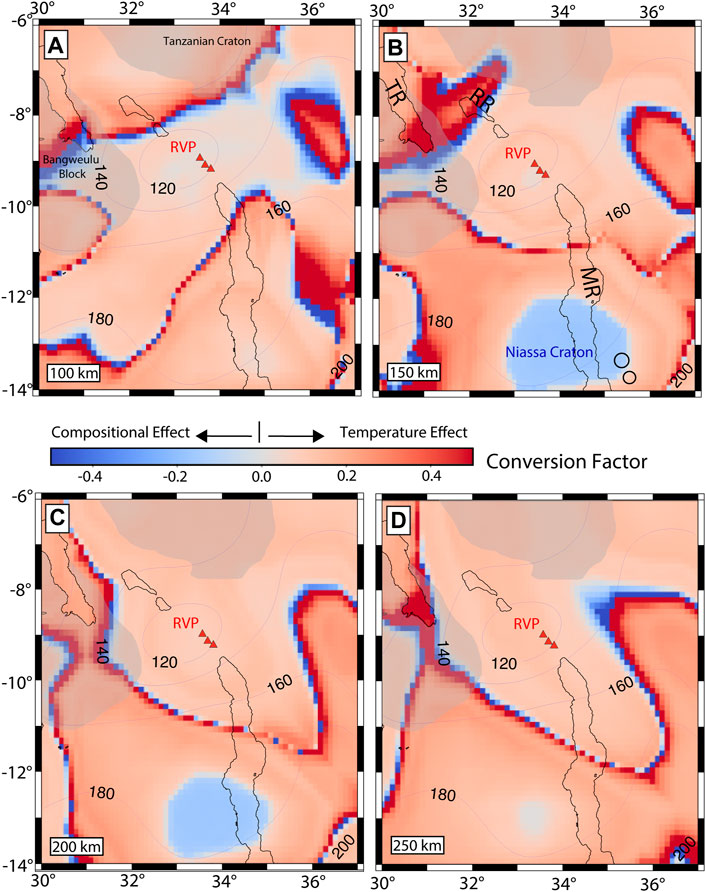
FIGURE 8. Lateral distribution of the conversion factor between the S-wave velocity perturbations (dlnVs) and our final density anomalies at (A) 100 km, (B) 150 km, (C) 200 km and (D) 250 km depth. Black circles in Figure 8B represent the location of Ring-Complexes observed on Shuttle Radar Topography Mission (SRTM) Digital Elevation Model (DEM) by Njinju et al. (2019a).
Studies by Root et al. (2017) and Liang et al. (2019) show that both the thermal and compositional effects in the upper mantle can be quantified from a velocity-to-density conversion factor, where positive values in the conversion factor imply dominance of thermal effects in the density anomaly, whereas negative conversion factors indicate that the density anomaly is likely related to compositional variations (Cammarano et al., 2003; Root et al., 2017; Liang et al., 2019). For example, Root et al. (2017) estimates lateral variations of the conversion factor between S-wave velocities and gravity-based densities in the British Isles and surroundings and find negative values in central Fennoscandia, which they interpret to mean that the compositional effect is more important than the thermal effect on the
Figure 8 shows lateral variations in the conversion factor at depths ranging from 100 km to 250 km with cold colors representing regions with negative conversion factors (dominance of compositional effects) and warm colors presenting regions with positive conversion factors (dominance of temperature effects). A pronounced negative conversion factor occurs beneath the Niassa Craton at depths ranging from 110 km (Supplementary Figure S5) to 250 km (Figure 8D) indicating that the negative density anomalies beneath the Niassa Craton are likely dominated by compositional heterogeneity. Another prominent area with a negative conversion factor occurs in the southern tip of the Luangwa Rift (Figure 1B) at depths of ∼130 km (Supplementary Figure S5). This negative conversion factor suggests a strong compositional control on the densification of the lithospheric mantle beneath the Luangwa Rift. The Ruhuhu and Maniamba Troughs (Karoo rifts) in the eastern part of our models show a strong temperature control on the densification at depths ranging from 100 km to 250 km. We also find positive conversion factors at depths of ∼140–150 km (Supplementary Figure S5) in the region connecting the southern tip of the Tanganyika Rift and the Rukwa Rift. This positive conversion factor suggests a dominance of temperature effects for the dense anomaly in this region. The RVP shows conversion factors near zero at shallow sublithospheric depths (∼110–140 km; Supplementary Figure S5), which suggests equal contribution of thermal and compositional effects on the upper mantle density structure beneath the RVP at this depth range. Figure 8 and Supplementary Figure S5 also show clear boundaries marking the transition from negative (compositional effects) to positive (temperature effects) conversion factors, which might delineate the boundaries of previously unresolved tectonic entities. Root et al. (2017) suggests a correlation between laterally varying conversion factors and major tectonic regions in the British Isles and surroundings. Similarly, Liang et al. (2019) suggests a relationship between conversion factors and the tectonic fragmentation of the Philippine Sea Plate.
5.2 Compositional modification of the Niassa Craton and tectonic implications
The lithospheric mantle is the chemical and thermal boundary layer formed as residue after melt extraction from the convective mantle (Carlson et al., 2005). Secular cooling of the Earth leads to formation of the lithospheric mantle under changing mantle temperature and melting conditions, resulting in secular variations in its major element composition and in bulk properties (elastic moduli, seismic velocities, and densities). High mantle temperatures on the early Earth produced the unique (Fe-poor) composition of the cratonic lithospheric mantle (Carlson et al., 2005) with low density and high seismic velocities (Lee, 2003), thus it is possible that a significant portion of the low-density anomaly beneath the Niassa Craton was formed from secular cooling of the early Earth. Further reduction of the lithospheric mantle density beneath the Niassa Craton due to high-temperature melt extraction might have happened in the Middle Jurassic to Early Cretaceous, during the emplacement of alkaline igneous intrusions (Ring-Complexes, Figure 8B) in the southern Malawi Rift, as part of the Chilwa Alkaline Province (Castaing, 1991; Nyalugwe et al., 2019). High-temperature melt extraction as a possible mechanism for cratonization has been suggested elsewhere. For example, Deng et al. (2017) develop a 3D density model of the crust and upper mantle in central Asia from a joint analysis of seismic velocity, gravity, topography and temperature data and found low density but high velocity mantle lithosphere beneath the southern Tarim craton. Deng et al. (2017) suggest that the low-density anomaly results from high-temperature extraction of melts from the mantle lithosphere as documented in voluminous plume-related Permian intrusions (Zhang et al., 2013; Xu et al., 2014) in southern and western Tarim. The melt extraction removes hydrous, aluminous, and iron-rich phases, leaving behind a residue with increased modal Mg and olivine but decreased garnet and clinopyroxene and therefore decreased density (e.g., Schutt and Lesher, 2010). Thus, the negative density anomalies in the lithospheric mantle beneath the Niassa Craton could result from compositional variations due to secular cooling of the early Earth and subsequent melt extraction in the Cretaceous during the formation of the Chilwa Alkaline Province (Castaing, 1991; Nyalugwe et al., 2019). The buoyant nature of the craton contributes to its long stability over geologic time. It is generally accepted that the lithospheric mantle beneath cratonic regions is more depleted in heavy elements (e.g., CaO, Al2O3, and FeO) than the average lithospheric mantle (Griffin et al., 2004; 2009), particularly at the shallowest levels of the lithospheric keels. This idea is not only supported by what it is directly observed in mantle samples (Griffin et al., 2009) but also by geophysical and geodynamic arguments (e.g., Forte and Claire Perry, 2000; Carlson et al., 2005; Afonso et al., 2008; 2019; Cammarano et al., 2011; Wang et al., 2015).
5.3 Origin of the density structure beneath the Rungwe volcanic province
Generally, the RVP shows negative density anomalies but near zero conversion factors at shallow sublithospheric depths (∼110–140 km; Supplementary Figure S5), which suggests important contributions of both thermal and compositional effects (including fluids and melt) on the upper mantle density structure beneath the RVP at this depth range. Mantle metasomatism is a possible mechanism that may cause density heterogeneities in the lithospheric mantle beneath the RVP. Metasomatism of depleted lithospheric mantle, usually associated with basaltic magmatism (e.g., Griffin et al., 2005; Howarth et al., 2014), decreases the Mg/Fe ratio, increases lithospheric mantle density, and decreases seismic velocities (Jordan, 1981; Lee, 2003). Although the geodynamic study by Njinju et al. (2021) suggests the occurrence of present-day sublithospheric melt beneath the RVP, radiometric dating of samples from the RVP using 40Ar/39Ar dating techniques suggests that magmatism in the RVP started by 19 Ma (Mesko et al., 2014; Mesko, 2020) and possibly as early as 25 Ma (Roberts et al., 2012). Thus, melt extraction beneath the RVP 19–25 million years ago may have left the lithospheric mantle depleted. Njinju et al. (2021) suggests the presence of plume material beneath the RVP at present-day. Subsequent interactions of the plume material with the depleted lithospheric mantle beneath the RVP likely introduced metasomatic fluids leading to compositional densification that we resolve with the technique used in this study. The presence of metasomatic fluids beneath the RVP is supported by geochemical studies by Furman (1995) based on–amphibole, zircon, ilmenite, and phlogopite. Ivanov et al. (1998) also suggest the likelihood of melting of metasomatized mantle beneath the RVP using geochemical techniques.
6 Conclusion
We present a 3D model of the upper mantle density structure beneath the Rungwe Volcanic Province (RVP) and surrounding regions derived from a constrained inversion of satellite gravity anomalies with shear-wave velocity perturbations from Emry et al. (2019) as a reference model. For the inversion, we used the mutual information coupling technique in which a joint probability distribution of the gravity data and the reference model is estimated and its entropy minimized in order to generate a density model that is statistically compatible with the reference model. Our results reveal a conspicuous negative density anomaly beneath the Niassa Craton and less pronounced negative density anomalies beneath the RVP. We further determined a 3D model of the velocity-to-density conversion factor (f) and found negative f-values beneath the Niassa Craton which suggest the observed negative density anomaly is mostly due to compositional variations. Apart from the Niassa Craton, there are generally positive f-values in the study area, which suggest dominance of temperature control on the density structure. Although the RVP generally shows negative density anomalies and positive f-values, at shallow depths (<120 km) the f-value is near zero which suggests important contributions of both temperature and composition on the density structure beneath the RVP. We suggest that the presence of plume material at shallow depths beneath the RVP thermally reduces the upper mantle density. The plume material contributes metasomatic fluids that precipitate dense minerals that slightly increase the density due to compositional variations. The negative buoyancy of the Niassa Craton contributes to its long stability, while constituting a barrier to the southward flow of plume material, thus restricting the southward continuation of magmatism in the Western Branch of the EAR. The presence of negative-density anomaly where
Data availability statement
All datasets and model files generated in this study can be found in the Supplementary Material and are also available for open access through Zenodo at doi: https://zenodo.org/badge/latestdoi/572772755.
Author contributions
EA and DS developed the project concept and MM provided the jif3D code and guidance on the preparation of input and run parameter files and also guided on the interpretation of model results. EA conducted the experiments, prepared the manuscript and figures with frequent feedbacks from MM and DS. All authors discussed the results, contributed to the final manuscript and approved it for publication.
Funding
MM is supported by a Heisenberg fellowship of the German Science Foundation (DFG, Grant No. MM2265/6-1).
Acknowledgments
Most of the figures in this paper were generated with Generic Mapping Tools V5.4.2 (Wessel et al., 2013). We also created some of the figures with VISIT v2.9 developed by the Lawrence Livermore National Laboratory. The joint inversion framework jif3D is available under a GNU General Public License (v3) via subversion at svn checkout https://svn.code.sf.net/p/jif3d/jif3dsvn/trunk/jif3D jif3d. Processed data and model files can be found in the Supplementary Material and are also available for open access through Zenodo at doi: https://zenodo.org/badge/latestdoi/572772755.
Conflict of interest
The authors declare that the research was conducted in the absence of any commercial or financial relationships that could be construed as a potential conflict of interest.
Publisher’s note
All claims expressed in this article are solely those of the authors and do not necessarily represent those of their affiliated organizations, or those of the publisher, the editors and the reviewers. Any product that may be evaluated in this article, or claim that may be made by its manufacturer, is not guaranteed or endorsed by the publisher.
Supplementary material
The Supplementary Material for this article can be found online at: https://www.frontiersin.org/articles/10.3389/feart.2023.1118566/full#supplementary-material
References
Accardo, N. J., Gaherty, J. B., Shillington, D. J., Ebinger, C. J., Nyblade, A. A., Mbogoni, G. J., et al. (2017). Surface wave imaging of the weakly extended Malawi Rift from ambient-noise and teleseismic Rayleigh waves from onshore and lake-bottom seismometers. Geophys. J. Int. 209 (3), 1892–1905. doi:10.1093/gji/ggx133
Adam, C., King, S. D., and Caddick, M. J. (2021). Mantle temperature and density anomalies: The influence of thermodynamic formulation, melt, and anelasticity. Phys. Earth Planet. Interiors 319, 106772. doi:10.1016/j.pepi.2021.106772
Afonso, J. C., Fernandez, M., Ranalli, G., Griffin, W. L., and Connolly, J. A. D. (2008). Integrated geophysical-petrological modeling of the lithosphere and sublithospheric upper mantle: Methodology and applications. Geochem. Geophys. Geosystems 9 (5). doi:10.1029/2007gc001834
Afonso, J. C., Salajegheh, F., Szwillus, W., Ebbing, J., and Gaina, C. (2019). A global reference model of the lithosphere and upper mantle from joint inversion and analysis of multiple data sets. Geophys. J. Int. 217 (3), 1602–1628. doi:10.1093/gji/ggz094
Avdeev, D., and Avdeeva, A. (2009). 3D magnetotelluric inversion using a limited-memory quasi-Newton optimization. Geophysics 74 (3), F45–F57. doi:10.1190/1.3114023
Barton, P. J. (1986). The relationship between seismic velocity and density in the continental crust—A useful constraint? Geophys. J. Int. 87 (1), 195–208. doi:10.1111/j.1365-246x.1986.tb04553.x
Becker, T. W. (2006). On the effect of temperature and strain-rate dependent viscosity on global mantle flow, net rotation, and plate-driving forces. Geophys. J. Int. 167 (2), 943–957. doi:10.1111/j.1365-246x.2006.03172.x
Brocher, T. M. (2005). Empirical relations between elastic wavespeeds and density in the Earth's crust. Bull. Seismol. Soc. Am. 95 (6), 2081–2092. doi:10.1785/0120050077
Cammarano, F., Goes, S., Vacher, P., and Giardini, D. (2003). Inferring upper-mantle temperatures from seismic velocities. Phys. Earth Planet. Interiors 138 (3-4), 197–222. doi:10.1016/s0031-9201(03)00156-0
Cammarano, F., Tackley, P., and Boschi, L. (2011). Seismic, petrological and geodynamical constraints on thermal and compositional structure of the upper mantle: Global thermochemical models. Geophys. J. Int. 187 (3), 1301–1318. doi:10.1111/j.1365-246x.2011.05223.x
Carlson, R. W., Pearson, D. G., and James, D. E. (2005). Physical, chemical, and chronological characteristics of continental mantle. Rev. Geophys. 43 (1). doi:10.1029/2004rg000156
Castaing, C. (1991). Post-Pan-African tectonic evolution of South Malawi in relation to the Karroo and recent East African rift systems. Tectonophysics 191 (1-2), 55–73. doi:10.1016/0040-1951(91)90232-h
Conrad, C. P., and Behn, M. D. (2010). Constraints on lithosphere net rotation and asthenospheric viscosity from global mantle flow models and seismic anisotropy. Geochem. Geophys. Geosystems 11 (5). doi:10.1029/2009gc002970
Conrad, C. P., Behn, M. D., and Silver, P. G. (2007). Global mantle flow and the development of seismic anisotropy: Differences between the oceanic and continental upper mantle. J. Geophys. Res. Solid Earth 112 (B7), B07317. doi:10.1029/2006jb004608
Conrad, C. P., and Lithgow-Bertelloni, C. (2006). Influence of continental roots and asthenosphere on plate-mantle coupling. Geophys. Res. Lett. 33 (5), L05312. doi:10.1029/2005gl025621
Corti, G., van Wijk, J., Cloetingh, S., and Morley, C. K. (2007). Tectonic inheritance and continental rift architecture: Numerical and analogue models of the East African Rift system. Tectonics 26 (6). doi:10.1029/2006tc002086
Darbyshire, F. A., White, R. S., and Priestley, K. F. (2000). Structure of the crust and uppermost mantle of Iceland from a combined seismic and gravity study. Earth Planet. Sci. Lett. 181 (3), 409–428. doi:10.1016/s0012-821x(00)00206-5
Deng, Y., Levandowski, W., and Kusky, T. (2017). Lithospheric density structure beneath the Tarim basin and surroundings, northwestern China, from the joint inversion of gravity and topography. Earth Planet. Sci. Lett. 460, 244–254. doi:10.1016/j.epsl.2016.10.051
Deng, Y., Zhang, Z., Badal, J., and Fan, W. (2014). 3-D density structure under South China constrained by seismic velocity and gravity data. Tectonophysics 627, 159–170. doi:10.1016/j.tecto.2013.07.032
Deschamps, F., Snieder, R., and Trampert, J. (2001). The relative density-to-shear velocity scaling in the uppermost mantle. Phys. Earth Planet. Interiors 124 (3-4), 193–212. doi:10.1016/s0031-9201(01)00199-6
Deschamps, F., Trampert, J., and Snieder, R. (2002). Anomalies of temperature and iron in the uppermost mantle inferred from gravity data and tomographic models. Phys. Earth Planet. Interiors 129 (3-4), 245–264. doi:10.1016/s0031-9201(01)00294-1
Drinkwater, M. R., Floberghagen, R., Haagmans, R., Muzi, D., and Popescu, A. (2003). VII: Closing session: Goce: ESA's first Earth explorer core mission. Space Sci. Rev. 108 (1), 419–432. doi:10.1023/a:1026104216284
Eaton, D. W., and Claire Perry, H. K. (2013). Ephemeral isopycnicity of cratonic mantle keels. Nat. Geosci. 6 (11), 967–970. doi:10.1038/ngeo1950
Ebinger, C., Djomani, Y. P., Mbede, E., Foster, A., and Dawson, J. B. (1997). Rifting archaean lithosphere: The eyasi-manyara-natron rifts, East Africa. J. Geol. Soc. 154 (6), 947–960. doi:10.1144/gsjgs.154.6.0947
Ebinger, C. J., Deino, A. L., Drake, R. E., and Tesha, A. L. (1989). Chronology of volcanism and rift basin propagation: Rungwe volcanic province, East Africa. J. Geophys. Res. Solid Earth 94 (B11), 15785–15803. doi:10.1029/jb094ib11p15785
Ebinger, C. J., Deino, A. L., Tesha, A. L., Becker, T., and Ring, U. (1993). Tectonic controls on rift basin morphology: Evolution of the northern Malawi (nyasa) rift. J. Geophys. Res. Solid Earth 98 (B10), 17821–17836. doi:10.1029/93jb01392
Emry, E. L., Shen, Y., Nyblade, A. A., Flinders, A., and Bao, X. (2019). Upper mantle Earth structure in Africa from full-wave ambient noise tomography. Geochem. Geophys. Geosystems 20 (1), 120–147. doi:10.1029/2018gc007804
Fishwick, S. (2010). Surface wave tomography: Imaging of the lithosphere–asthenosphere boundary beneath central and southern africa? Lithos 120 (1-2), 63–73. doi:10.1016/j.lithos.2010.05.011
Fontijn, K., Ernst, G. G., Elburg, M. A., Williamson, D., Abdallah, E., Kwelwa, S., et al. (2010). Holocene explosive eruptions in the Rungwe volcanic province, Tanzania. J. Volcanol. Geotherm. Res. 196 (1-2), 91–110. doi:10.1016/j.jvolgeores.2010.07.021
Fontijn, K., Williamson, D., Mbede, E., and Ernst, G. G. (2012). The Rungwe volcanic province, Tanzania–a volcanological review. J. Afr. Earth Sci. 63, 12–31. doi:10.1016/j.jafrearsci.2011.11.005
Forte, A. M., and Claire Perry, H. K. (2000). Geodynamic evidence for a chemically depleted continental tectosphere. Science 290 (5498), 1940–1944. doi:10.1126/science.290.5498.1940
Fritz, H., Abdelsalam, M., Ali, K. A., Bingen, B., Collins, A. S., Fowler, A. R., et al. (2013). Orogen styles in the East African orogen: A review of the neoproterozoic to cambrian tectonic evolution. J. Afr. Earth Sci. 86, 65–106. doi:10.1016/j.jafrearsci.2013.06.004
Furman, T. (1995). Melting of metasomatized subcontinental lithosphere: Undersaturated mafic lavas from Rungwe, Tanzania. Contributions Mineralogy Petrology 122 (1), 97–115. doi:10.1007/s004100050115
Ghosh, A., Becker, T. W., and Zhong, S. J. (2010). Effects of lateral viscosity variations on the geoid. Geophys. Res. Lett. 37 (1). doi:10.1029/2009gl040426
Ghosh, A., Thyagarajulu, G., and Steinberger, B. (2017). The importance of upper mantle heterogeneity in generating the Indian Ocean geoid low. Geophys. Res. Lett. 44 (19), 9707–9715. doi:10.1002/2017gl075392
Global Volcanism Program (2013). Volcanoes of the world, v. 4.11.0. Smithsonian Institution. (date data acquired). Available at: aHR0cHM6Ly92b2xjYW5vLnNpLmVkdS8=. doi:10.5479/si.GVP.VOTW4-2013
Goes, S., and van der Lee, S. (2002). Thermal structure of the North American uppermost mantle inferred from seismic tomography. J. Geophys. Res. Solid Earth 107 (B3), 2050. ETG-2. doi:10.1029/2000jb000049
Griffin, W. L., Natapov, L. M., O'Reilly, S. V., Van Achterbergh, E., Cherenkova, A. F., and Cherenkov, V. G. (2005). The kharamai kimberlite field, siberia: Modification of the lithospheric mantle by the siberian trap event. Lithos 81 (1-4), 167–187. doi:10.1016/j.lithos.2004.10.001
Griffin, W. L., O'Reilly, S. Y., Doyle, B. J., Pearson, N. J., Coopersmith, H., Kivi, K., et al. (2004). Lithosphere mapping beneath the North American plate. Lithos 77 (1-4), 873–922. doi:10.1016/j.lithos.2004.03.034
Griffin, W. L., O’reilly, S. Y., Afonso, J. C., and Begg, G. C. (2009). The composition and evolution of lithospheric mantle: A re-evaluation and its tectonic implications. J. Petrology 50 (7), 1185–1204. doi:10.1093/petrology/egn033
Grijalva, A., Nyblade, A. A., Homman, K., Accardo, N. J., Gaherty, J. B., Ebinger, C. J., et al. (2018). Seismic evidence for plume-and craton-influenced upper mantle structure beneath the northern Malawi Rift and the Rungwe Volcanic Province, East Africa. Geochem. Geophys. Geosystems 19 (10), 3980–3994. doi:10.1029/2018gc007730
Haber, E., and Holtzman Gazit, M. (2013). Model fusion and joint inversion. Surv. Geophys. 34 (5), 675–695. doi:10.1007/s10712-013-9232-4
Hansen, P. C. (1992). Analysis of discrete ill-posed problems by means of the L-curve. SIAM Rev. 34 (4), 561–580. doi:10.1137/1034115
Harkin, D. A. (1962). The Rungwe volcanics at the northern end of lake nyasa [with additional papers]. United Kingdom: Doctoral dissertation, University of Glasgow.
Howarth, G. H., Barry, P. H., Pernet-Fisher, J. F., Baziotis, I. P., Pokhilenko, N. P., Pokhilenko, L. N., et al. (2014). Superplume metasomatism: Evidence from Siberian mantle xenoliths. Lithos 184, 209–224. doi:10.1016/j.lithos.2013.09.006
Ivanov, A. V., Rasskazov, S. V., Boven, A., Andre, L., Maslovskaya, M. N., and Temu, E. B. (1998). Late Cenozoic alkaline-ultrabasic and alkaline basanite magmatism of the Rungwe Province, Tanzania. Petrology 6 (3), 208–229.
Jordan, T. H. (1981). Continents as a chemical boundary layer. Philosophical Trans. R. Soc. Lond. Ser. A, Math. Phys. Sci. 301 (1461), 359–373. doi:10.1098/rsta.1981.0117
Jupp, D. L. B., and Vozoff, K. (1975). Stable iterative methods for the inversion of geophysical data. Geophys. J. Int. 42 (3), 957–976. doi:10.1111/j.1365-246x.1975.tb06461.x
Kaban, M. K., Schwintzer, P., Artemieva, I. M., and Mooney, W. D. (2003). Density of the continental roots: Compositional and thermal contributions. Earth Planet. Sci. Lett. 209 (1-2), 53–69. doi:10.1016/s0012-821x(03)00072-4
Kaban, M. K., Stolk, W., Tesauro, M., El Khrepy, S., Al-Arifi, N., Beekman, F., et al. (2016). 3D density model of the upper mantle of Asia based on inversion of gravity and seismic tomography data. Geochem. Geophys. Geosystems 17 (11), 4457–4477. doi:10.1002/2016gc006458
Karato, S. I., and Wu, P. (1993). Rheology of the upper mantle: A synthesis. Science 260 (5109), 771–778. doi:10.1126/science.260.5109.771
Kelly, R. K., Kelemen, P. B., and Jull, M. (2003). Buoyancy of the continental upper mantle. Geochem. Geophys. Geosystems 4 (2). doi:10.1029/2002gc000399
Kennett, B. L., Engdahl, E. R., and Buland, R. (1995). Constraints on seismic velocities in the Earth from traveltimes. Geophys. J. Int. 122 (1), 108–124. doi:10.1111/j.1365-246x.1995.tb03540.x
Lee, C. T. A. (2003). Compositional variation of density and seismic velocities in natural peridotites at STP conditions: Implications for seismic imaging of compositional heterogeneities in the upper mantle. J. Geophys. Res. Solid Earth 108 (B9). doi:10.1029/2003jb002413
Lee, C. T. A., Lenardic, A., Cooper, C. M., Niu, F., and Levander, A. (2005). The role of chemical boundary layers in regulating the thickness of continental and oceanic thermal boundary layers. Earth Planet. Sci. Lett. 230 (3-4), 379–395. doi:10.1016/j.epsl.2004.11.019
Li, Y., and Oldenburg, D. W. (1998). 3-D inversion of gravity data. Geophysics 63 (1), 109–119. doi:10.1190/1.1444302
Liang, Q., Chen, C., Kaban, M. K., and Thomas, M. (2019). Upper-mantle density structure in the Philippine Sea and adjacent region and its relation to tectonics. Geophys. J. Int. 219 (2), 945–957. doi:10.1093/gji/ggz335
Liu, X., and Zhong, S. (2016). Constraining mantle viscosity structure for a thermochemical mantle using the geoid observation. Geochem. Geophys. Geosystems 17 (3), 895–913. doi:10.1002/2015gc006161
Lösing, M., Moorkamp, M., and Ebbing, J. (2022). Joint inversion based on variation of information—A crustal model of wilkes land, east Antarctica. Geophys. J. Int. 232 (1), 162–175. doi:10.1093/gji/ggac334
Mandolesi, E., and Jones, A. G. (2014). Magnetotelluric inversion based on mutual information. Geophys. J. Int. 199 (1), 242–252. doi:10.1093/gji/ggu258
Mayer-Guerr, T. (2015). “The combined satellite gravity field model GOCO05s,” in EGU general assembly conference abstracts, 12364.
Mesko, G. T., Class, C., Maqway, M. D., Boniface, N., Manya, S., and Hemming, S. R. (2014). “The timing of early magmatism and extension in the southern East African rift: Tracking geochemical source variability with 40 Ar/39 Ar geochronology at the Rungwe volcanic province, SW Tanzania,” in AGU fall meeting abstracts, V51A–V4730.
Mesko, G. T. (2020). Magmatism at the southern end of the east african rift system: Origin and role during early stage rifting. Columbia University.
Moorkamp, M. (2022). Deciphering the state of the lower crust and upper mantle with multi-physics inversion. Geophys. Res. Lett. 49 (9), e2021GL096336. doi:10.1029/2021gl096336
Moorkamp, M., Heincke, B., Jegen, M., Roberts, A. W., and Hobbs, R. W. (2011). A framework for 3-D joint inversion of MT, gravity and seismic refraction data. Geophys. J. Int. 184 (1), 477–493. doi:10.1111/j.1365-246x.2010.04856.x
Moorkamp, M., Jegen, M., Roberts, A., and Hobbs, R. (2010). Massively parallel forward modeling of scalar and tensor gravimetry data. Comput. Geosciences 36 (5), 680–686. doi:10.1016/j.cageo.2009.09.018
Muirhead, J. D., Wright, L. J., and Scholz, C. A. (2019). Rift evolution in regions of low magma input in East Africa. Earth Planet. Sci. Lett. 506, 332–346. doi:10.1016/j.epsl.2018.11.004
Mulibo, G. D. (2022). Seismotectonics and active faulting of Usangu basin, East African rift system, with implications for the rift propagation. Tectonophysics 838, 229498. doi:10.1016/j.tecto.2022.229498
Njinju, E. A., Atekwana, E. A., Stamps, D. S., Abdelsalam, M. G., Atekwana, E. A., Mickus, K. L., et al. (2019a). Lithospheric structure of the Malawi Rift: Implications for magma-poor rifting processes. Tectonics 38 (11), 3835–3853. doi:10.1029/2019tc005549
Njinju, E. A., Kolawole, F., Atekwana, E. A., Stamps, D. S., Atekwana, E. A., Abdelsalam, M. G., et al. (2019b). Terrestrial heat flow in the Malawi Rifted Zone, East Africa: Implications for tectono-thermal inheritance in continental rift basins. J. Volcanol. Geotherm. Res. 387, 106656. doi:10.1016/j.jvolgeores.2019.07.023
Njinju, E. A., Stamps, D. S., Neumiller, K., and Gallager, J. (2021). Lithospheric control of melt generation beneath the Rungwe volcanic province, east Africa: Implications for a plume source. J. Geophys. Res. Solid Earth 126 (5), e2020JB020728. doi:10.1029/2020jb020728
Nyalugwe, V. N., Abdelsalam, M. G., Atekwana, E. A., Katumwehe, A., Mickus, K. L., Salima, J., et al. (2019). Lithospheric structure beneath the cretaceous Chilwa alkaline province (CAP) in southern Malawi and northeastern Mozambique. J. Geophys. Res. Solid Earth 124 (11), 12224–12240. doi:10.1029/2019jb018430
O’Donnell, J. P., Adams, A., Nyblade, A. A., Mulibo, G. D., and Tugume, F. (2013). The uppermost mantle shear wave velocity structure of eastern Africa from Rayleigh wave tomography: Constraints on rift evolution. Geophys. J. Int. 194 (2), 961–978. doi:10.1093/gji/ggt135
Pail, R., Fecher, T., Barnes, D., Factor, J. F., Holmes, S. A., Gruber, T., et al. (2018). Short note: The experimental geopotential model XGM2016. J. geodesy 92 (4), 443–451. doi:10.1007/s00190-017-1070-6
Pavlis, N. K., Holmes, S. A., Kenyon, S. C., and Factor, J. K. (2012). The development and evaluation of the earth gravitational model 2008 (EGM2008). J. Geophys. Res. solid earth 117 (B4). doi:10.1029/2011jb008916
Roberts, E. M., Stevens, N. J., O’Connor, P. M., Dirks, P. H. G. M., Gottfried, M. D., Clyde, W. C., et al. (2012). Initiation of the Western branch of the East African Rift coeval with the eastern branch. Nat. Geosci. 5 (4), 289–294. doi:10.1038/ngeo1432
Root, B. C., Ebbing, J., van der Wal, W., England, R. W., and Vermeersen, L. L. A. (2017). Comparing gravity-based to seismic-derived lithosphere densities: A case study of the British Isles and surrounding areas. Geophys. J. Int. 208 (3), 1796–1810.
Schutt, D. L., and Lesher, C. E. (2010). Compositional trends among Kaapvaal Craton garnet peridotite xenoliths and their effects on seismic velocity and density. Earth Planet. Sci. Lett. 300 (3-4), 367–373. doi:10.1016/j.epsl.2010.10.018
Shulgin, A., and Artemieva, I. M. (2019). Thermochemical heterogeneity and density of continental and oceanic upper mantle in the European-North Atlantic region. J. Geophys. Res. Solid Earth 124 (8), 9280–9312. doi:10.1029/2018jb017025
Stamps, D. S., Calais, E., Saria, E., Hartnady, C., Nocquet, J. M., Ebinger, C. J., et al. (2008). A kinematic model for the East African rift. Geophys. Res. Lett. 35 (5), L05304. doi:10.1029/2007gl032781
Stamps, D. S., Kreemer, C., Fernandes, R., Rajaonarison, T. A., and Rambolamanana, G. (2021). Redefining east African rift system kinematics. Geology 49 (2), 150–155. doi:10.1130/g47985.1
Steinberger, B., and Calderwood, A. R. (2006). Models of large-scale viscous flow in the Earth's mantle with constraints from mineral physics and surface observations. Geophys. J. Int. 167 (3), 1461–1481. doi:10.1111/j.1365-246x.2006.03131.x
Steinberger, B. (2016). Topography caused by mantle density variations: Observation-based estimates and models derived from tomography and lithosphere thickness. Geophys. Suppl. Mon. Notices R. Astronomical Soc. 205 (1), 604–621. doi:10.1093/gji/ggw040
Stixrude, L., and Lithgow-Bertelloni, C. (2007). Influence of phase transformations on lateral heterogeneity and dynamics in Earth's mantle. Earth Planet. Sci. Lett. 263 (1-2), 45–55. doi:10.1016/j.epsl.2007.08.027
Stixrude, L., and Lithgow-Bertelloni, C. (2005b). Mineralogy and elasticity of the oceanic upper mantle: Origin of the low-velocity zone. J. Geophys. Res. Solid Earth 110 (B3), B03204. doi:10.1029/2004jb002965
Stixrude, L., and Lithgow-Bertelloni, C. (2011). Thermodynamics of mantle minerals-II. Phase equilibria. Geophys. J. Int. 184 (3), 1180–1213. doi:10.1111/j.1365-246x.2010.04890.x
Stixrude, L., and Lithgow-Bertelloni, C. (2005a). Thermodynamics of mantle minerals—I. Physical properties. Geophys. J. Int. 162 (2), 610–632. doi:10.1111/j.1365-246x.2005.02642.x
Tapley, B. D., Bettadpur, S., Watkins, M., and Reigber, C. (2004). The gravity recovery and climate experiment: Mission overview and early results. Geophys. Res. Lett. 31 (9). doi:10.1029/2004gl019920
Thiéblemont, D., Liégeois, J. P., Fernandez-Alonso, M., Ouabadi, A., Le Gall, B., Maury, R., et al. (2016). Geological map of africa at 1: 10M scale. Geol. Map. CGMW-BRGM.
Tondi, R., Schivardi, R., Molinari, I., and Morelli, A. (2012). Upper mantle structure below the European continent: Constraints from surface-wave tomography and GRACE satellite gravity data. J. Geophys. Res. Solid Earth 117 (B9). doi:10.1029/2012jb009149
Vacher, P., and Souriau, A. (2001). A three-dimensional model of the Pyrenean deep structure based on gravity modelling, seismic images and petrological constraints. Geophys. J. Int. 145 (2), 460–470. doi:10.1046/j.0956-540x.2001.01393.x
Wang, X., Holt, W. E., and Ghosh, A. (2015). Joint modeling of lithosphere and mantle dynamics: Evaluation of constraints from global tomography models. J. Geophys. Res. Solid Earth 120 (12), 8633–8655. doi:10.1002/2015jb012188
Wessel, P., Smith, W. H., Scharroo, R., Luis, J., and Wobbe, F. (2013). Generic mapping tools: improved version released. Eos, Transactions American Geophysical Union 94 (45), 409–410. doi:10.1002/2013EO450001
Xu, Y. G., Wei, X., Luo, Z. Y., Liu, H. Q., and Cao, J. (2014). The early permian Tarim large igneous province: Main characteristics and a plume incubation model. Lithos 204, 20–35. doi:10.1016/j.lithos.2014.02.015
Zhang, C. L., Zou, H. B., Li, H. K., and Wang, H. Y. (2013). Tectonic framework and evolution of the Tarim block in NW China. Gondwana Res. 23 (4), 1306–1315. doi:10.1016/j.gr.2012.05.009
Keywords: density structure, constrained inversion, gravity, seismic velocity perturbation, africa, volcanism, tectonics
Citation: Njinju EA, Moorkamp M and Stamps DS (2023) Density structure beneath the Rungwe volcanic province and surroundings, East Africa from shear-wave velocity perturbations constrained inversion of gravity data. Front. Earth Sci. 11:1118566. doi: 10.3389/feart.2023.1118566
Received: 07 December 2022; Accepted: 25 January 2023;
Published: 07 February 2023.
Edited by:
Shaohuan Zu, Chengdu University of Technology, ChinaReviewed by:
Qing Liang, China University of Geosciences Wuhan, ChinaYa Xu, Institute of Geology and Geophysics (CAS), China
Copyright © 2023 Njinju, Moorkamp and Stamps. This is an open-access article distributed under the terms of the Creative Commons Attribution License (CC BY). The use, distribution or reproduction in other forums is permitted, provided the original author(s) and the copyright owner(s) are credited and that the original publication in this journal is cited, in accordance with accepted academic practice. No use, distribution or reproduction is permitted which does not comply with these terms.
*Correspondence: Max Moorkamp, bW9vcmthbXBAZ2VvcGh5c2lrLnVuaS1tdWVuY2hlbi5kZQ==