 Ruiqi Fan1
 Guangzhi Liao1*
 Rui Mao2Xingping Luo2
 Lianhua Hou3Hao Zhang2
 Hua Tian3Gang Wang2Zhijun Qin2Lizhi Xiao1
- 1State Key Laboratory of Petroleum Resources and Prospecting, China University of Petroleum, Beijing, China
- 2Research Institute of Exploration and Development, Xinjiang Oilfield Company, Karamay, Xinjiang, China
- 3PetroChina Research Institute of Petroleum Exploration and Development, Beijing, China
The quantitative evaluation of fluid saturation is important for formation evaluation of shale oil. However, there is currently no effective method to identify the fluid occurrence state and quantitative evaluate the fluid saturation of lacustrine shale oil because of the complexity of diagenetic minerals and pore types. In this paper, a method is proposed for the quantitative evaluation of fluid saturation based on nuclear magnetic resonance (NMR), X-ray diffraction (XRD) and scanning electron microscopy (SEM) measurements for shale samples of Fengcheng Formation, Mahu sag in Junggar Basin, China. These studies revealed that the shale oil rocks mainly contain quartz, feldspar, dolomite, calcite and clay minerals, both develop organic and inorganic pores. The fluids mainly occur in the form of bitumen, clay bound water, bound water, bound oil and movable oil in this study area. Based on the findings from these experiments, a mixed rock index (MI) and mud index (SI) were proposed to divide the shale oil formations into three types, including sand shale, dolomitic shale and mudstone. A T1−T2 2D NMR fluid occurrence state characterization map was established to identify the different fluids by the MI, SI and NMR characteristics. Furthermore, a method was proposed to quantitatively calculate the coefficient distribution of bound and movable fluids for shale oil in different formations. Finally, the proposed method was successfully applied into the lacustrine shale oil in the Fengcheng Formation to identify fluid occurrence state and evaluate fluid saturation quantitatively.
1 Introduction
Lacustrine shale oil is widely distributed in lacustrine lake basins, such as Ordos Basin, Junggar Basin, China; Uinta Basin, America; Cooper Basin, Chad Bongor Basin, Australia; Sumatra Basin, Indonesia; Paris Basin, France; et al. (EIA, 2015; Zou et al., 2022) It has become an important field of petroleum resource exploration and development in current. However, due to the complexity diagenetic minerals and pore types, there is no effective method to quantitatively evaluate the fluid saturation and characterize fluid occurrence state of shale oil (Cao et al., 2020; Tang et al., 2020; Guan et al., 2022). Thus, the highlights of current research is the diverse pore types and complex fluid occurrence states which are important to evaluate oil-bearing accurately for shale oil exploration.
NMR has emerged as a key measurement for characterizing the fluid components of shale oil in downhole logging and laboratory studies. Different fluids have different T1/T2 ratio and T2 relaxation time, and different T2 relaxation time reflect different size of the pores. Thus, T1-T2 NMR can obtain more information on the fluid composition and pore types in shale oil. It can identify the fluid component of kerogen, bitumen, light/heavy oils, gases and brine in the formations and characterize the pore types of shale oil (Ge et al., 2015; Jia et al., 2017; Song and Kausik, 2019; Guo et al., 2020; Jin et al., 2021).
Researchers have done a lot of work in the two-dimensional NMR evaluation methods of shale oil. First, many NMR T1-T2 interpretation maps have been proposed to distinguish fluid occurrence states and quantitative evaluate the fluids volume for shale oil and gas, such as the universal NMR T1-T2 map for all the different constituents of gas and tight-oil shale at 2 MHz for US shales (Kausik et al., 2016), T1-T2 pattern of oil-bearing shale fluid or protons (Zhang et al., 2020b), the illustration of the low-field T1-T2 map for all the components in gas-shale (Zhou et al., 2020), the time-elapsed NMR T1-T2 map for shale oil core at 22 MHz (Li et al., 2022). Moreover, blind source separation (BBS) algorithm and non-negative matrix factorization (NMF) have been employed to determine free oil saturation in recent studies (Venkataramanan et al., 2018). Base on blind source separation (BBS) algorithm, the volume fractions of shale oil can be computed by hierarchical clustering; a method of fast independent component analysis (FastICA) was proposed for the inverted NMR spectrums to obtain the fluid components of shale oil; a method of two-dimensional (2D) principal component analysis (PCA) was proposed to quantitative evaluate the T1-T2 signatures of different fluids (Zhang H. et al., 2020; Gu et al., 2021; Gu et al., 2022). However, none of these studies dealt with the influence of complex lithology on the 2D NMR evaluation model for shale oil.
In this paper, aiming at the influence of complex lithology on shale oil, we use mixed rock index (MI) and mud index (SI) to divide the shale oil formations. A T1-T2 map of fluid occurrence state of shale oil was proposed by the NMR characteristics and MI value. Based the T1-T2 map, a 2D T1-T2 NMR quantitative calculation method was proposed to evaluate the movable oil saturation. The results show that the proposed method can be used to identify the fluid occurrence state and to evaluate shale oil-bearing quantitatively.
2 Geological setting
Mahu Sag is located on the northwestern edge of Junggar Basin in west China. It is mainly composed of Wuxia fault zone and part of the western slope, with an area of about 2039 km2 (Zou et al., 2022). Fengcheng Formation (P1f) is the main source rock reservoir of Mahu Sag. From top to bottom, Fengcheng Formation can be divided into Feng 3 (P1f3), Feng 2 (P1f2) and Feng 1 (P1f1), which mainly sand shale and dolomitic shale (Figure 1). The Fengcheng Formation shows a complex lithological assemblage, which belongs to the mixed rock. It is the main target of shale oil exploration and development in Mahu Sag (Hu et al., 2020). There are 3 sets of sweet spots in Fengcheng Formation, which are characterized by scattered sweet spots and thin oil layers (Li et al., 2020) The porosity of the reservoir is 1% ∼ 13%, with an average of 4.4%, and the permeability is mostly less than 0.1mD.
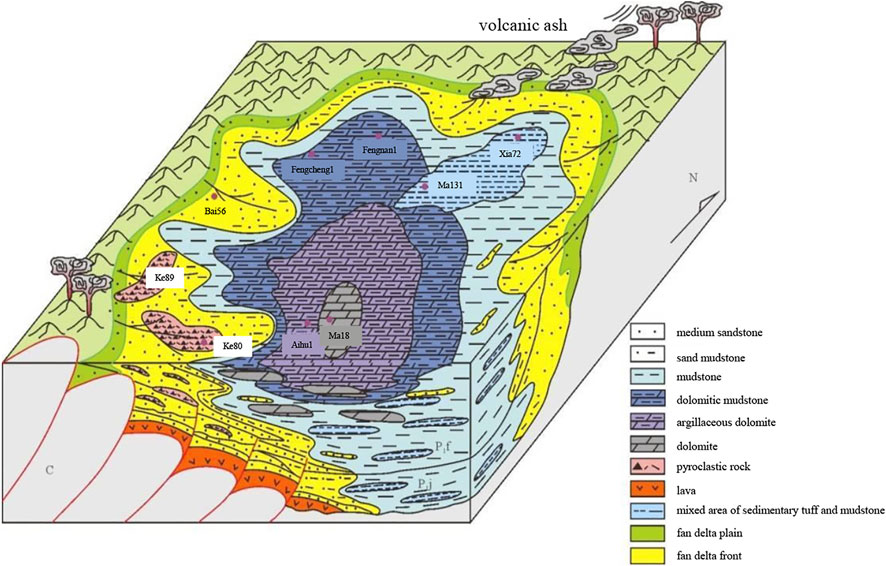
FIGURE 1. Alkaline-lake mixed sedimentary model in Mahu Sag (Kuang et al., 2012).
3 Experiments and method
3.1 Experiments
Shale oil rock samples were cut and prepared from Well W1 and Well W2 in Fengcheng Formation. Each sample was divided into 3 parts. Part 1 crushed for X-ray diffraction (XRD) analysis. Part 2 was made into thin slices for rock slice analysis and FE-SEM experiments. Part 3 was for the analysis of T2 and T1-T2 NMR experiments. The experiment results are shown in Table A1 (Appendix A).
NMR experiments were performed on NMR rock analyzer (2 MHz, Magritek). The instrument was operated at 30°C with a magnetic field strength of 0.05T and a frequency of 2 MHz. These experiments used CPMG and IR-CPMG pulse sequences to obtain T2 and T1-T2 maps (Hürlimann, 2001). The testing parameters for T2 were 100 us echo spacing time, 2 s waiting time, 128 scans, and 4,000 echoes. The testing parameters for 2D T1-T2 were 100 us T2 echo spacing time, 2 s waiting time, 64 scans, 4,000 echoes, 0.1 ms T1 editing start time, 2000 ms T1 editing stop time.
(1) Original shale samples were subjected to NMR T2 distribution and T1-T2 map testing.
(2) After saturation, the mass of the saturated oil shales was measured.
(3) After oil washing, the mass of the dry shales was measured. Before the NMR T2 distribution and T1-T2 map tests, the shales were heated at 80°C for 24 hours. The organic solvent used in shale core washing experiment is a mixed solution of dichloromethane and methanol.
(4) After saturation, the mass of the re-saturated oil shales was measured. The fluids used in shale oil core saturation experiments are all crude oil taken from Fengcheng Formation, Mahu.
3.2 Method
This paper aims to evaluate fluid occurrence state and fluid saturation of lacustrine shale oil in Fengcheng Formation. We proposed a reservoir classification method [mixed rock index (MI) and mud index (SI)] to divide formations to eliminate the influence of complex lithology for shale oil. And a formation classification method was proposed to divide the shale oil formations into three types, including sand shale, dolomitic shale, and mudstone by the MI and SI. Based on the 2D T1-T2 NMR experiments and formation classification results, a characterization model of fluid occurrence state was established to identify fluids component and quantitative evaluate fluids saturation. Finally, a workflow of the proposed method for the quantitative evaluation of fluid saturation of lacustrine shale oil was established (Figure 2).
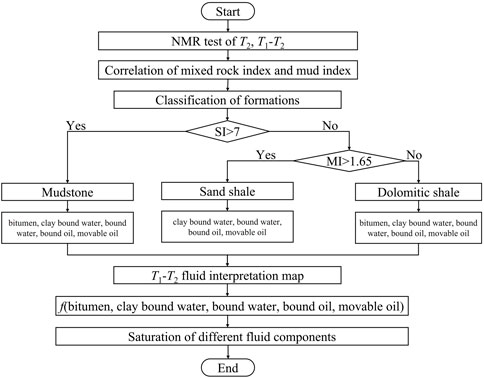
FIGURE 2. Workflow of the proposed method for the quantitative evaluation of fluid saturation of lacustrine shale oil.
4 Results
4.1 Composition and structural characteristics of shale oil
The results of the mineral compositions of shale samples are listed in Table A1 (Appendix A). Mineral compositions are dominated by quartz, feldspar, clay minerals, dolomite, calcite and pyrite. Carbonate minerals (dolomite and calcite) ranges from 8.5% to 70.9%, with an average of 22.89%. Clay minerals content is low which ranges from 5.4% to 24.1%, with an average value of 11.85%. The main clay minerals types are montmorillonite, illite montmorillonite mixed layer, chlorite montmorillonite mixed layer and illite. Montmorillonite content is 5% ∼ 88%, with an average of 31.8%. Illite montmorillonite mixed layer is between 18% and 85%, with an average of 26.37%. Chlorite montmorillonite mixed layer is between 11% and 77%, with an average of 15.6%. Illite content is 6% to 30%, with an average value of 17.2%. The TOC content ranges from 0.01 wt% to 1.07 wt%, with an average value of 0.38 wt%, shows a low organic matter content.
Based on the findings from these experiments, the rock type of Fengcheng Formation includes carbonate rocks, tight sandstones, and mixed sedimentary rock (Figure 3). Moreover, the Feng 3 (P1f3) mainly sand shale, the content of felsic minerals is the highest, followed by carbonate minerals. And the Feng 2 (P1f2) mainly dolomitic shale, the content of carbonate minerals is the highest, followed by felsic minerals. The clay mineral content is low throughout the Fengcheng Formation. The main clay minerals of Feng 2 (P1f2) are chlorite montmorillonite mixed layer, montmorillonite and illite; the main clay mineral components of Feng 3 (P1f3) are montmorillonite, chlorite montmorillonite mixed layer, illite montmorillonite mixed layer and illite.
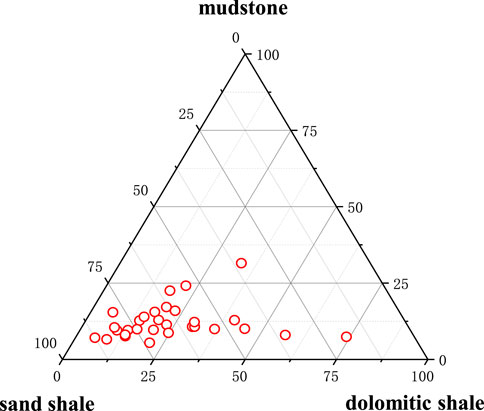
FIGURE 3. The rock type of Fengcheng Formation includes carbonate rocks, tight sandstones, sedimentary tuffs and mixed sedimentary rock.
4.2 Pore structure features
The SEM measurement shows that shale oil mainly develops pores and micro-fractures in Fengcheng Formation. The pores include intergranular pores, dissolution pores, intercrystalline pores and organic pores, which mainly composed of nanopores and micropores (Figure 4). Intercrystalline and dissolution pores are commonly found in dolomite and calcite. Intergranular pores are commonly found in clay minerals and detrital minerals such as quartz and feldspar. Organic pores are pore spaces created in organic matter and often showing hydrophobicity. The micro-fractures mainly bedding fractures and structural fractures (Figure 4).
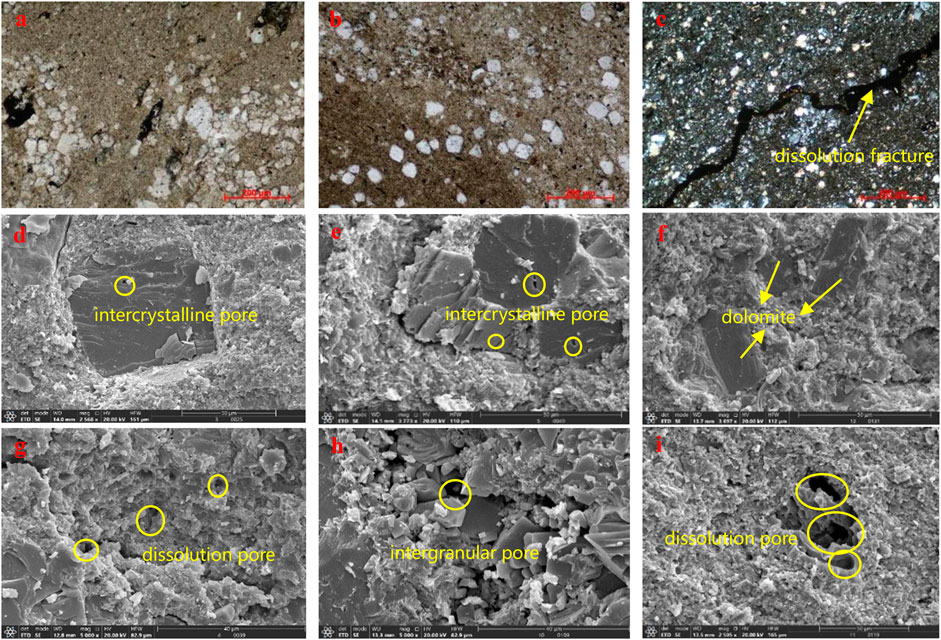
FIGURE 4. Microscopic characteristics of Fengcheng Formation. (A) Dolomite argillaceous anisotropic sandstone with a small amount of organic residues; (B) Dolomite-bearing mudstone, dust-spot-like, silk-like organic matter residues; few dissolved pores; (C) Dolomite sandy mudstone, 3 dissolution fractures, the fracture width is 0.01–0.04 mm; (D) Microcrystalline dolomite, intercrystalline pores (SEM); (E) Intercrystalline pores (SEM); (F) Dolomite and feldspar crystals (SEM); (G) Dissolved pores (SEM); (H) Intercrystalline pores and intergranular pores (SEM); dissolved pores (SEM).
4.3 Reservoir classification method
Mixed sedimentary rock is formed by terrigenous clastic and carbonate components. The types of mixed sedimentary rock mainly include calcareous sandstone, silty marl, dolomitic sandy shale, dolomitic siltstone and lithic sandstone (Mount, 1984; Mount, 1985). The Fengcheng Formation in Mahu Sag is a typical mixed sedimentary rock shale oil. In this work, we studied the mineral composition and lithology of the Fengcheng Formation mixed rocks by casting thin sections and SEM. The results show that shale reservoirs were mixed with many sandstones, dolomite and terrigenous clasts. The carbonate minerals (dolomite and calcite) ranges from 8.5% to 70.9%. And felsic minerals (quartz and feldspar) ranges from 30% to 90% (Figure 5). Thus, based on the previous method of calculating brittleness index according to the content of quartz, feldspar and carbonate minerals (Eq. 4.1) (Lai et al., 2015), we propose the mixed rock index (MI) based on the content of felsic minerals and carbonate minerals to evaluate the oil-bearing of shale oil reservoirs (Eq. 4.2). Moreover, in order to calculate the mudstone content, we propose a mud index (SI), using the difference between CNL and NMR porosity to calculate the shale mudstone of shale oil reservoir.
among them, BI is the brittleness index, Wqz, Wfels, Wcar, and Wclay are the percentages of quartz, feldspar, calcite and dolomite, clay respectively, %.
among them, MI is the mixed rock index, wquarz, wfledspar, wcalcite, and wdolomite are the percentages of quartz, feldspar, calcite and dolomite respectively, %.
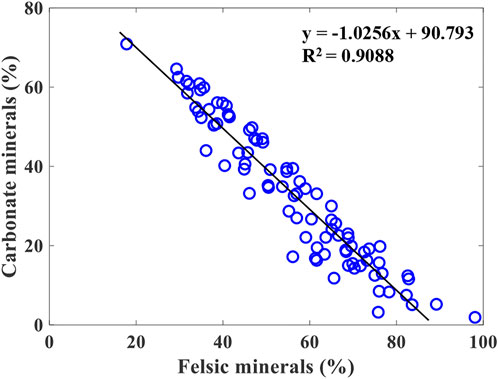
FIGURE 5. The plot of felsic minerals and carbonate mineral.
The shale oil formation in study area can be divided into three types based on the petrological classification standard, including sand shale, dolomitic shale and mudstone (listed in Table 1). Sand shale is rich in felsic minerals and organic matters, with higher MI. The main lithology is siltstone. Dolomitic shale is rich in dolomite and calcite, with lower MI and felsic minerals. The main lithology is carbonate (Figure 6). And mudstone with higher mud index (Figure 7).
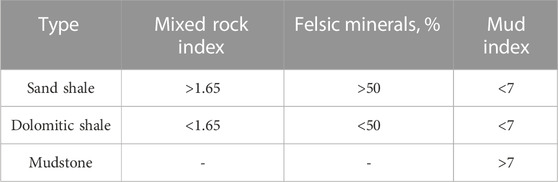
TABLE 1. Classification of shale oil reservoirs in Fengcheng Formation.
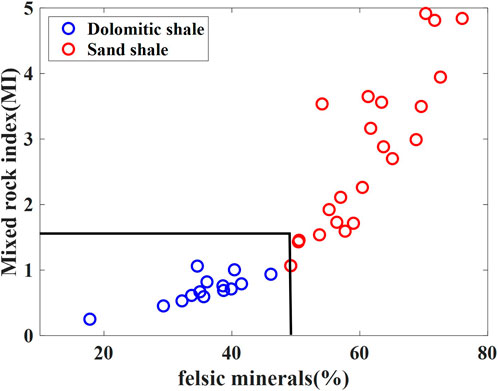
FIGURE 6. The relationship plot between MI and felsic minerals content.
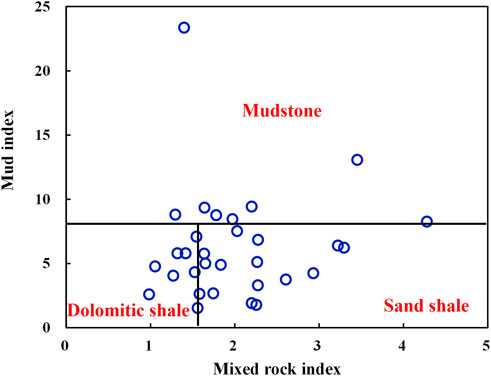
FIGURE 7. Shale oil reservoir type classification results.
4.4 NMR response characteristics of shale oil
4.4.1 NMR relaxation characteristics of shale
Different T2 response characteristics have different lithology and MI, which have great influence on the NMR response characteristics of shale oil. The NMR T2 relaxation time distribution of Fengcheng Formation is narrow, about 0.03 ms ∼ 200 ms. The components of crude oil are complex, mainly medium and high viscosity crude oil. The comparison between original shale and saturated oil shale shows that the shale oil samples have good storage space. The saturation T2 spectrum is three peaks or two peaks, including bitumen, clay bound water, bound water, bound oil, and movable oil. Bitumen exists in organic pores, which is adsorbed oil. Clay bound water exists in clay mineral, which is adsorbed water. Bound water develops in inorganic pores, and the pore size is about several nanometers, which is capillary bound water. Bound oil develops in both organic and inorganic pores, and the pore size is about several nanometers, which is adsorbed oil. Movable oil mostly develops in organic pores and inorganic pores of micropore, which is free oil. Crude oil with fluidity not only exists in micropores, but also has good fluidity in nanopores. The T2 signal is mainly concentrated in the short relaxation part, and the T2 signal in the long relaxation part is low. The overall relaxation time is short, not exceeding 700 ms. By analyzing the results of the T2 NMR experiments (Figure 8), we find that the NMR T2 spectrum of shale cores are mainly divided into three types.
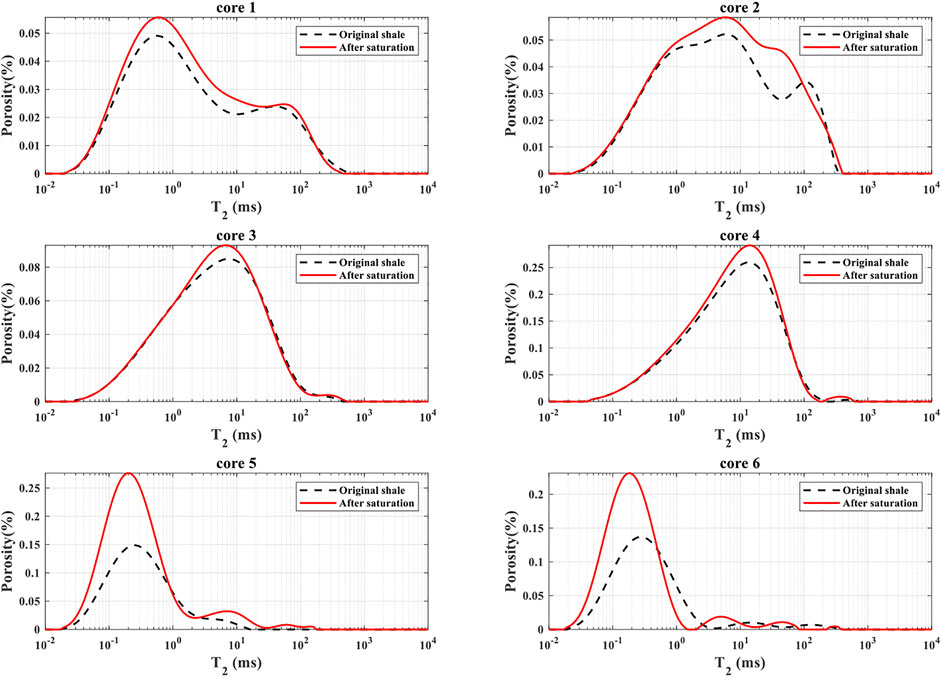
FIGURE 8. T2 NMR experiment results of shale cores.
Sand shale: The fluid signal is distributed in the long transverse relaxation time component, the main peak is around 10 ms, and the movable oil signal and the bound oil signal overlap (Figure 8, core 1, core 2).
Dolomitic shale: The fluid signal is mainly distributed in the short and medium transverse relaxation components, the main peak is around 1 ms, and the movable oil signal overlaps with the irreducible water signal and the irreducible oil signal (Figure 8, core 3, core 4).
Mudstone: The fluid signal is mainly distributed in the short transverse relaxation component, the main peak is around 0.2 ms, the movable oil signal overlaps with the irreducible water signal (Figure 8, core 5, core 6).
4.4.2 T1-T2 experiments
The experimental results of the 2D NMR T1-T2 maps are shown in Figure 9. The shale T1-T2 map can mainly divided into three types and consistent with T2 results. Fluids are mainly present in shale in the form of movable oil, bound oil, bound water, clay-bound water and bitumen. The T1/T2 of movable oil is about 7 ∼ 15, and the signal of movable oil is distributed in the whole relaxation spectrum. It shows that the crude oil with fluidity not only exists in the micropores, but also has good fluidity in the nanopores. The T1/T2 of the bound oil is about 5 ∼ 10, and the fluid signal is mainly concentrated in the short relaxation component, which occurs in organic pores and nano-scale inorganic pores. The T1/T2 of the bound water is about 2 ∼ 5, and the fluid signal is mainly concentrated in the short relaxation component, which occurs in nano-scale inorganic pores. The T1/T2 of clay bound water is about 1, and the fluid signal is concentrated at 0.05 ms ∼ 1 ms. The T1/T2 of bitumen is about 3∼300, the fluid signal is distributed in a very short relaxation time period, and the signal decays rapidly.
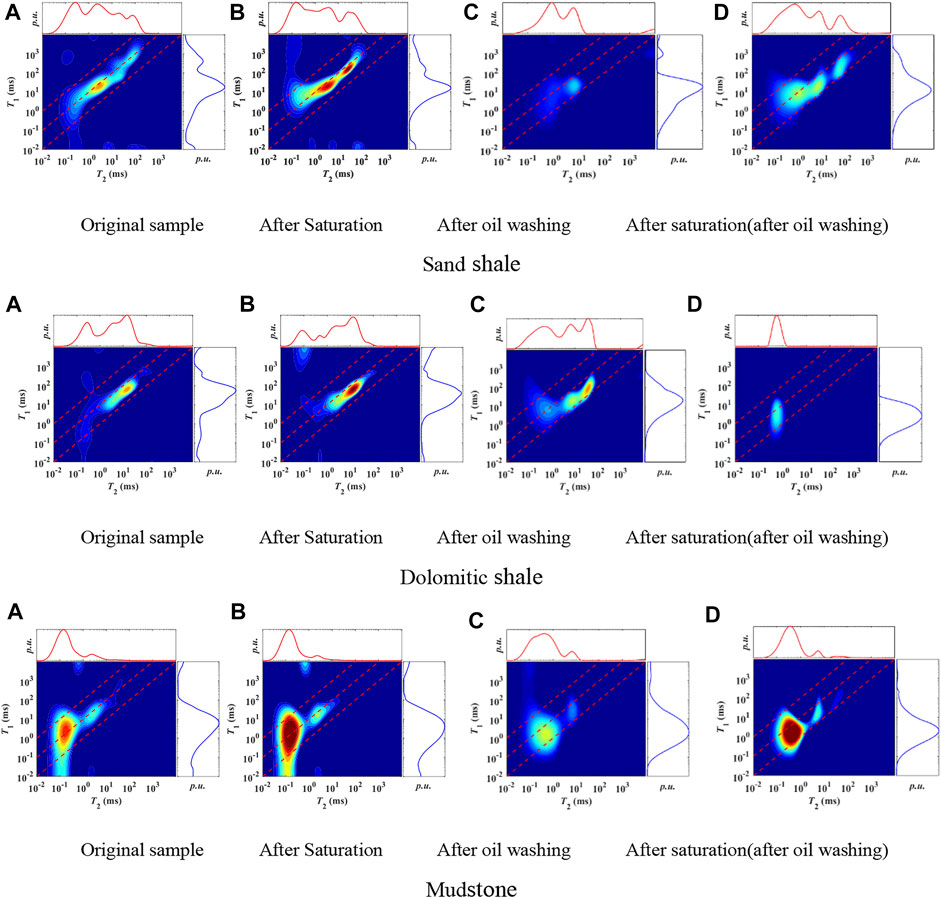
FIGURE 9. 2D T1/T2 NMR experiment results of shale cores. (A) Original sample; (B) After saturation sample; (C) After oil washing sample; (D) After saturation (after oil washing) sample.
Discussion
5.1 2D NMR T1-T2 interpretation modal of shale oil
By comparing two-dimensional T1-T2 spectra of shale oil cores under different states (Figure 9), a 2D NMR logging interpretation map was established to identify the fluid occurrence state for shale oil (Figure 10). Based on T1/T2 ratios and T2 cutoff values of fluid signals as the classification basis, the fluids types of shale oil include movable oil, bound oil, bound water, clay-bound water, and bitumen. The T1/T2 of movable oil is about 7∼15, and the T2 signal of movable oil is 30∼300 ms. The T1/T2 of the bound oil is about 5∼10, and the T2 fluid signal is 0.3∼30 ms. The T1/T2 of the bound water is about 2∼5, and the T2 fluid signal is 0.3∼30 ms. The T1/T2 of clay-bound water is about 1, and the T2 fluid signal is 0.01 ms∼0.3 ms. The T1/T2 of bitumen is about 3∼300, the T2 fluid signal is 0.01∼0.3 ms. The T1-T2 interpretation map of shale oil was consistent with that obtained by NMR T1-T2 experiments (Figures 11–13). Results show that the T1-T2 interpretation map can be used to determine the porosity, movable oil and bound oil contents, and saturations of shale oil.
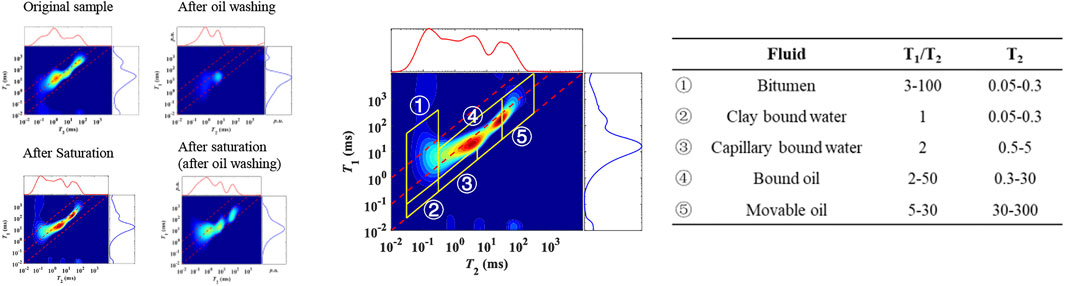
FIGURE 10. Sand shale.
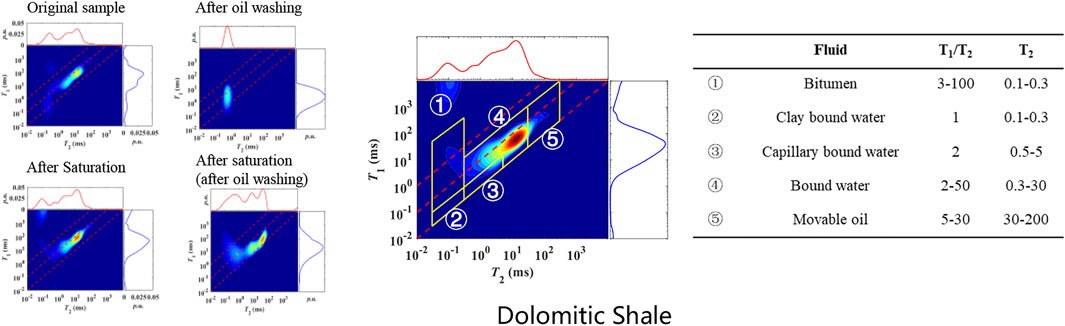
FIGURE 11. Dolomitic Shale.
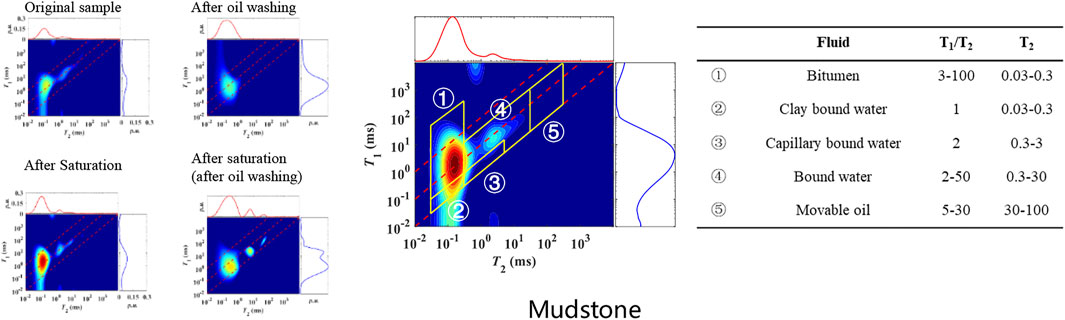
FIGURE 12. Mudstone.
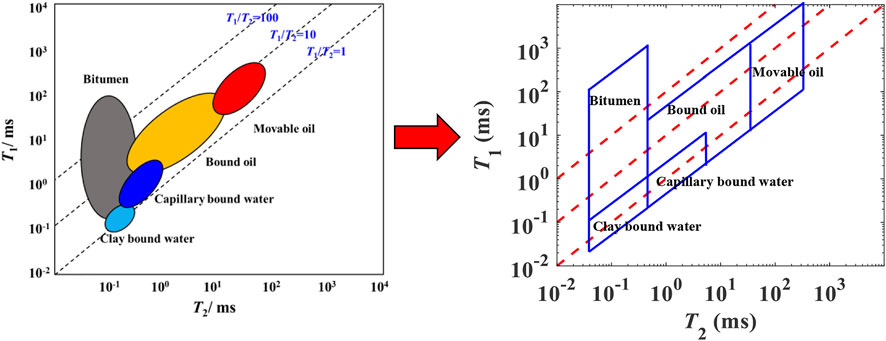
FIGURE 13. T1-T2 2D NMR fluid identification map at 2MHz for Fengcheng Formation.
Based on the established NMR T1-T2 fluid identification map, we divide the T1-T2 distribution map into five areas. The NMR T1-T2 spectral area coefficients of different fluid component were obtained from NMR measurements. Using the method of 2D area spectrum coefficient, we establish a fluid saturation calculation model for shale oil.
5.2 Application
We apply the 2D NMR logging interpretation map and effective porosity calculation for the actual logging data to identify the occurrence state of downhole fluids, calculate the movable oil saturation and effective porosity. The higher MI value, and the higher movable oil saturation of shale oil in the Fengcheng Formation. Figure 14 is the 2D NMR logging curve of Well W2 in the Mahu Sag. From the logging interpretation results, we find that the XX44m position is sand shale formation, with high mixed rock index, and high movable oil content, which is consistent with the actual logging.
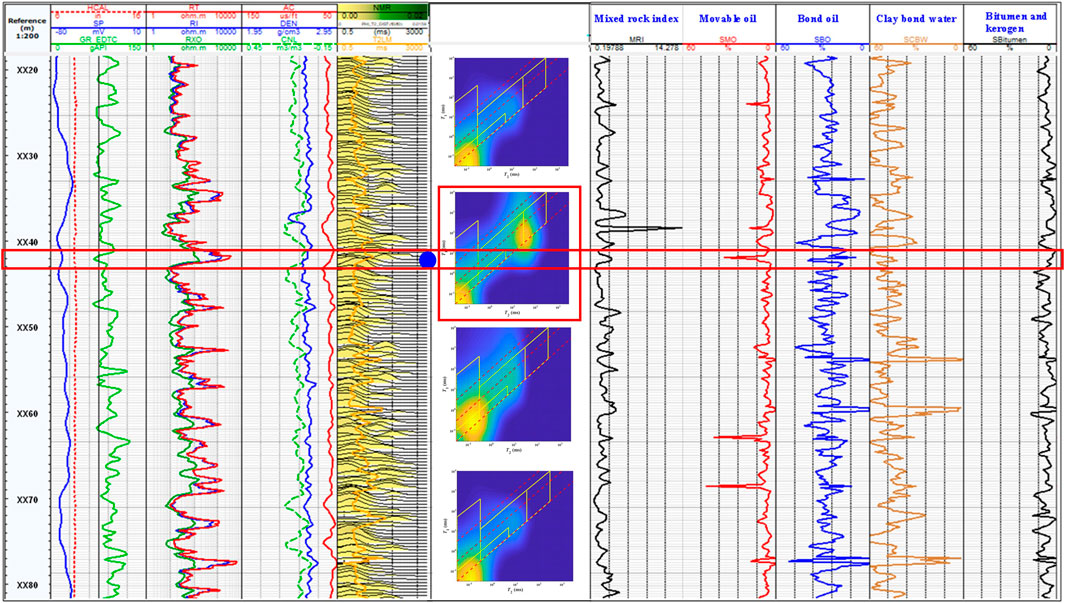
FIGURE 14. NMR logging evaluation results of Well W2. The first track is depth. The second track includes the gamma (GR), SP, and caliper (CAL) logs. The third track includes the deep, medium, and shallow resistivity logs. The fourth track includes the acoustic (AC), density (DEN), and compensated neutron logging (CNL) logs. The fifth track shows the T2 distributions (T2_DIST). The sixth track gives the mixed rock index. Tracks 7, 8, 9, and 10 are the NMR fluid saturation from the method we established.
6 Conclusion
This paper aims to evaluate fluid occurrence state and fluid saturation of lacustrine shale oil in Fengcheng Formation. We use mixed rock index (MI) and mud index (SI) to divide formations to eliminate the influence of complex lithology. Furthermore, based on the 2D T1-T2 NMR experiments and formation classification results, a characterization model of fluid occurrence state was established. The characterization model was successfully applied to the lacustrine shale oil in the Fengcheng Formation, Mahu sag, Junggar Basin, China.
(1) A formation classification method was proposed by the MI value, SI value and the felsic minerals content to eliminate the influence of complex lithology on the fluid occurrence state of shale oil. The shale oil of Fengcheng Formation was divided into three types, including sand shale, dolomitic shale and mudstone.
(2) A model of NMR 2D T1-T2 logging interpretation map was established for shale oil through the T1/T2 ratio and T2 cutoff value. The shale oil fluids are differentiated into movable oil, bound oil, bound water, clay bound water and bitumen. Based on 2D NMR T1-T2 map, a quantitative calculation method of fluid saturation was proposed for shale oil. It has implications for understanding fluid occurrence state and evaluating fluid saturation in shale oil with similar geological settings.
Data availability statement
The original contributions presented in the study are included in the article/supplementary material, further inquiries can be directed to the corresponding author.
Author contributions
RF is mainly responsible for the writing and modification of the article, as well as the experiments, data processing and analysis required for article writing; GL is mainly responsible for guiding the revision of the article and data analysis and processing, to provide technical support; RM, XL, LH, HZ, HT, GW, ZQ, and LX provided financial support and technical support in the writing and preparation of articles. All authors participated in the revision and agreed to submit the published version.
Funding
This work was supported by National Key Research and Development Program (2019YFA0708301), National Natural Science Foundation of China (51974337), the Strategic Cooperation Technology Projects of CNPC and CUPB (ZLZX 2020-03), Strategic Priority Research Program (A) of Chinese Academy of Sciences (XDA14020405).
Acknowledgments
The authors also thank for assistance and data supports from China National Petroleum Corporation, China National Offshore Oil Corporation. Thanks to the hard work of many colleagues, collaborators, doctoral and master students in the China University of Petroleum. Thanks to Harvard University and the Weitz’s Lab for providing visiting opportunities.
Conflict of interest
Authors RM, XL, HZ, GW, and ZQ were employed by Xinjiang Oilfield Company. Authors LH and HT were employed by PetroChina.
The remaining authors declare that the research was conducted in the absence of any commercial or financial relationships that could be construed as a potential conflict of interest.
Publisher’s note
All claims expressed in this article are solely those of the authors and do not necessarily represent those of their affiliated organizations, or those of the publisher, the editors and the reviewers. Any product that may be evaluated in this article, or claim that may be made by its manufacturer, is not guaranteed or endorsed by the publisher.
References
Althaus, S., Chen, J.-H., Jacobi, D., and Brothers, J. (2019) “NMR Signature and quantification of bitumen in unconventional source Rocks,” in SPE/AAPG/SEG Unconventional Resources Technology Conference.
Cao, J., Xia, L., Wang, T., Zhi, D., Tang, Y., and Li, W. (2020). An alkaline lake in the late paleozoic ice age (lpia): A review and new insights into paleoenvironment and petroleum geology. Earth-Science Rev. 202, 103091.
Cudjoe, S. E., Barati, R., Tsau, J.-S., Zhang, C., Nicoud, B., Bradford, K., et al. (2021). Assessing the efficiency of saturating shale oil cores and evaluating hydrocarbon gas huff ‘n’ puff using nuclear magnetic resonance. SPE Reserv. Eval. Eng. 24, 429–439.
EIA (2015). Technically recoverable shale oil and shale gas resources[EB/OL]. (2015 -09-24). https://www.eia.gov/analysis/studies/worldshale gas/pdf/Oman_2014.pdf.
Ge, X., Fan, Y., Chen, H., Deng, S., Cao, Y., and Zahid, M. A. (2015). Probing the influential factors of NMR T1–T2 spectra in the characterization of the kerogen by numerical simulation. J. Magnetic Reson. 260, 54–66.
Gu, M., Xie, R., and Jin, G. (2022). A new quantitative evaluation method for fluid constituents with NMR T1-T2 spectra in shale reservoirs. J. Nat. Gas Sci. Eng. 99, 104412.
Gu, M., Xie, R., Jin, G., Xu, C., Wang, S., Liu, J., et al. (2021). Quantitative evaluation for fluid components on 2D NMR spectrum using Blind Source Separation. J. Magnetic Reson. 332, 107079.
Guan, M., Liu, X., Jin, Z., Lai, J., Liu, J., Sun, B., et al. (2022). Quantitative characterization of various oil contents and spatial distribution in lacustrine shales: Insight from petroleum compositional characteristics derived from programed pyrolysis. Mar. Petroleum Geol. 138, 105522.
Guo, J., Xie, R., and Xiao, L. (2020). Pore-fluid characterizations and microscopic mechanisms of sedimentary rocks with three-dimensional NMR: Tight sandstone as an example. J. Nat. Gas Sci. Eng. 80, 103392.
Hu, S., Jianzhong, L., Tongshan, W., Zecheng, W., Tao, Y., Zin, L., et al. (2020). CNPC oil and gas resource potential and exploration target selection. Petroleum Geol. Exp. 42, 813–823.
Hürlimann, M. D. (2001). Carr–purcell sequences with composite pulses. J. Magnetic Reson. 152, 109–123.
Jia, Z. J., Xiao, L. Z., Zhizhan, W. Z., Liao, G. Z., Zhang, Y., Liang, C., et al. (2017). Magic echo for nuclear magnetic resonance characterization of shales. ENERGY & FUELS 31, 7824–7830.
Jin, G., Xie, R., Xiao, L., Wu, B., Xu, C., Wang, X., et al. (2021). Quantitative characterization of bound and movable fluid microdistribution in porous rocks using nuclear magnetic resonance. J. Petroleum Sci. Eng. 196, 107677.
Kausik, R., Fellah, K., Rylander, E., Singer, P. M., Lewis, R. E., and Sinclair, S. M. (2016). NMR relaxometry in shale and implications for logging. Petrophysics - SPWLA J. Form. Eval. Reserv. Descr. 57, 339–350.
Kuang, L., Yong, T., Dewen, L., Qiusheng, C., Min, O., Lianhau, H., et al. (2012). Formation conditions and exploration potential of tight oil in the Permian saline lacustrine dolomitic rock, Junggar Basin, NW China. PETROLEUM Explor. Dev. 39, 657–667.
Lai, J., Wang, G., Huang, L., Li, W., Ran, Y., Wang, D., et al. (2015). Brittleness index estimation in a tight shaly sandstone reservoir using well logs. J. Nat. Gas Sci. Eng. 27, 1536–1545.
Li, J., Wang, M., Fei, J., Xu, L., Shao, H., Li, M., et al. (2022). Determination of in situ hydrocarbon contents in shale oil plays. Part 2: Two-dimensional nuclear magnetic resonance (2D NMR) as a potential approach to characterize preserved cores. Mar. Petroleum Geol. 145, 105890.
Li, J., Wang, M., Lu, S., Chen, G., Tian, W., Jiang, C., et al. (2020). A new method for predicting sweet spots of shale oil using conventional well logs. Mar. Petroleum Geol. 113, 104097.
Mount, J. F. (1984). Mixing of siliciclastic and carbonate sediments in shallow shelf environments. Geology 12, 432–435.
Mount, J. (1985). Mixed siliciclastic and carbonate sediments: A proposed first-order textural and compositional classification. Sedimentology 32, 435–442.
Song, Y.-Q., and Kausik, R. (2019). NMR application in unconventional shale reservoirs – a new porous media research frontier. Prog. Nucl. Magnetic Reson. Spectrosc. 112-113, 17–33.
Tang, W., Zhang, Y., Pe-Piper, G., Piper, D. J. W., Guo, Z., and Li, W. (2020). Soft-sediment deformation structures in alkaline lake deposits of Lower Permian Fengcheng Formation, Junggar Basin, NW China: Implications for syn-sedimentary tectonic activity. Sediment. Geol. 406, 105719.
Venkataramanan, L., Evirgen, N., Allen, D. F., Mutina, A., Cai, Q., Johnson, A. C., et al. (2018). An unsupervised learning algorithm to compute fluid volumes from NMR T1-T2 logs in unconventional reservoirs. Petrophysics - SPWLA J. Form. Eval. Reserv. Descr. 59, 617–632.
Zhang, H., Wang, Y., Fang, T., Wang, W., Zhao, X. R., Zhao, H. P., et al. (2020a). “First application of new generation NMR T1-T2 logging and interpretation in unconventional reservoirs in China,” in SPE Asia Pacific Oil & Gas Conference and Exhibition.
Zhang, P., Lu, S., Li, J., and Chang, X. (2020b). 1D and 2D Nuclear magnetic resonance (NMR) relaxation behaviors of protons in clay, kerogen and oil-bearing shale rocks. Mar. Petroleum Geol. 114, 104210.
Zhou, G., Gu, Z., Hu, Z., Chang, J., Duan, X., Liu, X., et al. (2020). Characterization and interpretation of organic matter, clay minerals, and gas shale rocks with low-field NMR. J. Petroleum Sci. Eng. 195, 107926.
Appendix
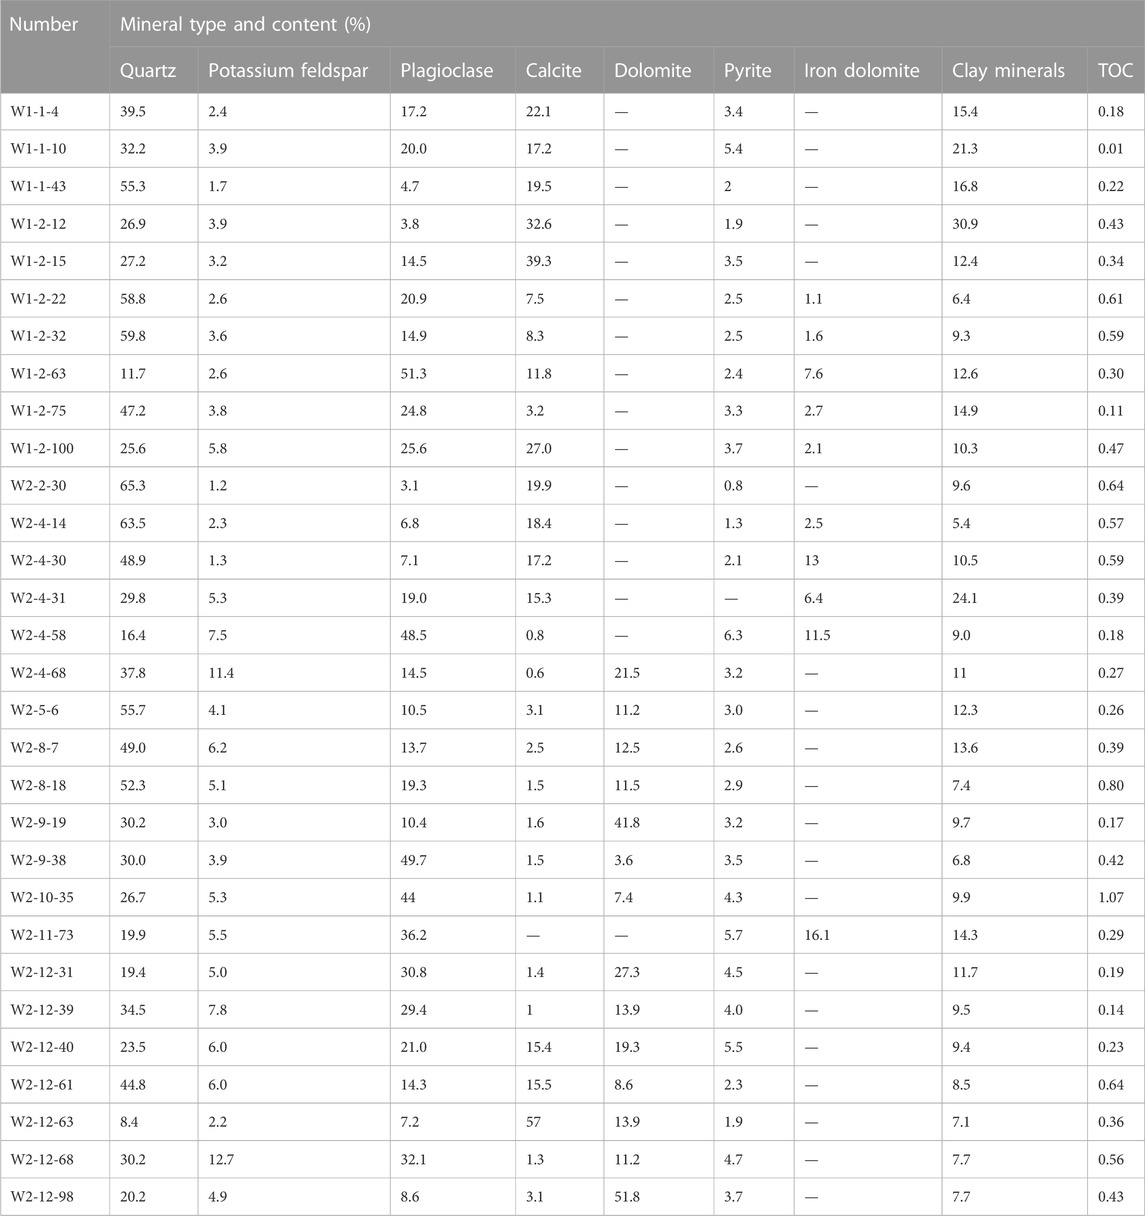
TABLE A1. Mineral composition and TOC content of shale samples from Fengcheng formation in Mahu Sag, Junggar Basin.
Keywords: T1-T2 NMR, fluid occurrence state, fluid saturation, lacustrine shale oil, quantitative evaluation
Citation: Fan R, Liao G, Mao R, Luo X, Hou L, Zhang H, Tian H, Wang G, Qin Z and Xiao L (2023) Nuclear magnetic resonance response characteristics and quantitative evaluation method of fluid saturation of lacustrine shale oil. Front. Earth Sci. 11:1117193. doi: 10.3389/feart.2023.1117193
Received: 06 December 2022; Accepted: 19 January 2023;
Published: 15 February 2023.
Edited by:
Qiaomu Qi, Chengdu University of Technology, ChinaReviewed by:
Liang Wang, Chengdu University of Technology, ChinaWenlian Xiao, Southwest Petroleum University, China
Copyright © 2023 Fan, Liao, Mao, Luo, Hou, Zhang, Tian, Wang, Qin and Xiao. This is an open-access article distributed under the terms of the Creative Commons Attribution License (CC BY). The use, distribution or reproduction in other forums is permitted, provided the original author(s) and the copyright owner(s) are credited and that the original publication in this journal is cited, in accordance with accepted academic practice. No use, distribution or reproduction is permitted which does not comply with these terms.
*Correspondence: Guangzhi Liao, bGlhb2d1YW5nemhpQGN1cC5lZHUuY24=