 Yuguo Chen
 Xinyi Zhang
- School of Civil Engineering and Architecture, Nanchang University, Nanchang, China
The prediction performance of several machine learning models for regional flash flood susceptibility is characterized by variability and regionality. Four typical machine learning models, including multilayer perceptron (MLP), logistic regression (LR), support vector machine (SVM), and random forest (RF), are proposed to carry out flash flood susceptibility modeling in order to investigate the modeling rules of different machine learning models in predicting flash flood susceptibility. The original data of 14 environmental factors, such as elevation, slope, aspect, gully density, and highway density, are chosen as input variables for the MLP, LR, SVM, and RF models in order to estimate and map the distribution of the flash flood susceptibility index in Longnan County, Jiangxi Province, China. Finally, the prediction performance of various models and modeling rules is evaluated using the ROC curve and the susceptibility index distribution features. The findings show that: 1) Machine learning models can accurately assess the region’s vulnerability to flash floods. The MLP, LR, SVM, and RF models all predict susceptibility very well. 2) The MLP (AUC=0.973, MV=0.1017, SD=0.2627) model has the best prediction performance for flash flood susceptibility, followed by the SVM (AUC=0.964, MV=0.1090, SD=0.2561) and RF (AUC=0.975, MV=0.2041, SD=0.1943) models, and the LR (AUC=0.882, MV=0.2613, SD=0.2913) model. 3) To a large extent, environmental factors such as elevation, gully density, and population density influence flash flood susceptibility.
1 Introduction
A flash flood is defined as rapid flooding within the distribution of drainage basins in hilly areas (Bobrowsky, 2013), and it is characterized by rapid disaster generation, strong ring-breaking, and unpredictability, as well as the potential for a large number of casualties (Marchi et al., 2010). China has paid close attention in recent years to the predictive study of geological hazard susceptibility. Because China has many hilly areas, flash floods affect a wide range of areas, and regional flash floods are easy to produce under short-term heavy rainfall (Bobrowsky, 2013). With China’s elevated level of climate risk and an increase in extreme weather, such as heavy rainfall, regional research on flash flood susceptibility is becoming increasingly important.
With the continuous development of GIS and machine learning methods in recent years, an increasing number of researchers have cross-fertilized the engineering geology analogy method across disciplines to obtain more accurate susceptibility prediction models (István et al., 2022). Processing preliminary data, obtaining information on required environmental factors, selecting basic environmental factors, dividing prediction units, distributing training and test datasets, selecting susceptibility prediction models, plotting accuracy curves, and testing results are typical steps in susceptibility prediction modeling (Huang et al., 2021a). Choosing machine learning models is critical to modeling uncertainty, according to the susceptibility prediction modeling steps. Different machine learning models have different effects on regional susceptibility prediction results; thus, the prediction performance of different machine learning models varies (Ha et al., 2021). According to existing studies, machine learning models are widely used in susceptibility prediction modeling due to their powerful ability to handle non-linear data with different scales and from different types of sources (Zhang et al., 2022). Recently, the research field of machine learning models has been rapidly expanding, with models such as multilayer perceptron (MLP) (Haribabu et al., 2021), support vector machine (SVM) (Xiong et al., 2019), logistic regression (LR) (Nguyen and Bouvier, 2019; Huang et al., 2020a), random forest (RF) (Abedi et al., 2022), decision trees (Ngo et al., 2021), and artificial neural networks (Dahri et al., 2022).
Numerous studies have demonstrated that the susceptibility prediction results of the aforementioned machine learning models are highly credible. In other words, it is possible to assess the vulnerability of actual geological hazards (Jiang et al., 2018; Huang et al., 2021b). However, the selection of susceptibility prediction models is currently not well defined, and the weights of input variables and analysis methods differ between machine learning models (Ha et al., 2021). Meanwhile, the machine learning models are regional, which means that the prediction accuracy of each model varies from district to district (Huang et al., 2020b). Roy et al. (2020) used machine learning models, for example, to predict the impact of climate and soil characteristics on flash flood susceptibility. They concluded that the RF model outperforms SVM in prediction performance and has the advantages of a simple implementation process, strong data mining capability, and broad applicability. Zhao et al. (2018) classified and evaluated flash flood susceptibility using multiple machine learning models. They discovered that the RF model outperformed other models such as SVM and ANN in identifying flash flood-prone areas. Elkhrachy (2022) investigated flood depth using machine learning models based on remotely sensed data and concluded that the ML model outperformed the RFR. Wang et al. (2021) demonstrated the multilayer perceptron-probability density hybrid model’s excellent prediction performance in their study of flash flood susceptibility in Poyang County.
The MLP model has excellent non-linear mapping capabilities in performing susceptibility prediction compared to deterministic models or general linear statistical methods (Li et al., 2019). The LR model is controlled by multiple variables, and the algorithm has the advantage that the independent variables do not need to satisfy a normal distribution (Das and Lepcha, 2019). The SVM model has many unique advantages, which are reflected in solving large sample, non-linear, and high-dimensional pattern recognition problems (Wang et al., 2019). Based on statistical analysis, the RF model has the characteristics of simplicity, ease of calculation, and high accuracy (Demir et al., 2013). Consequently, to analyze and compare the prediction performance of different categories of machine learning models, the above four widely used machine learning models, MLP, LR, SVM, and RF, are chosen for flood susceptibility prediction modeling in this study.
The study of a standardized process for constructing flash flood susceptibility prediction models using machine learning models, comparing and analyzing the prediction performance of different machine learning models, and carrying out practical engineering applications in Longnan County is of great practical importance for flash flood and geological hazard prevention and control, road planning, and development of appropriate risk mitigation strategies in the southwest and southern China (Sheng et al., 2022). Longnan County, in the southernmost part of Jiangxi Province, is used as an example in this study. ArcGIS 10.2 software and the remotely sensed imagery website are used to extract 14 environmental factors such as topographic and geomorphological factors, hydrological factors, land cover factors, and human activities as input variables for the machine learning model. Denoted as 1 and 0, the flash flood and non-flash flood are considered the output variables. The MLP, LR, SVM, and RF models are then used to predict flash flood susceptibility. Besides, the model’s predicted flash flood susceptibility index is imported into ArcGIS 10.2 software to map flash flood susceptibility. Finally, each model’s prediction performance is compared and analyzed to verify its applicability and reliability using the receiver operation characteristic (ROC) curve and susceptibility index distribution features.
2 Study area and data sources
2.1 Study area
Longnan County has a total area of 1,640.55 km2 and is located in the zone of 114°23′-114°59′ E longitude and 24°29′-25°01′ N latitude (Figure 1). Longnan County has a typical subtropical humid monsoon climate with an annual average temperature of 19.2°C, according to the data. It has seasonal rainfall, with the wet season lasting from March to August, and the annual average precipitation is approximately 1,506 mm. The Longnan stratum spans the Upper Proterozoic Sinian stratum to the Cenozoic Quaternary stratum. Other strata exist except for the Ordovician and Silurian strata in the middle stratum. The strata in the study area are classified as sedimentary rock, metamorphic rock, intrusive rock, Quaternary alluvial layer, and magmatic rock based on their lithology. Denuded hills are in the middle, where expose Cretaceous and Jurassic thin siltstone, magmatic rocks, and volcanic clastic rocks. The county’s surroundings are the Quaternary alluvial layer, which has loose soil. Longnan is high in the southwest and low in the northeast, with folds and fractures as the primary tectonic features (Cui et al., 2016; Zhang et al., 2015). The most common landform types are eroded moderate and low mountainous areas, as well as eroded and denuded hilly areas. Furthermore, the county has a dense population distribution, engages in a variety of engineering activities, and the territory is primarily dependent on the mountains for self-built houses and roads. Because of the lack of slope support measures and means of protection, as well as the high rainfall in the study area, flash floods and other geological hazards are easily triggered. As a result, the predictive modeling of flash floods in this study area is important.
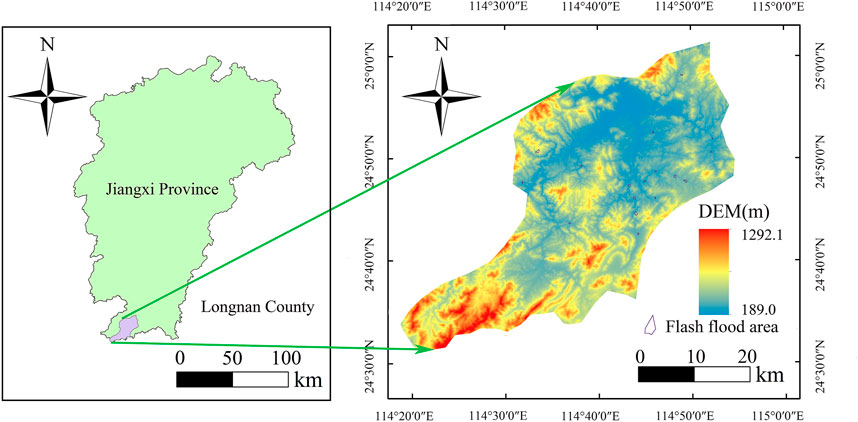
FIGURE 1. Overview of the study area and flash flood inventory.
As of 2014, there were 127 geological hazard sites in the study area. The eroded low mountainous area and the eroded and denuded hilly area have the highest hazard sites in each geomorphological area. At the same time, flash floods are primarily distributed in Longnan County’s central eroded and denuded hilly area, which is primarily located in the distribution range of metamorphic rocks. Based on previous studies and extensive literature (Guzzetti et al., 1999; Zhao et al., 2018; Roy et al., 2020; Wang et al., 2021; Elkhrachy, 2022), the difficulty of extracting environmental factors, the weight and effect of each type of environmental factor, the topographic and geomorphological characteristics of the study area, and the model’s accuracy, 14 environmental factors such as elevation, rainfall, and highway density are chosen as input variables for flood susceptibility prediction modeling. Figure 1 depicts an overview of the study area as well as a flash flood inventory.
2.2 Data sources and the classification of grid units
The sources of the flash flood basic data for the study area include: 1) The flood flash inventory investigated by Longnan County Land and Resources Bureau and specific information by field survey; 2) The geodata cloud platform is used to download digital elevation model (DEM) data with a spatial resolution of 30 m. Then, using ArcGIS 10.2 software’s spatial analysis tools, extract environmental factors such as elevation, aspect, slope, profile curvature, and plan curvature; 3) Landsat-8 remote sensing images with a spatial resolution of 30 m downloaded from the Chinese Academy of Sciences’ Earth Observation Center are used to obtain land cover factors such as the normalized difference vegetation index (NDVI) and modified normalized difference water index (MNDWI); 4) The lithology factor in the study area is derived from a 1:50,000 scale China Hydrogeological map; 5) The rainfall factor is derived by downloading China’s average annual rainfall from 1975 to 2015 from the China Meteorological Data Sharing Network (Huang et al., 2022a; Li et al., 2020).
Regional, slope, grid, terrain, and uniform condition units are some of the most commonly used evaluation units (Huang et al., 2021a). Because the grid unit is simple, efficient, and widely used (Xiao et al., 2022), the flash flood inventory chooses a grid with a 30 m resolution as the flash flood prediction unit for this study. The entire research area is divided into 1,842,345 units.
3 Research framework
This study compares and analyzes the modeling results of MLP, LR, SVM, and RF models to estimate their susceptibility prediction performance. The following are the main contents.
(1) Based on the information from the flash flood inventory and the geological environment, 14 basic environmental factors that are highly correlated with flood occurrence are identified. The correlation between the factors is then evaluated using Pearson’s correlation coefficients in SPSS Statistics software, and basic environmental factors with absolute correlation coefficients greater than 0.7 are eliminated (Cao et al., 2020; Lee et al., 2020).
(2) The original data of three environmental factors, NDVI, MNDWI, and surface radiation, are normalized and the other factors are kept constant. Then the original data of 14 environmental factors is directly used as the input variables of four classical machine learning models, MLP, LR, SVM, and RF, and the flash flood and non-flash flood (denoted as 1 and 0) are considered the output variables. The combined flash flood and non-flash flood samples are then randomly divided into two sets, the training dataset and the test dataset, in a 7:3 ratio (Huang et al., 2022b).
(3) To achieve the best prediction accuracy, the model parameters are adjusted by cross-validation (Yao et al., 2022).
(4) The model’s predicted flash flood susceptibility index is imported into ArcGIS 10.2 software to generate flash flood susceptibility maps. Furthermore, based on the natural break method, the predicted flash flood susceptibility index is divided into five levels: very low, low, moderate, high, and very high (Pham et al., 2020).
(5) The prediction performance of the four machine learning models discussed above is evaluated using the receiver operation characteristic (ROC) curve and susceptibility index distribution (Haoran et al., 2019).
4 Flash flood-related environmental factors
4.1 Environmental factors
The interaction of basic and externally induced environmental factors can result in geological hazards, and the selection of environmental factors can affect the reliability and accuracy of prediction results (Varnes, 1984; Abedi et al., 2022). As a result, identifying the effective environmental factors influencing flood occurrence is critical for flood susceptibility mapping (Rahmati et al., 2016). Based on researches on the causes of flash floods, an analysis of the study area’s topographic and geomorphological features, and a review of relevant literature on geological hazard susceptibility, Figure 2 it can be concluded that the occurrence of geological hazards such as flash floods is primarily related to basic environmental factors such as geology, hydrology, and topography, as well as externally induced environmental factors such as rainfall and human activity (Guzzetti et al., 1999; Zhao et al., 2018; Roy et al., 2020; Wang et al., 2021; Elkhrachy, 2022). As a result, 14 representative environmental factors, such as elevation, slope, and aspect, are chosen as input variables for the models in this study, as illustrated in Figure 3 and Table 1. The original data of each environmental factor are obtained by using the conversion tool of the spatial analysis tool in ArcGIS software to perform grid turning point, and NDVI, MNDWI, and surface radiation are normalized. The various environmental factors are then used as input variables in predictive modeling to assess flash flood susceptibility, yielding a more accurate flash flood prediction model.
(1) Topographic and geomorphological factors: Based on the DEM data obtained through downloading, ArcGIS 10.2 software is used to extract topographic and geomorphological factors such as elevation, slope, aspect, plan curvature, and profile curvature (Sun et al., 2020; Huang et al., 2022c). Elevation is defined as the distance along the plumb line from the grid unit to the earth’s ellipsoid (Chang et al., 2020). Furthermore, elevation serves as an indirect proxy for regional climate, land cover distribution, and the impact of rock weathering at different elevations on flash flood evolution (Marjanović et al., 2011). The slope denotes how steep the land surface is. The flow velocity increases as the slope increases (Mahmoud and Gan, 2018). However, on steep slopes, infiltration is less and runoff is more. Excessive runoff can cause flash floods in downslope flat areas. Therefore, the probability of flash floods is generally higher in flat areas near and adjacent to high-gradient side slopes (Pham et al., 2020). Having an effect on soil moisture and weathering, the aspect refers to the direction of the projection of the slope normal on the horizontal plane (Chang et al., 2020; Huang et al., 2020c). Plan curvature is obtained as a representation of flow convergence and divergence using the ArcGIS tool to extract the slope from the aspect (Panahi et al., 2021a). Profile curvature is an extraction of slope from the slope that is primarily concerned with delineating areas of active and weak water runoff (Abedi et al., 2022). The magnitude of ground cutting and fragmentation is conveyed by gully density (Sheng et al., 2022). Using the hydrology function of ArcGIS 10.2 Spatial Analyst Toolbox, streams in the study area are extracted from the DEM. The gully density is also calculated using the ArcGIS Spatial Analyst tool, which is the total length of the streams per unit area (Liu et al., 2022). The distribution of all of the above environmental factors has a significant impact on flash flood development.
(2) Hydrological environmental factors: Water not only accelerates the erosion of geotechnical bodies, but it also causes loosening and deformation of the interbedded layers in the soil, which promotes the development of flash floods in the event of heavy rainfall (Liu et al., 2019a). Flow analysis, depression determination, depression filling, confluence analysis, and river network analysis of DEM data by ArcGIS 10.2 software characterize hydrological environmental factors (Chang et al., 2022). The MNDWI is based on the normalized difference water index with a modification of the wavelength combinations that make up the index and is commonly used to represent surface hydrological information (Sheng et al., 2022). Using MNDWI, you can better reveal the microscopic characteristics of water bodies, such as the distribution of suspended sediments and changes in water quality, and identify water bodies in urban areas with high accuracy (Shu et al., 2022). As an indicator of water accumulation in a watershed, the terrain wetness index implies the likelihood of any area within the watershed approaching saturation and reflects geotechnical wetness (Chapi et al., 2017). Its values are positively correlated with the occurrence of flash floods (Liu et al., 2021). The rainfall factor is calculated by using the interpolation method to extract the grid of China’s average annual rainfall from 1975 to 2015 downloaded from the China Meteorological Data Sharing Network. Because flash floods are defined as rapid flooding in a region within a short period of time (Bobrowsky, 2013), they are closely related to rainfall within each region. Using rainfall factors as input variables has a significant impact on flash flood susceptibility model prediction results (Criss, 2022; Dai et al., 2021; Li et al., 2021a).
(3) Basic geological and land cover factors: The lithology factor can reveal mechanical properties of soil in each area and has a significant impact on the occurrence of geological hazards (Liu et al., 2019b). Longnan County’s stratigraphic rocks include sedimentary rocks, metamorphic rocks, intrusive rocks, and Quaternary alluvial layers, according to geological data and previous studies. The vegetation growth and vegetation cover is represented by NDVI (Xiao et al., 2022). Vegetation acts as a soil consolidator and retainer, which helps to prevent erosion. The larger the NDVI value, the larger the vegetation cover and the lower the probability of flooding (Liu et al., 2021). As a result of studying the effect of different vegetation cover on flash flood susceptibility, a more accurate model of flash flood susceptibility can be derived.
(4) Human activity factors: Highway and population distribution zones are often accompanied by extensive engineering activities, which change the study area’s geological characteristics, soil structure, and stress characteristics, thus contributing to the occurrence of geological hazards (Guo et al., 2021; Xiao et al., 2022). Surface radiation is related to absolute surface temperature, which can reflect regional temperature changes, and human activities will also shape surface radiation distribution (Li et al., 2022).
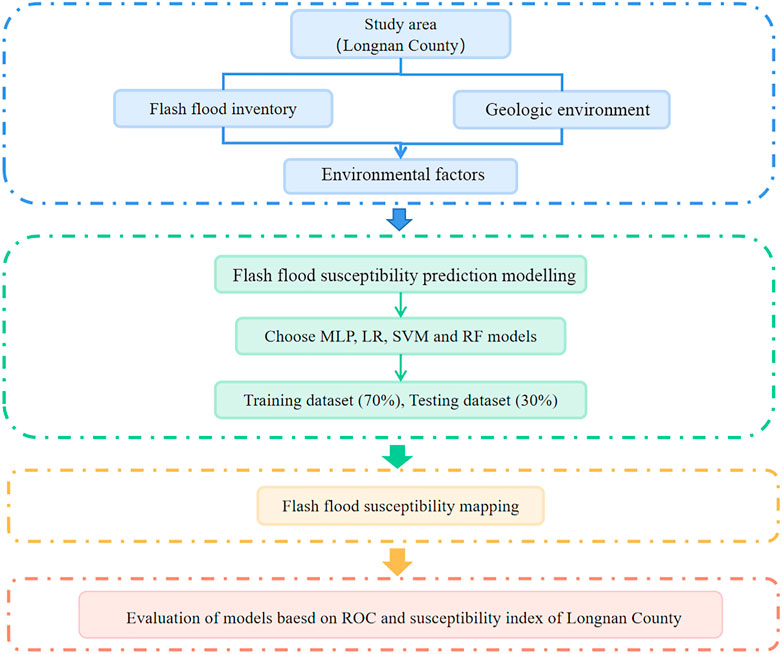
FIGURE 2. The flow chart of the research framework.
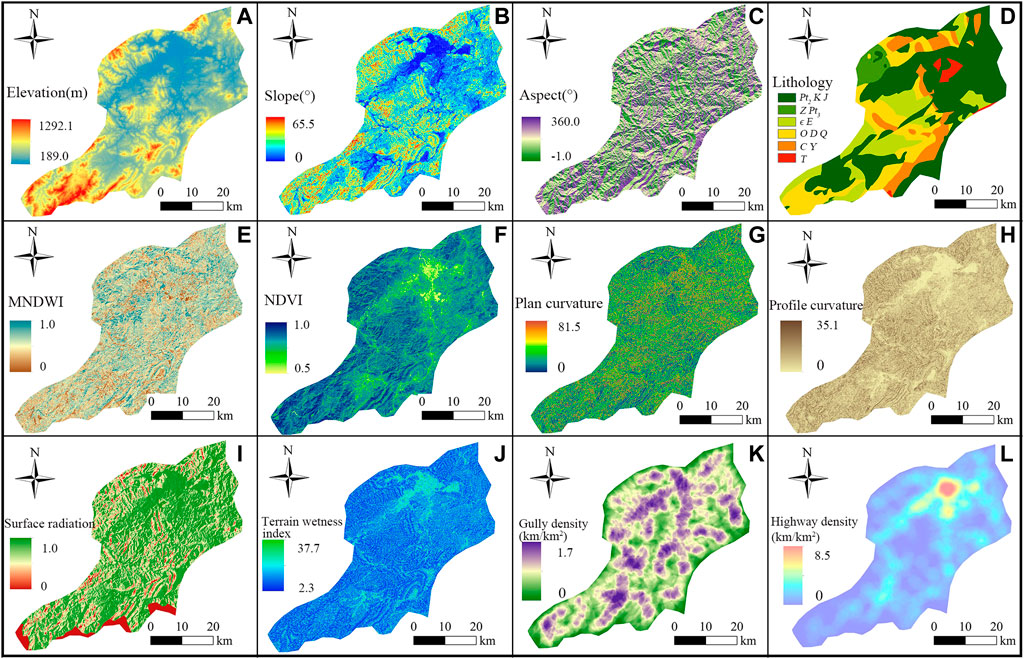
FIGURE 3. Part of the basic environmental factors of flash floods in Longnan County: (A) Elevation, (B) Slope, (C) Aspect, (D) Lithology, (E) MNDWI, (F) NDVI, (G) Plan curvature, (H) Profile curvature, (I) Surface radiation, (J) Terrain wetness index, (K) Gully density, (L) Highway density.
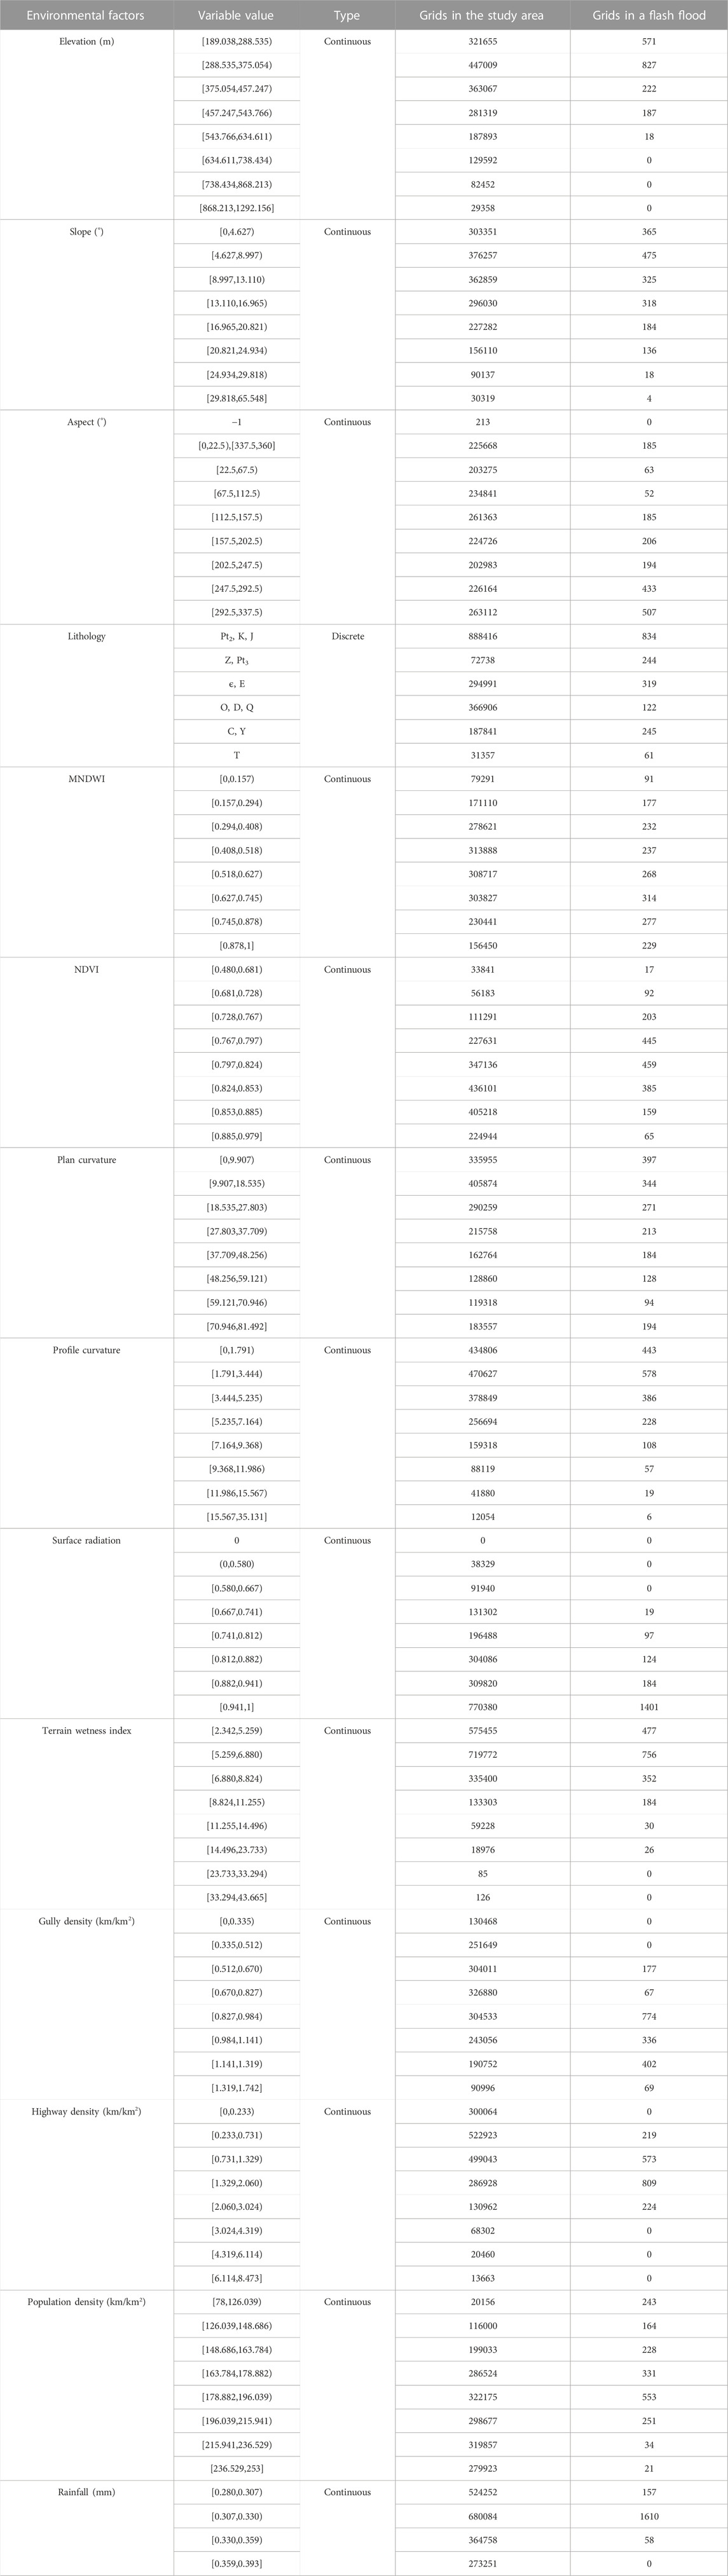
TABLE 1. Original data of each basic environmental factor.
4.2 Correlation analysis among environmental factors
The issue of multi collinearity arises in flash flood susceptibility prediction when there is a high correlation between environmental factors, which leads to an increase in error and a decrease in the prediction accuracy of machine learning models (Erener, 2009; Tehrany et al., 2019). To avoid this effect, Pearson’s correlation coefficient is used in SPSS Statistics software to calculate the correlation between the factors. The environmental factors with absolute correlation coefficient values greater than 0.7 are then eliminated. Furthermore, because the lithology factor is a disordered multi-categorical discrete variable, in order to intuitively reflect the influence of different attributes of this independent variable on flash flood susceptibility and improve the model’s accuracy and precision, this study set the lithology factor as six types of dummy variables, namely Mesoproterozoic Erathem (Pt2), Jurassic and Cretaceous(J, K); Neoproterozoic Erathem (Z, Pt3); Cambrian (ϵ) and Tertiary (E); Ordovician (O), Devonian (D) and Quaternary (Q); Carboniferous (C) and magmatic rock group (Y); Triassic (T). In SPSS Statistics software, the dummy variables of Pt2, J, and K are first valued as 1, and the values of other categories are 0. Secondly, the dummy variables of Z and Pt3 are valued as 1, and the other categories are valued as 0. Then and so on. Table 2 shows the results, which show that the absolute values of the correlation coefficients among the environmental factors are less than 0.7. It shows that there is no significant relationship between the factors, and all of them can be used as input variables for flash flood susceptibility modeling.
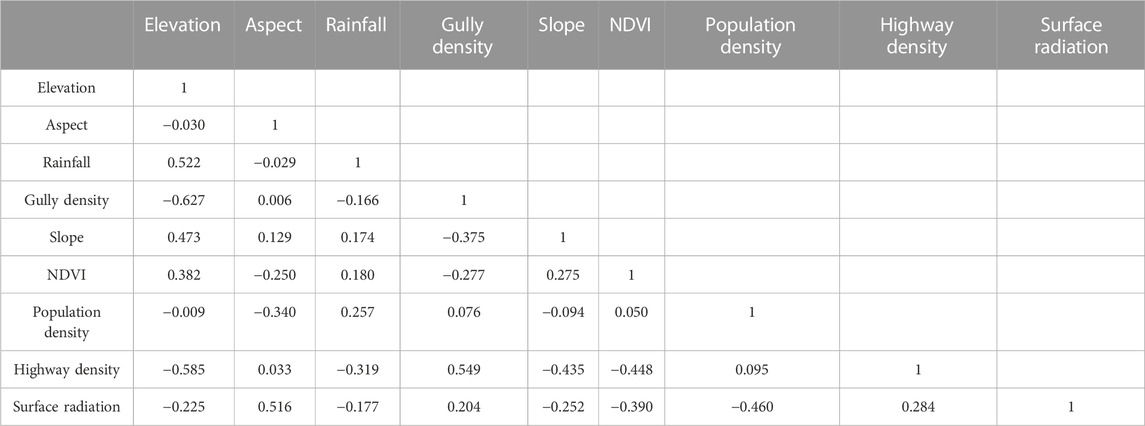
TABLE 2. Correlation coefficient matrix diagram of some environmental factors.
5 Research methods
5.1 Machine learning models
MLP, LR, SVM, and RF are four classic machine learning models chosen for modeling.
5.1.1 Multilayer perceptron (MLP)
Rosenblatt’s MLP neural network concept, first proposed in 1952, is a multilayer feed forward artificial neural network model used to predict data regression. The MLP structure is divided into three layers: input, hidden, and output. The basic units of the MLP model are neurons, which are located in the layers. The basic units between each layer are fully connected, and weights are used to represent the strength of their connection. All inputs are weighted and added together with bias. The activation function then realizes the non-linear mapping output so that the output amplitude of the basic units is limited to a specific range, typically (−1, 1) or (0, 1) (Alimi et al., 2019; Janizadeh et al., 2019). The formula is as follows:
where, w is the connection weight between two adjacent layers of neurons, b is the bias value of the neuron, and f is the activation function. Figure 4.
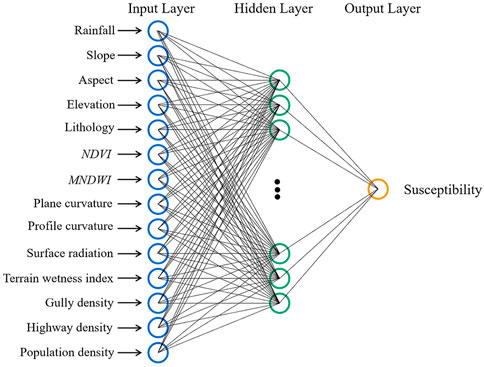
FIGURE 4. Multilayer perceptron structure diagram of flash flood susceptibility evaluation.
5.1.2 Logistic regression (LR)
The LR model, as a binomial classification-based regression analysis model, can use discrete or continuous variables as independent variables without the need for a normal distribution (Do et al., 2020). The dependent variable in the analysis of flash flood susceptibility is a binary variable representing the absence (0) or presence (1) of flash floods. The environmental factor is used as the independent variable (Xn), and the probability of flash flood occurrence is solved using a logistic regression function. The formula is as follows:
where Z is the weighted sum of variables, P is the probability of flash flood occurrence with a value between 0 and 1, Bi is the regression coefficient, and Xi is the independent variable influencing flash flood occurrence.
5.1.3 Support vector machine (SVM)
The SVM works on the principle of mapping an instance’s feature vector to a higher dimensional feature space based on certain rules and then seeking the optimal hyperplane that maximizes the classification interval of the data in this space. Finally, the output variables can be separated linearly (Cortes and Vapnik, 1995; Amol et al., 2021). Assume a set of training data and then use the SVM decision function to define its decision boundary, as shown in Eq. 3:
where ωT is the normal vector determining the optimal hyperplane’s direction, X is the non-linear mapping function, and b is the hyperplane’s offset from the origin. Eq. 4 can be used to calculate ω and b:
where ξi is the relaxation variable, and c > 0 indicates the regularization variable of error.
5.1.4 Random forest (RF)
The RF model is a classifier made up of several decision trees. The model typically employs the Bootstrap method to draw samples at random as a training set with put-back and select feature variable subspace randomly. The decision tree modeling is then carried out. Finally, voting is used to classify the modeling results of all decision trees (Mohammady et al., 2019; He et al., 2021; Deng et al., 2022). The RF makes use of an ensemble learning method that makes use of multiple independent decision trees. As a result, its accuracy is higher than that of most single algorithms. Furthermore, because the training samples for each tree and the feature variable subspace are chosen at random, the model is unlikely to overfit (He et al., 2021).
5.2 Accuracy and uncertainty evaluation of flood flash susceptibility
Evaluation is an important step in prediction modeling because without it, the results are unreliable (Panahi et al., 2021b).
5.2.1 Assessment of modeling accuracy based on ROC curve
This study uses ROC curves and the area under the curve (AUC) to analyze the prediction results of four machine learning models: MLP, LR, SVM, and RF. The ROC curve’s x-axis represents the false positive rate (FPR), and the y-axis represents the true positive rate (TPR), which can be calculated using Eqs. 5, 6, respectively. AUC, a performance metric that measures the merit and prediction accuracy of machine learning models, typically ranges between 0.5 and 1. The closer the value is to one, the more accurate the corresponding machine-learning model algorithm is (Tien Bui et al., 2016; Khosravi et al., 2018).
where, TP represents the number of flood points that can be correctly classified as a flood class, TN represents the number of non-flood points that can be correctly classified as a non-flood class, FN represents the number of flood points misclassified as a non-flood class, and FP represents the number of non-flood points misclassified as a flood class.
5.2.2 Distribution characteristics of susceptibility index
The susceptibility index’s distribution characteristics are primarily quantified in terms of the mean value (MV) and standard deviation (SD). The MV represents the central tendency of the regional flood susceptibility index distribution, whereas the SD represents its degree of dispersion (Li et al., 2020). The lower the MV, the lower the likelihood of a flash flood in the region. The higher the SD, the better the susceptibility index discrimination and the lower the uncertainty of the corresponding machine-learning model prediction results (Huang et al., 2020a). When the MV of a model’s susceptibility index is small and the SD is large, it is considered more reliable (Huang et al., 2022d).
5.2.3 Significance difference of susceptibility indexes
In this study, the Kendall synergy coefficient test is used to analyze the significance difference between the predicted susceptibility indexes of the models, and the null hypothesis of this test is that the susceptibility results of different models are consistent (Li et al., 2021). The formula of its rank correlation coefficient W is as follows:
where m is the evaluation model, n is the sample number, Ri is the sum of the rank of the i th sample, and W ∈ [0 1]. When the susceptibility prediction results are consistent, W is taken as 1. When the value of W is less than 1, the Kendall synergy coefficient should reject the null hypothesis. The significance difference between modeling results is evaluated using a chi-square test at a 5% level of significance. Therefore, if the calculated significance level is less than or equal to 5%, the null hypothesis is rejected as the modeling performance is significantly different and vice versa (Li et al., 2021b).
6 Assessment of flash flood susceptibility
6.1 Sample selection
The environmental factors in Longnan County are divided into 1,842,345 grids and 17 flash flood surfaces based on the 30 m resolution, and potential flash flood areas that have occurred are taken and transformed into 1,825 grids. All flash flood grid units are converted into flash flood points and their susceptibility is assigned to 1, while 1,825 non-flood grid units are chosen at random from the entire study area and converted into non-flood points and their susceptibility is assigned to 0. The assigned flash flood and non-flood susceptibility values are taken as the output variables of the model. A total of 3650 flash flood points and non-flood points are linked with their corresponding environmental factor original data. The flash flood and non-flood points are further randomly divided into a training dataset and a test dataset in a 7:3 ratio. The training dataset is used for model training and construction, and the test dataset is used to evaluate the generalization ability of the final model.
6.2 Flash flood susceptibility prediction
6.2.1 Machine learning modeling and parameter setting
The MLP, LR, SVM, and RF models are trained and tested using a training dataset of 2,555 flash flood-non-flash flood grid samples and a test dataset of 1,095 flash flood-non-flash flood grid samples. The trained models are then used to predict flash flood susceptibility for 1,842,345 points in the study area.
To obtain the most accurate prediction results from the model, the model’s parameters are adjusted one by one using the out-of-bag error screening method and cross-validation. Finally, the SVM model’s regularization parameter C is set to 10, the regression accuracy e to 0.1, and the RBF kernel function parameter to 0.3; all other models are left alone (Chen et al., 2021).
6.2.2 Flash flood susceptibility mapping
The predicted flash flood susceptibility data from SPSS Modeler 18.0 software are imported and converted into grid units in ArcGIS 10.2 software. The predicted flash flood susceptibility index is then classified into five levels based on the natural break method in the classification method: very low, low, moderate, high, and very high. The results of flash flood susceptibility predicted by MLP, LR, SVM, and RF models in Longnan County are shown in Figure 5 and Table 3, and it can be concluded that the majority of Longnan County is in very low and low flood-prone areas. The very low and low flood-prone areas predicted by MLP and SVM models, on the other hand, are significantly larger than those predicted by LR and RF models, and the high and very high flood-prone areas predicted by LR and RF models are more prominent than those predicted by MLP and SVM models.
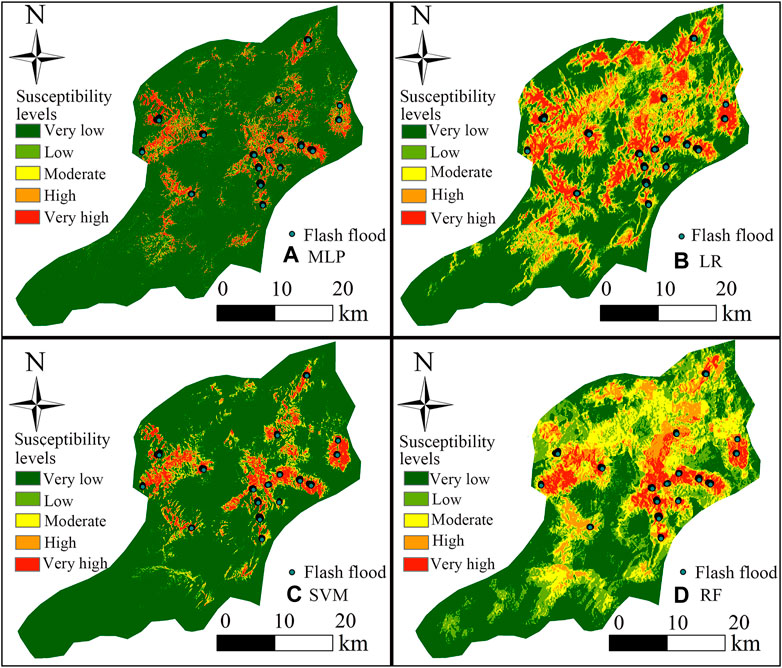
FIGURE 5. Flash flood susceptibility diagram of each model: (A) MLP, (B) LR, (C) SVM, (D) RF.
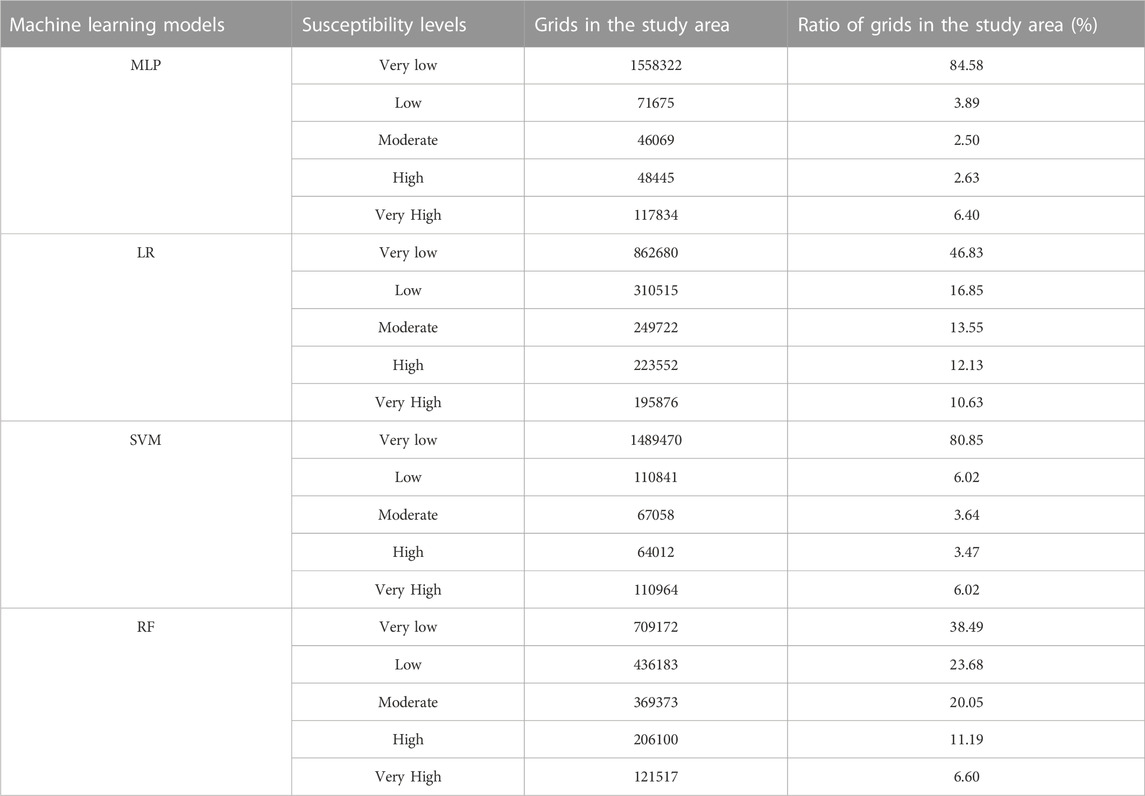
TABLE 3. Classification results of flash flood susceptibility index.
Longnan County’s very low and low flood-prone areas are mostly concentrated in the southwest, while the high and very high flood-prone areas are mostly concentrated in the center and extend in a strip-like pattern in all directions. The primary reason for this is that tectonic erosion hills dominate the central part of Longnan County, where gullies and ravines can be found. Furthermore, the county’s surroundings are the Quaternary alluvium layer, whose soil is relatively loose, and the likelihood of flash floods is higher during the heavy rainfall period in the subtropical humid monsoon climate. Longnan County also has a relatively dense population distribution and engages in a variety of engineering activities. The area is primarily dependent on mountains for self-built houses and roads, and the study area’s high-intensity engineering activities contribute to flash floods.
7 Discussion
7.1 Evaluation of susceptibility prediction accuracy
The ROC curve and its AUC value are used to estimate the accuracy of flash flood susceptibility prediction. The closer the ROC curve is to the upper left corner of the graph, the more sensitive the model is and the lower the likelihood of error. The larger the distance between two adjacent ROC curves, the greater the difference in prediction performance of two corresponding machine learning models. The AUC can be used to quantify prediction accuracy; that is, the one-dimensional curve is mirrored by the two-dimensional area, making model prediction accuracy judgment more intuitive (Pradhan and Lee, 2010; Youssef et al., 2016). The AUC value is proportional to the model’s prediction accuracy. Figure 6 shows how the ROC curve is used to assess the accuracy of the MLP, LR, SVM, and RF models in predicting flash flood susceptibility in Longnan County. The AUC values of each model are ranked from largest to smallest, as shown in the figure: AUC(RF) > AUC(MLP) > AUC(SVM) > AUC(LR), implying that the RF model has the best prediction accuracy for flash flood susceptibility, followed by the MLP and SVM models, and the LR model has the worst. However, all four machine learning models perform well in terms of prediction.
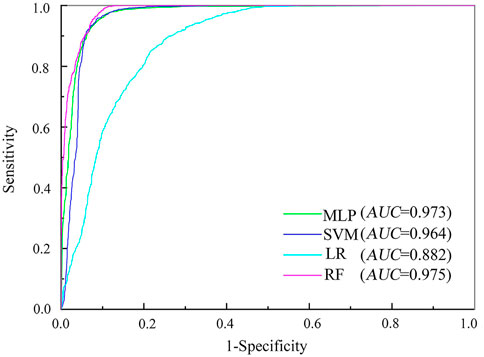
FIGURE 6. ROC curves of each model predicting flash flood susceptibility.
7.2 Distribution rule of susceptibility index
The standard deviation and mean value measure the dispersion and central trend of the flood susceptibility index distribution, respectively. The model is more reliable when the mean value is smaller and standard deviation is larger. The results of flash flood susceptibility prediction revealed that the four models’ mean values of the susceptibility index are ranked from largest to smallest: LR>RF>SVM>MLP (Figure 7). The MLP and SVM models predict a susceptibility index that is primarily distributed at a very low susceptibility level. The index shows a decreasing trend from very low to high susceptibility levels, with a slight increase in the very high susceptibility level. The susceptibility index predicted by the LR and RF models is concentrated in the very low and low susceptibility levels, with the index overall decreasing from very low to very high susceptibility. Furthermore, the mean values of the predicted susceptibility index for all four models are in the low susceptibility range. When combined with the AUC values of the models, it is clear that the MLP model has the lowest mean value of susceptibility index while maintaining high prediction accuracy. At the same time, the LR model not only has the lowest prediction accuracy but also the highest mean value of susceptibility index, implying that the MLP model has the lowest prediction uncertainty, the SVM and RF models have the second highest, and the LR model has the highest prediction uncertainty.
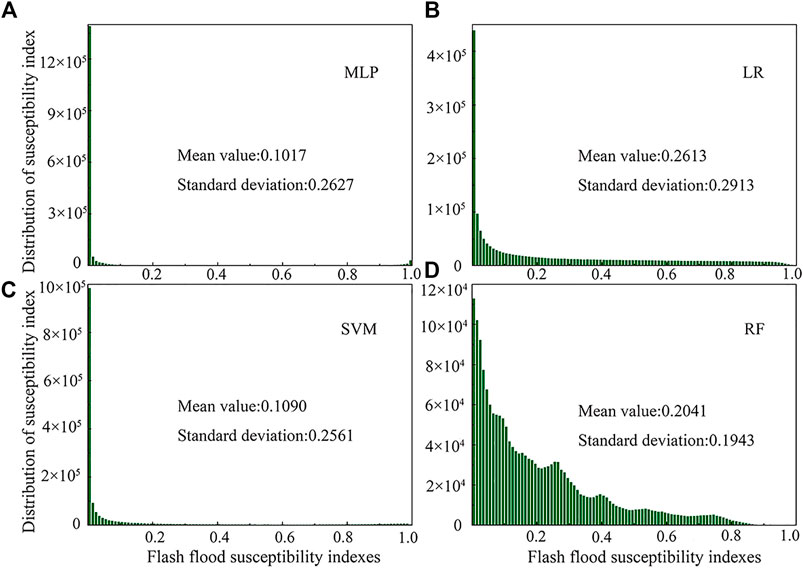
FIGURE 7. Distribution rule of flash flood susceptibility index: (A) MLP, (B) LR, (C) SVM, (D) RF.
Furthermore, Figure 7 shows that the LR model has the greatest dispersion of the predicted susceptibility index, followed by the MLP and SVM models, and the RF model has the smallest. Overall, all four models have small mean values and large standard deviations, allowing differences in susceptibility index to be more accurately reflected. Furthermore, a low susceptibility index can represent as much known flash flood inventory information as possible. When the above ROC curves and their AUC values, mean value, and standard deviation of the susceptibility index are combined, it is concluded that the MLP model has the best prediction performance for flash flood susceptibility, followed by the SVM and RF models, and the LR model has poor prediction performance.
7.3 Significance difference analysis of flash flood susceptibility indexes
The Kendall synergy coefficient test is used to test the significant difference between the flash flood susceptibility indexes under any two groups of different models. If the Kendall rank correlation coefficient W is less than 1 and the significance of the test result is less than 0.05, the difference between the flash flood susceptibility indexes under these two groups of models is significant and the null hypothesis should be rejected.
The test results show that the significance level between the flash flood susceptibility indexes of each model is less than 0.05 and the value of W is 0.449. Thus, it is clear that the difference between the susceptibility indexes under each model is significant and the null hypothesis should be rejected. Therefore, it is necessary to explore the modeling uncertainty under different machine learning model work conditions to find a reliable and stable susceptibility prediction model.
7.4 The contributing environmental factors of flash flood susceptibility
The top contributing environmental factors of flash flood susceptibility are the most important environmental factors in controlling the occurrence of flash floods. Their significance can be used as a theoretical reference for studying flash flood susceptibility (Li et al., 2022c). SPSS Modeler and R Studio software are used to analyze 14 environmental factors of MLP, LR, SVM, and RF models in this study. The importance ranking of each environmental factor is derived (Figure 8), revealing that elevation, gully density, and population density are the top contributing factors of flash flood susceptibility in Longnan County. MNDWI, plan curvature, profile curvature, and other environmental factors, on the other hand, have minor effects on flash flood susceptibility.
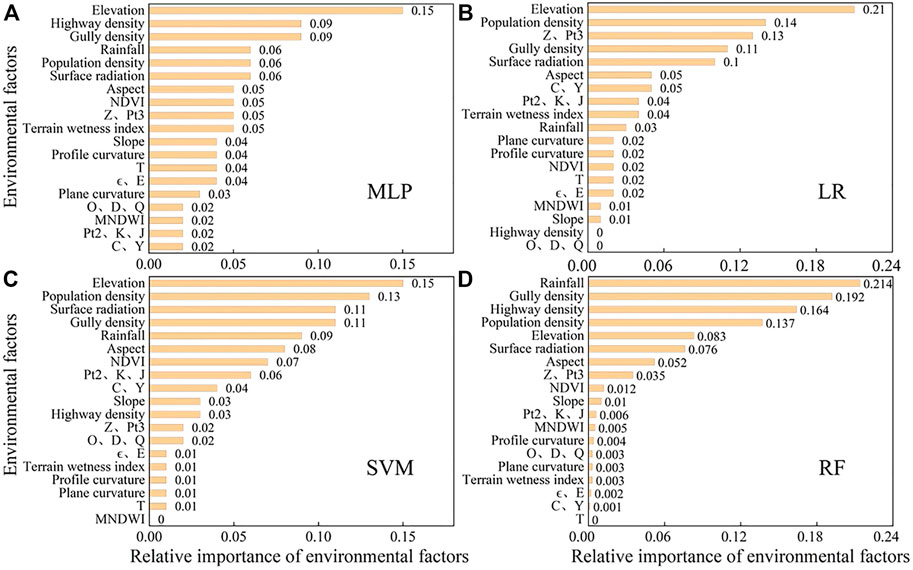
FIGURE 8. Importance ranking of environmental factors: (A) MLP, (B) LR, (C) SVM, (D) RF.
Although the importance ranking and magnitude of environmental factors differ between machine learning models, they are generally similar. As shown in Figure 8, the environmental factors with a higher importance in the MLP and RF models are elevation, highway density, gully density, rainfall, and population density. The top five environmental factors are the same for the MLP and RF models. However, elevation is more important in the MLP model, and rainfall is more important in the RF model. Besides, only four of the top five environmental factors in the SVM model are the same as the MLP and RF models, while the LR model has only three. This leads to the difference in the model’s susceptibility prediction mapping and indirectly proves that MLP and RF models have similar and highest prediction accuracy, followed by SVM and LR models.
7.5 Problems and frontiers of machine learning model prediction susceptibility
Li et al. (2022) proposed a combination of LR and RF models with embedded feature selection for flash flood susceptibility prediction in the mainstream basin of the Songhua River and concluded that both models exhibited accurate and reliable performance. However, the RF model had better prediction performance than the LR model. Sellami et al. (2022) compared the flash flood susceptibility prediction performance of several machine learning models and found that the RF model had the highest performance, followed by the ANN and SVM models. Janizadeh et al. (2019) used five machine learning methods to estimate flash flood susceptibility in the Tafresh watershed of Iran and revealed that the ADT method was the best. The FT method ranked second, followed by KLP, MLP, and QDA. While the results of this study are that the MLP model has the best prediction performance, followed by the SVM, RF, and LR models, respectively. However, the results of this study are generally the same as the results of the above-mentioned literature analysis. The MLP, SVM, and RF models are relatively accurate and reliable models for predicting flash flood susceptibility, and the LR model has poor prediction performance. Thus, it can be seen that the prediction performance of different machine learning models is characterized by variability and regionality due to the differences in the weights of the input variables and the analysis methods.
In this study, the non-flood grid units are randomly selected in the whole study area. Although there is no artificial interference, the non-flood grid units selected by this method may be the potential units of flash floods, and their stability is not high, which will lead to errors in the susceptibility prediction results. In addition, due to the limitation of basic data sources, the flash flood data in this study is limited. Therefore, further research can focus on how to reasonably select non-flood grid units to improve the prediction accuracy of machine learning models. In the next research, we will collect more basic data on flash floods, strive to expand the data source of flash floods, and improve the modeling accuracy.
8 Conclusion
(1) Machine learning models can accurately predict regional flash flood risk. The MLP, LR, SVM, and RF models all perform well in terms of flood susceptibility prediction, and their flash flood susceptibility maps and susceptibility index distribution maps are generally similar. Longnan County’s very low and low flood-prone areas are mostly concentrated in the southwest, while the high and very high flood-prone areas are mostly concentrated in the center and extend in a strip in all directions.
(2) It is determined that the MLP model has the best prediction performance for flash flood susceptibility, followed by the SVM and RF models, and the LR model has poor prediction performance by comparing and analyzing the ROC curves and susceptibility index distribution maps of different machine learning models.
(3) According to SPSS Modeler and R Studio software, the top contributing environmental factors of flash flood susceptibility in Longnan County are elevation, gully density, and population density. In contrast, environmental factors such as MNDWI, plan curvature, and profile curvature have a much lower impact on flash flood susceptibility.
Data availability statement
The original contributions presented in the study are included in the article/supplementary material, further inquiries can be directed to the corresponding author.
Author contributions
Writing—original draft preparation, XZ, KY, and SZ; data collection, KY and YC; data processing, XZ and KY; writing—review and editing, XZ, KY, SZ, and YC; writing—polish, XZ and AH.
Funding
This research is funded by the National Natural Science Foundation of China (No. 52109089).
Conflict of interest
The authors declare that the research was conducted in the absence of any commercial or financial relationships that could be construed as a potential conflict of interest.
Publisher’s note
All claims expressed in this article are solely those of the authors and do not necessarily represent those of their affiliated organizations, or those of the publisher, the editors and the reviewers. Any product that may be evaluated in this article, or claim that may be made by its manufacturer, is not guaranteed or endorsed by the publisher.
References
Abedi, R., Costache, R., Shafizadeh-Moghadam, H., and Pham, Q. B. (2022). Flash-flood susceptibility mapping based on XGBoost, random forest and boosted regression trees. Geocarto Int. 37 (19), 5479–5496. doi:10.1080/10106049.2021.1920636
Alimi, O. A., Ouahada, K., and Abu-Mahfouz, A. M. (2019). Real time security assessment of the power system using a hybrid support vector machine and multilayer perceptron neural network algorithms. Sustainability 11 (13), 3586. doi:10.3390/su11133586
Amol, S., Chander, P., and Manivasagam, S. (2021). Entropy-based hybrid integration of random forest and support vector machine for landslide susceptibility analysis. Geomatics 1 (4), 399–416. doi:10.3390/geomatics1040023
Cao, Y., Jia, H., Xiong, J., Cheng, W., Li, K., Pang, Q., et al. (2020). Flash flood susceptibility assessment based on geodetector, certainty factor, and logistic regression analyses in Fujian province, China. ISPRS Int. J. Geo-Information 9 (12), 748. doi:10.3390/ijgi9120748
Chang, Z., Catani, F., Huang, F., Liu, G., Meena, S. R., Huang, J., et al. (2022). Landslide susceptibility prediction using slope unit-based machine learning models considering the heterogeneity of conditioning factors. J. Rock Mech. Geotechnical Eng. doi:10.1016/j.jrmge.2022.07.009
Chang, Z., Du, Z., Zhang, F., Huang, F., Chen, J., Li, W., et al. (2020). Landslide susceptibility prediction based on remote sensing images and GIS: Comparisons of supervised and unsupervised machine learning models. Remote Sens. 12 (3), 502. doi:10.3390/rs12030502
Chapi, K., Singh, V. P., Shirzadi, A., Shahabi, H., Bui, D. T., Pham, B. T., et al. (2017). A novel hybrid artificial intelligence approach for flood susceptibility assessment. Environ. Model. Softw. 95, 229–245. doi:10.1016/j.envsoft.2017.06.012
Chen, L., Lin, W., Chen, P., Jiang, S., Liu, L., and Hu, H. (2021). Porosity prediction from well logs using back propagation neural network optimized by genetic algorithm in one heterogeneous oil reservoirs of Ordos Basin, China. J. Earth Sci. 32 (4), 828–838. doi:10.1007/s12583-020-1396-5
Cortes, C., and Vapnik, V. (1995). Support-vector networks. Mach. Learn. 20 (3), 273–297. doi:10.1007/bf00994018
Criss, R. E. (2022). Hydrologic time scale: A fundamental stream characteristic. J. Earth Sci. 33 (5), 1291–1297. doi:10.1007/s12583-022-1655-8
Cui, L. F., Liu, C. Q., Xu, S., Zhao, Z. Q., Liu, T. Z., Liu, W. J., et al. (2016). Subtropical denudation rates of granitic regolith along a hill ridge in Longnan, SE China derived from cosmogenic nuclide depth-profiles. J. Asian Earth Sci. 117, 146–152. doi:10.1016/j.jseaes.2015.12.006
Dahri, N., Yousfi, R., Bouamrane, A., Abida, H., Pham, Q. B., and Derdous, O. (2022). Comparison of analytic network process and artificial neural network models for flash flood susceptibility assessment. J. Afr. Earth Sci. 193, 104576. doi:10.1016/j.jafrearsci.2022.104576
Dai, C., Li, W., Wang, D., Lu, H., Xu, Q., and Jian, J. (2021). Active landslide detection based on Sentinel-1 data and InSAR technology in Zhouqu county, Gansu province, Northwest China. J. Earth Sci. 32 (5), 1092–1103. doi:10.1007/s12583-020-1380-0
Das, G., and Lepcha, K. (2019). Application of logistic regression (LR) and frequency ratio (FR) models for landslide susceptibility mapping in Relli Khola river basin of Darjeeling Himalaya, India. SN Appl. Sci. 1 (11), 1453–1522. doi:10.1007/s42452-019-1499-8
Demir, G., Aytekin, M., Akgün, A., Ikizler, S. B., and Tatar, O. (2013). A comparison of landslide susceptibility mapping of the eastern part of the North Anatolian Fault Zone (Turkey) by likelihood-frequency ratio and analytic hierarchy process methods. Nat. Hazards 65 (3), 1481–1506. doi:10.1007/s11069-012-0418-8
Deng, H., Wu, X., Zhang, W., Liu, Y., Li, W., Li, X., et al. (2022). Slope-unit scale landslide susceptibility mapping based on the random forest model in deep valley areas. Remote Sens. 14 (17), 4245. doi:10.3390/rs14174245
Do, H. M., Yin, K. L., and Guo, Z. Z. (2020). A comparative study on the integrative ability of the analytical hierarchy process, weights of evidence and logistic regression methods with the Flow-R model for landslide susceptibility assessment. Geomatics, Nat. Hazards Risk 11 (1), 2449–2485. doi:10.1080/19475705.2020.1846086
Elkhrachy, I. (2022). Flash flood water depth estimation using SAR images, digital elevation models, and machine learning algorithms. Remote Sens. 14 (3), 440. doi:10.3390/rs14030440
Erener, A. (2009). An approach for landslide risk assesment by using geographic information systems (gis) and remote sensing. Ph.D. Thesis, Turkey: Middle East Technical University.
Guo, C., Xu, Q., Dong, X., Li, W., Zhao, K., Lu, H., et al. (2021). Geohazard recognition and inventory mapping using airborne lidar data in complex mountainous areas. J. Earth Sci. 32 (5), 1079–1091. doi:10.1007/s12583-021-1467-2
Guzzetti, F., Carrara, A., Cardinali, M., and Reichenbach, P. (1999). Landslide hazard evaluation: A review of current techniques and their application in a multi-scale study, central Italy. Geomorphology 31 (1-4), 181–216. doi:10.1016/s0169-555x(99)00078-1
Ha, H., Luu, C., Bui, Q. D., Pham, D. H., Hoang, T., Nguyen, V. P., et al. (2021). Flash flood susceptibility prediction mapping for a road network using hybrid machine learning models. Nat. Hazards 109 (1), 1247–1270. doi:10.1007/s11069-021-04877-5
Haoran, Z., Guifang, Z., and Qiwen, J. (2019). Integration of analytical hierarchy process and landslide susceptibility index based landslide susceptibility assessment of the pearl river delta area, China. IEEE J. Sel. Top. Appl. Earth Observations Remote Sens. 12 (11), 4239–4251. doi:10.1109/jstars.2019.2938554
Haribabu, S., Gupta, G. S., Kumar, P. N., and Rajendran, P. S. (2021). “Prediction of flood by rainf all using MLP classifier of neural network model,” in 6th International Conference on Communication and Electronics Systems (ICCES), Coimbatre, India, 08-10 July 2021 (IEEE).
He, Q., Wang, M., and Liu, K. (2021). Rapidly assessing earthquake-induced landslide susceptibility on a global scale using random forest. Geomorphology 391, 107889. doi:10.1016/j.geomorph.2021.107889
Huang, F., Cao, Z., Guo, J., Jiang, S. H., Li, S., and Guo, Z. (2020a). Comparisons of heuristic, general statistical and machine learning models for landslide susceptibility prediction and mapping. Catena 191 (C), 104580. doi:10.1016/j.catena.2020.104580
Huang, F., Cao, Z., Jiang, S. H., Zhou, C., Huang, J., and Guo, Z. (2020b). Landslide susceptibility prediction based on a semi-supervised multiple-layer perceptron model. Landslides 17 (12), 2919–2930. doi:10.1007/s10346-020-01473-9
Huang, F., Chen, J., Liu, W., Huang, J., Hong, H., and Chen, W. (2022a). Regional rainfall-induced landslide hazard warning based on landslide susceptibility mapping and a critical rainfall threshold. Geomorphology 408, 108236. doi:10.1016/j.geomorph.2022.108236
Huang, F., Pan, L., Fan, X., Jiang, S. H., Huang, J., and Zhou, C. (2022b). The uncertainty of landslide susceptibility prediction modeling: Suitability of linear conditioning factors. Bull. Eng. Geol. Environ. 81 (5), 182. doi:10.1007/s10064-022-02672-5
Huang, F., Tao, S., Chang, Z., Huang, J., Fan, X., Jiang, S. H., et al. (2021a). Efficient and automatic extraction of slope units based on multi-scale segmentation method for landslide assessments. Landslides 18 (11), 3715–3731. doi:10.1007/s10346-021-01756-9
Huang, F., Tao, S., Li, D., Lian, Z., Catani, F., Huang, J., et al. (2022c). Landslide susceptibility prediction considering neighborhood characteristics of landslide spatial datasets and hydrological slope units using remote sensing and GIS technologies. Remote Sens. 14 (18), 4436. doi:10.3390/rs14184436
Huang, F., Yan, J., Fan, X., Yao, C., Huang, J., Chen, W., et al. (2022d). Uncertainty pattern in landslide susceptibility prediction modelling: Effects of different landslide boundaries and spatial shape expressions. Geosci. Front. 13 (2), 101317. doi:10.1016/j.gsf.2021.101317
Huang, F., Ye, Z., Jiang, S. H., Huang, J., Chang, Z., and Chen, J. (2021b). Uncertainty study of landslide susceptibility prediction considering the different attribute interval numbers of environmental factors and different data-based models. Catena 202, 105250. doi:10.1016/j.catena.2021.105250
Huang, F., Zhang, J., Zhou, C., Wang, Y., Huang, J., and Zhu, L. (2020c). A deep learning algorithm using a fully connected sparse autoencoder neural network for landslide susceptibility prediction. Landslides 17 (1), 217–229. doi:10.1007/s10346-019-01274-9
István, K., Ștefan, B., IoanAurel, I., Vasile, D., Raularian, R., and Sanda, R. (2022). Flash flood vulnerability mapping based on FFPI using GIS spatial analysis case study: Valea rea catchment area, Romania. Sensors 22 (9), 3573. doi:10.3390/s22093573
Janizadeh, S., Avand, M., Jaafari, A., Phong, T. V., Bayat, M., Ahmadisharaf, E., et al. (2019). Prediction success of machine learning methods for flash flood susceptibility mapping in the Tafresh watershed, Iran. Sustainability 11 (19), 5426. doi:10.3390/su11195426
Jiang, S. H., Huang, J., Huang, F., Yang, J., Yao, C., and Zhou, C. B. (2018). Modelling of spatial variability of soil undrained shear strength by conditional random fields for slope reliability analysis. Appl. Math. Model. 63, 374–389. doi:10.1016/j.apm.2018.06.030
Khosravi, K., Pham, B. T., Chapi, K., Shirzadi, A., Shahabi, H., Revhaug, I., et al. (2018). A comparative assessment of decision trees algorithms for flash flood susceptibility modeling at Haraz watershed, northern Iran. Sci. Total Environ. 627, 744–755. doi:10.1016/j.scitotenv.2018.01.266
Lee, D. H., Kim, Y. T., and Lee, S. R. (2020). Shallow landslide susceptibility models based on artificial neural networks considering the factor selection method and various non-linear activation functions. Remote Sens. 12 (7), 1194. doi:10.3390/rs12071194
Li, D., Huang, F., Yan, L., Cao, Z., Chen, J., and Ye, Z. (2019). Landslide susceptibility prediction using particle-swarm-optimized multilayer perceptron: Comparisons with multilayer-perceptron-only, bp neural network, and information value models. Appl. Sci. 9 (18), 3664. doi:10.3390/app9183664
Li, J., Zhang, H., Zhao, J., Guo, X., Rihan, W., and Deng, G. (2022a). Embedded feature selection and machine learning methods for flash flood susceptibility-mapping in the mainstream Songhua River basin, China. Remote Sens. 14 (21), 5523. doi:10.3390/rs14215523
Li, Q., Huang, D., Pei, S., Qiao, J., and Wang, M. (2021a). Using physical model experiments for hazards assessment of rainfall-induced debris landslides. J. Earth Sci. 32 (5), 1113–1128. doi:10.1007/s12583-020-1398-3
Li, T., Hu, D., Wang, Y., Di, Y., and Liu, M. (2022b). Correcting remote-sensed shaded image with urban surface radiative transfer model. Int. J. Appl. Earth Observation Geoinformation 106, 102654. doi:10.1016/j.jag.2021.102654
Li, W., Fan, X., Huang, F., Chen, W., Hong, H., Huang, J., et al. (2020). Uncertainties analysis of collapse susceptibility prediction based on remote sensing and GIS: Influences of different data-based models and connections between collapses and environmental factors. Remote Sens. 12 (24), 4134. doi:10.3390/rs12244134
Li, W., Shi, Y., Huang, F., Hong, H., and Song, G. (2021b). Uncertainties of collapse susceptibility prediction based on remote sensing and GIS: Effects of different machine learning models. Front. Earth Sci. 9, 731058. doi:10.3389/feart.2021.731058
Li, Y., Deng, X., Ji, P., Yang, Y., Jiang, W., and Zhao, Z. (2022c). Evaluation of landslide susceptibility based on CF-SVM in nujiang prefecture. Int. J. Environ. Res. Public Health 19 (21), 14248. doi:10.3390/ijerph192114248
Liu, J., Wang, J., Xiong, J., Cheng, W., Sun, H., Yong, Z., et al. (2021). Hybrid models incorporating bivariate Statistics and machine learning methods for flash flood susceptibility assessment based on remote sensing datasets. Remote Sens. 13 (23), 4945. doi:10.3390/rs13234945
Liu, W., Luo, X., Huang, F., and Fu, M. (2019a). Prediction of soil water retention curve using Bayesian updating from limited measurement data. Appl. Math. Model. 76, 380–395. doi:10.1016/j.apm.2019.06.028
Liu, W., Song, X., Huang, F., and Hu, L. (2019b). Experimental study on the disintegration of granite residual soil under the combined influence of wetting–drying cycles and acid rain. Geomatics, Nat. Hazards Risk 10 (1), 1912–1927. doi:10.1080/19475705.2019.1651407
Liu, Y., Zhao, L., Bao, A., Li, J., and Yan, X. (2022). Chinese high resolution satellite data and GIS-based assessment of landslide susceptibility along highway G30 in guozigou valley using logistic regression and MaxEnt model. Remote Sens. 14 (15), 3620. doi:10.3390/rs14153620
Mahmoud, S. H., and Gan, T. Y. (2018). Multi-criteria approach to develop flood susceptibility maps in arid regions of Middle East. J. Clean. Prod. 196, 216–229. doi:10.1016/j.jclepro.2018.06.047
Marchi, L., Borga, M., Preciso, E., and Gaume, E. (2010). Characterisation of selected extreme flash floods in Europe and implications for flood risk management. J. Hydrology 394 (1-2), 118–133. doi:10.1016/j.jhydrol.2010.07.017
Marjanović, M., Kovačević, M., Bajat, B., and Voženílek, V. (2011). Landslide susceptibility assessment using SVM machine learning algorithm. Eng. Geol. 123 (3), 225–234. doi:10.1016/j.enggeo.2011.09.006
Mohammady, M., Pourghasemi, H. R., and Amiri, M. (2019). Land subsidence susceptibility assessment using random forest machine learning algorithm. Environ. Earth Sci. 78 (16), 503–512. doi:10.1007/s12665-019-8518-3
Ngo, P. T. T., Pham, T. D., Nhu, V. H., Le, T. T., Tran, D. A., Phan, D. C., et al. (2021). A novel hybrid quantum-PSO and credal decision tree ensemble for tropical cyclone induced flash flood susceptibility mapping with geospatial data. J. Hydrology 596, 125682. doi:10.1016/j.jhydrol.2020.125682
Nguyen, S., and Bouvier, C. (2019). Flood modelling using the distributed event-based SCS-LR model in the Mediterranean Real Collobrier catchment. Hydrological Sci. J. 64 (11), 1351–1369. doi:10.1080/02626667.2019.1639715
Panahi, M., Dodangeh, E., Rezaie, F., Khosravi, K., Van Le, H., Lee, M. J., et al. (2021a). Flood spatial prediction modeling using a hybrid of meta-optimization and support vector regression modeling. Catena 199, 105114. doi:10.1016/j.catena.2020.105114
Panahi, M., Jaafari, A., Shirzadi, A., Shahabi, H., Rahmati, O., Omidvar, E., et al. (2021b). Deep learning neural networks for spatially explicit prediction of flash flood probability. Geosci. Front. 12 (3), 101076. doi:10.1016/j.gsf.2020.09.007
Pham, B. T., Avand, M., Janizadeh, S., Phong, T. V., Al-Ansari, N., Ho, L. S., et al. (2020). GIS based hybrid computational approaches for flash flood susceptibility assessment. Water 12 (3), 683. doi:10.3390/w12030683
Pradhan, B., and Lee, S. (2010). Regional landslide susceptibility analysis using back-propagation neural network model at Cameron Highland, Malaysia. Landslides 7 (1), 13–30. doi:10.1007/s10346-009-0183-2
Rahmati, O., Pourghasemi, H. R., and Zeinivand, H. (2016). Flood susceptibility mapping using frequency ratio and weights-of-evidence models in the Golastan Province, Iran. Geocarto Int. 31 (1), 42–70. doi:10.1080/10106049.2015.1041559
Roy, P., Pal, S. C., Chakrabortty, R., Chowdhuri, I., Malik, S., and Das, B. (2020). Threats of climate and land use change on future flood susceptibility. J. Clean. Prod. 272, 122757. doi:10.1016/j.jclepro.2020.122757
Sellami, E., Maanan, M., and Rhinane, H. (2022). Performance of machine learning algorithms for mapping and forecasting of flash flood susceptibility in Tetouan, Morocco. Int. Archives Photogrammetry, Remote Sens. Spatial Inf. Sci. 46, 305–313. doi:10.5194/isprs-archives-xlvi-4-w3-2021-305-2022
Sheng, M., Zhou, J., Chen, X., Teng, Y., Hong, A., and Liu, G. (2022). Landslide susceptibility prediction based on frequency ratio method and C5. 0 decision tree model. Front. Earth Sci. 889, 918386. doi:10.3389/FEART.2022.918386
Shu, Y., Zheng, G., and Yan, X. (2022). Application of Multiple Geographical Units Convolutional Neural Network based on neighborhood effects in urban waterlogging risk assessment in the city of Guangzhou, China. Phys. Chem. Earth, Parts A/B/C 126, 103054. doi:10.1016/j.pce.2021.103054
Sun, D., Xu, J., Wen, H., and Wang, Y. (2020). An optimized random forest model and its generalization ability in landslide susceptibility mapping: Application in two areas of three gorges reservoir, China. J. Earth Sci. 31 (6), 1068–1086. doi:10.1007/s12583-020-1072-9
Tehrany, M. S., Jones, S., and Shabani, F. (2019). Identifying the essential flood conditioning factors for flood prone area mapping using machine learning techniques. Catena 175, 174–192. doi:10.1016/j.catena.2018.12.011
Tien Bui, D., Ho, T. C., Pradhan, B., Pham, B. T., Nhu, V. H., and Revhaug, I. (2016). GIS-based modeling of rainfall-induced landslides using data mining-based functional trees classifier with AdaBoost, Bagging, and MultiBoost ensemble frameworks. Environ. Earth Sci. 75 (14), 1101–1122. doi:10.1007/s12665-016-5919-4
Varnes, D. J. (1984). Landslide hazard zonation: A review of principles and practice. Paris: UNESCO Press.
Wang, Y., Duan, H., and Hong, H. (2019). A comparative study of composite kernels for landslide susceptibility mapping: A case study in yongxin county, China. Catena 183, 104217. doi:10.1016/j.catena.2019.104217
Wang, Y., Fang, Z., Hong, H., Costache, R., and Tang, X. (2021). Flood susceptibility mapping by integrating frequency ratio and index of entropy with multilayer perceptron and classification and regression tree. J. Environ. Manag. 289, 112449. doi:10.1016/j.jenvman.2021.112449
Xiao, B., Zhao, J., Li, D., Zhao, Z., Zhou, D., Xi, W., et al. (2022). Combined SBAS-InSAR and PSO-RF algorithm for evaluating the susceptibility prediction of landslide in complex mountainous area: A case study of ludian county, China. Sensors 22 (20), 8041. doi:10.3390/s22208041
Xiong, J., Li, J., Cheng, W., Wang, N., and Guo, L. (2019). A GIS-based support vector machine model for flash flood vulnerability assessment and mapping in China. ISPRS Int. J. Geo-Information 8 (7), 297. doi:10.3390/ijgi8070297
Yao, J., Zhang, X., Luo, W., Liu, C., and Ren, L. (2022). Applications of Stacking/Blending ensemble learning approaches for evaluating flash flood susceptibility. Int. J. Appl. Earth Observation Geoinformation 112, 102932. doi:10.1016/j.jag.2022.102932
Youssef, A. M., Pradhan, B., and Sefry, S. A. (2016). Flash flood susceptibility assessment in Jeddah city (Kingdom of Saudi Arabia) using bivariate and multivariate statistical models. Environ. Earth Sci. 75 (1), 12–16. doi:10.1007/s12665-015-4830-8
Zhang, H., Song, Y., Xu, S., He, Y., Li, Z., Yu, X., et al. (2022). Combining a class-weighted algorithm and machine learning models in landslide susceptibility mapping: A case study of wanzhou section of the three gorges reservoir, China. Comput. Geosciences 158, 104966. doi:10.1016/j.cageo.2021.104966
Zhang, Z. J., Liu, C. Q., Zhao, Z. Q., Cui, L. F., Liu, W. J., Liu, T. Z., et al. (2015). Behavior of redox-sensitive elements during weathering of granite in subtropical area using X-ray absorption fine structure spectroscopy. J. Asian Earth Sci. 105, 418–429. doi:10.1016/j.jseaes.2015.02.015
Keywords: flash flood susceptibility prediction, uncertainty analysis, machine learning, multilayer perceptron, support vector machine, random forest
Citation: Chen Y, Zhang X, Yang K, Zeng S and Hong A (2023) Modeling rules of regional flash flood susceptibility prediction using different machine learning models. Front. Earth Sci. 11:1117004. doi: 10.3389/feart.2023.1117004
Received: 06 December 2022; Accepted: 05 January 2023;
Published: 17 January 2023.
Edited by:
Guang-Liang Feng, Institute of Rock and Soil Mechanics (CAS), ChinaReviewed by:
Jiawei Xie, The University of Newcastle, AustraliaLuqi Wang, Chongqing University, China
Paraskevas Tsangaratos, National Technical University of Athens, Greece
Copyright © 2023 Chen, Zhang, Yang, Zeng and Hong. This is an open-access article distributed under the terms of the Creative Commons Attribution License (CC BY). The use, distribution or reproduction in other forums is permitted, provided the original author(s) and the copyright owner(s) are credited and that the original publication in this journal is cited, in accordance with accepted academic practice. No use, distribution or reproduction is permitted which does not comply with these terms.
*Correspondence: Anyu Hong, aG9uZ2FueXVAbmN1LmVkdS5jbg==