 Rui He1
 Liuke Huang
- 1Engineering Technology Research Institute, PetroChina Southwest Oil and Gasfield Company, Chengdu, Sichuan, China
- 2State Key Laboratory of Oil and Gas Reservoir Geology and Exploitation, Southwest Petroleum University, Chengdu, Sichaun, China
- 3School of Civil Engineering and Geomatics, Southwest Petroleum University, Chengdu, Sichuan, China
- 4State Key Laboratory of Geomechanics and Geotechnical Engineering, Institute of Rock and Soil Mechanics, Chinese Academy of Sciences, Wuhan, China
Multi-cluster horizontal well fracturing is one of the key technologies to develop the unconventional reservoirs such as shales. However, the field data shows that some perforation clusters have little production contribution. In this study, a three-dimensional (3D) numerical model for simulating the multiple fracture propagation based on 3D block discrete element method was established, and this model considers the stress interference, perforation friction and fluid-mechanical coupling effect. In order to determine the most appropriate measures to improve the uniformity of multiple fracture propagation, the effect of the geologic and engineering parameters on the multiple fracture propagation in shale reservoirs is investigated. The modeling results show that the geometry of each fracture within a stage is different, and the outer fractures generally receive more fracturing fluid than the interior fractures. The vertical stress almost has no effect on the geometries of multiple fractures. However, higher horizontal stress difference, larger cluster spacing, smaller perforation number, higher injection rate, and smaller fracturing fluid viscosity are conducive to promote the uniform propagation of multiple fractures. The existence of bedding planes will increase the fluid filtration, resulting in a reduction in fracture length. The middle two fractures receive less fluid and the width of them is smaller. Through analyzing the numerical results, a large amount of fracturing fluid should be injected and the proppant with smaller size is suggested to be used to effectively prop the bedding planes. Cluster spacing and perforation number should be controlled in an appropriate range according to reservoir properties. Increasing the injection rate and reducing the viscosity of fracturing fluid are important means to improve the geometry of each fracture.
1 Introduction
As a kind of unconventional resources, shale reservoir is characterized by low porosity and ultra-low permeability (Huang et al., 2018; Wang et al., 2019; Song et al., 2021). Multi-stage hydraulic fracturing has become a standard technology to effectively exploit shale oil and gas (Luo et al., 2022; Zhang et al., 2022). In order to enlarge the fracture surface area, the scholars and companies continuously explore to generate multiple fractures with smaller cluster spacing, thus higher production can be achieved. According to the analysis results from distributed temperature sensing (DTS) and distributed acoustic sensing (DAS), some perforation clusters only receive a small proportion of fracturing fluid and proppant, and about one-third of the perforation clusters have no production contribution (Miller et al., 2011; Somanchi et al., 2017). That is to say, multiple hydraulic fractures cannot be uniformly generated within a stage, resulting in an obvious contrast in gas and oil production for each fracture along the wellbore. Previous studies show that stress interference among multiple fractures is an important factor affecting the geometry of each fracture (Ji et al., 2015; Wu and Olson, 2016; Tang et al., 2019). Fundamentally, the effectiveness of hydraulic fracturing is determined by many factors, such as perforation parameters, rock properties, in-situ stress, and fracturing treatment parameters. Meanwhile, hydraulic fracturing is a highly non-linear and fluid-mechanical coupling process (Zhu et al., 2019). Therefore, an integrated model which can accurately simulate the three-dimensional fracture propagation of horizontal wells is required. How to reduce the stress interference and improve the fracture geometry is a concern of engineers. In recent years, investigation of simultaneous multiple fracture propagation in horizontal well has been a hot issue.
The results of multiple fracture propagation can be directly observed through the physical experiment (Tan et al., 2020; Wang et al., 2022a). Bunger et al. studied the interaction among closely spaced hydraulic fractures through triaxial apparatus, and several preexisting notches on the wellbore were designed to represent the perforation holes (Bunger et al., 2011). Liu et al. conducted triaxial experiments on tight sandstone to investigate the geometries of multiple fractures and the pattern of fracturing curves. The influencing factors including net pressure, fracture spacing, perforation parameter, in-situ stress and well cementation quality were analyzed (Liu et al., 2018). However, the physical experiments can only qualitatively study the fracture propagation because of scale effect, and the experimental preparation is complicated and high cost is required. Therefore, few scholars carry out physical experiments to study multiple fracture propagation. In contrast, theoretical research tends to be an economic method.
At present, numerical models to simulate fracture propagation mainly include 2D, pseudo 3D and planar 3D models. Various 2D hydraulic fracturing models were developed to simulate the multiple fracture propagation. As an indirect boundary element method (BEM), the displacement discontinuity method (DDM) was earlier used to simulate the competitive propagation of multiple fractures considering the stress interference (Crouch, 1976). Wu and Olson proposed a fully coupled hydraulic fracture propagation model using 2D-DDM, and revealed the influencing mechanism of unbalanced fracture propagation (Wu and Olson, 2013). Sesetty and Ghassemi investigated the fracture propagation in sequential and simultaneous fracturing for single and multiple horizontal wells using fully coupled 2D-DDM (Sesetty and Ghassemi, 2015). In addition, two dimensional analysis of the uneven growth of multiple fracture have been conducted by some scholars using extended finite element method (XFEM) (Shi et al., 2016; Li et al., 2017; Tan et al., 2021). However, the 2D model has a fatal flaw in modeling the fracture height growth although it can reflect the physical mechanism of multiple fracture propagation under a great computing speed. Settari et al. proposed Pseudo 3D models for hydraulic fracturing design in the 1980s, which can simulate fracture height growth based on the analytical solution of stress intensity factor (Palmer et al., 1983; Settari and Cleary, 1986). Linkov et al. proposed an improved pseudo 3D model based on equivalent KGD model to calculate fracture height propagation under stress contrast (Linkov and Markov, 2020). Zhao et al.( 2016) established a pseudo 3D model to simulate simultaneous propagation of multiple fractures in horizontal wells, coupling the influence of many factors including elastic deformation of rock, stress interaction among fractures and fluid flow. Yang et al. (2018) proposed a pseudo-3D multi-cluster fracturing model based on 2D-DDM and the criterion of energy release rate, and the measures to promote the uniform propagation of multiple fractures were put forward. However, the calculation accuracy of pseudo 3D model is insufficient in the stress field of multiple fracture because of the plane strain assumption, and this method is not applicable to simulate the fracture height growth in high stress layer. The planar 3D model, which applies the 3D solid-mechanical equation to calculate the rock deformation while allowing two-dimensional fluid flows, provide better description of fluid behaviors in the fracture. Barree (1983) established a planar 3D numerical simulator using the fixed grid method in heterogenous media. Peirce and Bunger (2014) investigated the influence of non-uniform cluster space on increasing the fracture uniformity using a developed, fully coupled, planar 3D fracturing model. Tang et al. (2016) analyzed the multiple fracture propagation using a planar 3D-DDM based thermal-hydro-mechanical model and non-uniform distribution of proppant was observed. However, the planar 3D model has a disadvantage that the curving of fracture caused by stress interference and stress heterogeneity cannot be considered. In recent years, in order to simulate the multiple fracture propagation more accurately, some new 3D models were developed by scholars (Li et al., 2016; Huang et al., 2020).
In 1970s, Cundall (1971) first developed the discrete element method (DEM) to describe the non-linear mechanical behavior of non-continuum. In recent years, the scholars have begun to investigate the hydraulic fracture propagation using the DEM (Zhang et al., 2017; He et al., 2020; Huang et al., 2022). As a typical DEM, the block discrete element method (BDEM) is suitable for characterizing discontinuities (such as shale reservoirs) fully coupled with fluid-mechanical effect. This model is composed of a number of deformable blocks, which are connected by contacts to characterize the rock formation. This method does not require sophisticated constitutive equations and adopts explicit solution with strong convergence, which greatly reduces the calculation amount. Compared with other DEM methods (such as particle flow code method), the BDEM method can better simulate the fracture height growth and multiple fracture propagation. Zhang and Dontsov (2018) used the BDEM to study the 3D fracture propagation and proppant transport in a layered reservoir considering the influencing of stress distribution. Yin et al. (2020) investigated the fault reactivation and induced seismicity caused by hydraulic fracturing using the BDEM. Zheng et al. (2022) explored the effect of fracturing fluid viscosity and injection rate on the vertical propagation of hydraulic fracture in shale reservoirs with developed bedding planes. Although the BDEM method has been widely used to analyze the mechanical behavior of fracture propagation, there are few studies on simultaneous 3D propagation of multiple fractures taking account of stress interference among fractures, and the effect of bedding planes on the multiple fracture propagation were less studied.
In order to investigate the effect of the geologic and engineering parameters on the multiple fracture propagation in shale reservoirs, we established a fracturing model of horizontal wells considering the influence of stress interference effect, perforation friction and fluid-mechanical coupling effect using the 3D-BDEM. Based on this model, a sensitivity analysis of the key influencing parameters including in-situ stress, bedding plane, cluster spacing, perforation number, injection rate and fracturing fluid viscosity on multiple fracture propagation in the shale reservoirs are systematically studied. The uniformity of multiple fracture and dynamic flow rate distribution between clusters within a stage are analyzed. Based on the research results, the engineering measures to adjust the flow rate in each cluster and improve the fracture geometries of horizontal shale wells are put forward.
2 Numerical modeling methodology
For the block DEM, it is assumed that the rock is divided into many blocks by the joints, and the interaction between the blocks satisfies Newton’s second law. In the model, the forces exerted on the blocks are balanced under initial state conditions. When the forces or constraints of the system are changed, the blocks move or rotate, resulting in the change of force exerted on the blocks. The system finally reaches a new balance after the interaction between the blocks.
For rigid blocks, the plane motion equation and rotation equation of the block are respectively expressed as:
where
In block DEM, each deformable block is composed of several tetrahedron finite element grids. The complexity of block deformation is directly related to the number of the divided elements. Similar to the finite element method (FEM), the vertices in the tetrahedron element are called nodes.
Under equilibrium condition, the resultant force on the node is 0. Conversely, if the resultant force is not 0, then there is an acceleration at the node. The explicit difference method (EDM) is used to solve the model, and the linear momentum balance equation and displacement-velocity relationship are adopted to calculate the translational degrees of the freedom of nodes, as shown in follows:
where
The angular velocity of component i at time t is calculated by the central difference equation:
The incremental equation of constitutive relation of deformable blocks can be described as:
where
In block DEM, any two blocks are connected by a contact, where can be set as a joint. The fracture propagates along the joint when the joint is broken. The deformation and failure of joints follow the Coulomb slip joint contact behaviour. In this paper, the constitutive model takes account of shear and tensile failure, also the joint expansion is considered. The contact deformation is described by the normal and shear relationships.
The increments of normal force is given by:
where
The increments of shear force is given by:
where
For an original joint, the maximum normal tensile force can be calculated as:
where
The maximum shear force can be calculated as:
where
When the maximum normal stress reaches or exceeds the normal strength of the joint, or the maximum shear stress reaches or exceeds the shear strength of the joint, the contact of joint will be broken by tensile or shear force, then the tensile strength and joint cohesion decrease to zero.
The criterions of tensile and shear breakage of the joint contact are described as follows:
where
After the failure of joint contacts, the deformation of the joint is determined by block deformation, as shown in Eq. 6
The fluid flow in the joint satisfies the Navier-Stokes equation (Jin and Chen, 2019). When the two joint faces are approximately parallel and impermeable, and the fluid is incompressible, the Navier-Stokes equation can be simplified to the Reynolds equation. The fluid flow rate can be expressed as:
where
Fluid flow in the fracture is a fluid-mechanical coupling process. In a time step, the fluid pressure acts on the joint surface and causes rock deformation, resulting in the update of fluid pressure. After a time step, the updated fluid pressure leads to the variation of fracture width, thus changing the fracture permeability. The effective stress is often used to calculate the deformation of solids under the action of fluid, which can be given as:
where
The fracture width is defined as the average distance between the two parallel joint surfaces, which is related to the deformation of rock mass. It is known that the fluid flow rate is related to the fracture width. Therefore, the influence of rock deformation on the fracture permeability is mainly characterized by the change of joint aperture. The joint aperture is described by:
where
The pressure is changed with the fluid volume and injection parameters. The domain pressure is described by:
where
The perforation frictional pressure drop can be predicted using the equation proposed by Crump and Conway (Crump and Conway, 1988):
where
3 Model verification
A shale reservoir model with dimensions of 100 m × 100 m × 40 m is established based on the BDEM, as shown in Figure 1. In the model, it is vertically divided into three layers, in which the top and bottom parts are barrier layers, and the thickness of each barrier layer is 10 m. Shale reservoir is located in the middle of the model, with a thickness of 20 m. A horizontal wellbore (red line) is established, and there are six perforation clusters (green balls) within a fracturing stage are set along the wellbore. In the location of each cluster, a hydraulic fracture will initiate and propagate perpendicular to the wellbore. Among the six clusters, Cluster 6 is near the heel of the wellbore, and Cluster 1 is near the toe of wellbore. To model the shale reservoir which contains bedding planes, several horizontal joints are preset in the model to study multiple fracture propagation.

FIGURE 1. Physical model of horizontal well fracturing with six clusters in a stage.
In 1950s, the plane strain KGD fracture propagation model was proposed by Khristianovic and Zheltov (Khristianovic and Zheltov, 1955). Then, Donstov developed a quick solution for a propagating penny-shaped hydraulic fracture, considering fracture toughness, fluid viscosity, and leak-off (Dontsov, 2016). In order to validate the BDEM-based fracture propagation model, we compared it with analytical model under viscosity-dominated regime. The analytical expression for the fracture width and fracture length can be described as (Huang et al., 2019; Huang et al., 2022):
where
The input parameters for model validation are shown in Table 1. Figure 2 shows a comparison between the numerical solution by BDEM and the modeling results of analytical model. The results show that there is good agreement on the fracture width calculated by these two methods, showing that the BDEM model established in this paper is reliable.
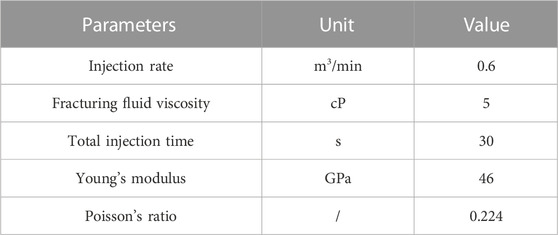
TABLE 1. The input parameters for hydraulic fracturing simulation.
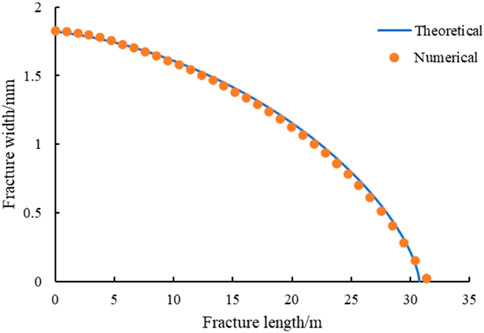
FIGURE 2. Comparison between the theoretical solution and the numerical solution for hydraulic fracture width versus fracture position.
4 Modeling results and discussion
4.1 Input parameters
The multiple fracture propagation during hydraulic fracturing process is largely influenced by geological and engineering parameters (Tan et al., 2017; Zhang et al., 2021; Wang et al., 2022b; Guo et al., 2022; Dou and Wang, 2022; Zhou and Yang, 2022; Huang et al., 2023). In this paper, the effects of these parameters including in-situ stress, bedding plane, cluster spacing, perforation number, injection rate and fracturing fluid viscosity on multiple fracture propagation within a stage were investigated using the numerical model established above. A series of numerical simulations (Case A to Case O) of multiple fracture propagation were conducted through changing the value of each parameter separately. Table 2 shows the input parameters of each modeling case. For this study, the basic parameters were taken from the shale oil reservoirs in western China, as shown in Case A in Table 1. In each case, the Young’s modulus of the shale reservoir is set at 46 GPa, and the Poisson’s ratio is 0.224. The Young’s modulus of the barrier layer is set at 51 GPa, and the Poisson’s ratio is 0.263. The minimum principal stress of the barrier layer is 5 MPa larger than that of the shale reservoir. Comparing the results of other cases with that of the base case (Case A), the effect of factors can be analyzed. To study the effect of bedding planes on the multiple fracture propagation, Case F gives the shale reservoir model with strongly cemented bedding planes, where the shear resistance of bedding planes is stronger, and the internal friction angle is set at 30°. Case G gives the shale reservoir model with weakly cemented bedding planes, where the shear resistance of bedding planes is weaker, and the internal friction angle is set at 10°. In the above two cases, the tensile strength of the bedding planes is 6 MPa, and the cohesion of bedding planes is 1.5 MPa.
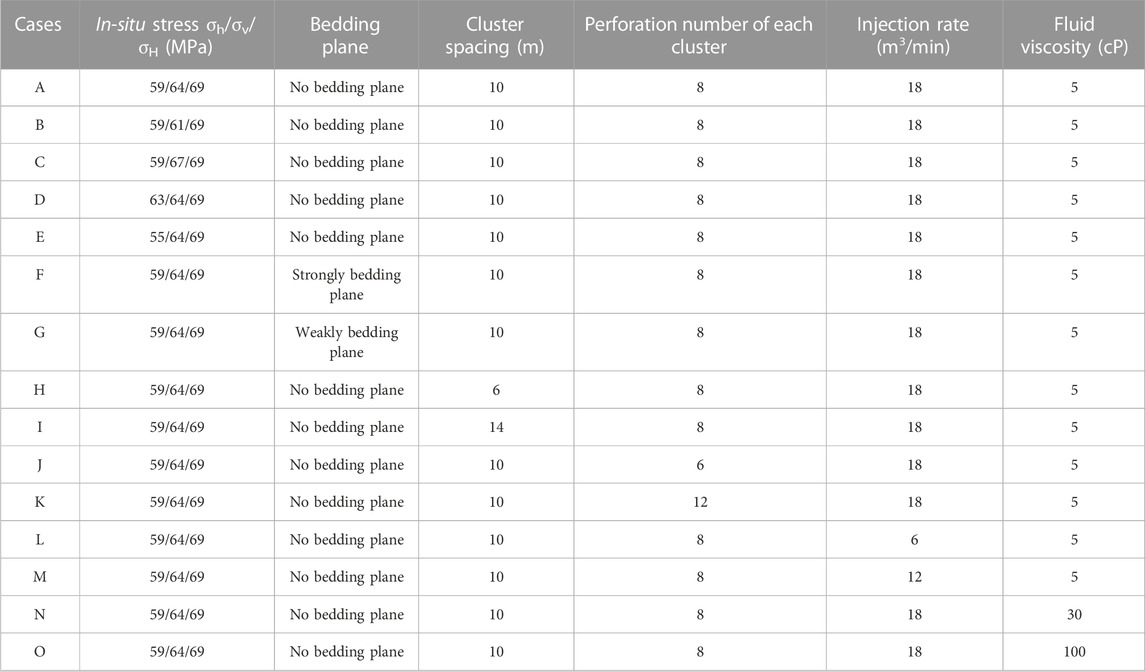
TABLE 2. Summary of the input parameters of each modeling case.
4.2 Effect of geologic parameters
Based on the input parameters in Table 2, the numerical simulations of Case A to Case O were carried out. The fracture morphology of multiple fracture for each case is as shown in this section, and the variation of flow rate into each cluster is plotted and discussed in this section. In the figures of facture morphologies below, the colors at different fracture positions represent the value of fracture width (aperture).
4.2.1 In-situ stress
In this section, we will study the effect of in-situ stress combination on the multiple fracture propagation under the condition of keeping other parameters constant. Figure 3 shows the fracture morphologies at the end of injection for five different in-situ stress combination states. It can be seen that multiple bi-wing fractures initiated and propagated perpendicular to the wellbore in each case. The geometries of each fracture within a stage are different due to the difference in received fracturing fluid. From Figure 3, the fracture length of the outer two fractures are slightly greater than that of the interior fractures, which means that a wider area is stimulated on both sides within a fracturing stage. In addition, the interior four clusters are suppressed to a certain extent, resulting in significantly smaller fracture width and larger area of inefficient fracture width (less than 1 mm). This phenomenon has been confirmed by some previous studies (Wu and Olson, 2016; Yang et al., 2018), showing that it is caused by competitive fracture propagation due to stress interference and friction effect.
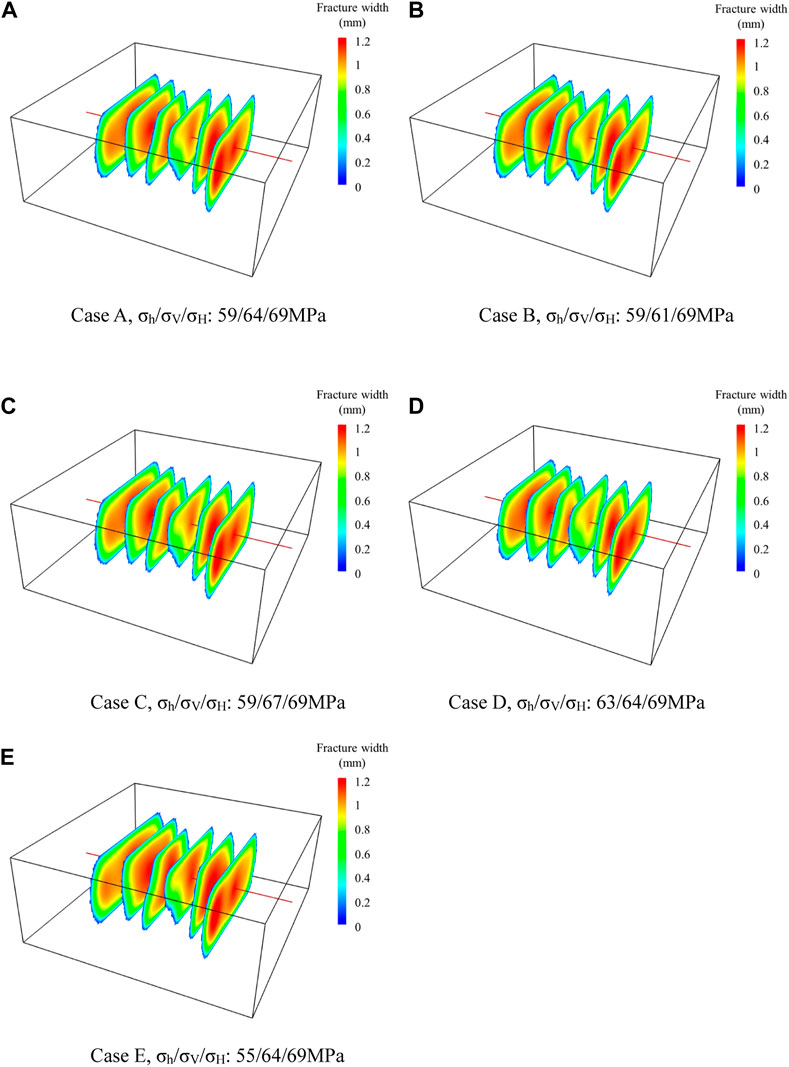
FIGURE 3. Fracture morphology for five cases with different in-situ stress combination states. (A) Case A, σh/σV/σH: 59/64/69 MPa. (B) Case B, σh/σV/σH: 59/61/69 MPa. (C) Case C, σh/σV/σH: 59/67/69 MPa. (D) Case D, σh/σV/σH: 63/64/69 MPa. (E) Case E, σh/σV/σH: 55/64/69 MPa.
Cases A, B, and C compare the effect of vertical in-situ stress at a horizontal stress difference of 10 MPa. The numerical simulation results show that the fracture geometries obtained by the above three cases are very close, indicating that the vertical stress has little influence on the propagation of vertical fracture in homogeneous reservoirs. On the other hand, Cases A, D, and E compare the effect of horizontal stress difference when the vertical stress stays at 64 MPa. The results show that when the horizontal stress difference is higher, the length of each fracture slightly increases and the width of interior fractures is significantly greater, which means the fractures are more easily to propagate along the maximum principal stress direction under higher horizontal stress difference. The middle two fractures are greatly restrained when the horizontal stress difference is only 6 MPa. In this case, the fracture width of the middle two fractures are smaller, especially the areas near the injection point are not effectively opened. However when the horizontal stress difference reaches 14 MPa, the multiple fracture propagation is comparatively more uniform, indicating that higher horizontal stress difference can reduce the inhibition of interior fractures.
In order to better understand the dynamic propagation process of multiple fractures, the change of flow rate with injection time in each cluster is plotted in Figure 4. The total fluid volume distribution of each cluster for the five different cases is shown in Figure 5. It can be seen that in each case, the two fractures on the outside always receive more fluid than the other four fractures during all the injection process. The flow rate of the outer two fractures increases rapidly first and then decrease gradually. Conversely, the flow rate obtained by the interior four fractures decreases slightly at first, and increases gradually after half of the total fluid is injected. At the end of injection, the flow rate of the outer fractures is obviously larger than that of interior fractures. Taking Case A as an example, the total fluid volume percentage received by the fractures are 20.09%, 16.79%, 13.53%, 13.37%, 15.68%, and 20.54%, respectively. Comparing cases A, B, and C, it can be seen that the vertical stress has little influence on the flow rate distribution, and the flow rate curves of each case are very similar, and these fractures finally receive almost the same volume of fracturing fluid. Comparing cases A, D, and E, we can find the difference between the shapes of each flow rate curve slightly decreases with the increase of horizontal stress difference, and the volume of fracturing fluid received by each fracture is closer under higher horizontal stress difference. When the horizontal stress difference is 14 MPa, the total fluid volume percentage received by the fractures are 19.84%, 16.74%, 13.76%, 13.55%, 15.92%, and 20.19%, respectively. The results verify that the flow distribution of each fracture is more uniform under the condition of higher horizontal stress difference.
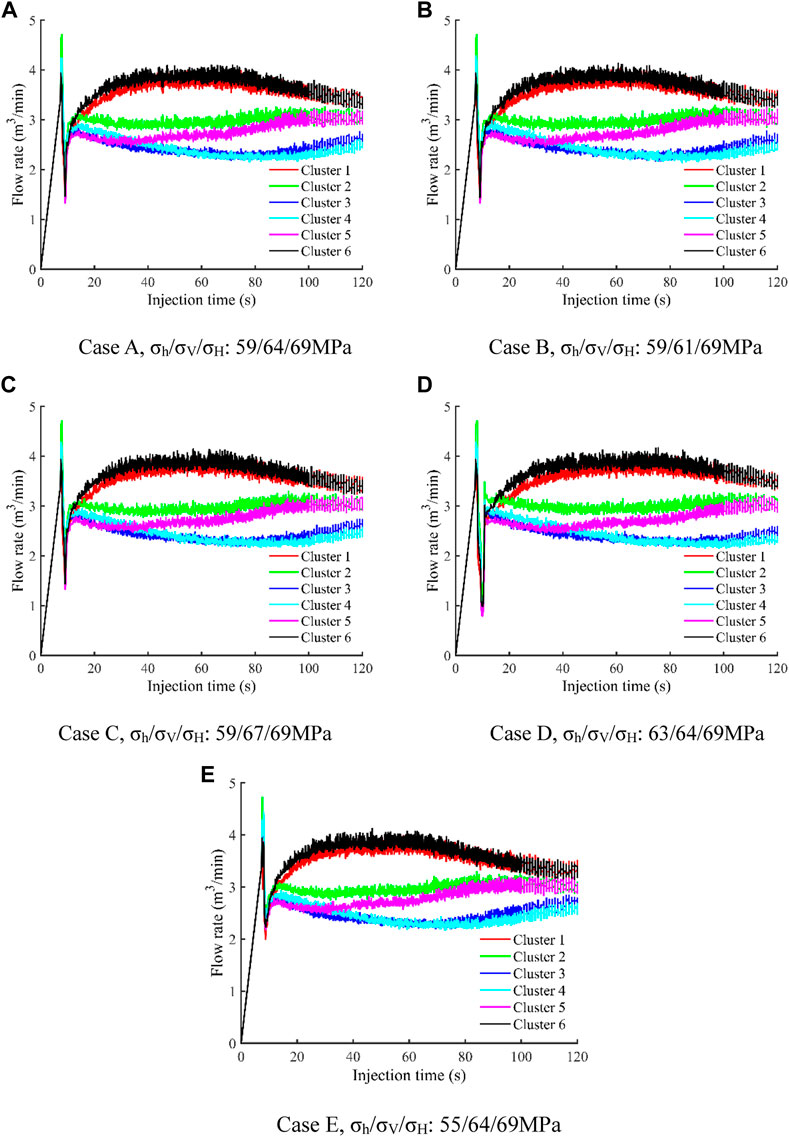
FIGURE 4. Flow rate into each cluster as a function of time for five cases with different in-situ stress combination states. (A) Case A, σh/σV/σH: 59/64/69 MPa. (B) Case B, σh/σV/σH: 59/61/69 MPa. (C) Case C, σh/σV/σH: 59/67/69 MPa. (D) Case D, σh/σV/σH: 63/64/69 MPa. (E) Case E, σh/σV/σH: 55/64/69 MPa.
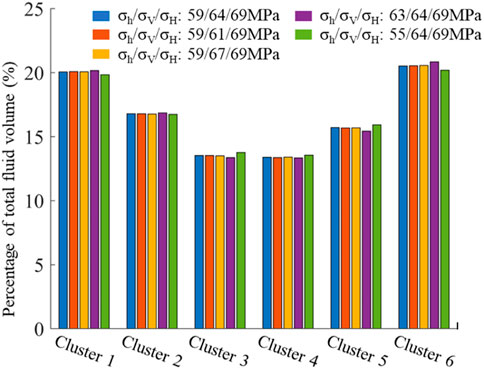
FIGURE 5. The total fluid volume distribution of each cluster for five cases with different in-situ stress combination states.
4.2.2 Bedding plane
Some shale reservoirs contain numerous bedding planes with lower strength and the existence of bedding planes will have an influence on the vertical growth of hydraulic fractures. The activation of bedding planes often promotes the formation of a complex fracture network, which is beneficial to increase the stimulated reservoir volume (SRV). In this section, several horizontal bedding planes are preset in the model to investigate the effect of bedding plane on the multiple fracture propagation. Figure 6 shows the fracture morphologies at the end of injection for three different bedding development levels. For comparison, Case A shows the fracture propagation results without bedding planes. It can be seen that for the shale reservoirs with strongly cemented bedding planes, just a few bedding planes are activated by fracturing fluid (Figure 6B). The fractures near the heel of wellbore can connect several bedding planes, but the distance of fracturing fluid flowing through the bedding planes is very short. Moreover, the closer to the toe of the wellbore, the more difficult it is to activate the bedding planes.
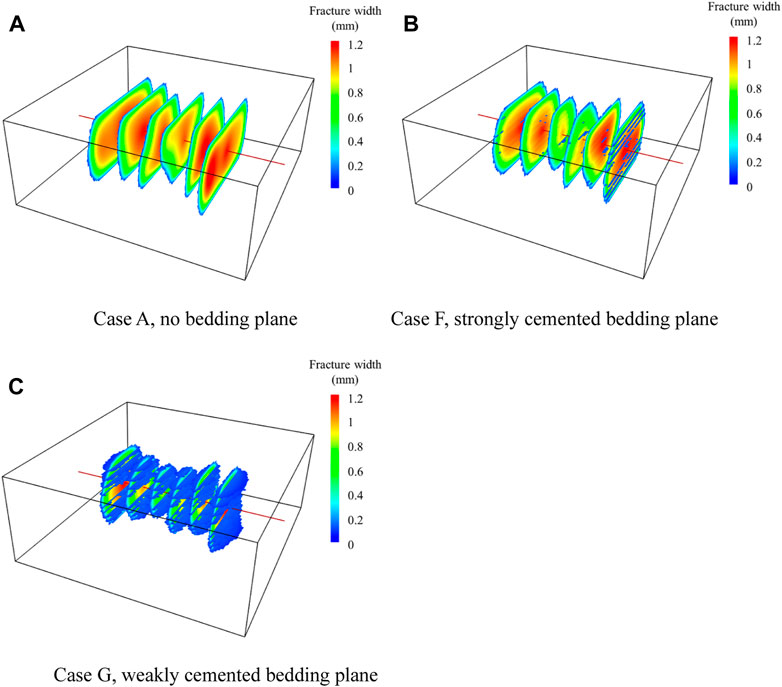
FIGURE 6. Fracture morphology for three cases with different bedding development level. (A) Case A, no bedding plane. (B) Case F, strongly cemented bedding plane. (C) Case G, weakly cemented bedding plane.
On the other side, for the shale reservoir with weakly cemented bedding planes, a lot of bedding planes are effectively activated and opened by the hydraulic fractures, and a fence-like fracture network is generated (Figure 6C). Similarly, the fractures near the heel of wellbore can communicate more bedding planes than the other fractures. It can also be found that the length of each fracture is smaller because of fluid filtration into the bedding planes. Compared with the shale reservoir with no bedding planes, the width of the middle two fractures is obviously lower for the shale reservoir with bedding planes, which indicates that the existence of bedding planes increases the effect of stress interference, even in the bedding planes which are relatively strongly cemented. For the above two cases, the width of activated bedding planes is very low (blue color). This is because the normal stress will decrease and the shear stress increase near the intersection line of the bedding plane when the hydraulic fracture approaches the bedding plane, and the shear failure is more easily to occur at bedding plane when the fracturing fluid flows from the hydraulic fracture to the bedding planes (Zheng et al., 2022). That means the bedding planes will be activated and they will tend to move along the shear direction, however it will not be opened to a great level. Thus, it is suggested that using the proppant with smaller particle size to effectively support the opened bedding planes. For shale reservoirs with bedding planes, as much fracturing fluid as possible should be injected to ensure the propagation of both hydraulic fractures and bedding planes, especially to improve the width of bedding planes.
Figure 7 shows the change of flow rate with injection time in each cluster with different bedding development levels. Compared with shale reservoir without bedding planes, the flow rate obtained by each fracture in shale reservoir with bedding planes is smaller because of fluid filtration into the bedding planes. In addition, the difference of flow rate obtained by each fracture in shale reservoir with bedding planes is greater, which means the existence of bedding planes will promote the non-uniform distribution of flow rates in each fracture. Particularly, the flow rate of the interior four fractures varies greatly, and the amount of fracturing fluid received by the Cluster 3 is far lower than that of other fractures. However, the existence of bedding planes has little influence on the flow rate of the outer two fractures. According to the statistical results of total fluid volume for Case F and Case G (Figure 8), it can be seen that the percentage of flow rates received by the interior four fractures varies more greatly when the bedding plane is more developed. For Case F, the total fluid volume percentage received by the fractures are 21.29%, 15.60%, 10.18%, 14.18%, 17.27%, and 21.47%, respectively. For Case G, the total fluid volume percentage received by the fractures are 21.56%, 15.00%, 10.07%, 14.85%, 16.70%, and 21.82%, respectively.
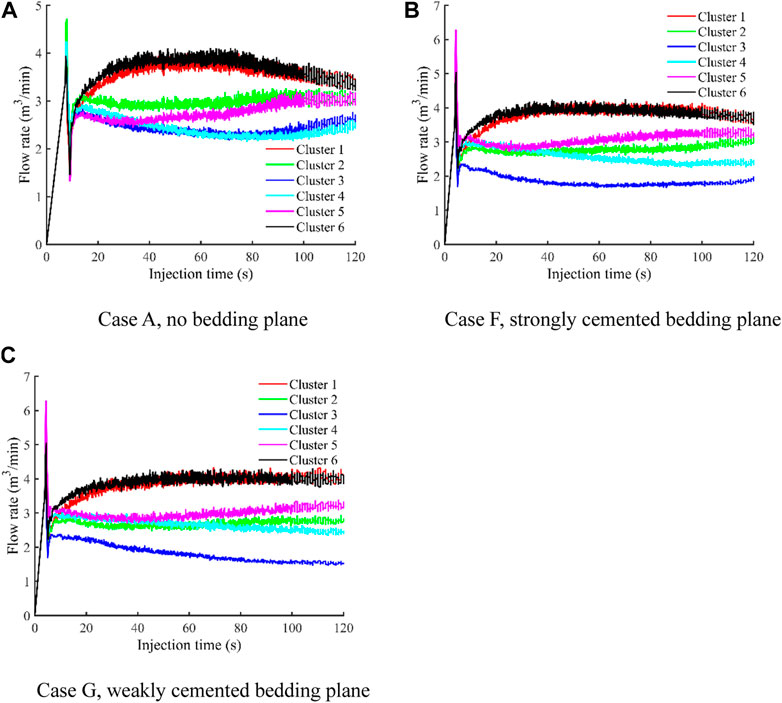
FIGURE 7. Flow rate into each cluster as a function of time for three cases with different bedding development levels. (A) Case A, no bedding plane. (B) Case F, strongly cemented bedding plane. (C) Case G, weakly cemented bedding plane.
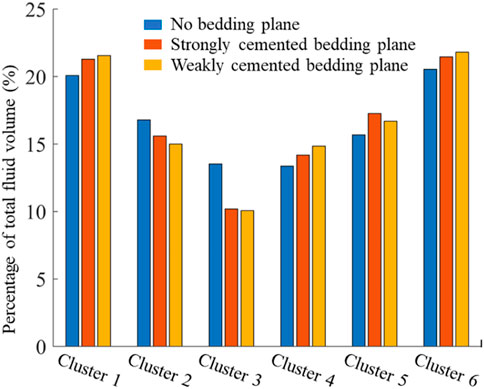
FIGURE 8. The total fluid volume distribution of each cluster for three cases with different bedding development level.
4.3 Effect of engineering parameters
4.3.1 Cluster spacing
The above investigations mainly focus on the influence of inherent geologic parameters on the multiple fracture propagation. The parameters that we can control are the engineering parameters such as perforation parameters (cluster spacing and perforation number) and injection parameters (injection rate and fracturing fluid viscosity). In this section, we will study the effect of cluster spacing on the multiple fracture propagation under the condition of keeping other parameters constant. Figure 9 shows the fracture morphologies at the end of injection for three different cluster spacing. It can be seen that the geometry of each fracture within a stage are significantly different under three different clustering spacing (D = 6 m, D = 10 m, and D = 14 m). The interior four clusters are greatly suppressed when the cluster spacing is 6 m. In this case, the fracture length of the interior four fractures is shorter than that of the outer two fractures, although the fracture width is larger. At the same time, the outer two fractures obviously grow preferentially. However, the difference of fracture length of each fracture decreases with the increase of cluster spacing. When the cluster spacing is 14 m, the geometries of different fractures are relatively similar, and the multiple fracture propagation is much more uniform. In this case, the stress interference between adjacent fractures is quite weak. The results show that increasing the cluster spacing is beneficial to the uniform propagation of each fracture within a stage. However, larger cluster spacing means fewer fractures within a stage, which results in that some reservoir areas have not been effectively stimulated. At this time, the distance between some matrix areas and the hydraulic fractures is farther, which makes it difficult for oil to flow from the matrix to hydraulic fractures. How to optimize the treatment parameters to obtain a reasonable fracture geometries without expanding the cluster spacing is an important prerequisite for the optimal design of multi-cluster fracturing.
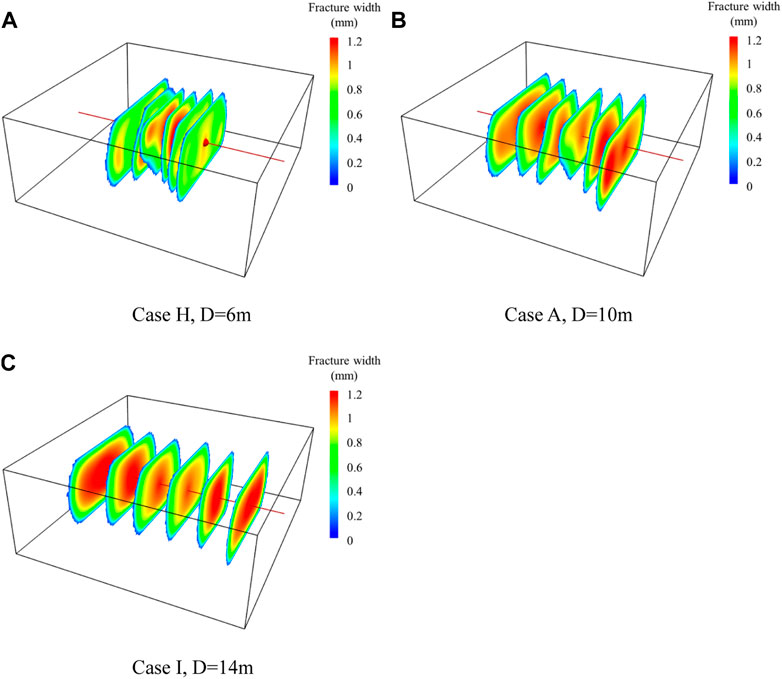
FIGURE 9. Fracture morphology for three cases with different cluster spacing. (A) Case H, D = 6 m. (B) Case A, D = 10 m. (C) Case I, D = 14 m.
The change of flow rate with injection time in each cluster is plotted in Figure 10. It can be seen that the overall curve shapes of flow rate in each case differ a lot. The flow rate curves show obvious peaks and troughs when the cluster spacing is 6 m. In this case, the flow rate of outer two fractures increases sharply, while the flow rate of interior fractures becomes smaller. With the fluid injection for a period of time, the outer two fractures gradually begin to receive less fluid, and the middle two fractures receive more fluid. At the end of injection, the flow rate of the middle two fractures is slightly larger than that of other four fractures. During the whole injection process, the flow rate curve of the outer two fractures shows the opposite trend to that of the other four fractures. With the increase of cluster spacing, the curves become flatter. The fracturing fluid received by each fracture within a stage is more similar, indicating that these fractures can propagate more evenly. The total fluid volume distribution of each cluster for the three different cases is shown in Figure 11. The results show that the outer two fractures finally receive much more fracturing fluid than the interior fractures. In addition, the flow volume difference between different fractures decreases with the increase of cluster spacing. When the cluster spacing is 6m, the total fluid volume percentage received by the fractures are 19.23%, 15.98%, 14.36%, 14.87%, 16.62%, and 18.93%, respectively. When the cluster spacing is 14m, the total fluid volume percentage received by the fractures are 19.25%, 16.00%, 15.34%, 15.76%, 14.19%, and 19.46%, respectively. In a word, the flow rate obtained by each fracture is closer with the increase of cluster spacing.
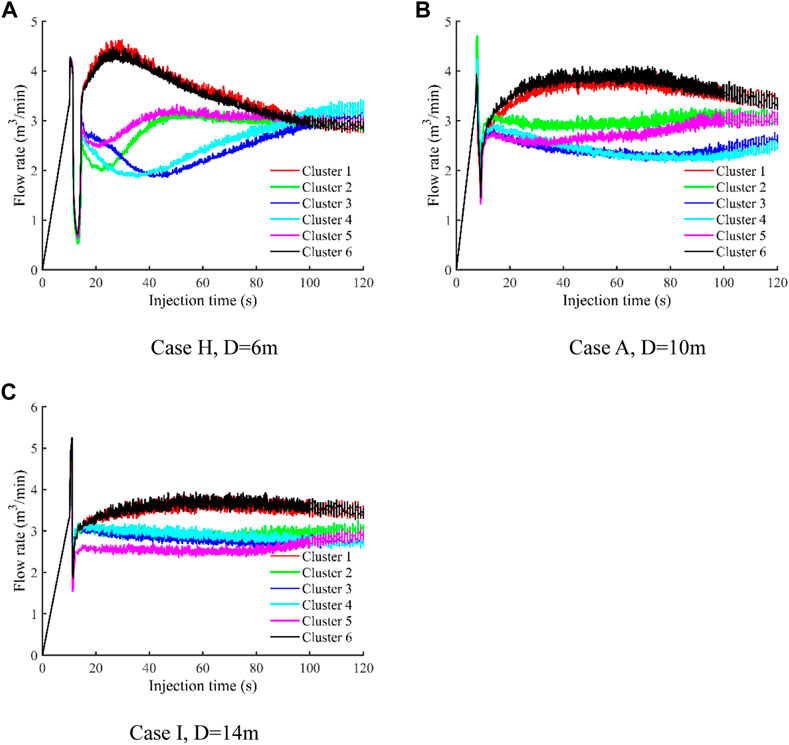
FIGURE 10. Flow rate into each cluster as a function of time for three cases with different cluster spacing. (A) Case H, D = 6 m. (B) Case A, D = 10 m. (C) Case I, D = 14 m.
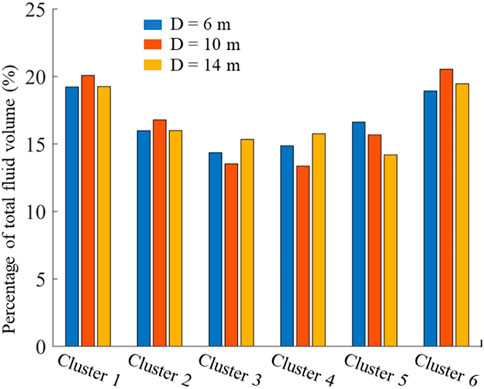
FIGURE 11. The total fluid volume distribution of each cluster for three cases with different cluster spacing.
4.3.2 Perforation number
In this section, we will study the effect of perforation number on the multiple fracture propagation under the condition of keeping other parameters constant. Figure 12 shows the fracture morphologies at the end of injection for three different perforation numbers. It can be seen that the difference of geometry of each fracture within a stage becomes smaller with the decrease of the perforation number. Specially, when the number of perforations in each cluster is greater than 8, the perforation number has an obvious impact on the fracture morphologies. When the perforation number of each cluster reaches 12 (1.5 times of Case A), the length and width of the middle two fractures are significantly smaller than that of the other four fractures. The results can be explained by the theory of limited entry perforation. The perforation hole friction will be increased by reducing the number of perforations. At this time, the resistance of fluid flowing through the holes will increase, and the difference of fluid pressure in the outer and interior fractures will be smaller, thus promoting the uniform propagation of each fracture within a stage. However, comparing Cases J and A, it can be seen that reducing the number of perforations has little effect on the fracture morphologies when the perforation number of each cluster is less than 8. At this time, the influence of perforation friction on fracture propagation is weaker than that of stress interference. In this case, it is necessary to improve the fracture geometries by other measures such as adjusting the cluster spacing. Although the simulation results show that reducing the number of perforations is conducive to promoting the uniform propagation of multiple fractures, significantly reducing the number of perforations will cause high perforation friction and a remarkable increase in wellhead pressure during fracturing treatment. Therefore, the number of perforations should be controlled within a reasonable range.
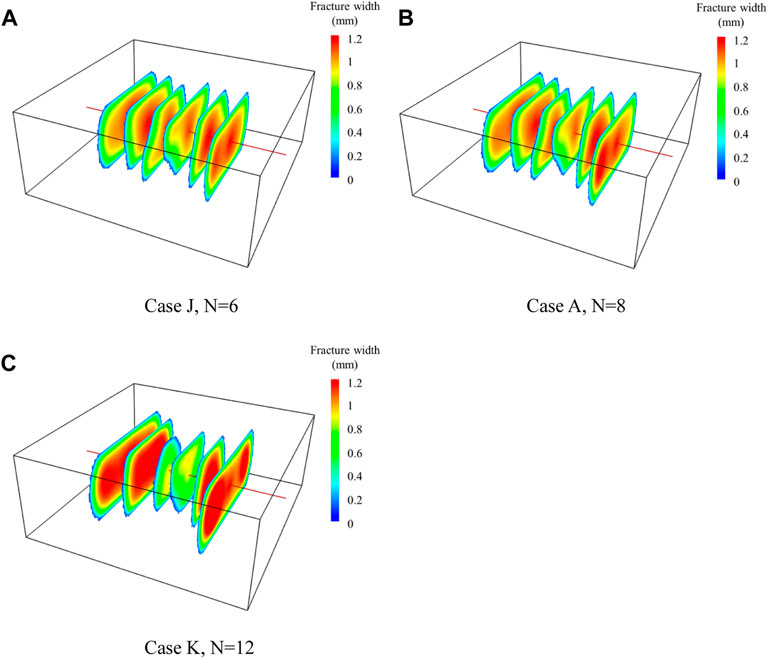
FIGURE 12. Fracture morphology for three cases with different perforation numbers. (A) Case J, N = 6. (B) Case A, N = 8. (C) Case K, N = 12.
The change of flow rate with injection time in each cluster is plotted in Figure 13. It can be seen that as the number of perforations decreases, the difference of received fracturing fluid by each fracture is smaller. When the perforation number of each cluster is 6, the total fluid volume percentage received by the fractures are 18.62%, 16.60%, 14.98%, 14.91%, 16.02%, and 18.87%, respectively (As shown in Figure 14). At this time, the flow rate obtained by each fracture within a stage is relatively close. However, the change range of the flow rate curves becomes larger with the increase of perforation number, and the flow rate obtained by each fracture differs a lot during all the injection process. Taking Case K as an example, the number of perforations for each cluster in this case is 12. According to the modeling results, the flow rates of Cluster 1 and Cluster 6 increase rapidly first and then decrease. Different from the simulation results of other cases, the flow rate obtained by these two fractures shows obvious differences due to the effect of wellbore friction. However, wellbore friction plays a small role in other cases. In Case K, the total fluid volume percentage received by the fractures are 24.07%, 18.69%, 7.51%, 9.91%, 13.95%, and 25.88%, respectively (As shown in Figure 14). The results show that increasing the number of perforations can significantly cause the more uneven distribution of flow rate.
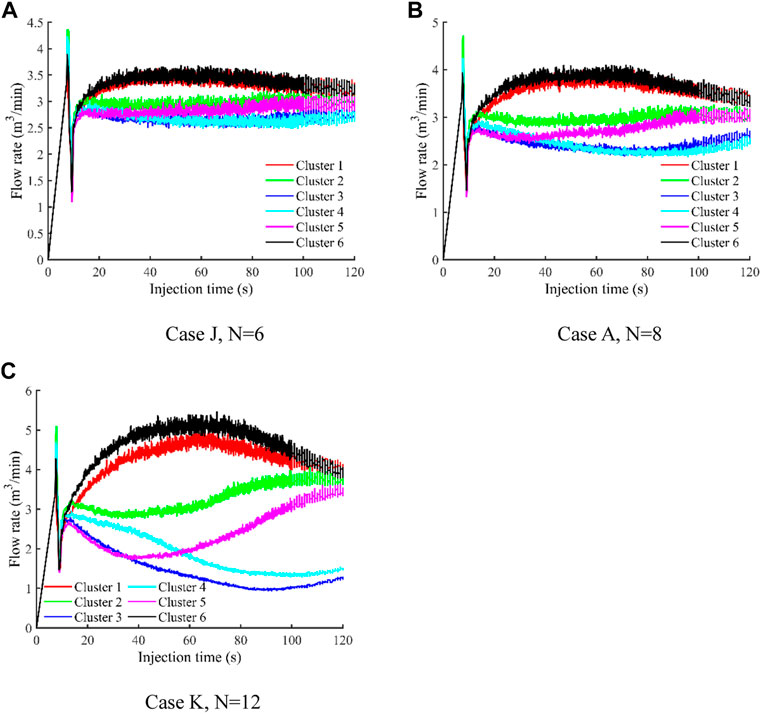
FIGURE 13. Flow rate into each cluster as a function of time for three cases with different perforation numbers. (A) Case J, N = 6. (B) Case A, N = 8. (C) Case K, N = 12.
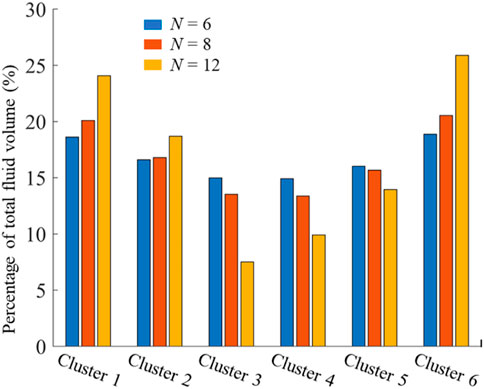
FIGURE 14. The total fluid volume distribution of each cluster for three cases with different perforation numbers.
4.3.3 Injection rate
In this section, the effect of injection rate on the multiple fracture propagation is investigated keeping other parameters constant. According to the theory of hydraulic fracture, increasing the injection rate will lead to a higher net pressure in the fractures, thus affecting the distribution of stress field near the wellbore and changing the geometries of fractures. In this paper, three cases with different injection rates are investigated. The injection rates are 6 m3/min, 12 m3/min, and 18 m3/min, respectively. Figure 15 illustrates the fracture morphologies under three different injection rates. The results show that the fracture uniformity within a stage increases with an increase in injection rate, especially compared the case L and case M. When the injection rate is 6 m3/min, the length and width of the outer two fractures are obviously larger than those of the interior fractures, showing remarkable difference of geometric sizes between the outer and interior fractures. For the interior fractures, three of them hardly propagate forward after the initiation, which are greatly restricted, and the other one (Cluster 4) only extends a short distance away the wellbore. When the injection rate increases to 12 m3/min, the fracture length is more evenly distributed. In the case, the width of interior fractures is increased a lot. The comparison between Case M and Case A shows that the fracture length slightly increases, but the width of the middle two fractures is much higher with the increase of injection rate from 12 m3/min to 18 m3/min. In a word, the injection rate has a very significant impact on multiple fracture propagation, and it is beneficial to promote the uniform growth of fractures within a stage by increasing the injection rate.
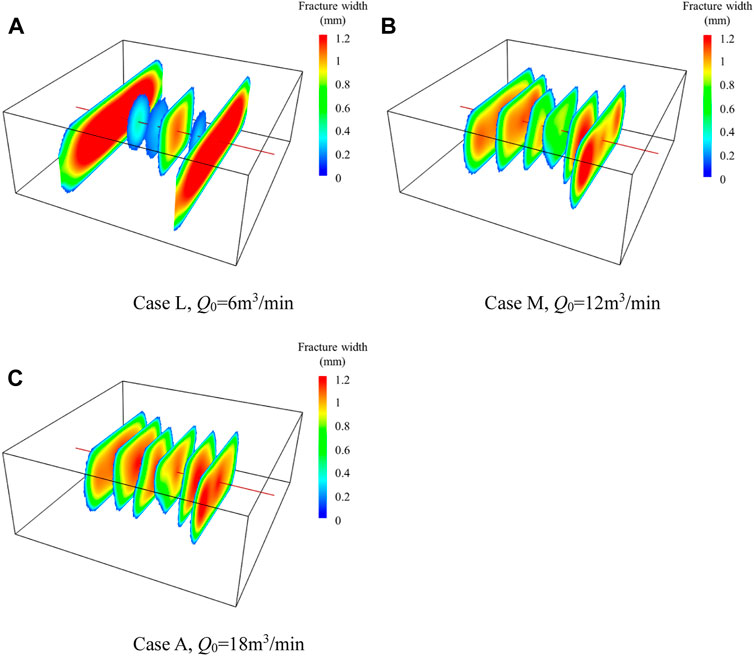
FIGURE 15. Fracture morphology for three cases with different injection rates. (A) Case L, Q0 = 6 m3/min. (B) Case M, Q0=12 m3/min. (C) Case A, Q0 = 18 m3/min.
The change of flow rate with injection time in each cluster is plotted in Figure 16. It can be seen that when the injection rate is 6 m3/min, the outer two fracture always receive much more fluid during all the injection process even if the curves of flow rate have a slight downward trend at the final stage. However, only a small proportion of fluid flow into the interior four fractures. The flow rate of three of the four fractures rapidly decreases to nearly zero, which indicates that there will be almost no fluid entering these fractures at that time. However, another fracture (Cluster 4) is less inhibited, and the flow rate is relatively stable at the initial stage and gradually increases at the later. Comparing Cases L, M, and A, it can be seen that much more fluid is received by the interior fractures with the increase of injection rate, and the difference between the shape of each flow rate curve decreases. The results show that the stress interference is weaker under higher injection rate.
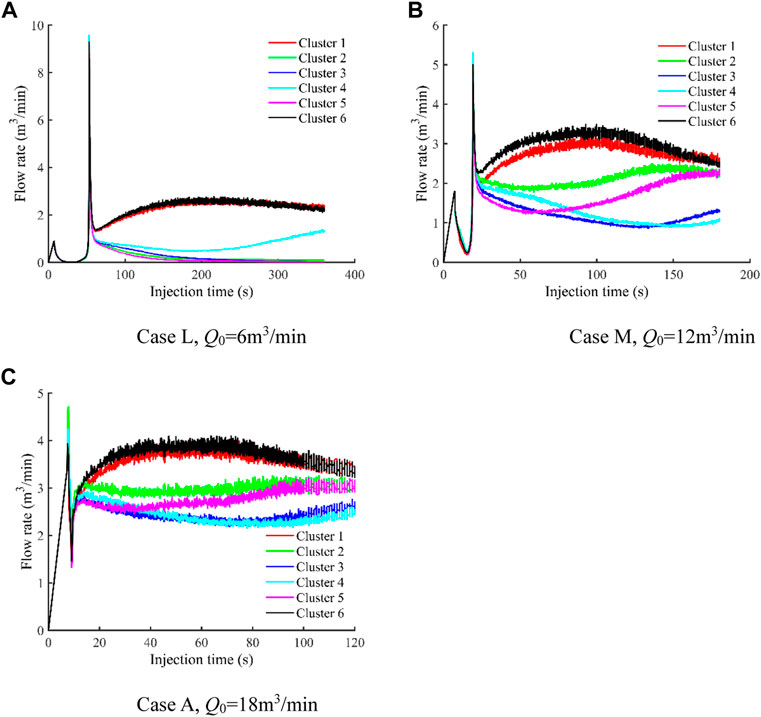
FIGURE 16. Flow rate into each cluster as a function of time for three cases with different injection rates. (A) Case L, Q0 = 6 m3/min. (B) Case M, Q0 = 12 m3/min. (C) Case A, Q0 = 18 m3/min.
The total fluid volume distribution of each cluster for the three different cases is shown in Figure 17. It can be seen that the fluid flows into each fracture more evenly with the increase of injection rate. When the injection rate is 6 m3/min, the percentage of total fluid volume into different fractures are 37.99%, 3.99%, 4.16%, 12.55%, 2.83%, and 38.50%, respectively. The results indicate that the proportion of flow rate of different fractures varies greatly. When the injection rate reaches 12 m3/min, the percentage of total fluid volume into different fractures are 23.10%, 17.88%, 9.65%, 10.28%, 14.30%, 24.79%, respectively. This demonstrates that fluid received by the interior inhibited fractures is significantly improved by increasing the injection rate from 6 m3/min to 12 m3/min, showing increasing injection rate is one of effective measures to improve the uniformity of multiple fracture growth. In addition, the fluid received by the interior fractures can be further increased with the increase of injection rate from 12 m3/min to 18 m3/min. The results show that increasing the injection rate can not only improve the fracture geometries, but also effectively adjust the flow rate received by the fractures. Therefore, the injection rate should be increased as much as possible within the limit of treatment equipment.
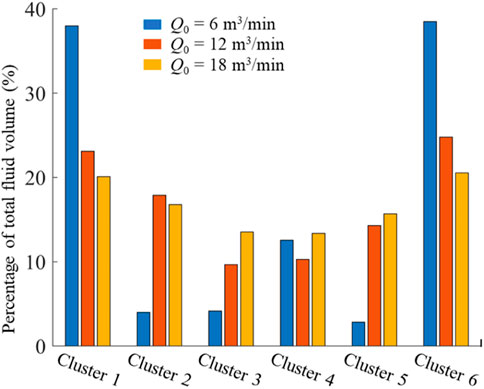
FIGURE 17. The total fluid volume distribution of each cluster for three cases with different injection rates.
4.3.4 Fracturing fluid viscosity
In this section, three cases with different fracturing fluid viscosities are investigated, and the fluid viscosities are 5 cP, 30 cP, and 100 cP, respectively. Figure 18 illustrates the fracture morphologies under three different fracturing fluid viscosities. The results show that the fracture geometry is greatly affected by the fluid viscosity. It can be seen that the increase of fluid viscosity will inhibit the hydraulic fracture to propagate along the direction of the maximum principal stress to a certain extent. However, the fracture width of each fracture is significantly expanded with the increase of fluid viscosity. Comparing Case A and Case N, the length of each fracture decreases in some extent when the fluid viscosity increases from 5 cP to 30 cP. Except that the width of the middle two fractures has hardly changed, the width of the other four fractures increases. Comparing Case N and Case O, the fracture length of each fracture is only slightly decreased when the fluid viscosity increases from 30 cP to 100 cP. The width of the outer four fractures increases largely. However, the width of the middle two fractures only increases a little. By comparison, the generated multiple fractures are more uniform under lower fracturing fluid viscosity. For low-permeability shale reservoirs, the main target is to create long fractures rather than increase conductivity. Therefore, fracturing fluid with lower viscosity is conducive to increase fracture length and multiple fracture uniformity in shale reservoirs, so high injection rate needs to be adopted to increase proppant carrying capacity.
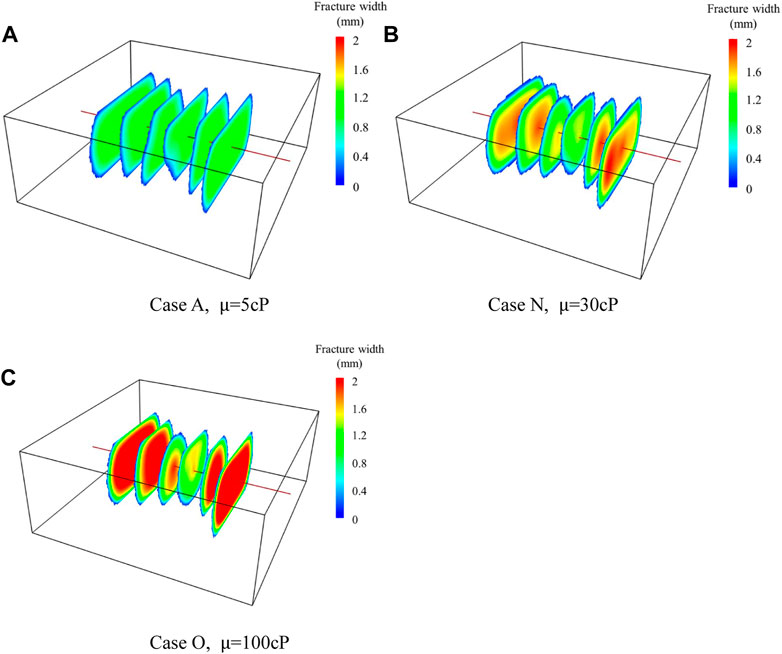
FIGURE 18. Fracture morphology for three cases with different fracturing fluid viscosity. (A) Case A,
The change of flow rate with injection time in each cluster is plotted in Figure 19. The results show that the difference of dynamic flow rate between the fractures increases with the increase of fracturing fluid viscosity. When the fracturing fluid viscosity increases, the proportion of fracturing fluid obtained by the middle two fractures decreases continuously. The total fluid volume distribution of each fracture for the three different cases is shown in Figure 20. It can be seen that when the fluid viscosity is 5 cP, the percentage of total fluid volume into different fractures are 20.09%, 16.79%, 13.53%, 13.37%, 15.68%, and 20.54%, respectively. When the fluid viscosity reaches 100 cP, the percentage of total fluid volume into different fractures are 23.50%, 17.38%, 9.69%, 10.69%, 13.32%, and 25.40%, respectively. This demonstrates that the outer fractures receive more fluid and the interior fractures receive less fluid with the increase of fracturing fluid viscosity. The results indicate that increasing the viscosity of fracturing fluid will aggravate the stress interference and increase the difference of geometric size between different fractures.
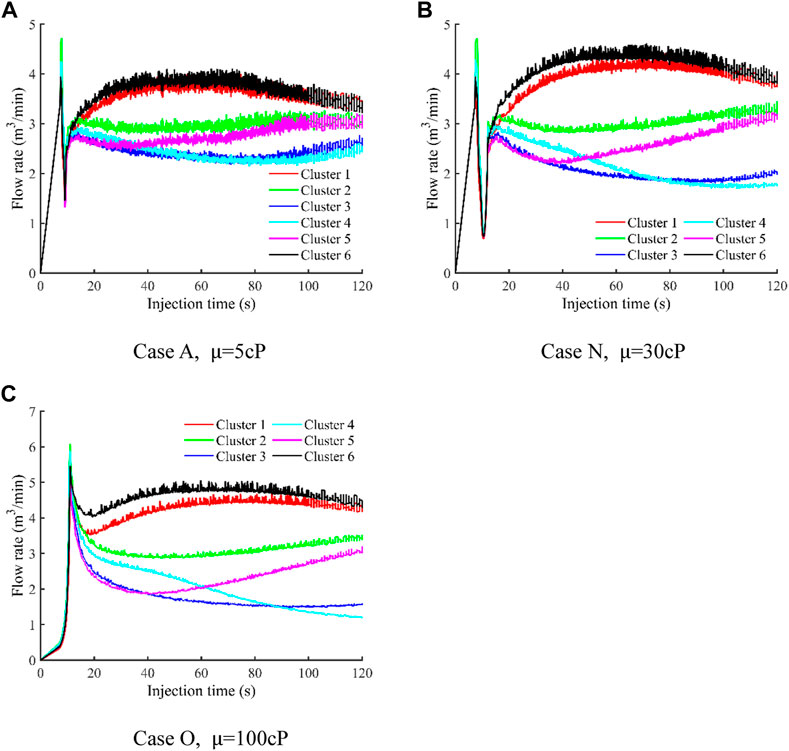
FIGURE 19. Flow rate into each cluster as a function of time for three cases with different fracturing fluid viscosity. (A) Case A,
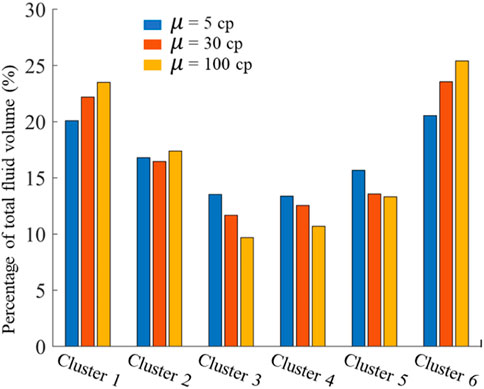
FIGURE 20. The total fluid volume distribution of each cluster for three cases with different fracturing fluid viscosity.
5 Conclusion
The block discrete element method (BDEM) is used to establish a 3D multi-cluster fracturing model of a horizontal well. The effects of various geologic and engineering parameters on the multiple simultaneous fracture propagation within a stage were studied. The suggestions to improve the fracture geometries were proposed according to the modeling results. The main conclusions are as follows:
1) The geometry of each fracture within a stage is different, and the outer fractures generally receive more fracturing fluid than the interior fractures, resulting in the length and width of the outer fracture are generally larger than that of the interior fractures. According to the modeling results, the vertical stress almost has no effect on the geometries of multiple fractures, and higher horizontal stress difference is beneficial to the uniform propagation of multiple fractures, and the width of the middle two fractures is improved with the increase of horizontal stress difference. The existence of bedding planes will aggravate the stress interference effect and decrease the width of the middle two fractures. The activation and propagation along the bedding planes will increase the fluid filtration, resulting in a reduction in hydraulic fracture length.
2) Increasing the cluster spacing can effectively promote the propagation of each fracture, and the inhibition on the interior fractures can be reduced. The difference of received fluid between different fractures decreases with the increase of cluster spacing due to weaker stress interference. The difference of geometry of each fracture becomes smaller with the decrease of perforation number due to effect of limited entry perforation. With the increase of the fracturing fluid viscosity, the fracture length decreases to a certain extent and the fracture width increases significantly. At this time, the squeezing effect of the outer fractures on the middle fractures increases, and the flow rate distribution is much more uneven.
3) For shale reservoirs with bedding planes, a large amount of fracturing fluid should be injected to ensure the propagation of hydraulic fractures and the activation of bedding planes. It is necessary to use the proppant with smaller size to support the bedding planes. Only increasing cluster spacing is not the primary method to promote uniform propagation of multiple fractures because the seepage distance is farther. Reducing the number of perforations is conducive to the even distribution of flow rates, but causing higher treatment pressure. Therefore, cluster spacing and perforation number should be controlled in an appropriate range according to reservoir properties. On the other hand, increasing the injection rate and reducing the viscosity of fracturing fluid are important means to improve the geometry of each fracture.
Data availability statement
The original contributions presented in the study are included in the article/supplementary material, further inquiries can be directed to the corresponding author.
Author contributions
RH: Investigation, Writing—original draft. JY: Writing—review and editing. LL: Visualization, Writing—review and editing. ZY: Writing—Reviewing and Editing. WC: Writing—original draft. JZ: Writing—review and editing. XL: Validation. LH: Writing—original draft, Conceptualization, Supervision.
Funding
The authors acknowledge the support provided by the National Natural Science Foundation of China (Grant No. 42002271 and 42202314), and natural science starting project of SWPU (No. 2022QHZ009), and Open Research Fund of State Key Laboratory of Geomechanics and Geotechnical Engineering, Institute of Rock and Soil Mechanics, Chinese Academy of Sciences (Grant No. Z020009).
Conflict of interest
Authors RH, JY, LL, WC, and JZ were employed in the company PetroChina Southwest Oil and Gasfield Company.
The remaining authors declare that the research was conducted in the absence of any commercial or financial relationships that could be construed as a potential conflict of interest.
Publisher’s note
All claims expressed in this article are solely those of the authors and do not necessarily represent those of their affiliated organizations, or those of the publisher, the editors and the reviewers. Any product that may be evaluated in this article, or claim that may be made by its manufacturer, is not guaranteed or endorsed by the publisher.
References
Barree, R. (1983). “A practical numerical simulator for three-dimensional fracture propagation in heterogenous media,” in Paper presented at the Reservoir Simulation Symposium, San Francisco, USA, November 1983 (One Petro).
Bunger, A. P., Jeffrey, R. G., Kear, J., and Zhang, X. (2011). “Experimental investigation of the interaction among closely spaced hydraulic fractures,” in Paper presented at the 45th US Rock Mechanics/Geomechanics Symposium, San Francisco, USA, June 2011 (One Petro).
Crouch, S. L. (1976). Solution of plane elasticity problems by the displacement discontinuity method. I. Infinite body solution. Int. J. Numer. Methods Eng. 10, 301–343. doi:10.1002/nme.1620100206
Crump, J. B., and Conway, M. W. (1988). Effects of perforation-entry friction on bottomhole treating analysis. J. Petroleum Technol. 40 (8), 1041–1048. doi:10.2118/15474-pa
Cundall, P. A. (1971). “A computer model for simulating progressive, large-scale movements in blocky rock systems,” in Paper presented at the Symposium of International Society of Rock Mechanics, Nancy, France (One Petro).
Dontsov, E. V. (2016). An approximate solution for a penny-shaped hydraulic fracture that accounts for fracture toughness, fluid viscosity and leak-off. R. Soc. open Sci. 3 (12), 160737. doi:10.1098/rsos.160737
Dou, F., and Wang, J. (2022). A numerical investigation for the impacts of shale matrix heterogeneity on hydraulic fracturing with a two-dimensional particle assemblage simulation model. J. Nat. Gas Sci. Eng. 104, 104678. doi:10.1016/j.jngse.2022.104678
Guo, X., Cheng, M., Zhang, J., Li, H., and Li, Y. (2022). Numerical simulation study of hole erosion under directional perforating conditions. Xinjiang Oil & Gas 18 (4), 56–61.
He, R., Yang, Z., Li, X., Liu, C., Sun, Z., and Li, W. (2020). Numerical investigation of interaction between hydraulic and natural fractures under various geologic and engineering parameters using particle flow code method. Energy Sources, Part A Recovery, Util. Environ. Eff., 1757790. doi:10.1080/15567036.2020.1757790
Huang, L., Liu, J., Ji, Y., Gong, X., and Qin, L. (2018). A review of multiscale expansion of low permeability reservoir cracks. Petroleum 4 (2), 115–125. doi:10.1016/j.petlm.2017.09.002
Huang, L., Liu, J., Zhang, F., Donstov, E., and Damjanac, B. (2019). Exploring the influence of rock inherent heterogeneity and grain size on hydraulic fracturing using discrete element modeling. Int. J. Solids Struct. 176, 207–220. doi:10.1016/j.ijsolstr.2019.06.018
Huang, L., Liu, J., Zhang, F., Fu, H., Zhu, H., and Damjanac, B. (2020). 3D lattice modeling of hydraulic fracture initiation and near-wellbore propagation for different perforation models. J. Petroleum Sci. Eng. 191, 107169. doi:10.1016/j.petrol.2020.107169
Huang, L., Donstov, E., Fu, H., Lei, Y., Weng, D., and Zhang, F. (2022). Hydraulic fracture height growth in layered rocks: Perspective from DEM simulation of different propagation regimes. Int. J. Solids Struct. 238, 111395. doi:10.1016/j.ijsolstr.2021.111395
Huang, L., He, R., Yang, Z., Tan, P., Chen, W., Li, X., et al. (2023). Exploring hydraulic fracture behavior in glutenite formation with strong heterogeneity and variable lithology based on DEM simulation. Eng. Fract. Mech. 278, 109020. doi:10.1016/j.engfracmech.2022.109020
Ji, Y., Wang, Y., and Huang, L. (2015). Analysis on inflowing of the injecting water in faulted formation. Adv. Mech. Eng. 7 (6), 168781401559029–10. doi:10.1177/1687814015590294
Jin, Y., and Chen, K. (2019). Fundamental equations for primary fluid recovery from porous media. J. Fluid Mech. 860, 300–317. doi:10.1017/jfm.2018.874
Khristianovic, S., and Zheltov, Y. (1955). “Formation of vertical fractures by means of highly viscous fluids,” in Paper presented at 4th World Petroleum Congress, Rome, Italy, June 1955 (One Petro).
Li, S., Li, X., and Zhang, D. (2016). A fully coupled thermo-hydro-mechanical, three-dimensional model for hydraulic stimulation treatments. J. Nat. Gas Sci. Eng. 34, 64–84. doi:10.1016/j.jngse.2016.06.046
Li, X., Yi, L., Yang, Z., Liu, C., and Yuan, P. (2017). A coupling algorithm for simulating multiple hydraulic fracture propagation based on extended finite element method. Environ. Earth Sci. 76, 725. doi:10.1007/s12665-017-7092-9
Linkov, A. M., and Markov, N. S. (2020). Improved pseudo three-dimensional model for hydraulic fractures under stress contrast. Int. J. Rock Mech. Min. Sci. 130, 104316. doi:10.1016/j.ijrmms.2020.104316
Liu, N., Zhang, Z., Zou, Y., Ma, X., and Zhang, Y. (2018). Propagation law of hydraulic fractures during multi-staged horizontal well fracturing in a tight reservoir. Petroleum Explor. Dev. 45 (6), 1129–1138. doi:10.1016/s1876-3804(18)30116-2
Luo, H., Xie, J., Huang, L., Wu, J., Shi, X., Bai, Y., et al. (2022). Multiscale sensitivity analysis of hydraulic fracturing parameters based on dimensionless analysis method. Lithosphere 2022, 9708300. doi:10.2113/2022/9708300
Miller, C., Waters, G., and Rylander, E. (2011). “Evaluation of production log data from horizontal wells drilled in organic shales,” in Paper presented at the SPE North American Unconventional Gas Conference and Exhibition, Woodlands, USA, June 2011 (One Petro).
Palmer, I. D., Roberts, O., and Carroll, H. B. (1983). “Numerical solution for height and elongated hydraulic fractures,” in Paper presented at the 1983 SPE/DOE Symposium on Low Permeability, Denver, USA, March 1983 (One Petro).
Peirce, A., and Bunger, A. P. (2014). Interference fracturing: Nonuniform distributions of perforation clusters that promote simultaneous growth of multiple hydraulic fractures. SPE J. 20 (2), 384–395. doi:10.2118/172500-pa
Sesetty, V., and Ghassemi, A. (2015). A numerical study of sequential and simultaneous hydraulic fracturing in single and multi-lateral horizontal wells. J. Petroleum Sci. Eng. 132, 65–76. doi:10.1016/j.petrol.2015.04.020
Settari, A., and Cleary, M. P. (1986). Development and testing of a pseudo-three-dimensional model of hydraulic fracture geometry. SPE Prod. Eng. 1 (6), 449–466. doi:10.2118/10505-pa
Shi, F., Wang, X., Liu, C., Liu, H., and Wu, H. (2016). A coupled extended finite element approach for modeling hydraulic fracturing in consideration of proppant. J. Nat. Gas Sci. Eng. 33, 885–897. doi:10.1016/j.jngse.2016.06.031
Somanchi, K., Brewer, J., and Reynolds, A. (2017). “Extreme limited entry design improves distribution efficiency in plug-n-perf completions: Insights from fiber-optic diagnostics,” in Paper presented at the SPE Hydraulic Fracturing Technology Conference and Exhibition, Woodlands, USA, January 2017 (One Petro).
Song, R., Wang, Y., Sun, S., and Liu, J. (2021). Characterization and microfabrication of natural porous rocks: From micro-CT imaging and digital rock modelling to micro-3D-printed rock analogs. J. Petroleum Sci. Eng. 205, 108827. doi:10.1016/j.petrol.2021.108827
Tan, P., Jin, Y., Han, K., Hou, B., Chen, M., Guo, X., et al. (2017). Analysis of hydraulic fracture initiation and vertical propagation behavior in laminated shale formation. Fuel 206, 482–493. doi:10.1016/j.fuel.2017.05.033
Tan, P., Pang, H., Zhang, R., Jin, Y., Zhou, Y., Kao, J., et al. (2020). Experimental investigation into hydraulic fracture geometry and proppant migration characteristics for southeastern Sichuan deep shale reservoirs. J. Petroleum Sci. Eng. 184, 106517. doi:10.1016/j.petrol.2019.106517
Tan, P., Jin, Y., and Pang, H. (2021). Hydraulic fracture vertical propagation behavior in transversely isotropic layered shale formation with transition zone using XFEM-based CZM method. Eng. Fract. Mech. 248, 107707. doi:10.1016/j.engfracmech.2021.107707
Tang, H., Winterfeld, P., Wu, Y., Huang, Z., Di, Y., Pan, Z., et al. (2016). Integrated simulation of multi-stage hydraulic fracturing in unconventional reservoirs. J. Nat. Gas Sci. Eng. 36, 875–892. doi:10.1016/j.jngse.2016.11.018
Tang, H., Wang, S., Zhang, R., Li, S., Zhang, L., and Wu, Y. (2019). Analysis of stress interference among multiple hydraulic fractures using a fully three-dimensional displacement discontinuity method. J. Petroleum Sci. Eng. 179, 378–393. doi:10.1016/j.petrol.2019.04.050
Wang, Y., Song, R., Liu, J., Cui, M., and Ranjith, P. G. (2019). Pore scale investigation on scaling-up micro-macro capillary number and wettability on trapping and mobilization of residual fluid. J. Contam. Hydrology 225, 103499. doi:10.1016/j.jconhyd.2019.103499
Wang, Y., Zhu, C., He, M., Wang, X., and Le, H. (2022). Macro-meso dynamic fracture behaviors of xinjiang marble exposed to freeze thaw and frequent impact disturbance loads: A lab-scale testing. Geomechanics Geophys. Geo-Energy Geo-Resources 8 (5), 154. doi:10.1007/s40948-022-00472-5
Wang, H., Li, H., Tang, L., Ren, X., Meng, Q., and Zhu, C. (2022). Fracture of two three-dimensional parallel internal cracks in brittle solid under ultrasonic fracturing. J. Rock Mech. Geotechnical Eng. 14 (3), 757–769. doi:10.1016/j.jrmge.2021.11.002
Wu, K., and Olson, J. E. (2013). Investigation of the impact of fracture spacing and fluid properties for interfering simultaneously or sequentially generated hydraulic fractures. SPE Prod. Operations 28 (4), 427–436. doi:10.2118/163821-pa
Wu, K., and Olson, J. E. (2016). Mechanisms of simultaneous hydraulic-fracture propagation from multiple perforation clusters in horizontal wells. SPE J. 21 (3), 1000–1008. doi:10.2118/178925-pa
Yang, Z., Yi, L., Li, X., and He, W. (2018). Pseudo-three-dimensional numerical model and investigation of multi-cluster fracturing within a stage in a horizontal well. J. Petroleum Sci. Eng. 162, 190–213. doi:10.1016/j.petrol.2017.12.034
Yin, Z., Huang, H., Zhang, F., Zhang, L., and Maxwell, S. (2020). Three-dimensional distinct element modeling of fault reactivation and induced seismicity due to hydraulic fracturing injection and backflow. Geotech. Eng. 12, 752–767. doi:10.1016/j.jrmge.2019.12.009
Zhang, F., and Dontsov, E. (2018). Modeling hydraulic fracture propagation and proppant transport in a two-layer formation with stress drop. Eng. Fract. Mech. 199, 705–720. doi:10.1016/j.engfracmech.2018.07.008
Zhang, F., Dontsov, E., and Mack, M. (2017). Fully coupled simulation of a hydraulic fracture interacting with natural fractures with a hybrid discrete-continuum method. Int. J. Numer. Anal. Methods Geomechanics 41 (13), 1430–1452. doi:10.1002/nag.2682
Zhang, S., Chen, M., Ma, X., Zou, Y., and Guo, T. (2021). Research progress and development direction of hydrofracturing design models. Xinjiang Oil & Gas 17 (3), 67–73.
Zhang, F., Huang, L., Yang, L., Dontsov, E., Weng, D., Liang, H., et al. (2022). Numerical investigation on the effect of depletion-induced stress reorientation on infill well hydraulic fracture propagation. Petroleum Sci. 19 (1), 296–308. doi:10.1016/j.petsci.2021.09.014
Zhao, J., Chen, X., Li, Y., and Fu, B. (2016). Simulation of simultaneous propagation of multiple hydraulic fractures in horizontal wells. J. Petroleum Sci. Eng. 147, 788–800. doi:10.1016/j.petrol.2016.09.021
Zheng, Y., He, R., Huang, L., Bai, Y., Wang, C., Chen, W., et al. (2022). Exploring the effect of engineering parameters on the penetration of hydraulic fractures through bedding planes in different propagation regimes. Comput. Geotechnics 146, 104736. doi:10.1016/j.compgeo.2022.104736
Zhou, Y., and Yang, D. (2022). A fast simulation method for hydraulic-fracture-network generation in fractured rock based on fully coupled XFEM. Comput. Geotechnics 150, 104892. doi:10.1016/j.compgeo.2022.104892
Keywords: shale, horizontal well fracturing, multi-fracture propagation, 3D block discrete element method, fracture morphology
Citation: He R, Yang J, Li L, Yang Z, Chen W, Zeng J, Liao X and Huang L (2023) Investigating the simultaneous fracture propagation from multiple perforation clusters in horizontal wells using 3D block discrete element method. Front. Earth Sci. 11:1115054. doi: 10.3389/feart.2023.1115054
Received: 03 December 2022; Accepted: 06 January 2023;
Published: 20 January 2023.
Edited by:
Peng Tan, CNPC Engineering Technology R&D Company Limited, ChinaCopyright © 2023 He, Yang, Li, Yang, Chen, Zeng, Liao and Huang. This is an open-access article distributed under the terms of the Creative Commons Attribution License (CC BY). The use, distribution or reproduction in other forums is permitted, provided the original author(s) and the copyright owner(s) are credited and that the original publication in this journal is cited, in accordance with accepted academic practice. No use, distribution or reproduction is permitted which does not comply with these terms.
*Correspondence: Liuke Huang, c3dwdWhsa0AxMjYuY29t