 Jianjun Dong
 Zhengquan Xie1,2
- 1College of Safety Science and Engineering, Liaoning Technical University, Huludao, China
- 2Key Laboratory of Mine Thermodynamic Disasters and Control of Ministry of Education, Liaoning Technical University, Huludao, China
Introduction: In the coal mining process, the intense mining pressure is an important factor hindering the safe and efficient production of the working face. In severe cases, it causes deformations in roadways such as roof breakages and rockbursts, and leads to instability. This can result in the roof falling over a large area and the coal wall, thereby inducing dynamic disasters. These aspects have restricted the economic benefits of coal.
Methods: In this study, we set four model limitations based on the limited scope of action of the mining pressure itself and the quantitative relationships between mining pressures in different regions. A multiple linear regression model with these limitations is proposed for predicting the mining pressure for preventing roof breakages and rockbursts. Based on a hydraulic support monitoring dataset from a fully mechanized caving face of coal mining, the mining pressure prediction model is trained by using the first 70% of the dataset. And the linear regression coefficient of the model and the predicted value of the mining pressure are obtained. Then, the last 30% of the dataset was used for the validation of the model.
Results: The research results show that the constrained multiple linear regression model can achieve remarkable prediction results. According to predictions of tens of thousands of on-site mining pressure datasets, the predicted data and actual pressure data have the same change trend and maintain a low relative error.
Discussion: Therefore, after real-time mining pressure monitoring, the system obtains the roof pressure of the fully mechanized mining face. According to the dataset, the proposed prediction model algorithm quickly predicts the roof pressure value of the next mining section and effectively forewarns roof breakages and other accidents.
1 Introduction
The research on mining pressure predictions and mining pressure behavior laws has important theoretical guiding significance for coal mining enterprises in controlling dynamic pressure accidents, such as roof breakages and rock bursts (Hu et al., 2022; Miao et al., 2022). Therefore, monitoring and predicting the mining pressure is very important. Most mining pressure prediction techniques are realized by monitoring data and various parameters. Existing mining pressure prediction methods include the genetic algorithm-back propagation (GA-BP) neural network model and the Grey neural network model (Tan et al., 2019; Wang et al., 2022a). However, the existing mining pressure prediction methods employ relatively small amounts of prediction data and are based on a single data quantity. Moreover, the data of the existing mining pressure prediction methods have clear data characteristics, such as the mining pressure data at a certain position of the roadway or in a certain state of mining. Therefore, the scope of application is very narrow, and the applicability of the prediction effect is poor. Accordingly, a new multiple regression method for working face mining pressure is proposed in this paper based on a hydraulic support monitoring dataset. The method relies on a massive set of on-site mining pressure monitoring values. Combined with a statistical multiple linear regression equation, a feasible prediction model is established for a wide range of applications.
In addition, owing to the continuous improvement of the requirements for underground safety production, predicting the dangerous factors in the field can effectively achieve the purpose of safe production. Ren et al. (2018) established a predictive model for the scope of caved rock zones (CRZs) concerning the varying laws of lateral pressure and forecasted the CRZ scope using a caving mining method. Based on modified parameters in a traditional probability integral model, (Russ et al., 2022) established a subsidence prediction model.
Many scholars have been conducting in-depth research on various types of predictions in recent years; as such, there is a significant amount of research on various types of pressure prediction methods. Nie et al. (2019) team developed a straightforward and effective calibration-based gas pressure model for a spatiotemporal prediction of CO2 in a coal matrix. Mei et al. (2022) used a natural gradient boosting algorithm to establish a unified probabilistic prediction model for the bond strengths of steel bars and concrete under high temperatures while considering several key factors. Aiming to construct a pressure prediction method for boiling liquid expanding vapor explosions (BLEVEs), the latest research on BLEVE stress predictions has used multiple key parameters to establish an empirical relational formula to predict the BLEVE stress (Wang et al., 2022b). Zheng et al. (2021) used the time series approximation ability of a long short-term memory (LSTM) to construct a shutdown pressure prediction model and incorporated scientific principles and theories into their LSTM. Subsequently, a theory-guided LSTM was proposed for pipeline shutdown pressure predictions. Arshad et al. (2021) combined machine learning and statistical methods to establish a variety of prediction models for predicting the minimum ignition temperature of iron dust. Wang et al. (2019a) established a multivariate non-linear regression mathematical model using multiple influencing factors to predict the Sauter mean diameter. Li and Hao, (2018) adopted a computational fluid dynamics model prediction method combining a flame acceleration simulator simulation and ANSYS Fluent simulation, demonstrating high accuracy in far-field overpressure predictions. Weng and German Paal, (2022) proposed a new machine learning-based wind pressure prediction model for low-rise non-isolated buildings. As the pressure in the transition ladle during the manufacturing of amorphous alloys could be influenced by numerous factors, (Liu et al., 2022) employed a backpropagation (BP) neural network to ensure the prediction of the transition ladle pressure during the production of amorphous alloys. Kim et al. (2021) team used the data attribution ability of a machine learning model to predict the missing wind pressure data of tall buildings and proposed a generative adversarial imputation network for predicting the pressure coefficients on tall buildings at various instantaneous time intervals.
Thus, there is significant research on numerical predictions for various aspects of pressure forecasting. However, the limited number of datasets used for most pressure forecasting results leads to certain limitations. For example, if the capacity of the original monitoring or test dataset is small, the application scope of the predicted values is limited and narrow, and real-time predictions and effective early warnings cannot be achieved. Accordingly, considering the random, disordered, non-uniform, discontinuous, and other complex characteristics of a mining pressure distribution affected by the geological and production environments, this study is based on a massive dataset acquired by monitoring hydraulic supports. A mathematical model for an actual mining pressure field is established based on the massive monitoring dataset using machine learning, and high-accuracy predictions are achieved through model training and verification.
Existing research on the pressure distribution law of a fully mechanized mining face provides the basis for the multiple linear regression model used in this study. Dang et al. (2021) used a numerical simulation to determine that the pressure distribution of hydraulic support in a simulated stope was rough “Λ” in the middle and both sides of the stope. Wang et al. (2015) analyzed the distribution characteristics of the pressure arch of a horizontal layered rock mass in the process of coal seam mining and concluded that the lateral pressure coefficient had a significant influence on the pressure arch. Wang et al. (2019b) established mechanical models for a symmetrical compression arch and concluded that upper broken rocks formed a symmetrical pressure arch in the near-field, and a far-field pressure arch formed in the mining field.
The prediction technique employed in this study is based on machine learning. The existing popular research methods in machine learning include the GA-BP neural network model, Grey neural network model, BP neural network, extreme learning machine, support vector machine, artificial neural network, grid search algorithm, a gradient boosting decision tree, and generative time intervals imputation network (Huang et al., 2019; Tan et al., 2019; Arshad et al., 2021; Kim et al., 2021; Wang et al., 2022a; Liu et al., 2022; Weng and German Paal, 2022). However, the existing prediction methods are only applicable to data features with a single data quantity or evident data characteristic. In contrast, we combine machine learning with mathematical statistical algorithms to provide predictions of mining pressure based on a massive dataset. The main purpose of this study is to establish a prediction model for the actual mining pressure on-site and to use the monitoring dataset of a fully mechanized caving face of a coal mine currently being mined for model training and verification, so as to assist in enabling the safe and smooth mining of this face. Descriptive statistics analyses are performed on the current monitoring data of the fully mechanized caving face in the coal mine. According to the massive dataset concerning the mining pressure and multiple linear regression model, a new multiple linear regression model with constraints is proposed as the mining pressure prediction model. Taking the mining pressure monitoring data of the fully mechanized caving face of a coal mine as a practical application scenario, the prediction effect of the model is tested and evaluated.
2 Field experimental
2.1 Monitoring scheme
In this study, the mining pressure of the 42,203 fully mechanized caving face of the Buertai Coal mine was monitored by a dynamic real-time monitoring system. Owing to the advancing of the roadway working face in the coal mine, hydraulic supports were installed on the 320-m distance of the fully mechanized mining face to support the roof every 1.95 m. The hydraulic supports were successively numbered. In the monitoring scheme, hydraulic supports were connected to a mining pressure monitoring extension. Then, through the collection and transmission of the data on the mining pressure monitoring extension, the summarized data was transmitted to a microcomputer. The working resistance of the hydraulic support was analyzed and treated in the control room. Based on the connected monitoring dataset of the mining pressure generator, the mining pressure conditions (such as the support resistance between the hydraulic pressure and initial support force) were monitored and analyzed, providing real-time monitoring data for the roof pressure in the coal mine roadway mining.
The actual excavation working face of the mining site is shown in Figure 1. A schematic diagram of the entire working face and the layout of the hydraulic supports are shown in Figure 2.

FIGURE 1. Excavation working face.
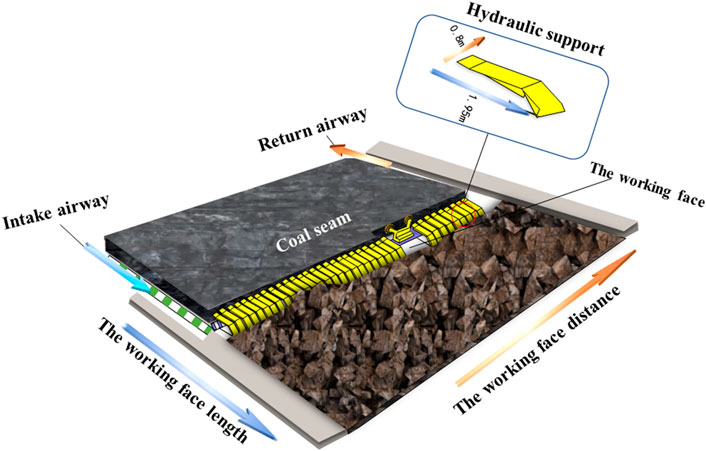
FIGURE 2. Schematic diagram of field data collection.
Figure 3 is a diagram for succinctly illustrating the formation of the coal mine roof pressure. With an increase in the mining influence degree of the working face, the hydraulic support resistance of the working face mainly comes from the joint action between the key layer structure of the overlying roof and the multiple groups of combined cantilever beam structure; at this time, the working face generally shows a strong mining pressure (Liu et al., 2015). The obtained mining pressure monitoring dataset comprises the data of the working face in the mining, which has an annual coal output of 10 million tons. The length of the entire site’s fully mechanized mining face is 320 m, and the advancing distance is 4,485.2 m. The ground elevation ranges from 1,251.9 to 1,346.7 m, the floor elevation ranges from 897.42 to 948.74 m, and the acreage is 1.4353 million m2. Through the real-time collection, transmission, analysis, and prediction of roadway hydraulic support monitoring data, the proposed prediction model can prevent roof breakages and rock bursts.
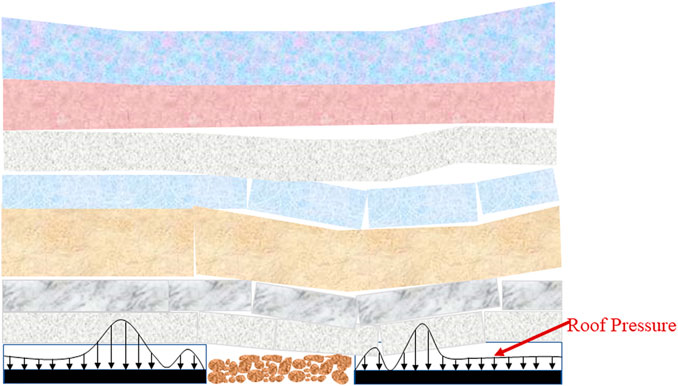
FIGURE 3. Diagram of mining roof pressure.
2.2 Descriptive statistics
Considering that in the process of coal mining, the rock strata movement is affected by the cumulative effects of the advancing direction of the working face and length of the working face, the mining pressure dataset uses the length and distance of the working face as the factors in each mining pressure value for the pressure prediction (Peng et al., 2022).
The monitoring data comprises the mining pressure monitoring data for the working face whose working face length ranges from 0 to 308.1 m; the advancing distance is within the range of 2,308.2 and 2,808.4 m. The dataset volume is 108,704 elements. The width of the bracket is 1.95 m and the depth of each coal cutting is 0.8 m. Thus, the value for each area is the average value of a rectangular area with a length of 1.95 m and a width of 0.8 m. In other words, every 1.95-m interval of the working face length is regarded as a section, and the entire working face length involved in the monitoring data is decomposed into 158 sections. Moreover, every 0.8 m of the working face advancing distance is regarded as a section, and the working face advancing distance is decomposed into 688 sections. The mining pressure data area is divided into 108,704 small rectangular areas that do not overlap with each other. The carriage moves along the advancing distance parallel to the working surface with each iteration.
Figures 4, 5 are the 3D colormap surface with a projection of the mining pressure monitoring dataset over the whole range, where the x-axis represents the length of the working face, the y-axis represents the distance of the working face, and the z-axis is the mining pressure value. According to Figures 4, 5, the entire data volume is massive, and the data regularity is disorderly. Nevertheless, to prevent the roadway supporting the roof from breaking, it is necessary to predict the mining pressure of the entire working face.
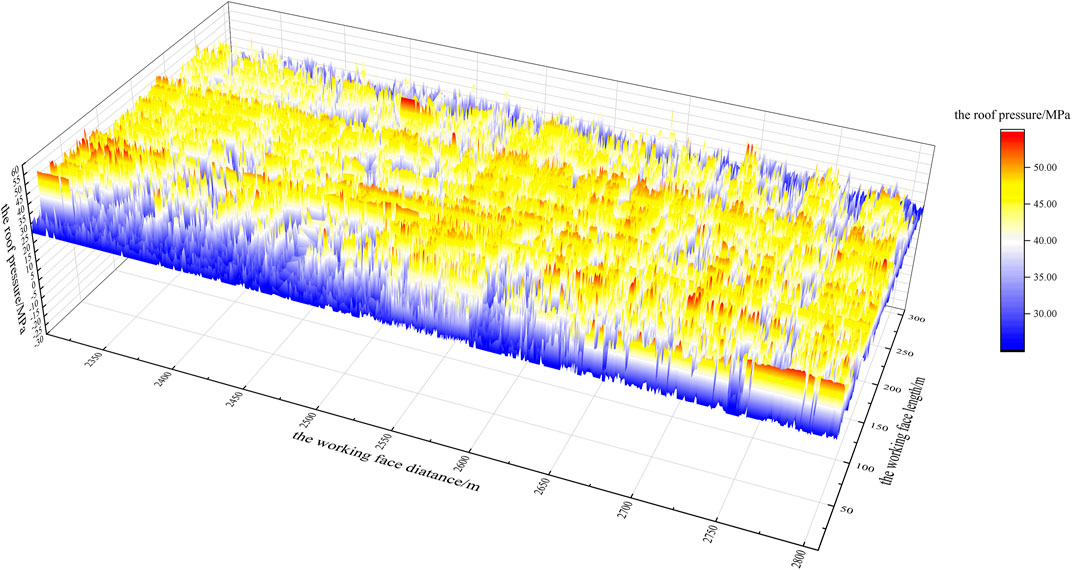
FIGURE 4. The surface portion of the 3D colormap surface with a projection of mining pressure.
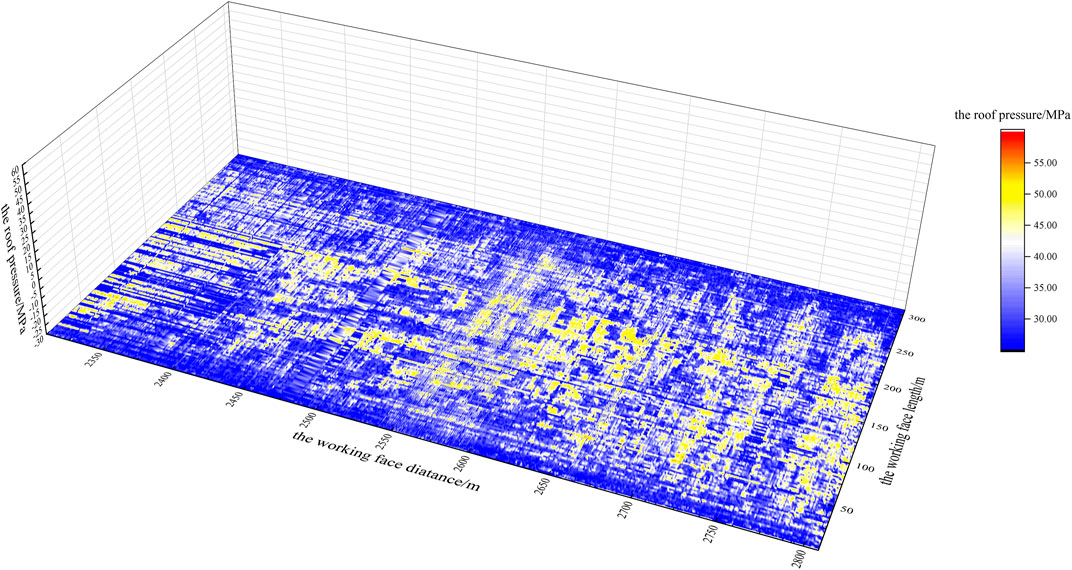
FIGURE 5. The mapping portion of the 3D colormap surface with a projection of mining pressure.
3 Algorithm
3.1 Fundamental theory
In the field of rock pressure prediction, multiple linear regression models are often used, as they are useful for predicting the rock pressure in a specified area with multiple mining pressures at different locations.
Below, X and Y denote the explanatory and response variables, respectively. α and β are the intercept and regression coefficients, respectively.
If there are n groups of observations {Yi, X1i, X2i, ..., Xki, i= 1∼n}, one common way to solve the model is to minimize the sum of squares of errors. If B denotes the model coefficient and M(B) denotes the sum of squares of errors, then the expression for M(B) is as follows:
3.2 Algorithm design
A mining pressure prediction is unique and differs from generalized prediction problems. For example, the independent variable should choose a regional mining pressure close to the prediction area, and the mining pressure farther away from the prediction area should have less influence on the predicted value. What’s more, the uniqueness of the problem of mining pressure prediction cannot be ignored. If only ordinary multiple linear regression models or other prediction models are used, it is possible to obtain completely inconsistent quantitative relationships between variables. This contradicts the theories of physics and geology, resulting in a model with a poor prediction effect.
Accordingly, by combining a multiple linear regression model combined with a hydraulic support monitoring dataset, a new constrained multiple linear regression model is proposed in this study for mining pressure predictions. The goal of this model is to predict the pressure in the next area along the direction parallel to the length of the working face from 320 to 0 m using the mining pressure data in the known area. The independent variable is the regional mining pressure closest to the area to be predicted, based on the two position indicators of the length and advancing distance of the working face.
The algorithm model is shown in Figure 6.
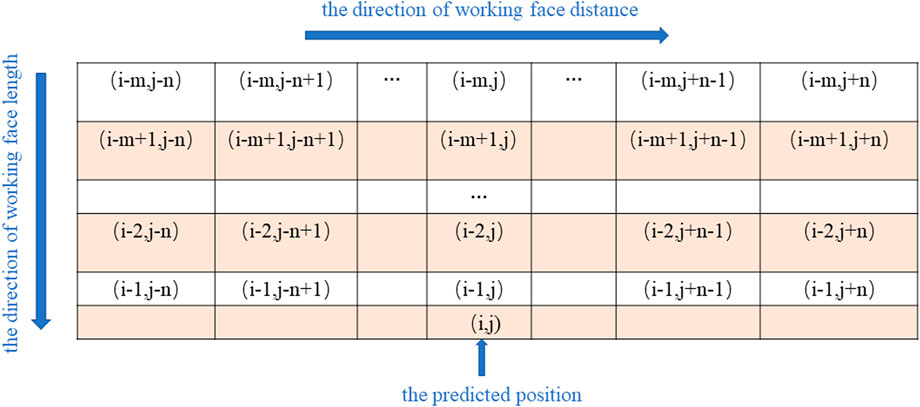
FIGURE 6. Prediction cycle algorithm model diagram.
According to the distribution law of mining pressure, the upper broken rocks form a symmetrical pressure arch in the near field (Wang et al., 2019b). Based on this, the prediction algorithm model can be established. As the exact shape of the pressure arch above the prediction point is uncertain, we set it as a rectangle, as shown in Figure 6.
The position coordinate of the area to be predicted is
The loss function of the mining pressure prediction model is set to the mean square error loss function as follows:
In the above, w is the total number of data.
To adapt to the mining pressure prediction application scenario, four restrictions are added to this model. Following the above notation, the coordinate of the area to be predicted is
Limitation 1:
Limitation 2:
Limitation 3:
Limitation 4:
The purpose of limitation 1 is to prevent overfitting while making the regression coefficient of the model more interpretable. The purpose of limitation 2 is to maintain a constant effect of the mining pressure on the point to be predicted. Limitation 2 is important because the upper broken rocks form a symmetrical pressure arch in the near field (Wang et al., 2019b). In addition, to make the mining pressure of the area to be predicted more determined by the mining pressure of the area close to it, we add limitations 3 and 4. From these, the mining pressure comprises two mining pressures in a symmetrical relationship centered on the advancing distance of the working face where the area to be predicted is located. In summary, the expression of the model is as follows:
Here, the model parameters
At the same time,
The algorithm of the prediction model is shown below.
Algorithm. of the multiple linear regression model.
Input:
X= (Xi−m,j−n, Xi−m,j−n+1, … …, Xi−1,j+n), a given mining pressure dataset
Output:
1:
2:
3: for all
4: result_infun0→
5: end for
6:
7: add limitations for
8: return
9: for all
10:
11: return
3.3 Discussion on accuracy
The mining pressure prediction model incorporates empirical knowledge regarding the quantitative relationships between regional mining pressures, including the practical selection of model-independent variables. Below, we compare the effects of different input variables of the model to identify the best selection range.
To more accurately evaluate the performance of the prediction model, it is decided to use the relative error
where,
The smaller the relative error
First of all, we select the range of the prediction model as the first five sections of the working face length, and the working face distance is advanced to the adjacent two ends. We use the prediction effect of this prediction model as a reference to determine the best prediction model.
Figures 7, 8 show the relative error of the prediction.
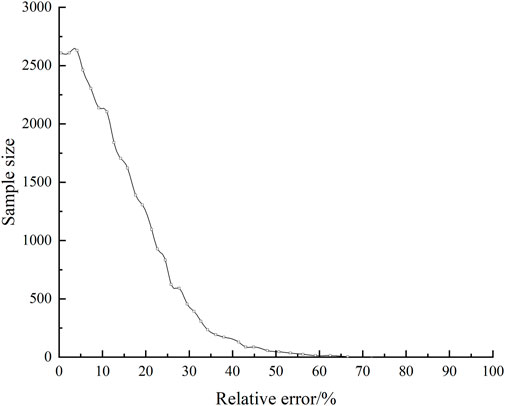
FIGURE 7. Relative error predicted by multivariate linear regression model with limitations.
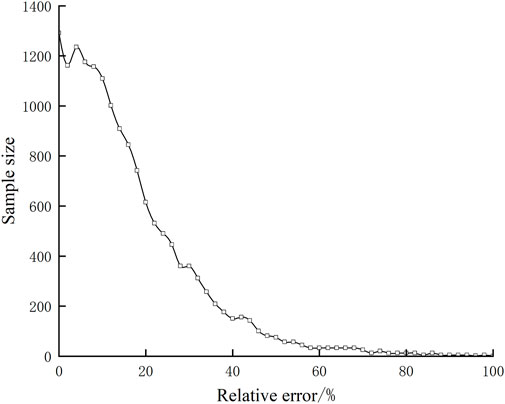
FIGURE 8. Prediction relative error of the independent variable in five adjacent sections of working face distance.
In Figure 7, the proportion of samples with a relative error of less than 30% is 92.73%. Then, it is necessary to determine how many sections of the mining pressure values in the adjacent area should be added to the prediction model at the advancing distance of the working face. The range of the advancing distance of the independent variable is expanded from the two sections of mining pressure adjacent to the two sides of the prediction area to five sections of mining pressure. Figure 8 shows the relative error of the prediction, where the area with a relative error of less than 30% accounts for 86.0%.
As the input variables of the model are different for cases with five and two adjacent sections in the working face distance, respectively, the test set accounts for a small part of the difference. After the test set is unified, the proportion of samples whose relative errors are less than 30% of the original model is 86.0%, that is, the new independent variable range decreases the prediction effect. It is considered that the different mining pressures in the adjacent area on the advancing distance of the extended working face will not improve the prediction effect of the model.
Thereby, the model-independent variables should remain the regional mining pressures of the two adjacent sections on the advancing distance of the working face.
To determine the optimal amount of calculated data, it is necessary to determine the number of mine pressure values added to the prediction model along the working face length. In Figure 9, the independent variables are the differences in the proportions of the relative error of less than 30%, 20%, and 10%, respectively, from the first section to the 15th section in the length of the working face. Thus, Figure 9 shows the differences in the proportions of the areas with relative errors of less than 30%, 20%, and 10%, respectively.
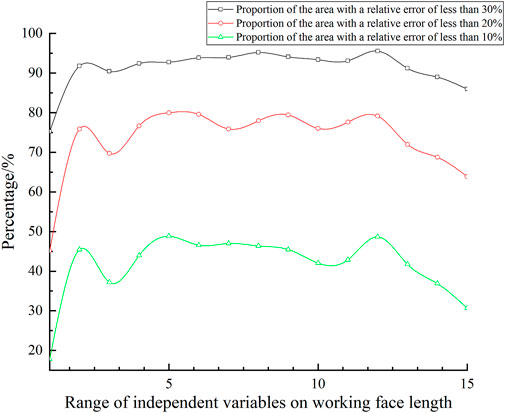
FIGURE 9. Prediction relative error of the independent variable.
According to Figures 9, 10, when the range of the independent variable is smaller than the first two sections of the working face length, the relative errors of less than 30%, 20%, and 10% account for a small proportion. When the range of the independent variable is from the first two to the first 13 sections of the working face length, the relative error of less than 30% accounts for more than 90%, and the highest is 95.56%. Meanwhile, the proportion of the relative error of less than 20% is close to 80%, and the proportion of the relative error of less than 10% is close to half of the number of samples. When the range of the independent variable exceeds the first 13 sections of the working face length, the proportions of the relative errors of prediction of less than 30%, 20%, and 10% begin to decrease. It can be seen that the accuracy of the prediction model is high within a certain range of the independent variables. Additionally, Figure 11 shows the mean absolute error (MAE) of the prediction model for the first 15 segments of the working face length. As can be seen from Figure 11, when the range of the independent variable is from the first two to the first 13 sections of the working face length, the MAE of the prediction model remains relatively stable. In particular, MAE is the smallest in the prediction model of the first five sections of the working face length. Moreover, when the range of the independent variable is from the first three to the first six sections, MAE is more stable.
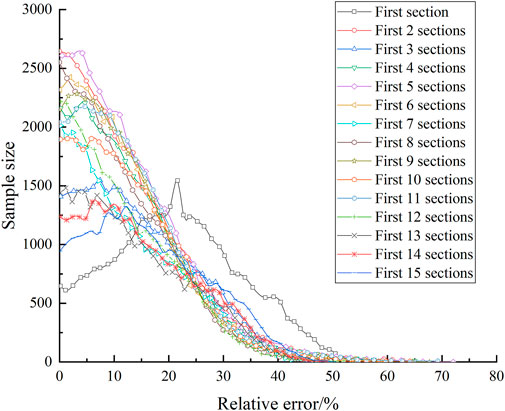
FIGURE 10. Relationship between prediction relative error of the independent variable and sample size.
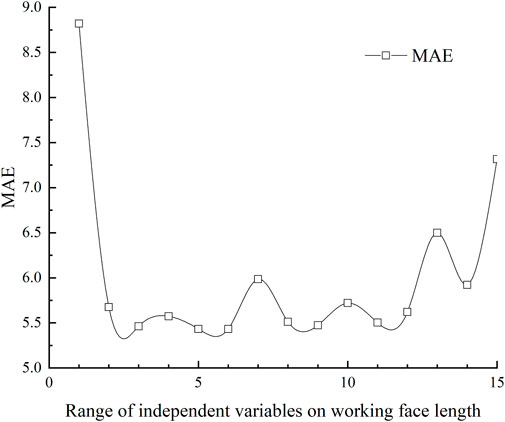
FIGURE 11. The MAE of all prediction models.
According to Figures 9–11, to select the optimal independent variable in the direction of the length of the working face, we consider the following factors:
(1) the number of samples with small relative errors is large.
(2) the percentages of the relative errors of less than 30%, 20%, and 10% are higher than those of other independent variables.
(3) MAE is relatively small and remains relatively stable within the range of its surrounding independent variables.
(4) the prediction performance of the peripheral independent variables of the optimal independent variables is also relatively good.
Therefore, by combining the above factors, the best independent variable range is the first five sections of the working face length and the two adjacent sections of the working face advance distance. The following forecast work is based on this. In actual application, this range can be appropriately reduced or expanded according to the actual situation.
4 Results analysis
The training set data of the constrained multiple linear regression model consists of the first 70% of the entire dataset, that is, the mining pressure values of a monitoring point whose working face length ranges from 2,308.2 to 2,648.7 m. The test set data consists of the last 30% of all of the data, that is, the mining pressure values of the monitoring point with the working face length ranging from 2,649.5 to 2,806.8 m.
For the selection of the independent variables of the model, the mining pressures in the first five sections (i.e., m = 5) in the working face length and the adjacent two sections (i.e., n = 2) in the advancing distance of the working face are employed. There are 25 (i.e., K=25) independent variables. Table 1 is the regression coefficient matrix obtained by the prediction model. Among them, I is the coordinate of the area on the working face length to be predicted, and J is the coordinate of the area on the advancing distance of the working face to be predicted.
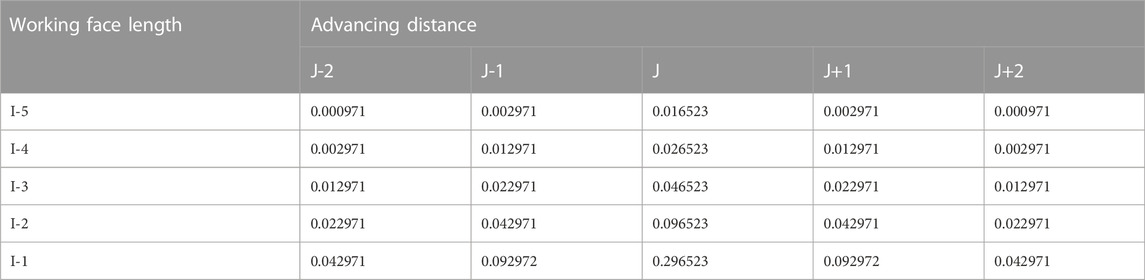
TABLE 1. Regression coefficient matrix.
Therefore, the parameter matrix of the prediction model is as follows:
In the above,
The test set of the last 30% of mining pressure monitoring values (the working face distance between 2,649.5 and 2,806.8 m) can be calculated using the constrained multiple linear regression model, and the mining pressure prediction values can be obtained. Compared with the monitoring values, it can be found that the relative error is less than 30% of the predicted values, accounting for 92.73%. From comparing the predicted values of the test set mining pressure (as shown in Figures 12, 13) with the monitored values (as shown in Figures 14, 15), it can be found that the distribution laws of the two are highly consistent.
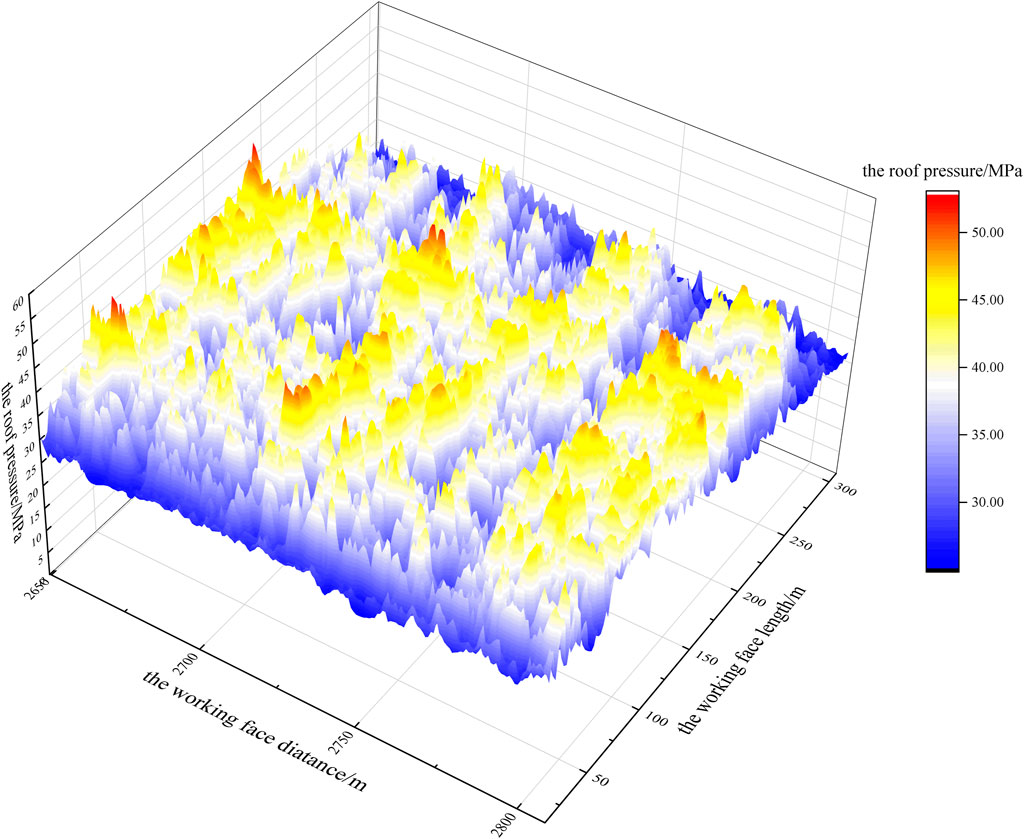
FIGURE 12. The surface portion of the 3D colormap surface with a projection of the predicted values.
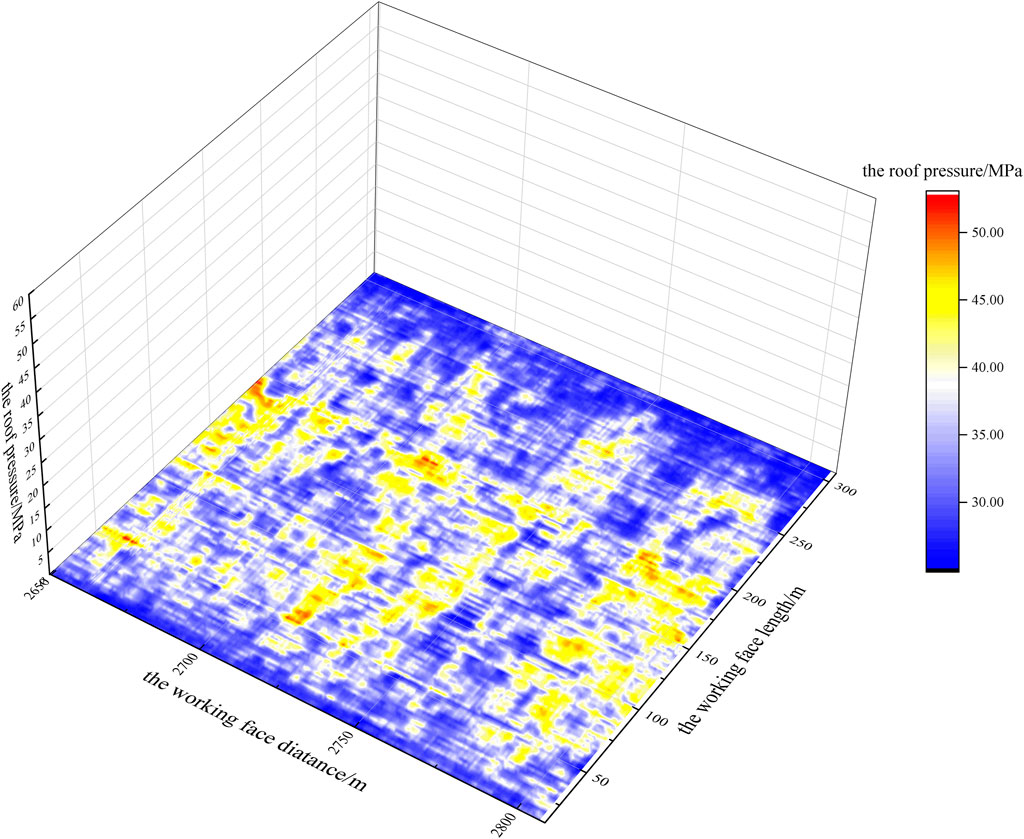
FIGURE 13. The mapping portion of the 3D colormap surface with a projection of the predicted values.
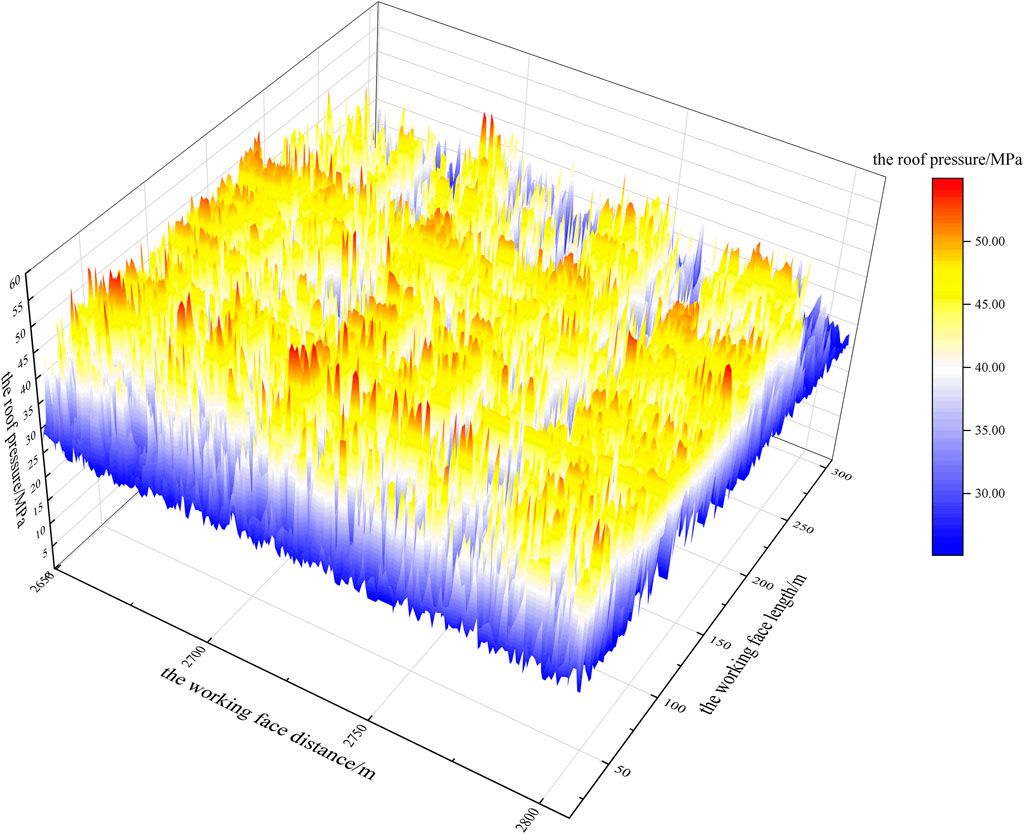
FIGURE 14. The surface portion of the 3D colormap surface with a projection of the monitored values.
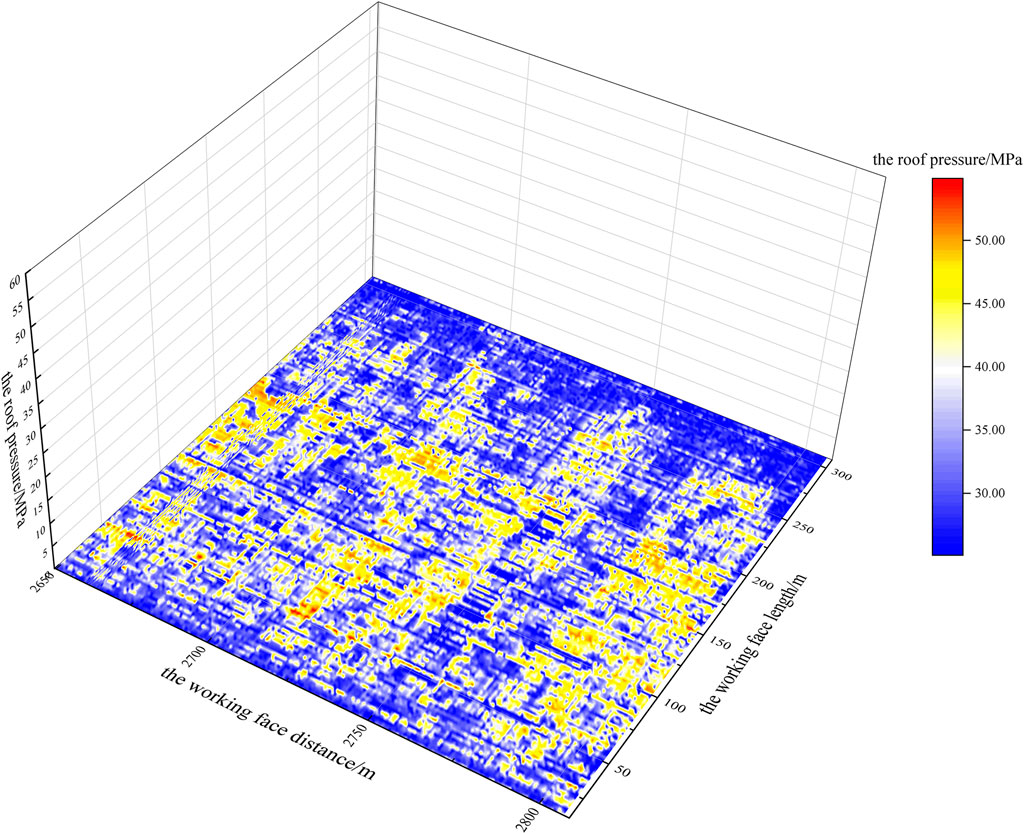
FIGURE 15. The mapping portion of the 3D colormap surface with a projection of the monitored values.
Given the occurrence of mine safety accidents caused by excessive roof mining pressures, a location with a large peak mining pressure is selected for further analysis. Taking the working face distance as the cross-section, the measured and predicted values are sliced as shown in Figure 16. According to the local data display, we are aiming at predicting the massive dataset of mining pressures in the field; notably, the trends of the predicted and measured values are completely consistent. Simultaneously, if there is a sudden change in the predicted pressure value, there is also a sudden change in the actual mining pressure value, thereby providing a strong basis for preventing disasters caused by sudden changes in mining pressures.
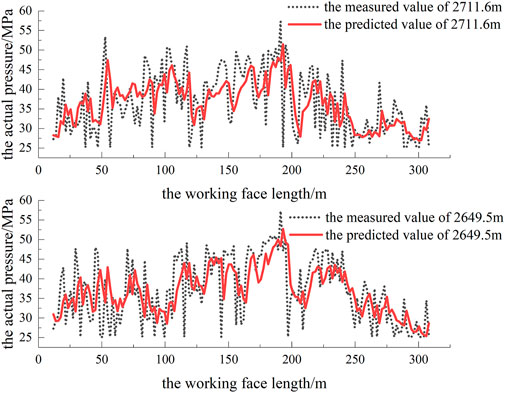
FIGURE 16. Comparison diagram of the local measured and predicted values at working face distances of 2,711.6 and 2,649.5 m.
From the predicted data, it can be found that the regional rock pressure at the coordinates
Ultimately, it can be concluded that the prediction effect of the model is remarkable. According to the 30% prediction error standard required by the coal mining face site, it completely meets the fieldwork requirements (exceeding 85%). For the mining work of a fully mechanized caving face in a coal mine, this mining pressure prediction model can play an important role in providing early warnings and assessments of potential safety hazards for the setting of roadways. In this study, the mining pressure of the working face is monitored in real-time by hydraulic support mining pressure monitoring system. By realizing the prediction of coal mine working face pressure through the algorithm model, the dynamic change of coal pressure during coal seam mining can be mastered in time, providing a scientific and effective method for roadway roof support.
5 Conclusion
Based on the results of this study, the following conclusion can be made.
(1) The proposed multiple linear regression model with limitations can achieve a remarkable prediction effect; at the highest, 95.56% of the regional mining pressure prediction values are within an error range of 30% of the actual values. The relative error of most models is less than 30%, accounting for more than 90% of the values. Meanwhile, the proportion of relative error of less than 20% is close to 80%, and the proportion of relative error of less than 10% is close to half of the number of samples.
(2) The prediction effect of the model is reduced by enlarging the amount of mining pressure data in the adjacent area on the advancing distance of the working face.
(3) The optimal model setting is that the independent variable selection range comprises the first five sections in the working face length and the adjacent two sections in the advancing distance. These can be flexibly narrowed and expanded within a small range according to the actual application scenario.
(4) According to the 30% prediction error standard required by the coal mine face site, the prediction model presented herein fully meets the field requirements.
(5) For the mining work of a fully mechanized caving face in a coal mine, the mining pressure prediction model can play an important role in providing early warnings and assessments of potential safety hazards for the setting of roadways.
Data availability statement
The original contributions presented in the study are included in the article/supplementary material, further inquiries can be directed to the corresponding author.
Author contributions
JD and ZX contributed to the conception and design of the study. JD and ZX organized the database. JD and ZX performed the statistical analysis. JD wrote the first draft of the manuscript. JD, ZX, and HJ wrote sections of the manuscript. All authors contributed to the manuscript revision, read, and approved the submitted version.
Funding
This research was financially supported by the National Natural Science Foundation of China (No. 52074148) and the Natural Science Foundation of Liaoning Province (No. 2023-MS-343).
Conflict of interest
The authors declare that the research was conducted in the absence of any commercial or financial relationships that could be construed as a potential conflict of interest.
Publisher’s note
All claims expressed in this article are solely those of the authors and do not necessarily represent those of their affiliated organizations, or those of the publisher, the editors and the reviewers. Any product that may be evaluated in this article, or claim that may be made by its manufacturer, is not guaranteed or endorsed by the publisher.
References
Arshad, U., Taqvi, S. A., Buang, A., and Ali, A. (2021). SVM, ANN, and PSF modelling approaches for prediction of iron dust minimum ignition temperature (MIT) based on the synergistic effect of dispersion pressure and concentration. Process Saf. Environ. Prot. 152, 375–390. doi:10.1016/j.psep.2021.06.001
Dang, J. X., Tu, M., Zhang, X. Y., and Bu, Q. W. (2021). Analysis of the influence characteristics of the support stability of a fully mechanized coal mining face under the hard roof mining pressure. Shock Vib. 2021, 1–15. doi:10.1155/2021/1307000
Hu, C. W., Li, Q., Wang, Y. L., Li, Y. Y., Wang, Y. Q., and Chang, K. (2022). Influence mechanism of mine pressure on coal seam gas emission during mining. Geotechnical Geol. Eng. 40 (6), 3067–3074. doi:10.1007/s10706-022-02078-w
Huang, J. C., Ko, K. M., Shu, M. H., and Hsu, B. M. (2019). Application and comparison of several machine learning algorithms and their integration models in regression problems. Neural Comput. Appl. 32 (10), 5461–5469. doi:10.1007/s00521-019-04644-5
Kim, B., Yuvaraj, N., Sri Preethaa, K. R., Hu, G., and Lee, D. E. (2021). Wind-Induced pressure prediction on tall buildings using generative adversarial imputation network. Sensors 21 (7), 2515. doi:10.3390/S21072515
Li, J. D., and Hao, H. (2018). Far-field pressure prediction of a vented gas explosion from storage tanks by using new CFD simulation guidance. Process Saf. Environ. Prot. 119, 360–378. doi:10.1016/j.psep.2018.08.004
Liu, C. Y., Yang, J., Yu, B., and Wu, F. F. (2015). Support resistance determination of fully mechanized top-coal caving face in extra thick seam under multi-layered hard strata. J. Min. Saf. Eng. 32 (1), 7–13. doi:10.13545/j.cnki.jmse.2015.01.002
Liu, X. H., Tian, J. Y., Li, B., and Lv, Y. F. (2022). Pressure prediction model in transition ladle based on adaptive PSO-BP neural network. J. Phys. Conf. Ser. 2170 (1), 012009. doi:10.1088/1742-6596/2170/1/012009
Mei, Y., Sun, Y., Li, F., Xu, X., Zhang, A., and Shen, J. (2022). Probabilistic prediction model of steel to concrete bond failure under high temperature by machine learning. Eng. Fail. Anal. 142, 106786. doi:10.1016/J.ENGFAILANAL.2022.106786
Miao, K. J., Wang, D. P., Tu, S. H., Tu, H. S., Zhu, D. F., Liu, X. W., et al. (2022). The principle and practice of strong mine pressure control in the initial mining and caving stages under multiple key strata. Sustainability 14 (10), 5772. doi:10.3390/su14105772
Nie, W., Chen, L., Wu, X., Yang, H. W., Li, B. B., Hong, Y. D., et al. (2019). Gas pressure prediction model for carbon dioxide injection in a large-scale coal matrix experiment. Rock Mech. Rock Eng. 52 (2), 421–433. doi:10.1007/s00603-018-1593-z
Peng, R., Fang, M. L., Ren, R. L., Zhu, J. M., Zhao, Q. F., and Ouyang, Z. H. (2022). Study on the law of earth’s surface movement on ultra-long working face. Geotechnical Geol. Eng. 40 (2), 587–603. doi:10.1007/s10706-021-01886-w
Ren, F. Y., Liu, Y., Cao, J. L., He, R. X., Fu, Y., Zhou, Y. J., et al. (2018). Prediction of the caved rock zones' scope induced by caving mining method. PloS one 13 (8), e0202221. doi:10.1371/journal.pone.0202221
Russ, D., Williams, J. A., Roth Cardoso, V., Bravo-Merodio, L., Pendleton, S. C., Aziz, F., et al. (2022). Evaluating the detection ability of a range of epistasis detection methods on simulated data for pure and impure epistatic models. PloS one 17 (2), e0263390. doi:10.1371/JOURNAL.PONE.0263390
Seber, G. A. F., and Lee, A. J. (2003). Linear regression analysis. Hoboken, NJ, USA: John Wiley & Sons. doi:10.1002/9780471722199
Tan, T. J., Yang, Z., Chang, F., and Zhao, K. (2019). Prediction of the first weighting from the working face roof in a coal mine based on a GA-BP neural network. Appl. Sci. 9 (19), 4159. doi:10.3390/app9194159
Wang, K., Zhuang, X. W., Zhao, X. H., Wu, W. R., and Liu, B. (2022). “Roof pressure prediction in coal mine based on Grey neural network,” in IEEE access (IEEE), 117051–117061. doi:10.1109/access.2020.3001762
Wang, P. F., Tian, C., Liu, R. H., and Wang, J. (2019). Mathematical model for multivariate nonlinear prediction of SMD of X-type swirl pressure nozzles. Process Saf. Environ. Prot. 125, 228–237. doi:10.1016/j.psep.2019.03.023
Wang, S. R., Li, N., Li, C. L., and Cao, C. (2015). Distribution characteristics analysis of pressure-arch in horizontal stratified rocks under coal mining conditions. Teh. vjesnik-Technical Gaz. 22 (4), 997–1004. doi:10.17559/tv-20141207160855
Wang, S. R., Wu, X. G., Zhao, Y. H., Hagan, P., and Cao, C. (2019). Evolution characteristics of composite pressure-arch in thin bedrock of overlying strata during shallow coal mining. Int. J. Appl. Mech. 11 (3), 1950030. doi:10.1142/S1758825119500303
Wang, Y., Li, J. D., and Hao, H. (2022). Development of efficient methods for prediction of medium to large scale BLEVE pressure in open space. Process Saf. Environ. Prot. 161, 421–435. doi:10.1016/j.psep.2022.03.045
Weng, Y. M., and German Paal, S. (2022). Machine learning-based wind pressure prediction of low-rise non-isolated buildings. Eng. Struct. 258, 114148. doi:10.1016/j.engstruct.2022.114148
Willmott, C. J., and Matsuura, K. (2005). Advantages of the mean absolute error (MAE) over the root mean square error (RMSE) in assessing average model performance. Clim. Res. 30 (1), 79–82. doi:10.3354/CR030079
Keywords: coal mine roof stability, comprehensive working face, hydraulic support, machine learning, multiple linear regression, roof breakage, mining pressure, pressure prediction
Citation: Dong J, Xie Z, Jiang H and Gao K (2023) Multiple regression method for working face mining pressure prediction based on hydraulic support monitoring dataset. Front. Earth Sci. 11:1114033. doi: 10.3389/feart.2023.1114033
Received: 02 December 2022; Accepted: 24 January 2023;
Published: 13 February 2023.
Edited by:
Jie Chen, Chongqing University, ChinaCopyright © 2023 Dong, Xie, Jiang and Gao. This is an open-access article distributed under the terms of the Creative Commons Attribution License (CC BY). The use, distribution or reproduction in other forums is permitted, provided the original author(s) and the copyright owner(s) are credited and that the original publication in this journal is cited, in accordance with accepted academic practice. No use, distribution or reproduction is permitted which does not comply with these terms.
*Correspondence: Jianjun Dong, ZG9uZ2ppYW5qdW5AbG50dS5lZHUuY24=