 Zuochen Wang
 Qiangbing Huang
 Qingyu Xie1
- 1Department of Geological Engineering, Chang’an University, Xi’an, China
- 2Key Laboratory of Western China’s Mineral Resource and Geological Engineering, Ministry of Education, Xi’an, China
- 3Key Laboratory of Earth Fissures Geological Disaster, Ministry of Natural Resources, Nanjing, China
Ground fissure is a typical geohazard widely developed in China, which brings serious geological challenges to the construction and safe operation of the Chinese high-speed railways. However, the dynamic response mechanism of high-speed railway natural subgrade crossing the ground fissure zone is unclear. In this study, a new trainload excitation equipment that can simulate moving train loads was developed. The model test was carried out on the dynamic responses of the natural subgrade of high-speed railway crossing ground fissure zone under moving train loads. The results show that the ground fissure had a great influence on the acceleration response of the subgrade across the ground fissure zone, and the average peak acceleration value of the subgrade in the hanging wall was greater than the footwall. Along the longitudinal direction of the railway, the dynamic Earth pressure of the subgrade in the hanging wall was significantly greater than that in the footwall of the ground fissure and is about 2.5 times than that in the footwall, demonstrating a typical hanging wall amplification effect. The displacement amplitude on the subgrade and ground surface in the hanging wall was larger than that in the footwall of ground fissure. The attenuation rate of peak acceleration, dynamic velocity, and displacement in the hanging wall along the depth direction was more evident than that of the footwall of ground fissure. For the natural subgrade of high-speed railway crossing ground fissure zone, the critical influence depth of moving train load was about 12 m below the subgrade surface.
Introduction
High-speed railways play an important role in the fast connection among cities and promote the local economy’s sustainable development (Chen and Whalley, 2012; Smith and Zhou, 2014; Tan et al., 2016). Although the high-speed railway in China was not constructed as early as in Japan, France, and other European countries, it has been fast developed with the rapid economic development in China (Yin et al., 2015). By 2020, the total length of China’s high-speed railways was larger than 38,000 km, and it passed through 95 percent of cities with more than one million population. In 2025, the operating mileage of high-speed railways will increase to 50,000 km (National Railway Administration of P.R.China, 2022). Behind the rapid development of the high-speed railway in China, the planned construction meets a list of geological disasters, especially ground fissures (Shi et al., 2016).
Ground fissures have been found in many countries around the world. It is a rupture developed in rock or soil surface and can also be referred to as Earth fissures or ground cracks (Peng et al., 2020a). Ground fissures are surface rupture traces caused by internal and external forces and human activities (Wang et al., 2016). Notably, ground fissures is a discontinued structure surface with a dip angle nearly vertical, and it is tens of meters in depth and tens of centimeters in width (Xu et al., 2016; Peng et al., 2020b). Ground fissures in China are widely distributed in North China Plain, the Suzhou-Wuxi-Changzhou area, and the Fenwei basin, where ground fissure activity is very intense (Wang et al., 2009; Wang et al., 2010; Peng et al., 2013; Peng et al., 2016a; Zhang et al., 2016). The ground fissures are generally controlled by a regional tension stress field and strengthened by excessive underground water extraction (Peng et al., 2016b; Peng et al., 2020a). Unfortunately, the construction of high-speed railways with large grounding fissures in these areas has been challenging (Huang et al., 2013). For example, Datong to Xi’an Passenger Dedicated Line (DXPDL) passes through the Fenwei Basin, which contains five sub-basins: Datong basin, Taiyuan basin, Linfen basin, Yuncheng basin, and Weihe basin (Peng et al., 2020b). There are more than 510 ground fissures in the five sub-basins, and 7% intersect the DXPDL (Howard and Zhou, 2019). Under tectonic stress and groundwater extraction, the hanging wall and footwall of the ground fissure often produce long-term and slow dislocation, resulting in differential settlement on the ground surface (Peng et al., 2016b). Additionally, this may significantly influence the dynamic response of the high-speed railway subgrade crossing the ground fissure zone, which causes safety concerns for the high-speed railway. To deal with the geological disaster of ground fissure, the bridge is usually adopted when the DXPDL crosses the ground fissure zone at a large intersection angle. When crossing the ground fissure at a small intersection angle, the ballasted track subgrade with easy maintenance and low cost is adopted (Kollo et al., 2015; Bian et al., 2018). Under the action of train vibration load, the possible influence of different dynamic responses induced by ground fissures on the high-speed railway subgrade crossing the ground fissure zone and long-term settlement is directly related to the safe operation of the high-speed railway. Therefore, it is necessary to carry out the research on the dynamic response of high-speed railway subgrade crossing the ground fissure zone to provide a scientific basis for the engineering design of high-speed railway subgrade crossing ground fissures and prevention and control of ground fissures disaster.
The dynamic response of high-speed railway track-subgrade systems has been studied extensively (Okumura and Kuno, 1991; Krylor, 1994; Frýba, 2013). Okumura et al. analyzed the subgrade monitoring data through multiple regression analysis. They concluded that the distance from the track, vehicle speed, vehicle length, and track structure significantly affects the subgrade’s dynamic response (Okumura and Kuno, 1991). Madshus et al. conducted field measurements of high-speed railway foundations in soft soil and found that vehicle speed has a significant influence on the dynamic response of the soft soil site (Anderson and Key, 2000). Additionally, D.P. Connolly et al. monitored the subgrade of high-speed railways. They found that different topography impacts ground vibration, among which the embankment earthwork profile has the lowest vibration and the cutting earthwork profile has the highest vibration (Connolly et al., 2014). Anderson et al. also found that small gravel could effectively reduce track settlement through large-scale model tests (Anderson and Key, 2000). Al Shaer et al. used model tests to estimate the relationship between settlement and cycle load time (Al Shaer et al., 2008). Furthermore, Momoya et al. and Ishikawa et al. conducted fixed-point and moving-wheel loading tests and found that the cumulative residual deformation of ballasted caused by moving-wheel loading is greater than that of fixed point loading (Momoya et al., 2005; Ishikawa et al., 2011). The previous studies mainly focused on the dynamic response of subgrade and foundation under train vibration load. However, there are few reports on the dynamic response of high-speed railway subgrade crossing ground fissure zones. Therefore, the dynamic interaction between railway subgrade and train vibration across the ground fissure zone is unclear.
This paper takes the DXPDL crossing the ground fissure development area in Taiyuan Basin, Shanxi Province, as the engineering background, the dynamic response of high-speed railway subgrade in natural foundation crossing the ground fissure zone is studied. Specifically, we used a model test using the self-developed mobile train load simulation device to reveal the dynamic response law of the high-speed railway natural subgrade crossing the ground fissure zone, including the variation law of dynamic Earth pressure, acceleration, dynamic velocity, and dynamic displacement of subgrade in the hanging wall and footwall of the ground fissure. Therefore, these provide scientific guidance for constructing and safely operating high-speed railways in ground-fissure-developed areas.
Engineering background
The DXPDL crosses the Fenwei basin, which is a Graben system with a length of 1,200 km and a width of 30–60 km (Zhang et al., 1998) (Figure 1A). The Fenwei basin is in the north-south tensile stress and appears S-shaped with ground fissures due to the continuous eastward extrusion of the crustal blocks in the Qinghai-Tibet Plateau (Figure 1B) (Yueqiao et al., 2006; Peng et al., 2007). As the main component of the Fenwei basin, the Taiyuan basin is a Cenozoic rift basin with 148 km in length, 48 km in width, and 6,200 km2 in area (Zang et al., 2021). The west and east of the Taiyuan basin are Luliang Mountain and Taihang Mountain, respectively (Figure 1C) (Li et al., 2015). The Cenozoic sediments in the Taiyuan basin are mainly silty clay layers containing medium sand layers. Furthermore, the thickness of the sediment is generally 1,000–2,000 m, providing source conditions for the development of ground fissures (Peng et al., 2017; Peng et al., 2018). The Taiyuan basin is controlled by NW-SE direction tensile stress, and the active faults are mainly in the NE direction (Peng et al., 2020a). There are 107 ground fissures developed along the active fault zones, which are mainly distributed among the three active faults zones: Qingxu-Jiaocheng-Wenshui active faults zone (F1), Taigu-Qixian active faults zone (F3) and Pingyao active faults zone (F4) (Figure 1C) (Jia et al., 2020). Among them, 21 ground fissures pass through the DXPDL at angles of 15°–90° (Peng et al., 2019).
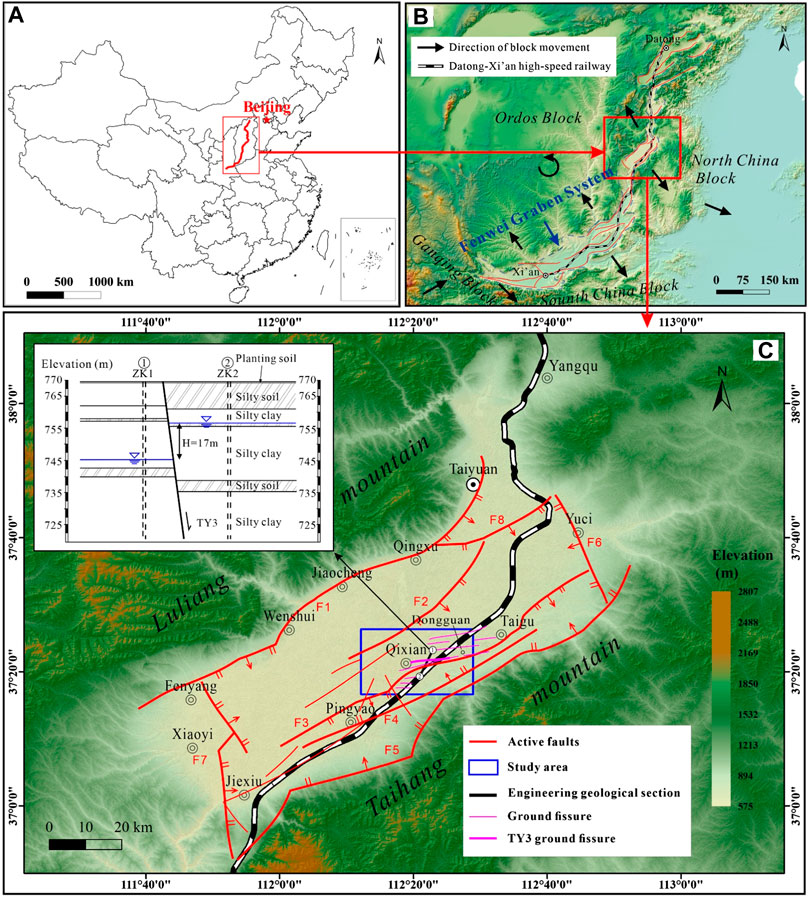
FIGURE 1. Relationship between high-speed railway and ground fissures. (A) Datong to Xi’an Passenger Dedicated Line (DXPDL) in China; (B) Fenwei basin; (C) Study area in Taiyuan basin (F1: Jiaocheng fault; F2: Longjiaying fault; F3: Qixian fault; F4: Pingyao-Taigu fault; F5: Hongshan-Fancun fault; F6: Yuci-Beitian fault; F7: Sanquan fault; F8: Tianzhuang fault).
The DXPDL starts from Datong, Shanxi Province, in the north. It ends in Xi’an, Shaanxi Province, in the south, with a total length of 859 km (Figure 1B). The DXPDL crosses many ground fissure development areas, among which the TY3 ground fissure site in Dongguan substation is located about 1.2 km southwest of Zhangjiapu, Qixian County, Taiyuan City. North of Dongguan substation (Peng et al., 2017) (Figure 1C). The TY3 ground fissure are exposed on the surface and are distributed in strips or beaded pits, with the largest pit diameter of 1.2 m (Figure 2A), which is dominated by vertical dislocations and also horizontal tensioning. The maximum width of the ground fissure is 1m (Figure 2B), and the ground dislocation is about 45 cm (Figure 2C), which leads to the cracking of the wall of the Dongguan substation (Figure 2D). Notably, the ground fissure activity time is about 10 years. According to the deformation of expressway pavement and the ground fissure activity time, the vertical activity rate of TY3 ground fissure is estimated to be 3–4 cm per year (Peng et al., 2019).
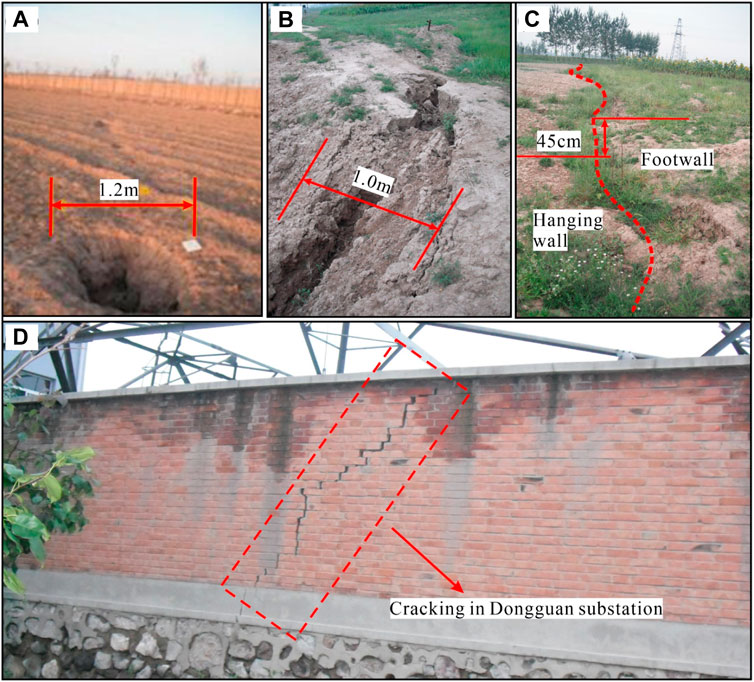
FIGURE 2. Surface morphology and hazards of TY3 ground fissures in Dongguan substation. (A) Beaded pits; (B) Horizontal cracks; (C) Vertical dislocation; (D) Substation enclosure cracks.
The strike of the TY3 ground fissure is 73°, the inclination is 163°, the dip angle is 80°, the length of the TY3 ground fissure is about 10.2 km, and it intersects with the high-speed railway subgrade at a small angle. The stratum of the ground fissure site is composed of silty soil, silty sand interbedded, silty clay, and silty soil interbedded, and the maximum water level difference between the hanging wall and footwall is about 17 m (Figure 1C) (Peng et al., 2018). To cope with the adverse effects of ground fissure activity on high-speed railways, a subgrade is adopted to cross the ground fissure zone (Figures 3A–C). Taking the subgrade of the DXPDL crossing the ground fissure zone as the engineering background, this paper analyzes the dynamic Earth pressure, acceleration and dynamic displacement variation law of the high-speed railway subgrade crossing the ground fissure zone through physical model tests. Therefore, we do so to reveal the influence mechanism of the ground fissure zone on the dynamic response of the high-speed railway subgrade.
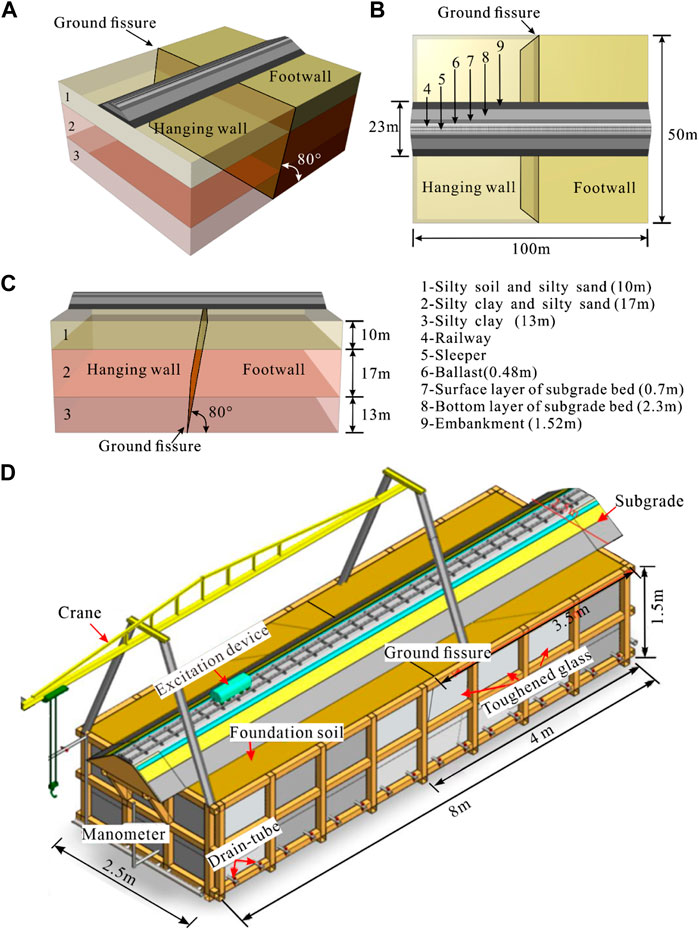
FIGURE 3. Schematic diagram of the DXPDL subgrade crossing TY3 ground fissure. (A) Three-dimensional view; (B) Overhead view; (C) Lateral view; (D) Three-dimensional schematic view of model test system.
Physical simulation experiments
Experimental facility
To study the dynamic response of high-speed railway subgrade crossing the ground fissure zone, this paper independently developed a new model test system (Figures 3D, 4A). The model test system includes a model box, train movement simulator, in which the size of the model box are 8.0 m × 2.5 m × 1.5 m (L×W×H), one side is installed with transparent tempered glass, the other side is steel plate, and 10 cm polystyrene foam plate is laid on the inner wall of the model box to eliminate the influence of model boundary effect. The model test system can simulate the dynamic response of the high-speed railway subgrade crossing the ground fissure zone under different train speeds and intersection angles between the high-speed railway line and the ground fissure.
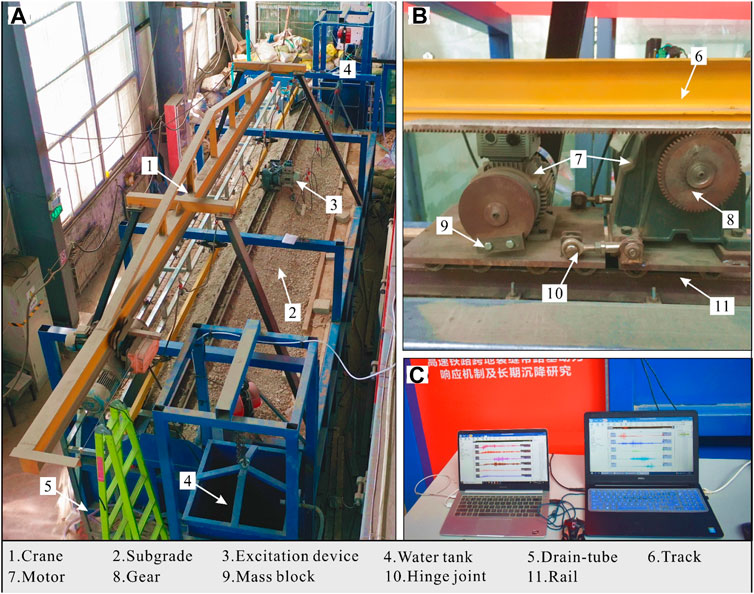
FIGURE 4. Model test device. (A) new experimental facility; (B) excitation device; (C) measured data.
The train load simulation excitation system includes two motors, mass blocks, controllers, and tracks (Figure 4). One motor is a traction motor, which is connected to the crawler through gears (Figure 4B). The other motor is an eccentric motor with counterweight, which is used to output the excitation simulating the train load on the track. Different running speeds of high-speed trains are simulated by changing the excitation frequency and the weight of eccentric blocks. Furthermore, the traction motor and the eccentric motor are hinged to avoid the impact of vibration on the traction motor.
Physical model and testing content
Physical model
The subgrade model is composed of silty clay, silty soil, embankment, a bottom layer of subgrade bed, a surface layer of subgrade bed, ballast, sleeper, and railway from bottom to top, as shown in Figure 3B. The model is designed. with a geometry similarity constant of Cl=20. The similarity constants of other physical quantities are determined according to the similarity theory, as shown in Table 1. In this model test, foundation soil is simulated by loess. The foundation soil materials are proportionally configured and mixed in the model-making process. We put 15 cm of soil on each layer, then flattened and compacted the loose soil to 10 cm (Figure 5A). After each layer of soil filling, the top surface should be rough to ensure that filling the next layer is in good contact. To ensure the quality of each layer of filling soil, the cutting ring method was used to test the density of the foundation soil after compacting. The hanging wall and footwall sampled three or four samples in each layer, and the test results are shown in Figure 6A, and the physical and mechanical parameters of the foundation soil are shown in Table 2.
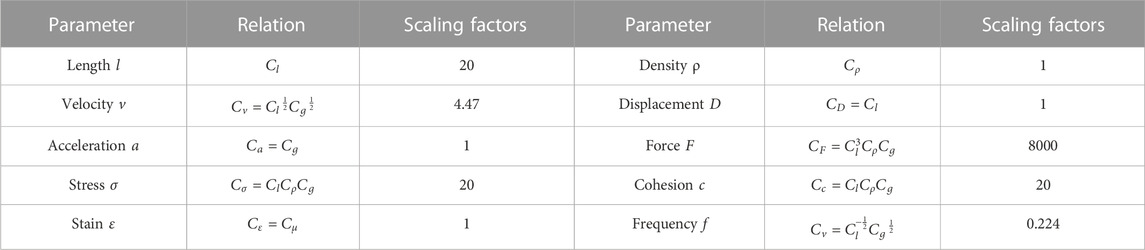
TABLE 1. Parameter scaling factors for the model test.
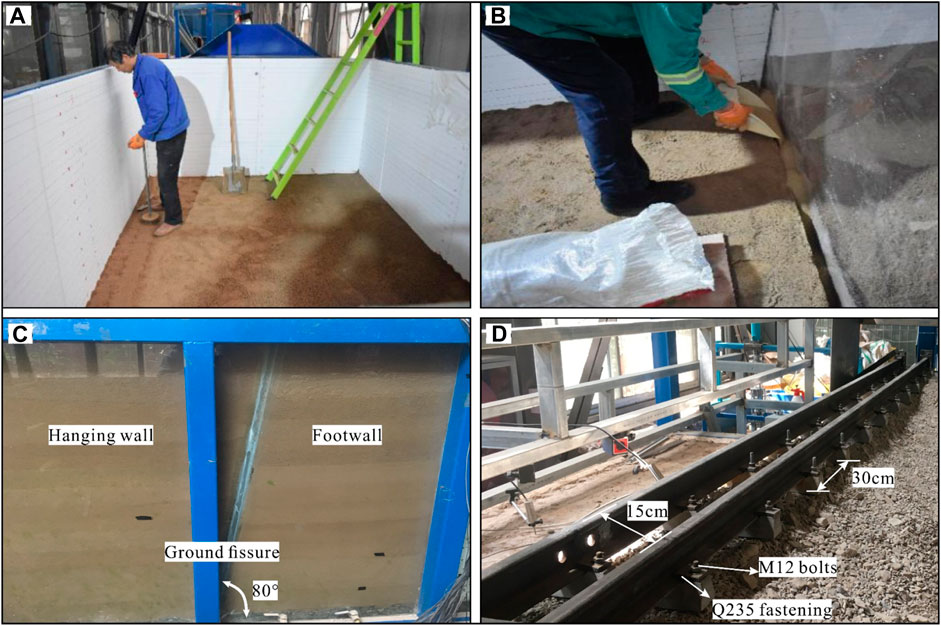
FIGURE 5. Process of model making. (A) compacting the foundation soil; (B) filling sand in fissure; (C) model side view; (D) model sleeper arrangement.
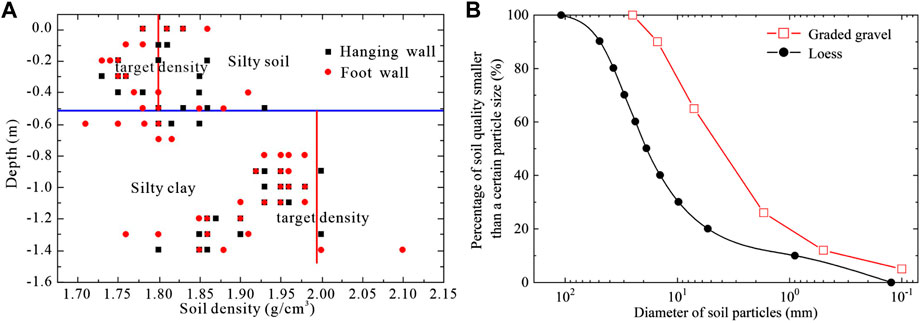
FIGURE 6. Site filling soil quality control. (A) sampling results of foundation soil; (B) particle distribution curves of graded gravel.
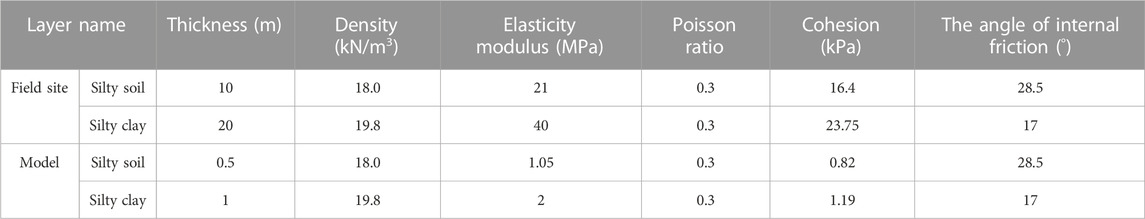
TABLE 2. Parameters of the stratum section.
Ground fissure is simulated by sand to highlight the differential settlement of the hanging wall and footwall. When making the model, a board with a width of 3.5 cm and a dip angle of 80° is preset in the middle of the model box before the foundation soil is filled. Foundation soil is filled and compacted on both sides of the board, and then sand is filled in the gap after pulling out the board to simulate the ground fissure (Figure 5B). A layer of soil is compacted, then filling a layer of ground fissure with sand. Finally, the ground fissure and filling soil are performed alternately until the soil is filled to the top surface (Figure 5C).
The surface layer of subgrade bed and the bottom layer of subgrade bed is filled with graded gravel. The method of compaction factor K and soil coefficient K30 is used to control the filling quality of graded gravel, and the slope ratio of the subgrade is 1:1.5 (Administration, 2014). Compaction coefficient K is the ratio of the dry density achieved by compaction to the maximum density obtained from the compaction test(Administration, 2014). K30 plate load test is a method which we take to work out the foundation coefficient by using a diameter of 30 cm of rigid bearing plate through applying vertical load and the determination of vertical deformation value of the soil under load per level, then according to the test data load intensity subsidence relation (σ,s) curve and the subsidence value of 1.25 mm(Administration, 2004). In the test, the compaction coefficient K ≥0.92, K30≥130Mpa/m. Considering the effective compaction in site, the slope of each graded gravel layer is set as 4° at the center line of the section. Furthermore, the subgrade gravel is laid 10 cm at each layer. The curve of graded gravel is shown in Figure 6B.
The model sleeper is simulated using cement. The uniaxial compressive strength of the model sleeper is 1.3 MPa, the elastic modulus is 0.16 GPa, and the density is 20.80 kg/m3. The sleeper is embedded with M12 bolts, and the rail is fixed in the sleeper with Q235 fastening (Figure 5D). The rail is simulated by a light rail whose density is 6 kg/m3. In laying the model sleeper and tracks, each model sleeper spacing is 30 cm, and the two rails are spaced at 15 cm.
Sensor arrangement
The test contents in the model test mainly include the acceleration response, dynamic Earth pressure, and dynamic displacement in the embankment and foundation. The monitoring instruments used in the model test are DH5921 (44 channel) and DH5922D (64 channel) dynamic signal test system, CT-20 displacement meters, and CT-186 acceleration sensors. Model measuring points are shown in Figure 7. Similar to the acceleration measuring lines, three dynamic Earth pressure measuring lines are set along the railway direction, located inside the subgrade (P1-1∼P1-8), at the top of silty soil (P2-1∼P2-8), and in silty soil (P3-1∼P3-8). To measure dynamic response near the ground fissure with depth in more detail, measuring points A4-1, A4-2, P4-1, P4-2, P5-1, and P5-2 are set near the ground fissure (Figure 7A). (P/A) means both earth pressure and acceleration are measured at this point. The displacement meter D1-1∼D1-8 is arranged on the subgrade surface and ground surface (D2-1∼D2-8) (Figures 7B, C). To facilitate analysis and discussion of the results, the measuring points were divided into 5 groups in the longitudinal direction, from up to down, as Line 1∼Line 5. We then set two measuring lines along the horizontal direction: Line 6 in the hanging wall and Line 7 in the footwall.
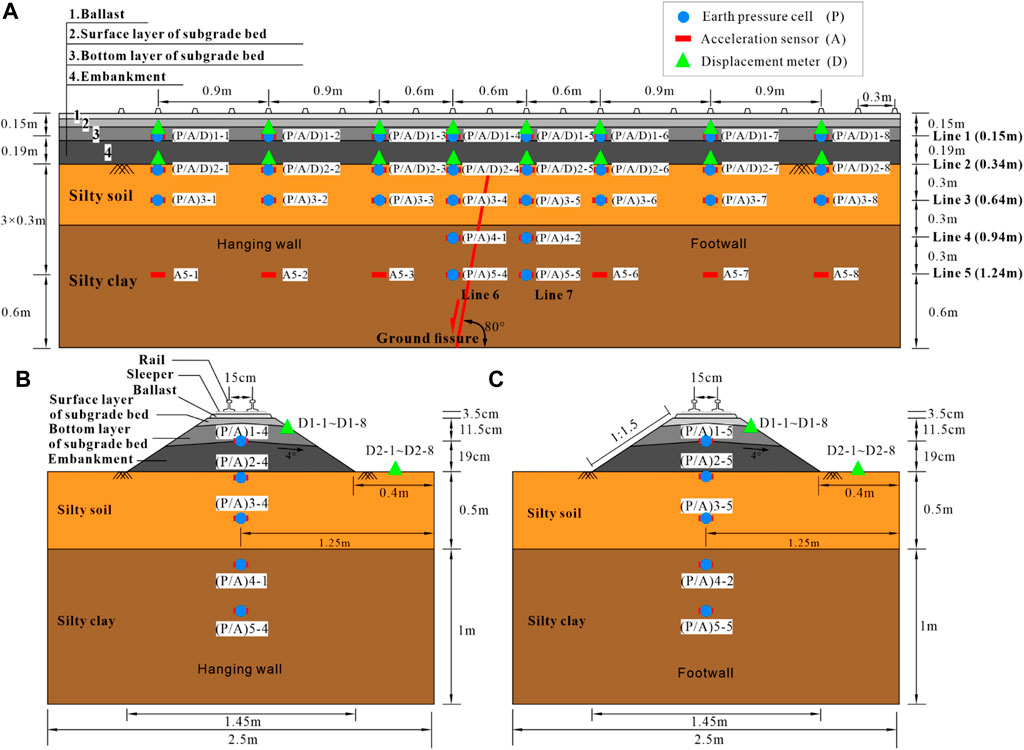
FIGURE 7. Schematic diagram of measuring points section in Model test. (A) Longitudinal section view; (B) Horizontal section in the hanging wall (Line 6); (C) Horizontal section in the footwall (Line 7).
Experimental program
The model test simulated the excitation load caused by the CRH380A passenger carriage (speed 250 km/h, axle weight 15 t) on the rail. The CRH380A passenger carriage parameters are shown in Table 3. When the model device moves at a constant speed, the output excitation on the rail is a sine wave, which is consistent with the real site loading pulse on the rail (Ishikawa et al., 2011). In fact, the train frequency fi is affected by the spacing between loading spacing li and the train speed v (Eq. 1) (Al Shaer et al., 2008). Regardless of the wheel axle spacing, a pair of wheel axles in one bogie are simplified as one excitation load, and a carriage 25 m long will apply an excitation load twice to the sleeper. The excitation frequency generated by two bogies at the front and the back in one carriage is regarded as the main frequency, and the excitation frequency generated by two adjacent bogies near the carriage connection is ignored (Shaer, 2005). In this paper, the li is 25 m.

TABLE 3. Technical parameters of the CRH380A passenger train.
Table 4 lists the excitation frequency of a high-speed railway train at the design speed of 250 km/h. The prototype train speed is 120–350 km/h, and the model train excitation frequency fi’ was calculated according to Eq. 1. Notably, the model train excitation frequency multiplied by model frequency similarity coefficient Cv is equal to the model excitation frequency.
where vi is the train speed (m/s), l is the train loading spacing (m).
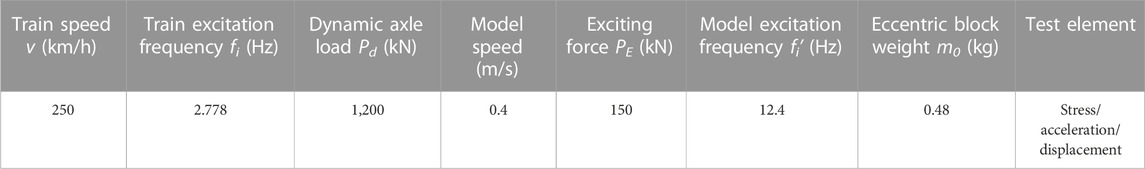
TABLE 4. Design condition of the model test.
In engineering practice, the train passenger carriage dynamic axle load Pd is calculated according to Eq. 2 (Priest and Powrie, 2009), and the calculated results are shown in Table 4.
where Ps is the wheel static load (kN) and α is the speed amplification factor (generally 0.004).
The weight of the eccentric block is calculated according to the excitation load peak value Pd of the model (Eq. 3) (Powrie et al., 2007).
where PE is the exciting force of simulated train in model test, m0 is the eccentric block weight (kg), re is the eccentric radius (m) of the eccentric block, w is the angular velocity of the speed increaser, w=2πf (rad/s), φ is the initial phase angle.
This model test was based on a train speed of 250 km/h. To ensure the test’s safety, the simulated train’s vibration exciter speed is set as 0.4 m/s. The dynamic Earth pressure, acceleration in the subgrade, and displacement on the subgrade surface were recorded when the model device moved from the hanging wall to the footwall. The design conditions of this model test are shown in Table 4.
Results analysis
Acceleration response
Acceleration response of subgrade
To study the frequency distribution of vibration response caused by the train load, the frequency compositions of vibration signal were obtained from the time-history curve acquired from the test by fast Fourier transform (Eq. 4). The conversion results are shown in Figure 8.
where
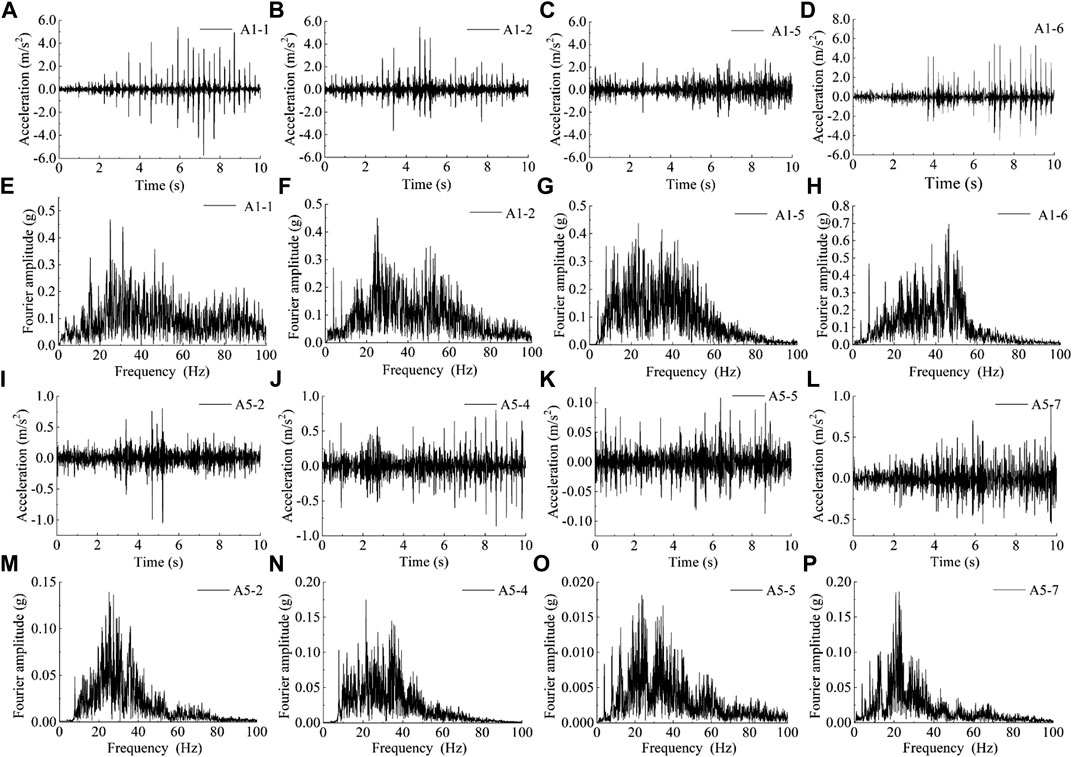
FIGURE 8. Acceleration-time curves and Fourier spectrum of acceleration in subgrade (A–H) and in foundation soil (I–P).
Figures 8A–H are the acceleration-time curves and Fourier spectrum of the measuring points inside the subgrade (Line1 in Figure 7A). According to the measured acceleration-time curve, the peak acceleration of each measuring point inside the subgrade was obtained, which is about 2.723 m/s2∼6.31 m/s2 (Table 5). The peak acceleration in the subgrade decreases obviously at the footwall side of the ground fissure, and the average peak acceleration value in the subgrade in the hanging wall is higher than that in the footwall. According to the result of the Fourier spectrum, the main frequency of acceleration distributed is in the 1–60Hz frequency band, and the peak frequency of measuring points near the ground fissure is mainly concentrated near 40Hz. Notably, the peak frequency at both sides of the ground fissure was mainly concentrated between 20Hz–30Hz. Due to the existence of the ground fissures, boundary interfaces occur inside the subgrade, which results in the reflection and superposition of vibration waves at the ground fissures. The amplification effect is represented in the hanging wall.
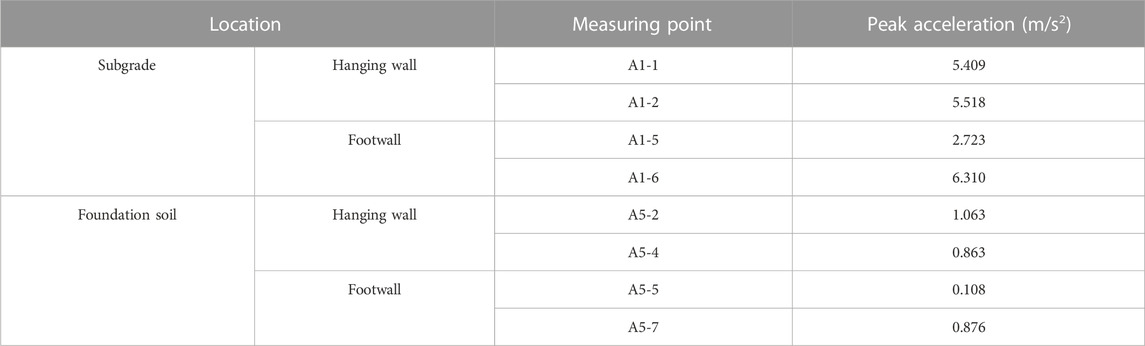
TABLE 5. Peak acceleration of measuring point in subgrade and foundation soil.
Acceleration response of foundation soil
Figures 8I–P are the acceleration-time curves and Fourier spectrum of the silty clay at the bottom of the foundation (Line 5 in Figure 7A). Table 5 shows the peak acceleration inside the foundation, and its range is 0.108 m/s2∼1.063 m/s2, which is significantly reduced compared with the maximum peak acceleration inside the subgrade. Under the action of train vibration load, the changing trend of the peak acceleration in the foundation was the same as that inside the subgrade: the average peak acceleration of the upper disk was greater than the average peak acceleration of the lower disk. From the Fourier spectrum, the acceleration vibration energy is concentrated around 20–30Hz, the same as the frequency distribution inside the subgrade. The peak acceleration difference of each measuring point in the same soil layer in the foundation was small, and the dynamic response difference between the ground fissure’s hanging wall and footwall decreased with an increase in depth.
Dynamic Earth pressure response
Figure 9 shows the variation of the dynamic Earth pressure along the railway direction at the bottom of the subgrade bed and silty soil in the foundation under the moving train load. According to the variation of dynamic Earth pressure, it was evident that the dynamic Earth pressure fluctuates near the ground fissure. The ground fissure significantly influenced the dynamic Earth pressure inside the subgrade. Inside the subgrade (Line1 in Figure 9A), there was a prominent wave peak of dynamic Earth pressure near the ground fissure. The maximum value of dynamic Earth pressure in the hanging wall was more significant than that in the footwall (about 2.5 times), indicating that the existence of ground fissure has a typical amplification effect on dynamic Earth pressure of subgrade crossing ground fissure, especially in the side of the hanging wall close to the ground fissure. Compared with the subgrade, the dynamic Earth pressure in the foundation (Line 2 in Figure 9A) was significantly smaller, decreased considerably with the increase of the depth, and was almost unaffected by the existence of ground fissures when reaching a certain depth. This indicates that the dynamic Earth pressure response of the subgrade and foundation under the action of train vibration load has a significant attenuation, regardless of the existence of ground fissures. Meanwhile, the reason for fluctuating phenomena of dynamic Earth pressure along the longitudinal direction of the railway is mainly that the ground fissure, as a kind of inclined discontinuous geological interface, rebounds the wave generated by the moving train load (Ditzel and Herman, 2004; Ekevid et al., 2006), resulting in the differential dynamic Earth pressure between the hanging wall and footwall.
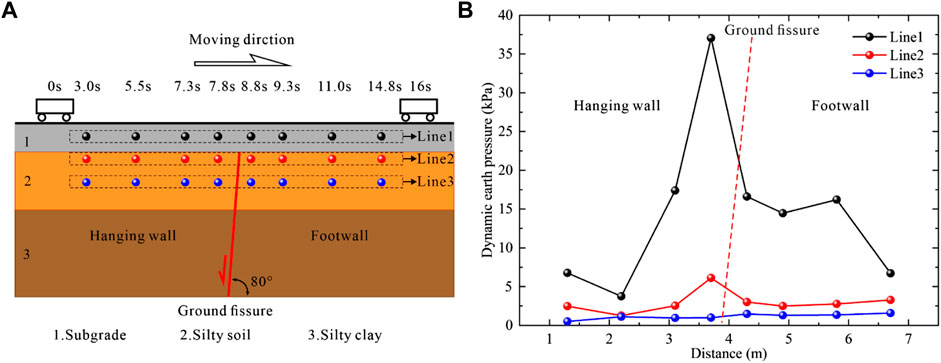
FIGURE 9. (A) Earth pressure measuring points inside the model; (B) Variation of the dynamic Earth pressure.
The dynamic amplification effect is related to the uneven settlement of subgrade (He et al., 2018). Inadequate compaction of transition zone will cause the dynamic stress amplification on the subgrade surface in this area and then lead to the uneven settlement of subgrade. The uneven settlement of subgrade amplifies the dynamic wheel load in this region, and the amplified impact force exacerbates the uneven settling which eventually caused vicious circle (Shan et al., 2013). The dynamic amplification effect caused by track degradation under single sleeper of ballast track is more obvious than that of ballastless track (Shahraki et al., 2015). For the ballast track-subgrade crossing ground fissure zone, the superposition and amplification effect of the vibration wave may be produced in the ground fissure surface (Figure 10). Long-term dynamic wheel load will lead to subgrade degradation in the transition zone and further aggravate the dynamic amplification effect in the transition zone.
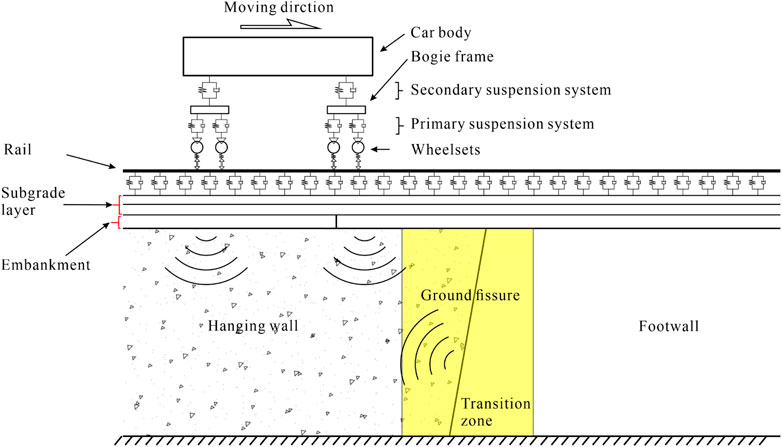
FIGURE 10. Schematic diagram of dynamic amplification effect of ground fissure zone.
Dynamic displacement response
Figures 11A–F shows the displacement-time curves of the measuring points on the subgrade surface, in which the D1-1∼D1-4 are in the hanging wall, and the D1-5 and D1-6 are in the footwall of the ground fissure (Figure 7). The peak displacement of each measuring point on the subgrade surface was obtained, which was concentrated about 0.116–0.189 mm, as shown in Table 6. The dynamic displacement fluctuated in the hanging wall (Figures 11A–D red dotted box) and gradually decreased toward the surface of the subgrade bed near the ground fissure.
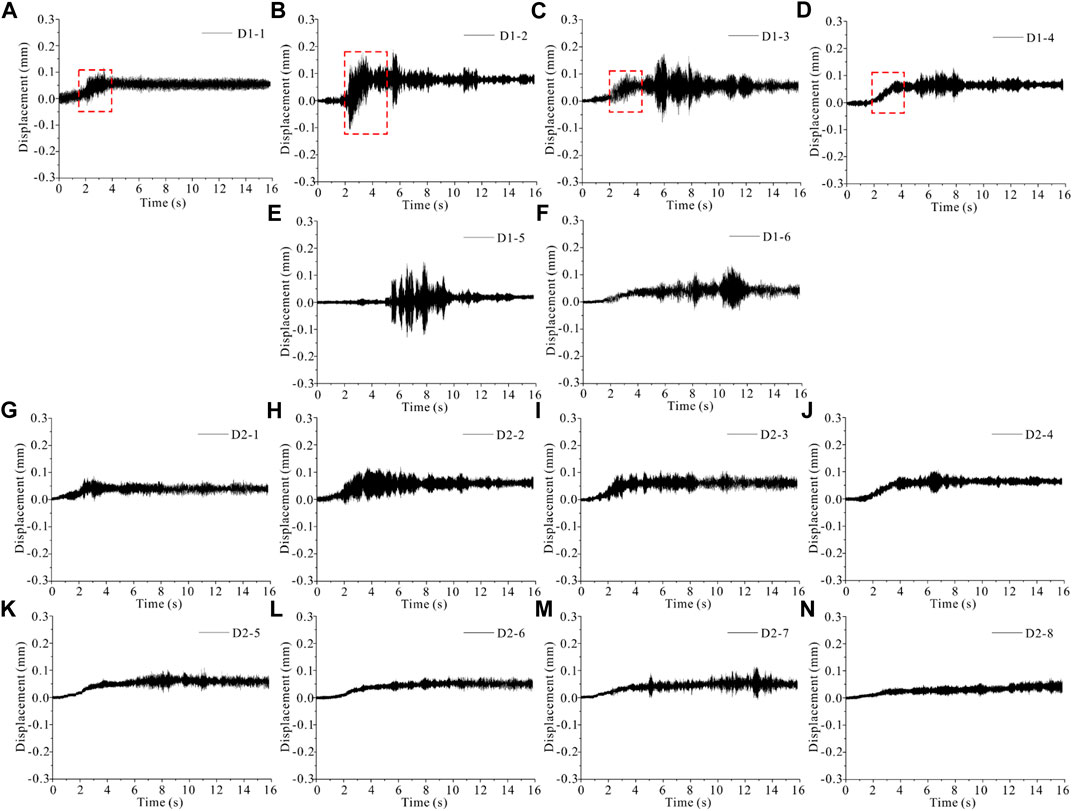
FIGURE 11. Dynamic displacement-time curves on subgrade surface ((A–D) in the Hanging wall, (E,F) in the Footwall) and on ground surface ((G–J) in the Hanging wall, (K–N) in the Footwall).
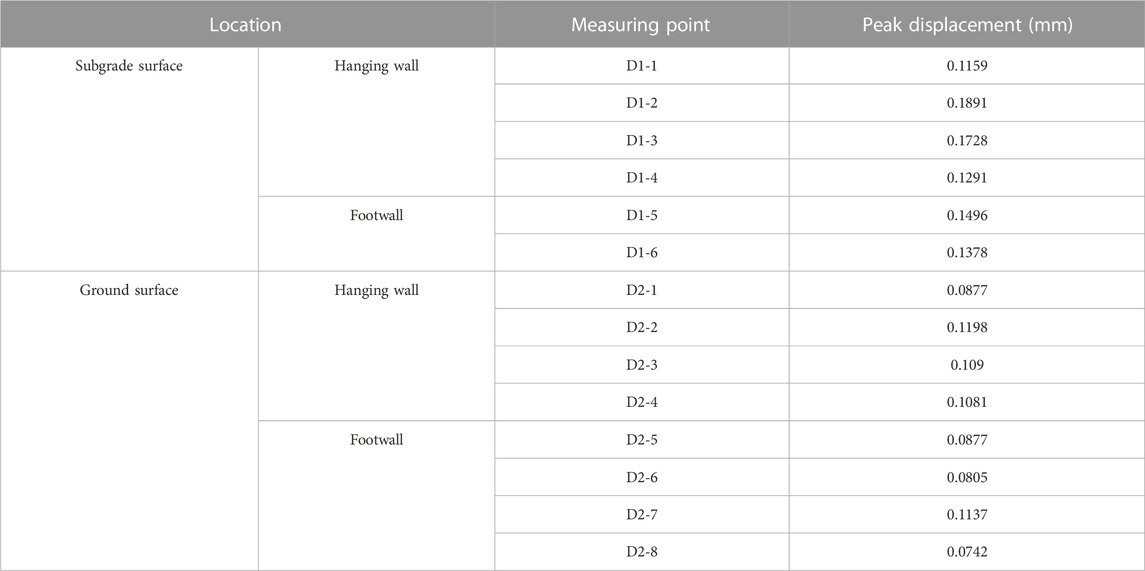
TABLE 6. Peak displacement of measuring point on subgrade surface.
Figures 11G–N shows the displacement-time curves of measuring points on the ground surface. The peak displacement of each measuring point on the ground surface is shown in Table 6, concentrated in 0.074–0.112 mm. Compared with the subgrade surface, the peak displacement of the ground surface is smaller. The reason can be attributed to two aspects: on the one hand, the graded gravel in the embankment was looser than the ground surface soil. On the other hand, the distance between the ground surface and the moving train load was further than the surface layer of the subgrade bed. In addition, the displacement fluctuation in the hanging wall was slightly larger than that in the footwall of the ground fissure.
Figure 12 shows the variation of peak displacement on the surface layer of the subgrade bed and ground surface. It can be observed that the peak displacement on the subgrade surface was greater than the ground surface. Notably, the subgrade surface was 0.116–0.189 mm, and the ground surface was 0.081–0.120 mm. Meanwhile, the peak displacement in the hanging wall was greater than that in the footwall on the subgrade surface, which decreased by 16%–37% from the subgrade surface to the ground surface in the hanging wall and decreased by 27%–42% in the footwall. Whether the subgrade surface or the foundation surface, the transverse dynamic displacement generally does not change much, especially the foundation surface, which indicates the transverse influence of train vibration load on the subgrade and foundation across the ground fissure zone is relatively small.
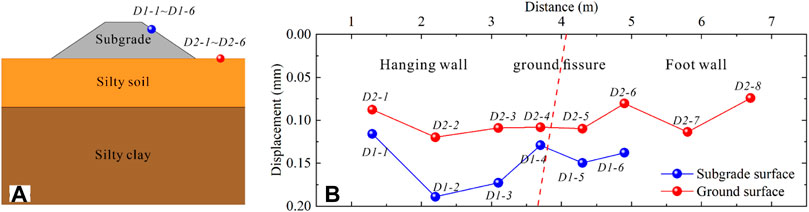
FIGURE 12. (A) Displacement measuring points of the model; (B) Peak of displacement along the transverse.
Dynamic response along the depth direction
Acceleration, dynamic velocity, and dynamic displacement
According to the acceleration-time curves of silty soil (stratum 2) and silty clay (stratum 3) inside the foundation (Line 6 and Line 7), the curves of foundation peak acceleration in the hanging wall and footwall of the ground fissure along the depth were drawn (Figure 13B). Figures 13C, D show the curves of dynamic velocity and dynamic displacement along the depth obtained from acceleration through the SeismoSignal software. The velocity and displacement of a signal can be obtained by directly integrating the acceleration signal in time domain using the following definition.
where v(t) = the velocity signal in time domain, v(0) = initial velocity, a(t) = acceleration signal in time domain, x(t) = the displacement signal in time domain and x(0) = initial displacement.
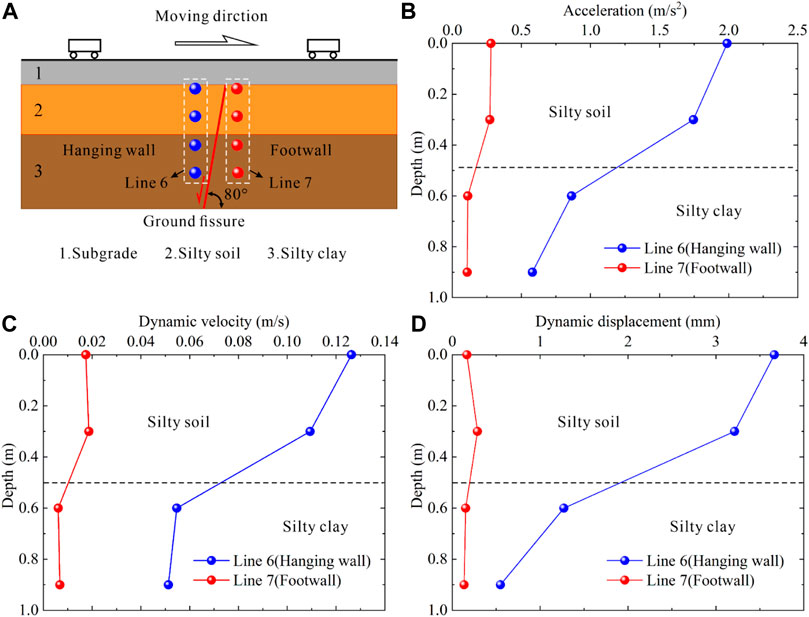
FIGURE 13. Dynamic response curves of foundation along the depth. (A) Acceleration measuring points; (B) peak acceleration; (C) peak dynamic velocity; (D) peak dynamic displacement.
It can be seen that acceleration, dynamic velocity, and dynamic displacement decreased from the subgrade surface along the depth direction, and the decrease rate in the hanging wall (blue dotted line) was far greater than the footwall (red dotted line). Additionally, in the hanging wall the acceleration, dynamic velocity, and dynamic displacement from the foundation surface to silty soil decreased by 12%–13%, and at the interface of silty soil and silty clay decreased by 50%–60%. In contrast, the dynamic response of the footwall only decreased at the interface of the soil layer. Furthermore, silty soil influences the range of the moving train load, corresponding to the depth in the prototype 12 m below the subgrade surface. Under the action of train vibration load, the critical influence depth of subgrade dynamic response across the ground fissure zone was about 12 m, which was greater than this depth and was not affected by train vibration load.
Dynamic Earth pressure
Figure 14 shows the variation of the peak dynamic Earth pressure inside the subgrade and foundation along the depth direction when the train vibration load moves from the hanging wall to the footwall (Line 6 and Line 7). It can be seen that most attenuation of dynamic Earth pressure occured inside the subgrade. Due to the influence of the ground fissure, the dynamic Earth pressure inside the subgrade of the hanging wall was higher than the footwall. In vertical direction, the dynamic Earth pressure of the hanging wall and footwall decreased by 86% and 82%, respectively. Inside the silty soil, the dynamic Earth pressure in the hanging wall from the surface to the inside decreased by 84%, while the footwall decreased by 51%. Meanwhile, the extent of the decrease in the hanging wall (line 6) was greater than the footwall (line 7). The dynamic Earth pressure in the foundation of the hanging wall or footwall is stable below 0.3 m (corresponding to the prototype 6.0 m), indicating the significant influence depth of train vibration load on the dynamic Earth pressure in the ground fissure site is about 6.0 m in practice. Furthermore, it demonstrates that the critical influence depth of train vibration load on dynamic Earth pressure is smaller than that on dynamic acceleration (12.0 m).
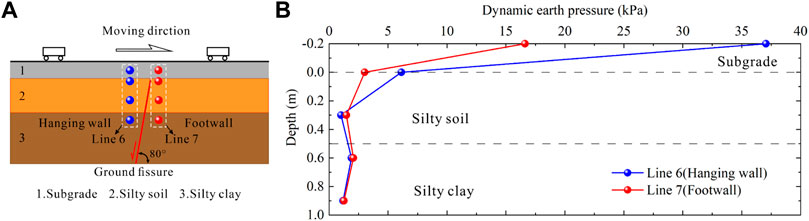
FIGURE 14. (A) Earth pressure measuring points near ground fissure; (B) Variation of the dynamic Earth pressure with depth.
Conclusion
Based on the independent development moving train load simulation system, the physical model test with a geometric scale of 1:20 of high-speed railway subgrade crossing the ground fissures zone was carried out. The dynamic response of Earth pressure, acceleration, velocity, and displacement of subgrade crossing ground fissure zone were analyzed. Notably, the following conclusions were drawn:
(1) Under the moving train load, the ground fissure has a great influence on the acceleration response of the subgrade across the ground fissure zone and the average peak acceleration value in the subgrade and foundation in the hanging wall was greater than that of the footwall. The peak frequency of measuring points near the ground fissure inside the subgrade was mainly concentrated at 40Hz, and 20Hz inside the foundation.
(2) The ground fissure influenced the dynamic Earth pressure inside the subgrade, especially in the embankment. The peak of dynamic Earth pressure inside the subgrade of the hanging wall is about 2.5 times that of the footwall. The dynamic Earth pressure in the silty soil of the foundation was significantly less than the subgrade, and the differential was weakened near the ground fissure, indicating that the ballasted track subgrade has a weakening effect on the dynamic Earth pressure of the hanging wall and footwall near the ground fissure.
(3) The attenuation rate of peak acceleration, dynamic velocity, and displacement in the hanging wall along the depth direction was greater than the footwall. At the interface of different soil layers, the hanging wall’s peak acceleration, dynamic velocity, and dynamic displacement decreased rapidly. In contrast, the footwall only decreased significantly at the interface of soil layers. The critical influence depth of the corresponding prototype moving train load was 12 m below the gound surface, which was greater than this depth and will not be affected by the train vibration load.
Data availability statement
The raw data supporting the conclusion of this article will be made available by the authors, without undue reservation.
Author contributions
ZW: Data curation, formal analysis, writing–original draft. QH: Conceptualization, methodology, resources, funding acquisition, writing review and editing. QX: Writing review and editing. LX: Validation, formal analysis. XK: Writing review and editing. YG: Validation.
Funding
This work was supported by the National Natural Science Foundation of China (Nos. 41772274, 42041006) and the Fundamental Research Funds for the Central Universities, CHD (300102262904).
Acknowledgments
The authors sincerely thank the Department of Geological Engineering, Key Laboratory of Western China’s Mineral Resource and Geological Engineering in Chang’an University for providing the experiment conditions.
Conflict of interest
The authors declare that the research was conducted in the absence of any commercial or financial relationships that could be construed as a potential conflict of interest.
Publisher’s note
All claims expressed in this article are solely those of the authors and do not necessarily represent those of their affiliated organizations, or those of the publisher, the editors and the reviewers. Any product that may be evaluated in this article, or claim that may be made by its manufacturer, is not guaranteed or endorsed by the publisher.
References
Administration, N. R. (2004). TB 10102-2004.Code for soil test of railway engineering. (In Chinese).
Al Shaer, A., Duhamel, D., Sab, K., Forêt, G., and Schmitt, L. (2008). Experimental settlement and dynamic behavior of a portion of ballasted railway track under high speed trains. J. Sound. Vib. 316 (1-5), 211–233. doi:10.1016/j.jsv.2008.02.055
Anderson, W. F., and Key, A. J. (2000). Model testing of two-layer railway track ballast. J. Geotech. Geoenviron. 126 (4), 317–323. doi:10.1061/(asce)1090-0241(2000)126:4(317)
Bian, X., Li, W., Hu, J., Liu, H., Duan, X., and Chen, Y. (2018). Geodynamics of high-speed railway. Transp. Geotech. 17, 69–76. doi:10.1016/j.trgeo.2018.09.007
Chen, Y., and Whalley, A. (2012). Green infrastructure: The effects of urban rail transit on air quality. Am. Econ. J.-Econ. Polic. 4 (1), 58–97. doi:10.1257/pol.4.1.58
Connolly, D., Kouroussis, G., Woodward, P. K., Costa, P. A., Verlinden, O., and Forde, M. C. (2014). Field testing and analysis of high speed rail vibrations. Soil Dyn. Earthq. Eng. 67, 102–118. doi:10.1016/j.soildyn.2014.08.013
Ditzel, A., and Herman, G. C. (2004). The influence of a rail embankment on the vibrations generated by moving trains. J. Sound. Vib. 271 (3-5), 937–957. doi:10.1016/s0022-460x(03)00772-7
Ekevid, T., Lane, H., and Wiberg, N. E. (2006). Adaptive solid wave propagation - influences of boundary conditions in high-speed train applications. Comput. Method Appl. M. 195 (4-6), 236–250. doi:10.1016/j.cma.2004.12.030
He, C., Chen, Z., and He, Q. (2018). Dynamic behaviors of high speed train running through subgrade-bridge transition section, ICRT 2017: Railway Development, Operations, and Maintenance. VA: American Society of Civil Engineers Reston, 197–206.
Howard, K. W. F., and Zhou, W. F. (2019). Overview of ground fissure research in China. Environ. Earth Sci. 78 (3), 97. doi:10.1007/s12665-019-8114-6
Huang, R.-Q., Li, Y.-R., Qu, K., and Wang, K. (2013). Engineering geological assessment for route selection of railway line in geologically active area: A case study in China. J. Mt. Sci. 10 (4), 495–508. doi:10.1007/s11629-013-2660-2
Ishikawa, T., Sekine, E., and Miura, S. (2011). Cyclic deformation of granular material subjected to moving-wheel loads. Can. Geotech. J. 48 (5), 691–703. doi:10.1139/t10-099
Jia, Z. J., Peng, J. B., Lu, Q. Z., Meng, L. C., Meng, Z. J., Qiao, J. W., et al. (2020). Characteristics and Genesis mechanism of ground fissures in Taiyuan Basin, northern China. Eng. Geol. 275, 105783. doi:10.1016/j.enggeo.2020.105783
Kollo, S. A., Puskas, A., and Kollo, G. (2015). Ballasted track versus ballastless track. Key Eng. Mater. 660, 219–224. doi:10.4028/www.scientific.net/kem.660.219
Krylor, V. V. (1994). Ground vibrations generated by superfast trains. Noise Vib. World 25 (6), 7–9. doi:10.1016/0003-682X(95)91370-I
Li, B., Atakan, K., Sorensen, M. B., and Havskov, J. (2015). Stress pattern of the Shanxi rift system, North China, inferred from the inversion of new focal mechanisms. Geophys. J. Int. 201 (2), 505–527. doi:10.1093/gji/ggv025
Momoya, Y., Sekine, E., and Tatsuoka, F. (2005). Deformation characteristics of railway roadbed and subgrade under moving-wheel load. Soils Found. 45 (4), 99–118. doi:10.3208/sandf.45.4_99
National Railway Administration of P.R.China (2022). 14th five-year railway science and Technology innovation plans.
Okumura, Y., and Kuno, K. (1991). Statistical analysis of field data of railway noise and vibration collected in an urban area. Appl. Acoust. 33 (4), 263–280. doi:10.1016/0003-682x(91)90017-9
Peng, J. B., Chen, L. W., Huang, Q. B., Men, Y. M., Fan, W., and Yan, J. K. (2013). Physical simulation of ground fissures triggered by underground fault activity. Eng. Geol. 155, 19–30. doi:10.1016/j.enggeo.2013.01.001
Peng, J. B., Fan, Z. J., Liu, C., Huang, Q. B., Liu, J. G., Ren, H. Y., et al. (2019). Experimental analysis of a high-speed-railway embankment intersecting steep ground fissures at different angles. Acta Geotech. Slov. 16 (1), 13–29. doi:10.18690/actageotechslov.16.1.13-29.2019
Peng, J. B., Meng, L. C., Lu, Q. Z., Deng, Y. H., and Meng, Z. J. (2018). Development characteristics and mechanisms of the Taigu-Qixian Earth fissure group in the Taiyuan basin, China. Environ. Earth Sci. 77 (11), 407. doi:10.1007/s12665-018-7570-8
Peng, J. B., Qiao, J. W., Leng, Y. Q., Wang, F. Y., and Xue, S. Z. (2016b). Distribution and mechanism of the ground fissures in wei river basin, the origin of the silk road. Environ. Earth Sci. 75 (8), 718. doi:10.1007/s12665-016-5527-3
Peng, J. B., Qiao, J. W., Sun, X. H., Lu, Q. Z., Zheng, J. G., Meng, Z. J., et al. (2020a). Distribution and generative mechanisms of ground fissures in China. J. Asian Earth Sci. 191, 104218. doi:10.1016/j.jseaes.2019.104218
Peng, J. B., Sun, X. H., Lu, Q. Z., Meng, L. C., He, H. Q., Qiao, J. W., et al. (2020b). Characteristics and mechanisms for origin of Earth fissures in Fenwei basin, China. Eng. Geol. 266, 105445. doi:10.1016/j.enggeo.2019.105445
Peng, J. B., Wen, F., Xi’An, L. I., Qingliang, W., Xijie, F., Jun, Z., et al. (2007). Some key questions in the formation of ground fissures in the Fen-Wei Basin. J. Eng. Geol. 15 (4), 433–440. (In Chinese).
Peng, J. B., Xu, J. S., Ma, R. Y., and Wang, F. Y. (2016a). Characteristics and mechanism of the longyao ground fissure on north China plain, China. Eng. Geol. 214, 136–146. doi:10.1016/j.enggeo.2016.10.008
Peng, J., Lu, Q., and Huang, Q. (2017). Earth fissure hazards in fen-wei basin. Beijing: Science Press.
Powrie, W., Yang, L. A., and Clayton, C. R. I. (2007). Stress changes in the ground below ballasted railway track during train passage. Proc. Inst. Mech. Eng. F-J. Rail. Rapid Transit. 221 (2), 247–262. doi:10.1243/0954409jrrt95
Priest, J. A., and Powrie, W. (2009). Determination of dynamic track modulus from measurement of track velocity during train passage. J. Geotech. Geoenviron. 135 (11), 1732–1740. doi:10.1061/(ASCE)GT.1943-5606.0000130
Shaer, A. A. (2005). Analyse des déformations permanentes des voies ferrées ballastées - approche dynamique.
Shahraki, M., Warnakulasooriya, C., and Witt, K. J. (2015). Numerical study of transition zone between ballasted and ballastless railway track. Transp. Geotech. 3, 58–67. doi:10.1016/j.trgeo.2015.05.001
Shan, Y., Albers, B., and Savidis, S. A. (2013). Influence of different transition zones on the dynamic response of track–subgrade systems. Comput. Geotech. 48, 21–28. doi:10.1016/j.compgeo.2012.09.006
Shi, P., Xu, W., and Wang, J. A. (2016). Natural disaster system in China. Berlin, Heidelberg: Springer Berlin Heidelberg, 1–36.
Smith, R. A., and Zhou, J. (2014). Background of recent developments of passenger railways in China, the UK and other European countries. J. Zhejiang Univ.-Sc. A 15 (12), 925–935. doi:10.1631/jzus.A1400295
Tan, P., Ma, J. E., Zhou, J., and Fang, Y. T. (2016). Sustainability development strategy of China's high speed rail. J. Zhejiang Univ.-Sc. A 17 (12), 923–932. doi:10.1631/jzus.A1600747
Wang, G.-Y., You, G., Zhu, J.-Q., Yu, J., and Li, W. (2016). Earth fissures in su–xi–chang region, jiangsu, China. Surv. Geophys. 37 (6), 1095–1116. doi:10.1007/s10712-016-9388-9
Wang, G. Y., You, G., Shi, B., Qiu, Z. L., Li, H. Y., and Tuck, M. (2010). Earth fissures in Jiangsu Province, China and geological investigation of Hetang Earth fissure. Environ. Earth Sci. 60 (1), 35–43. doi:10.1007/s12665-009-0167-5
Wang, G. Y., You, G., Shi, B., Yu, J., and Tuck, M. (2009). Long-term land subsidence and strata compression in Changzhou, China. Eng. Geol. 104 (1-2), 109–118. doi:10.1016/j.enggeo.2008.09.001
Xu, L. Q., Li, S. Z., Cao, X. Z., Somerville, I. D., Suo, Y. H., Liu, X., et al. (2016). Holocene intracontinental deformation of the northern North China Plain: Evidence of tectonic ground fissures. J. Asian Earth Sci. 119, 49–64. doi:10.1016/j.jseaes.2016.01.003
Yin, M., Bertolini, L., and Duan, J. (2015). The effects of the high-speed railway on urban development: International experience and potential implications for China. Prog. Plann 98, 1–52. doi:10.1016/j.progress.2013.11.001
Yueqiao, Z., Bo, H. U., Wei, S. H. I., and Changzhen, L. (2006). Neotectonic evolution of the peripheral zones of the ordos basin and geodynamic setting. Geol. J. China Univ. 12 (3), 285–297. (In Chinese).
Zang, M. D., Peng, J. B., Xu, N. X., and Jia, Z. J. (2021). A probabilistic method for mapping Earth fissure hazards. Sci. Rep. 11 (1), 8841. doi:10.1038/s41598-021-87995-1
Zhang, Y. Q., Mercier, J. L., and Vergély, P. (1998). Extension in the graben systems around the Ordos (China), and its contribution to the extrusion tectonics of south China with respect to Gobi-Mongolia. Tectonophysics 285 (1), 41–75. doi:10.1016/S0040-1951(97)00170-4
Keywords: high-speed railway, natural foundation, subgrade, ground fissure, model test, dynamic response
Citation: Wang Z, Huang Q, Xie Q, Xue L, Kang X and Gou Y (2023) Model test study on the dynamic response of high-speed railway subgrade crossing ground fissure zone. Front. Earth Sci. 11:1113718. doi: 10.3389/feart.2023.1113718
Received: 01 December 2022; Accepted: 06 January 2023;
Published: 02 February 2023.
Edited by:
Fanyu Zhang, Lanzhou University, ChinaReviewed by:
Jishan Xu, China University of Mining and Technology, ChinaTongwei Zhang, Lanzhou University, China
Copyright © 2023 Wang, Huang, Xie, Xue, Kang and Gou. This is an open-access article distributed under the terms of the Creative Commons Attribution License (CC BY). The use, distribution or reproduction in other forums is permitted, provided the original author(s) and the copyright owner(s) are credited and that the original publication in this journal is cited, in accordance with accepted academic practice. No use, distribution or reproduction is permitted which does not comply with these terms.
*Correspondence: Qiangbing Huang, aHFiQGNoZC5lZHUuY24=