 Peng Du1,2
 Dequan Zhou
95% of researchers rate our articles as excellent or good
Learn more about the work of our research integrity team to safeguard the quality of each article we publish.
Find out more
ORIGINAL RESEARCH article
Front. Earth Sci. , 06 February 2023
Sec. Environmental Informatics and Remote Sensing
Volume 11 - 2023 | https://doi.org/10.3389/feart.2023.1112568
This article is part of the Research Topic Spatial Modelling and Failure Analysis of Natural and Engineering Disasters through Data-based Methods - Volume II View all 36 articles
The mechanical properties of the gravel soil-concrete structure interface are one of the important issues in academia and engineering. In this research, gravel soil samples were collected from the Three Gorges Reservoir region to carry out simple shear and direct shear tests of the gravel soil-structure interface. The shearing process was simulated with the numerical method. The strength and deformation characteristics of the interface, the applicability of the interface constitutive model, and the failure mechanism of the interface were analyzed. The results show that: 1) The direct shear test curve of the gravel soil-concrete interface shows strain softening with obvious stress peak, while the simple shear test curve shows strain hardening. The stress peak of the direct shear test is about 30% higher than that of the simple shear test. The shear contraction effect of the simple shear test is about 31% larger than that of the direct shear test. 2) The non-linear relationship of the gravel soil-concrete interface can be described by a hyperbola model, which has a good adaptability to the constitutive relationship of the interface in numerical analysis software. 3) The gravel soil-concrete interface gradually develops shear failure from the edge to the inside. The essence of soil-structure interaction is the movement of soil grains. The research results can provide a reference for the analysis of gravel soil-concrete interaction.
During cooperative bearing and deformation of soil and structure, the interaction between them is complicated, which makes the mechanical properties of the soil near the interface significantly different from those of the soil in other regions. The mechanical response of the interface, in turn, significantly impacts the force, and deformation of the structure. Therefore, a comprehensive understanding of the mechanical behavior of the interface is very important for the analysis of the soil-structure interaction.
The interface test is an important method to reproduce the shear behavior and explore the interface mechanism. This test can be used to establish interface constitutive model and carry out numerical analysis for practical engineering. Since Potyondy (1961) introduced the interface behaviors of various soil mass and building materials, a series of sand-steel interface tests have been carried out (for example, Yoshimi and Kishida 1981; Uesugi and Kishida 1986; Uesugi et al., 1989; Fakharian and Evgin 1997; Evgin and Fakharian 1998; Li 2001; Hu and Pu 2004; Oumarou and Evgin 2005), and clay-concrete interface tests have also been conducted (for example, Kishida and Uesugi 1987; Taha and Fall 2013; Chen et al., 2015; Di Donna et al., 2016; Yavari et al., 2016; Xiao et al., 2019; Wang et al., 2020). Additionally, the effects of soil properties, the roughness of the structural surface, shear path, and test type on the mechanical properties of the interface have been analyzed. In order to explore the mechanical properties of the interface between special soil (such as unsaturated soil and frozen soil) and structure, some scholars have improved the conventional shear device and carried out a series of direct shear tests (for example, Miller and Hamid 2007; Liu et al., 2014; He et al., 2020; Shi et al., 2020). Previous studies mainly focus on the monotonic and cyclic behaviors of the interface between fine-grained soil (clay, sand) and structure (concrete, steel). Gravel soil is widely used in engineering due to its high strength, high permeability and low compressibility. However, studies on the mechanical properties of the gravel soil-concrete interface have rarely been conducted. Zhang and Zhang (2006) investigated the monotonic and cyclic behaviors of gravel soil-steel plate interface and found that the mechanical properties of the interface were significantly different from the gravel itself. Feng et al. (2018) developed a large-scale simple shear apparatus to study the three-dimensional monotonic and cyclic shear behaviors of the gravel-steel interface in two-way, cross and circular shear paths, and the results show that normal stress and shear path had significant effects on the three-dimensional interface behavior.
The interaction mechanism and failure mode of the soil-structure interface have also been investigated. Uesugi et al. (1988) introduced a method of observing the behavior of sand grains at the sand-steel interface. It was found that sand grains slid and rolled along the interface, and a shear band was formed inside the sand body during the sliding. Tsubakihara and Kishida, 1993 conducted a direct shear test on clay and steel plate and found three failure modes, namely, slip failure, shear band failure, and simultaneous slip failure and shear band failure. Hu et al. (2008) performed numerical simulations on the direct shear test of the interface and found that the stress and strain distribution on the interface was uneven, and the interface element gradually failed. Shi et al. (2015) and Sun et al. (2020) found two interface failure modes, namely, slip failure and elasto-plastic damage, by direct shear test and numerical analysis. Besides, it was found that the failure mode was related to the magnitude of the normal stress. Previous studies have extensively investigated the force mechanism of the interface, and the influencing factors and the shear failure modes. However, research on the soi-structure synergistic mechanism is still rare and needs further study.
In this research, the typical gravel soil in the Three Gorges Reservoir region was collected. The mechanical behaviors of the gravel soil-concrete interface under different normal stresses were investigated using large-scale direct shear and simple shear apparatuses. The mechanical properties obtained by the two tests were compared. The results obtained with different interface constitutive models were also compared to explore the rationality and applicability of these models. With numerical calculation and theoretical analysis, the failure mechanism and evolution process of the gravel soil-concrete interface were deeply investigated.
Landslides are serious geohazards that occur under a variety of climatic conditions (Medina et al., 2021; Fang et al., 2023), especially in the Three Gorges reservoir area of China (Guo et al., 2020). The tested soil mass was taken from Xietan, Zigui County, Hubei Province. It is composed of small soil grains and gravel. The soil mass is purple-red and has a high content of gravel grains. The soil sample is shown in Figure 1.
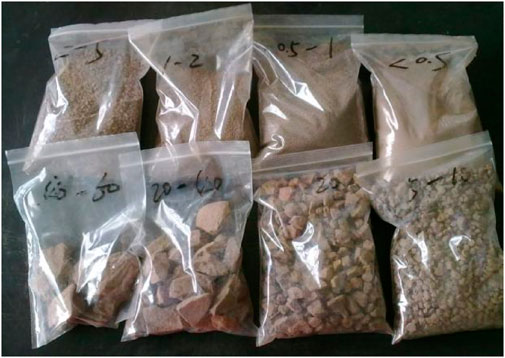
FIGURE 1. Gravel soil sample.
Particles with a maximum diameter of 60 mm are suitable for the shear apparatus used in the tests. The mass of particles with a diameter greater than 60 mm in the undisturbed sample accounts for only 0.71% of the total. Therefore, particles with a diameter larger than 60 mm were excluded by the exclusion method to obtain the grading curve, as shown in Figure 2. According to the standard for engineering classification of soil (GB/T 50145-2007, 2007), the particle with a diameter larger than 2 mm was defined as stone, and the particle smaller than 2 mm was defined as soil. The test soil sample had a stone content of 65.88% and a soil content of 34.12%, belonging to coarse-grained soil consisting of silty clay and gravel.
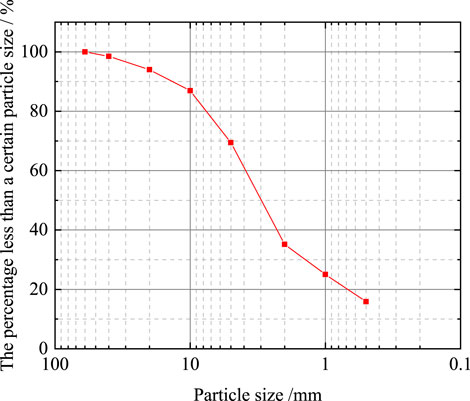
FIGURE 2. Particle gradation curve.
In order to qualitatively analyze the possible engineering properties of the gravel soil, a systematic test of its basic physical and mechanical properties was carried out. The basic physical and mechanical indexes of the test soil sample are shown in Table 1.
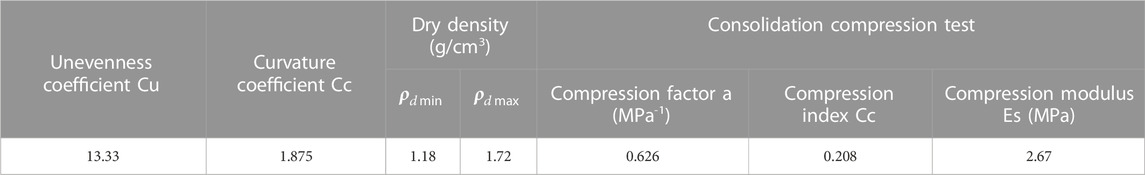
TABLE 1. Basic physical and mechanical properties of the gravel soil.
Direct shear and simple shear tests are two important methods to study the mechanical properties of the interface. Simple shear apparatus has a ten-layer stacked ring, which corresponds to the upper shear box of direct shear apparatus, and to some extent, it overcomes the shortcoming caused by the restriction on shear failure surface in direct shear apparatus. In this research, the large-scale DHJ50 type shear apparatus developed by Sichuan Huaxi Geotechnical Research Institute was applied. It has a diameter of 504.6 mm and a height of 400 mm. The reconstituted gravel soil sample was used. Its dry density was 1.6 g/cm3, and the moisture content was 7.41%. Normal stresses were set to be 100 kPa, 200 kPa and 400 kPa. The horizontal shear force was applied at a constant shear rate of 0.88 mm/min. The horizontal shear displacement and normal deformation were measured by displacement transducers arranged horizontally and vertically, respectively. The test was performed according to the Specification of Soil Test (SL237-1999, 1999). The working principle of the apparatus is shown in Figure 3. The bottom concrete cushion block and the surface concrete block are shown in Figures 4, 5 separately.
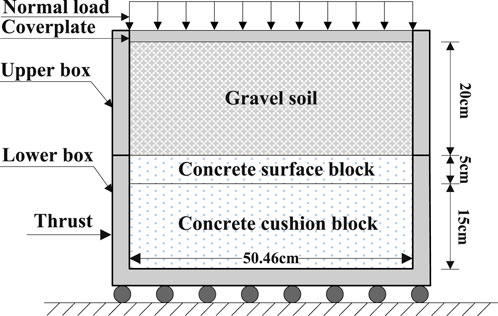
FIGURE 3. Working principle of direct shear apparatus.

FIGURE 4. Hoisting of the concrete cushion block.
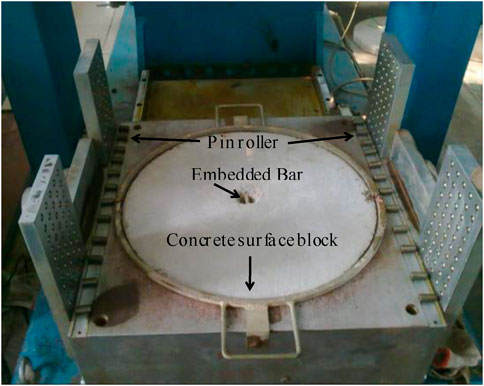
FIGURE 5. Placement of the concrete surface block.
The roughness of the structural surface has a significant impact on the mechanical properties of the interface. In order to better simulate the contact between soil and concrete, in this research, a new method for making lower box concrete test block was proposed on the basis of the conventional direct shear apparatus (Du et al., 2016). Specifically, two steel molds were prepared for pouring concrete cushion block and surface block; hoisting steel bars were pre-embedded into the concrete. In this way, the problems in concrete preparation, loading, and unloading, and replacement could be solved.
The test results show that the two test methods will affect the shear stress-shear displacement relationship curve. Since the direct shear test limits the location of the interface, with the increase in shear displacement, the shear failure surface grows, and then coalescence occurs. The shear stress decreases, and the curve shows strain softening. During the simple shear test, the upper shear box does not produce rigid constraints on the soil sample. The upper box soil deformation increases with the increase of the shear displacement, which is a gradual failure process. Since the shear strength of the soil-concrete interface is greater than that of the soil sample, shear failure often occurs in a certain range of the soil mass. As the shear displacement increases, the shear stress increases, and the curve shows strain hardening.
Under different normal stresses, the initial shear modulus, and peak shear stress of the direct shear test are significantly larger than those of the simple shear test. The peak shear stresses of the direct shear test and simple shear in Figure 6 were extracted, and the chart column of them is shown in Figure 7. It can be seen that the peak shear stress of the direct shear test is about 30% larger than that of the simple shear test.
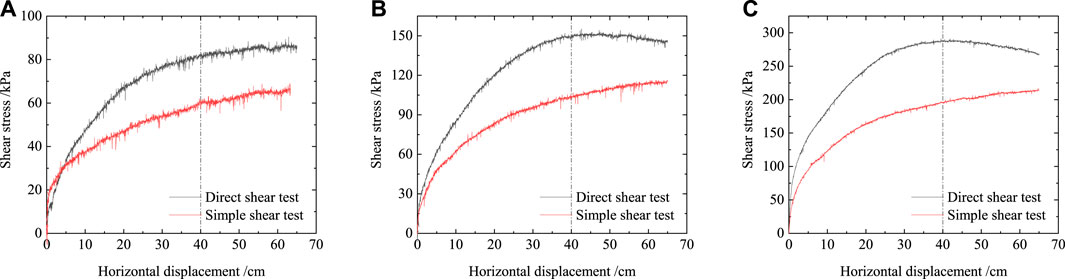
FIGURE 6. The shear stress-shear displacement relationship curve. (A) σn = 100 kPa, (B) σn = 200 kPa, and (C) σn = 400 kPa.
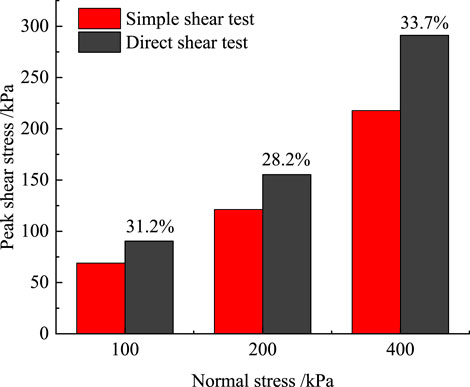
FIGURE 7. Comparison of peak stress of direct shear test and simple shear test.
Figure 8A, B show that both test methods produce a shear contraction effect, and the trends of normal displacement at different sites of the upper surface of the soil sample vary. Due to the combined effect of normal and horizontal loads, there is friction between the soil-concrete interface, which causes the soil grains to move with the lower shear box. In the direct shear test, due to the rigid constraint of the upper shear box, the movement of the soil grains is limited to a certain height above the interface. With the increase of horizontal displacement, the upper surface of the soil mass will eventually show a stable tilt state, with the left being lower than the right. The simple shear test does not restrict the failure surface. There is not only soil grain movement on the interface but also aggregate movement inside the soil sample, which effectively compresses the internal voids of the soil sample. At 40 mm of the shear displacement, the shear contraction effect of the simple shear test is 31% larger than that of the direct shear test, as shown in Figure 8C.
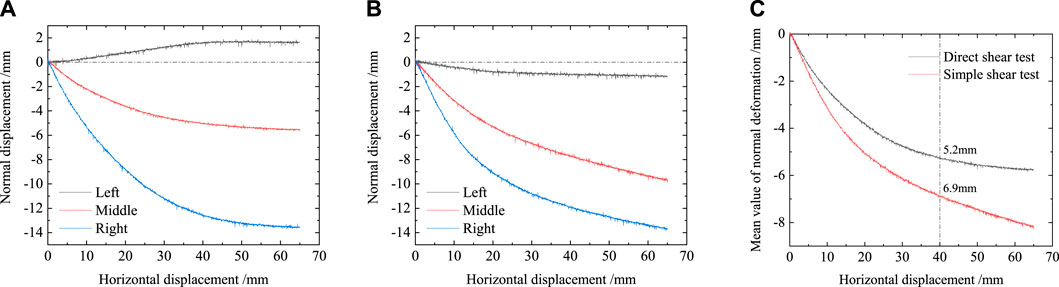
FIGURE 8. The relationship between normal deformation and shear displacement (σn =400 kPa). (A) Direct shear test, (B) Simple shear test (C) Contrast diagram of normal deformation.
C1ough and Clough and Duncan, 1971 fitted the sand-concrete direct shear test results and concluded that the relationship between the shear stress and shear displacement of the interface could be described by a hyperbola. Since it has only a few parameters and they are easy to determine, and its numerical calculation is easy, it is still widely used. The specific expression is shown in Eq. 1.
Where τ is the average shear stress; ω is the relative shear displacement of the interface; kI is the stiffness coefficient; n is the stiffness index; γw, and Pa are the unit weight of water and standard atmospheric pressure, respectively; Rf is reduction factor.The direct shear test data were fitted with the hyperbola model to determine the parameters. The results are shown in Table 2. The fitting curves and test curves were compared, as shown in Figure 9. It can be seen that the hyperbolic model can well represent the strain hardening characteristics of the interface.
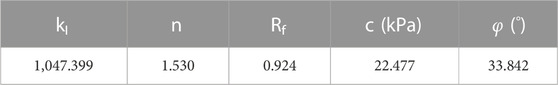
TABLE 2. Parameters of the hyperbolic model of the interface.
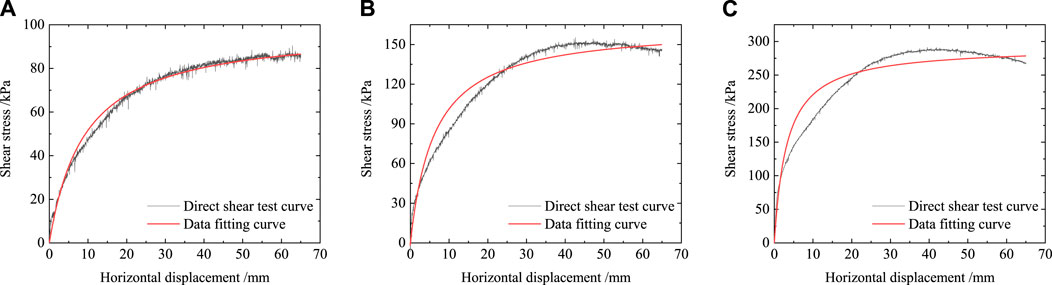
FIGURE 9. Comparison of the fitting curves and test curves between shear stress and shear displacement under different normal stresses (A) σn=100 kPa (R2=0.9911) (B) σn=200 kPa (R2=0.9675) (C) σn=400 kPa (R2=0.9443).
At the soil-structure interface, in addition to the transfer of forces, non-linear deformations such as bonding, slipping and cracking are generated. Therefore, the numerical calculation of contact problems has been a hot, and difficult issue in civil engineering. Currently, the contact mechanics method is the main analysis method of dealing with contact problems. At the soil-structure interface, the Lagrange multiplier method, and penalty function method, etc., are used to analyze the contact problem based on the balance of forces and to discretize the continuum. In this way, the contact conditions only need to be satisfied at the node instead of all touch points.
The soil mass is a cylinder with a diameter of 50 cm and a height of 20 cm. The concrete is a 70 cm × 70 cm × 20 cm rectangular body. The soil mass and concrete both adopted the C3D8R solid element. The number of soil and concrete grid cells was 2023 and 784, respectively. The three-dimensional model is shown in Figure 10. Constraints in X and Y directions were set on the sides of the soil mass; 100, 200, and 400 kPa normal stresses were applied to the upper surface of the soil mass, respectively; constraints in Y and Z directions were set on the bottom surface of the concrete; horizontal displacement load of 80 mm was applied to the sides of the concrete. Three analysis steps were set in ABAQUS: geo-stress balance, normal pressure application, and horizontal displacement load application.
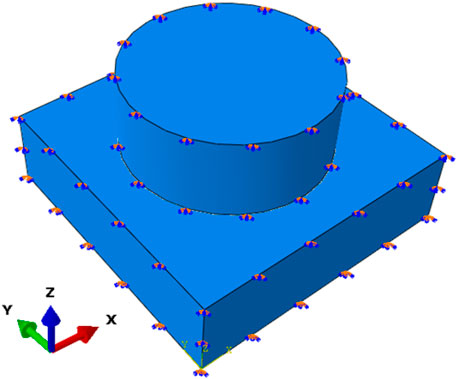
FIGURE 10. Boundary conditions of the 3D model.
The soil mass adopted the Mohr-Coulomb elastic-plastic model, and its parameters were determined according to the direct shear test. The Poisson’s ratio of gravel soil is generally 0.15–0.25. It can be found from the trial calculation that Poisson’s ratio has little influence on the calculation result of the interface (as shown in Figure 11). Therefore, Poisson’s ratio of soil was set as 0.23. According to the empirical elastic modulus E = 2.0–5.0 Es, and the comparison of trial calculation results (as shown in Figure 12), the elastic modulus was determined as 15 MPa. The mechanical parameters of the materials are shown in Table 3.

FIGURE 11. Comparison of the trial calculation results of poisson’s ratio (σn =100 kPa).
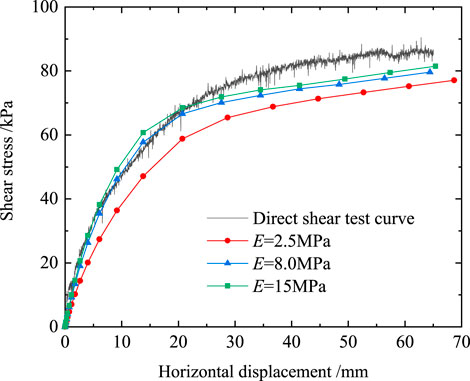
FIGURE 12. Comparison of the trial calculation results of elastic modulus (σn =100 kPa).
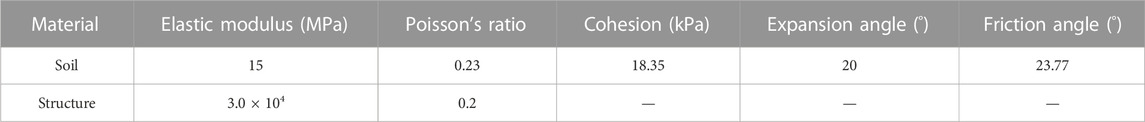
TABLE 3. The mechanical parameters of the materials.
Figures 13, 14 show the nephogram of the stress and displacement before and after the initial geo-stress balance. It can be seen that the magnitude of the stress after geo-stress balance remains unchanged, and the magnitude of the soil displacement reaches E−10(m). Therefore, the results of the geo-stress balance are regarded as reasonable, and it has little impact on subsequent analysis.
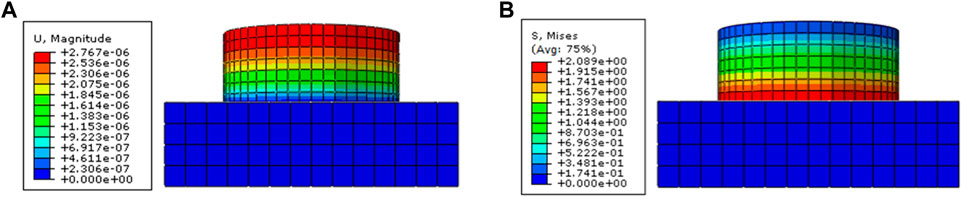
FIGURE 13. Nephogram of stress and displacement before geo-stress balance (A) Displacement and (B) Stress.
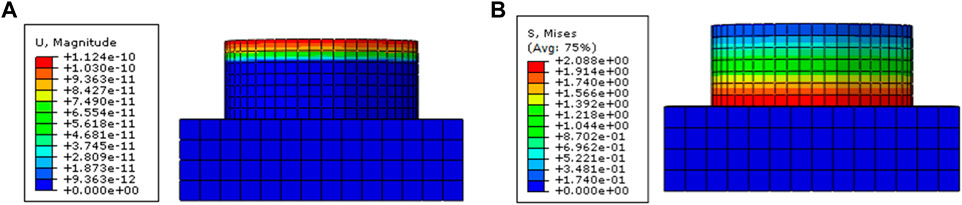
FIGURE 14. Nephogram of stress and displacement after geo-stress balance (A) Displacement and (B) Stress.
Without considering the tangential and normal coupling effects, the interaction between interfaces includes normal, and tangential actions. ABAQUS applies hard contact in the normal direction; in other words, the normal pressure can only be transmitted when the two objects are in a compression state, while no normal pressure can be transmitted when there is a gap between the two objects. Only when there is contact pressure on the interface can the interface transmit tangential force. If the tangential force is less than a certain limit value, ABAQUS regards the interface to be in a bond state; if the tangential force is greater than the limit value, the interface begins to show relative sliding deformation.
In this paper, the friction model, and hyperbolic model were applied in the tangential direction to carry out a comparative analysis. The friction model is a conventional processing method and does not consider the cohesion of the interface. Its basic formula is τcrit = μp (μ is the friction coefficient; p is the normal contact pressure). The coefficient of friction was 0.7455, obtained by fitting the shear strength relation curve of the direct shear test. The hyperbolic model can be easily realized by invoking the FRIC subroutine with ABAQUS. The basic formula is shown in Eq. 1, and the calculation parameters are determined according to Table 3.
Figure 15 shows that the numerical calculation results of both models are smaller than the results of the direct shear test. The friction model is an ideal elastoplastic model, and its calculation results deviate greatly from the experimental data. The hyperbolic model can better simulate the non-linear relationship between the shear stress and the shear displacement. Its calculation effect is better than that of the friction model. According to the Specification of Soil Test (SL237-1999, 1999), the peak stress or shear stress at the site where the shearing displacement reaches 1/15–1/10 of the sample diameter is taken as the shear strength. In this paper, the shear stress at 40 mm (1/12.5 of the sample diameter) was taken as the shear strength. The errors of different calculation models compared with the direct shear test are shown in Figure 16. It can be seen that the error of the hyperbolic model is smaller than that of the friction model. For the numerical analysis of actual engineering contact problems, the hyperbolic model is recommended since it can reflect the non-linear relationship between stress and strain. However, the soil-structure interaction force under high stress is about 16% smaller than the actual value and should be adjusted accordingly or locally strengthened.
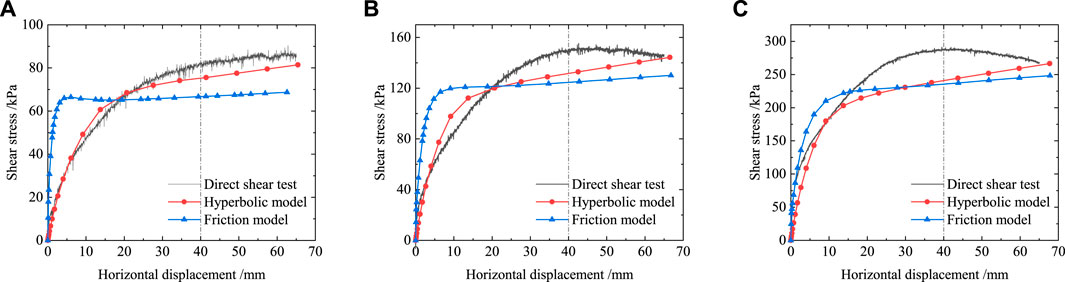
FIGURE 15. Comparison of the relation curves of shear stress and horizontal displacement under different normal stresses obtained with different methods (A) σn =100 kPa (B) σn =200 kPa (C) σn =400 kPa.
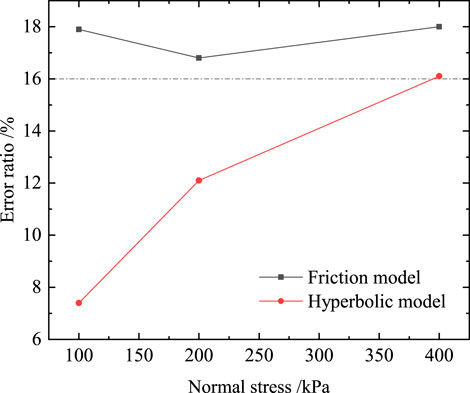
FIGURE 16. The error of different calculation models compared with direct shear test.
In this section, the numerical calculation results of the friction model are used to analyze the soil-structure interaction mechanism because of its simple mechanics principle.
According to the numerical calculation results, the distribution of the central node compressive stress along the horizontal path under the normal stress with different shear displacements ws was extracted, as shown in Figure 17. The results show that the distribution of compressive stress on the interface is uneven during the shearing process. Figure 17A shows that the compressive stress of the interface is about 100 kPa when the shearing is not started; Figures 17B–D show that with the increase of the shear displacement, the compressive stress at the middle of the interface gradually increases while that at the sides gradually decreases and show a unimodal shape. The compressive stress in the middle reaches about 400 kPa. As the shear displacement further increases, the overall compressive stress decreases and presents a bimodal shape, as shown in Figure 17E. Due to the shear contraction and boundary effects during the shearing process, the compressive stress on the left is greater than that on the right, and the wave crest is finally located in the middle to the left, as shown in Figure 17F.
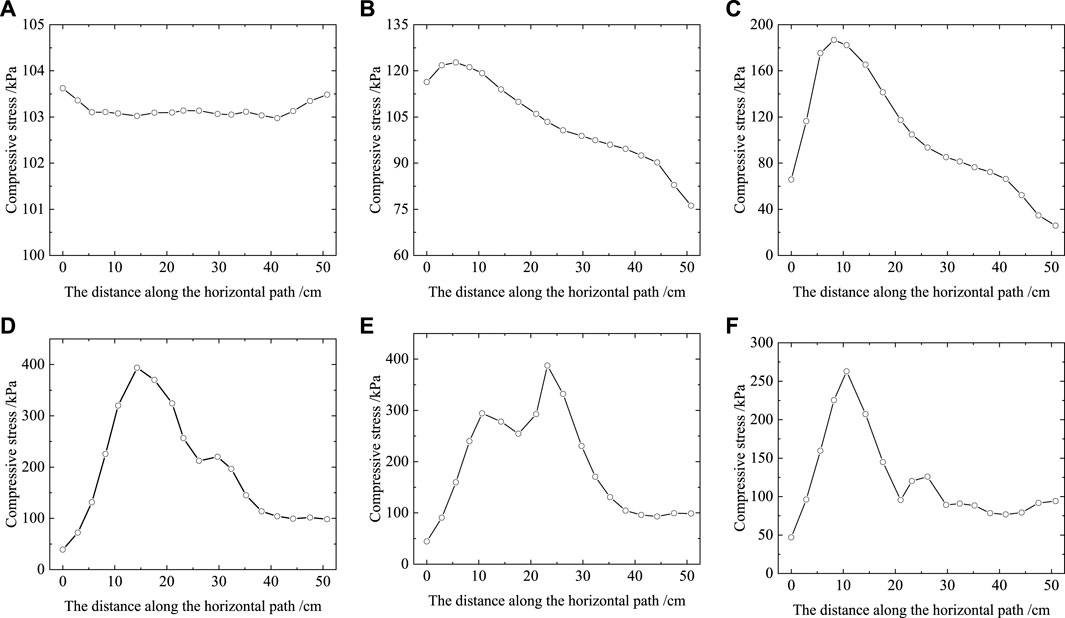
FIGURE 17. The distribution of compressive stress along the horizontal path with different shear displacements (σn=100 kPa) (A) ws=0 mm, (B) ws=0.08 mm, (C) ws=0.61 mm, (D) ws=35.5 mm, (E) ws=48.9 mm, and (F) ws=80 mm.
The critical shear stress is the critical value when the interface node transits from the bond state to the slip state. The critical shear stress is always greater than or equal to the actual shear stress. When the shear stress is smaller than the critical shear stress, the node is in a bond state and is subjected to static friction; when the shear stress increases to the critical shear stress, the node is in a slip state, and is subjected to sliding friction. Figure 18 reveals that shear failure of the interface is a progressive process from the edge to the interior (Yin et al., 1995). Figure 18C shows that the edge nodes on the sides first reach the critical shear stress and show slip failure. As the shear displacement increases, the slip failure gradually develops towards the middle, as shown in Figure 18D. When the critical shear stress curve and the actual shear stress curve completely coincide, as shown in Figure 18E, the interface shows integral slippage and coalescence of the failure; after that, the shear stress of the interface is only affected by the compressive stress of the interface.
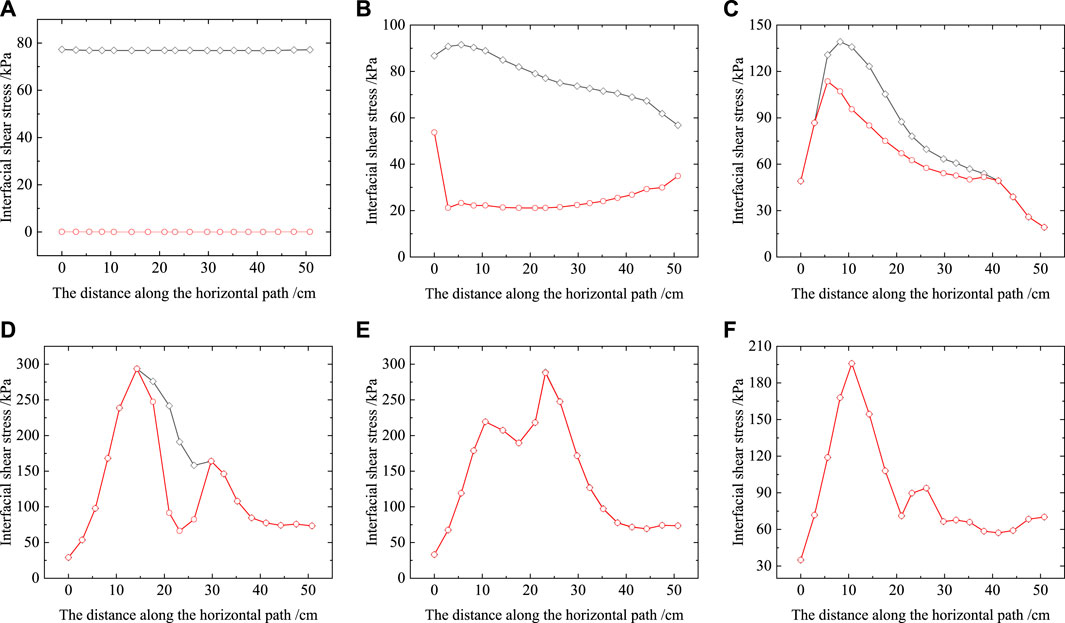
FIGURE 18. The distribution of shear stress along the horizontal path with different shear displacements (σn=100 kPa) (Black represents critical shear stress; Red represents actual shear stress) (A) ws=0 mm, (B) ws=0.08 mm, (C) ws=0.61 mm, (D) ws=35.5 mm, (E) ws=48.9 mm, and (F) ws=80 mm.
During the shearing process, the soil grains on the interface will exhibit two motion states: translation and rotation. Under the action of shear stress, the left soil grains move to the right. The right soil grains are not only subjected to the shear stress but also pushed by the left soil grains. Due to boundary constraints, the soil grains accumulate at the right; with further increase in shear stress, the soil grains on the right side of the interface will squeeze and roll upwards, and the grains inside the soil sample will also rotate upwards. Eventually, the upper box soil mass will show a tilt state with the left lower than the right, as shown in Figure 19.
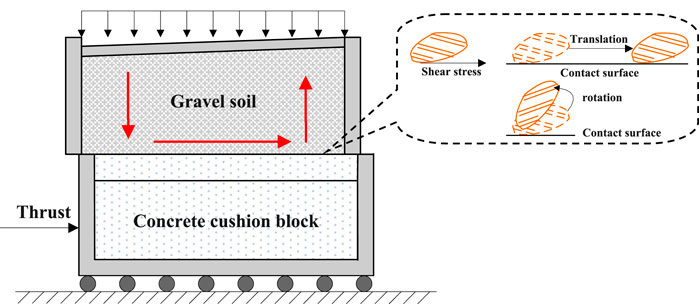
FIGURE 19. Soil grain movement during the shearing process.
The structure drives the movement of soil grains on the interface through the shear stress, which affects the size, and distribution of the compressive stress and shear stress on the interface. According to the relationship between the actual shear stress and the critical shear stress, the interface will be in a bond state or slip state. The movement of soil grains and the size and distribution of the compressive stress on the interface directly affect the shear stress of the structure on the soil. The shear stress, in turn, drives the movement of the soil grains. In this way, the soil-structure interaction is gradually formed. The evolution process is shown in Figure 20.
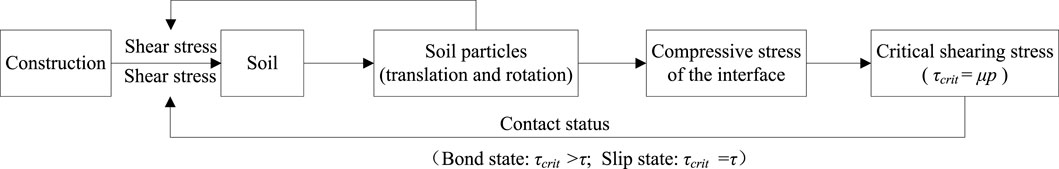
FIGURE 20. The evolution process of the soil-structure interaction.
In this paper, the interface shear test under different normal stresses is carried out with different test methods. The obtained strength and deformation characteristics of the soil-structure interface are compared and analyzed. The comparison results are combined with numerical calculations and theoretical analysis to further analyze the failure mechanism of the soil-structure interface. The following conclusions can be drawn.
(1) The direct shear test curve shows strain softening with obvious peak stress, while the simple shear test curve shows strain hardening. The peak stress of the direct shear test is about 30% higher than that of the simple shear test. The shear contraction effect of the simple shear test is about 31% larger than that of the direct shear test.
(2) The numerical calculation results of both the friction model and the hyperbolic model are smaller than those of the direct shear test. For actual engineering, the hyperbolic model is recommended since it can better describe the non-linear relationship between the shear stress and the shear displacement. However, the soil-structure interaction force is about 16% smaller than the actual value and should be adjusted accordingly or strengthened locally.
(3) The shear failure of the interface gradually develops from the edge to the interior. The essence of soil-structure interaction is the movement of soil grains. It affects the changes in the compressive stress and shear stress of the interface, and the shear stress, in turn, drives the movement of soil grains. This cycle reveals the soil-structure interaction mechanism.
Numerical simulation of soil-structure interface based on the constitutive model of gravel soil remains to be further studied in order to obtain more realistic and accurate simulation results; meanwhile, the micromechanical behavior of the soil-structure interface analyzed by the discrete element method (DEM) lacks research.
The raw data supporting the conclusion of this article will be made available by the authors, without undue reservation.
Conceptualization: PD; Data curation: PD and XL; Formal analysis: PD; Investigation: PD; Methodology: PD; Project administration: DZ; Resources: DZ; Supervision: DZ; Writing–original draft: PD; Writing–review & editing: XL and XC. All authors have read and agreed to the published version of the manuscript.
This research was funded by the Natural Science Youth Foundation of Hainan Province (Grant No. 521QN266), Postgraduate Scientific Research Innovation Project of Hunan Province (Grant No. CX20210774), Hainan Provincial Key R&D Program (Grant No. ZDYF2017097).
The authors declare that the research was conducted in the absence of any commercial or financial relationships that could be construed as a potential conflict of interest.
All claims expressed in this article are solely those of the authors and do not necessarily represent those of their affiliated organizations, or those of the publisher, the editors and the reviewers. Any product that may be evaluated in this article, or claim that may be made by its manufacturer, is not guaranteed or endorsed by the publisher.
Chen, X., Zhang, J., Xiao, Y., and Li, J. (2015). Effect of roughness on shear behavior of red clay - concrete interface in large-scale direct shear tests. Can. Geotechnical J. 52 (8), 1122–1135. doi:10.1139/cgj-2014-0399
Clough, G. W., and Duncan, J. M. (1971). Finite element analyses of retaining wall behavior. J. Soil Mech. Found. Eng. 97 (12), 1657–1673. doi:10.1061/jsfeaq.0001713
Di Donna, A., Ferrari, A., and Laloui, L. (2016). Experimental investigations of the soil-concrete interface: Physical mechanisms, cyclic mobilization, and behaviour at different temperatures. Can. Geotechnical J. 53 (4), 659–672. doi:10.1139/cgj-2015-0294
Du, P., Zhang, G. D., and Liu, X. L. (2016). Large direct shear test between soil and concrete interface. Soil Eng. Found. 30 (3), 383–386.
Evgin, E., and Fakharian, K. (1998). Cyclic rotational simple-shear behaviour of sand-steel interfaces. Soils Found. 38 (2), 191–199. doi:10.3208/sandf.38.2_191
Fakharian, K., and Evgin, E. (1997). Cyclic simple-shear behavior of sand-steel interfaces under constant normal stiffness condition. J. Geotechnical Geoenvironmental Eng. 123 (12), 1096–1105. doi:10.1061/(asce)1090-0241(1997)123:12(1096)
Fang, K., Tang, H., Li, C., Su, X., An, P., and Sun, S. (2023). Centrifuge modelling of landslides and landslide hazard mitigation: A review. Geosci. Front. 14, 101493. doi:10.1016/j.gsf.2022.101493
Feng, D. K., Zhang, J. M., and Deng, L. (2018). Three-dimensional monotonic and cyclic behavior of a gravel-steel interface from large-scale simple-shear tests. Can. Geotechnical J. 55 (11), 1657–1667. doi:10.1139/cgj-2018-0065
Gb/T 50145-2007, (2007). National standards of the people's Republic of China. Standard for engineering classification of soil. China:Ministry of housing and urban-rural development of the people's Republic of China and general administration of quality supervision. Beijing, China: Republic of China.
Guo, Z., Chen, L., Yin, K., Shrestha, D. P., and Zhang, L. (2020). Quantitative risk assessment of slow-moving landslides from the viewpoint of decision-making: A case study of the three Gorges reservoir in China. Eng. Geol. 273, 105667. doi:10.1016/j.enggeo.2020.105667
He, P., Mu, Y., Yang, Z., Ma, W., Dong, J., and Huang, Y. (2020). Freeze-thaw cycling impact on the shear behavior of frozen soil-concrete interface. Cold Regions Sci. Technol. 173, 103024–103024. doi:10.1016/j.coldregions.2020.103024
Hu, L., Ma, J., and Zhang, B. (2008). Numerical simulation of interface failure during direct shear tests. J. Tsinghua Univ. Technol. 48 (06), 943–946. doi:10.16511/j.cnki.qhdxxb.2008.06.023
Hu, L., and Pu, J. (2004). Testing and modeling of soil-structure interface. J. Geotechnical Geoenvironmental Eng. 130 (8), 851–860. doi:10.1061/(asce)1090-0241(2004)130:8(851)
Kishida, H., and Uesugi, M. (1987). Tests of the interface between sand and steel in the simple shear apparatus. Geotechnique 37 (1), 45–52. doi:10.1680/geot.1987.37.1.45
Li, B. (2001). “An experimental study and numerical simulation of sand-steel interface behavior,”. MSc thesis (Ottawa, Canada: University of Ottawa).
Liu, J., Lv, P., Cui, Y., and Liu, J. (2014). Experimental study on direct shear behavior of frozen soil-concrete interface. Cold Regions Sci. Technol. 104-105, 1–6. doi:10.1016/j.coldregions.2014.04.007
Medina, V., Hürlimann, M., Guo, Z., Lloret, A., and Vaunat, J. (2021). Fast physically-based model for rainfall-induced landslide susceptibility assessment at regional scale. Catena 201, 105213. doi:10.1016/j.catena.2021.105213
Miller, G. A., and Hamid, T. B. (2007). Interface direct shear testing of unsaturated soil. Geotechnical Test. J. 30 (3), 182–191.
Oumarou, T. A., and Evgin, E. (2005). Cyclic behaviour of a sand-steel plate interface. Can. Geotechnical J. 42 (6), 1695–1704. doi:10.1139/t05-083
Potyondy, J. G. (1961). Skin friction between various soils and construction materials. Géotechnique 11 (4), 339–353. doi:10.1680/geot.1961.11.4.339
Shi, S., Zhang, F., Feng, D., and Xu, X. (2020). Experimental investigation on shear characteristics of ice-frozen clay interface. Cold Regions Sci. Technol. 176, 103090. doi:10.1016/j.coldregions.2020.103090
Shi, X., Zhang, J. S., Liu, B., Cheng, H., and Chen, L. Q. (2015). Analysis of shear failure mode for clay-concrete interface. J. Railw. Sci. Eng. 12 (04), 790–794. doi:10.19713/j.cnki.43-1423/u.2015.04.012
Sl237-1999, (1999). Beijing, China: Ministry of Water Resources of the People’s Republic of China.Industrial standard of the People's Republic of China. Specification of soil test.
Sun, W., Wu, Y. P., Han, P. P., Jing, J., and Jiang, X. P. (2020). Study on shear mechanical properties and failure mode of collapsible loess-concrete interface. J. Lanzhou Jiaot. Univ. 39 (3), 7–12. doi:10.3969/j.issn.1001-4373.2020.03.002
Taha, A., and Fall, M. (2013). Shear behavior of sensitive marine clay-concrete interfaces. J. Geotechnical Geoenvironmental Eng. 139 (4), 644–650. doi:10.1061/(ASCE)GT.1943-5606.0000795
Tsubakihara, Y., and Kishida, H. (1993). Frictional behaviour between normally consolidated clay and steel by two direct shear type apparatuses. Soils Found. 33 (2), 1–13. doi:10.3208/sandf1972.33.2_1
Uesugi, M., and Kishida, H. (1986). Influential factors of friction between steel and dry sands. Soils Found. 26 (2), 33–46. doi:10.3208/sandf1972.26.2_33
Uesugi, M., Kishida, H., and Tsubakihara, Y. (1988). Behavior of sand particles in sand-steel friction. Soils Found. 28 (1), 107–118. doi:10.3208/sandf1972.28.107
Uesugi, M., Kishida, H., and Tsubakihara, Y. (1989). Friction between sand and steel under repeated loading. Soils Found. 29 (3), 127–137. doi:10.3208/sandf1972.29.3_127
Wang, Y. B., Zhao, C., and Wu, Y. (2020). Study on the effects of grouting and roughness on the shear behavior of cohesive soil-concrete interfaces. Materials 13 (14), 3043. doi:10.3390/ma13143043
Xiao, S., Suleiman, M. T., and Al-Khawaja, M. (2019). Investigation of effects of temperature cycles on soil-concrete interface behavior using direct shear tests. Soils Found. 59 (5), 1213–1227. doi:10.1016/j.sandf.2019.04.009
Yavari, N., Tang, A. M., Pereira, J.-M., and Hassen, G. (2016). Effect of temperature on the shear strength of soils and the soil–structure interface. Can. Geotechnical J. 53 (7), 1186–1194. doi:10.1139/cgj-2015-0355
Yin, Z. Z., Hong, Z., and Xu, G. H. (1995). A study of deformation in the interface between soil and concrete. Comput. Geotechnics 17 (1), 75–92. doi:10.1016/0266-352X(95)91303-L
Yoshimi, Y., and Kishida, T. (1981). A ring torsion apparatus for evaluating friction between soil and metal surfaces. Geotech. Test. 4 (4), 145. doi:10.1520/GTJ10783J
Keywords: gravel soil, interface, shear test, numerical calculation, evolution process
Citation: Du P, Zhou D, Liu X and Chen X (2023) Mechanical test and action mechanism of interface between gravel soil and concrete. Front. Earth Sci. 11:1112568. doi: 10.3389/feart.2023.1112568
Received: 30 November 2022; Accepted: 20 January 2023;
Published: 06 February 2023.
Edited by:
Zizheng Guo, Hebei University of Technology, ChinaReviewed by:
Jianyong Han, Shandong Jianzhu University, ChinaCopyright © 2023 Du, Zhou, Liu and Chen. This is an open-access article distributed under the terms of the Creative Commons Attribution License (CC BY). The use, distribution or reproduction in other forums is permitted, provided the original author(s) and the copyright owner(s) are credited and that the original publication in this journal is cited, in accordance with accepted academic practice. No use, distribution or reproduction is permitted which does not comply with these terms.
*Correspondence: Dequan Zhou, emRxMTMzNTc0NjMyQDE2My5jb20=
Disclaimer: All claims expressed in this article are solely those of the authors and do not necessarily represent those of their affiliated organizations, or those of the publisher, the editors and the reviewers. Any product that may be evaluated in this article or claim that may be made by its manufacturer is not guaranteed or endorsed by the publisher.
Research integrity at Frontiers
Learn more about the work of our research integrity team to safeguard the quality of each article we publish.