 Xinyi Zhang
 Chengyuan Dai1*
- 1Key Laboratory of Building New Energy and Building Energy Saving, Guilin University of Technology, Guilin, China
- 2School of Civil and Architectural Engineering, Guilin University of Technology, Guilin, China
With the sustainable development of the construction industry, recycled aggregate (RA) has been widely used in concrete preparation to reduce the environmental impact of construction waste. Compressive strength is an essential measure of the performance of recycled aggregate concrete (RAC). In order to understand the correspondence between relevant factors and the compressive strength of recycled concrete and accurately predict the compressive strength of RAC, this paper establishes a model for predicting the compressive strength of RAC using machine learning and hyperparameter optimization techniques. RAC experimental data from published literature as the dataset, extreme gradient boosting (XGBoost), random forest (RF), K-nearest neighbour (KNN), support vector machine regression Support Vector Regression (SVR), and gradient boosted decision tree (GBDT) RAC compressive strength prediction models were developed. The models were validated and compared using correlation coefficients (R2), Root Mean Square Error (RMSE), mean absolute error (MAE), and the gap between the experimental results of the predicted outcomes. In particular, The effects of different hyperparameter optimization techniques (Grid search, Random search, Bayesian optimization-Tree-structured Parzen Estimator, Bayesian optimization- Gaussian Process Regression) on model prediction efficiency and prediction accuracy were investigated. The results show that the optimal combination of hyperparameters can be searched in the shortest time using the Bayesian optimization algorithm based on TPE (Tree-structured Parzen Estimator); the BO-TPE-GBDT RAC compressive strength prediction model has higher prediction accuracy and generalisation ability. This high-performance compressive strength prediction model provides a basis for RAC’s research and practice and a new way to predict the performance of RAC.
1 Introduction
With the awakening of sustainable development awareness in the construction industry, green and low-carbon development has become an industry consensus (Spence and Mulligan, 1995; Sev, 2009; Giesekam et al., 2016; Zhang et al., 2017; Xia et al., 2018; Zhang et al., 2018). In recent decades, China’s economy and urbanisation have grown rapidly. In urbanisation, many natural resources are used for new buildings, leading to the depletion of natural resources. On the other hand, construction waste from demolishing old buildings is difficult to dispose of and causes environmental pollution. Therefore, exploring the recycling value of construction waste has become a crucial step in the sustainable development of the construction industry. Recycled aggregate concrete (RAC) is undoubtedly the best example of construction waste recycling. RAC processes waste concrete into recycled concrete aggregates, replacing NA such as sand and gravel in regular concrete. It conserves natural resources and effectively disposes of construction waste, reducing environmental pollution and land resources occupied by construction waste.
Many authors have evaluated the compressive strength of RAC, which is a valid property that has an important impact on the durability of RAC (Bai et al., 2020). The compressive strength of RAC is affected by numerous factors, such as the replacement rate of RA (Rakshvir and Barai, 2006; Gull, 2011), and the water-to-cement ratio (Meng et al., 2021; Ying et al., 2022), coarse aggregate type, coarse aggregate crushing rate, adherent mortar content, and moisture status (Shi et al., 2012; Silva et al., 2015). It is not appropriate to study influence factors independently, as the compressive strength of the RAC is a function of many interacting influence factors. However, the compressive strength of RAC is obtained by conditioning specimens for a specified period and performing tests, which are lengthy and costly in terms of the experimental period and material. There is a complex non-linear relationship between the compressive strength of RAC and the influencing factors, and new methods are needed to accurately reflect and accurately clarify the correlation between these influencing factors.
The rapid development of computer technology provides many facilities for solving engineering problems (Guo et al., 2020b; Wang et al., 2022a; Wang et al., 2022b). At the same time, machine learning (ML) technology has made great progress. With its efficient data processing capability and accurate data prediction ability, ML technology has rapidly become popular in traditional engineering. ML has been applied to predict various properties of concrete. Artificial neural network (ANN) often used to predict RAC compressive strength (Duan et al., 2013). Developed ANN models on the Matlab platform for predicting the compressive strength of concrete with different types and sources of RA. Show how the ANN model outperformed the Model Tree (MT) and Non-linear Regression (NLR) present in predicting concrete strength (Khademi et al., 2016). Used three different algorithms to predict the compressive strength of RAC, and the results showed that the ANN and adaptive neuro-fuzzy inference system (ANFIS) models could accurately predict the compressive strength of RAC. Mixes. Catherina et al. developed a prediction model for the compressive strength of recycled aggregate concrete based on the ANN and Cuckoo Search Method (CSM) algorithms (Catherina and Chella, 2021). Although ANN shows good non-linear mapping ability, it also has some areas for improvement, including slow convergence, excessive learning and local optimization, which will affect the accuracy and efficiency of prediction.
ML methods rely on hyperparameter configuration. The choice of hyperparameters directly determines the model’s performance and computation time. In hyperparameter optimization, the primary methods are the empirical method, grid search, random grid search, swarm intelligence optimization algorithm and Bayesian optimization algorithms. The advanced optimization framework Bayesian optimization algorithm was used to optimize the hyperparameters of the shear load capacity prediction model for SVR fiber-reinforced plastics (FRP) reinforced concrete members (Alam et al., 2021). The BOA-SVR model determined the optimal parameters in less time than other methods (Nunez et al., 2020). (Alhakeem et al., 2022) used a grid search method to optimize the GBRT hyperparameters to obtain a highly accurate predictive model for the compressive strength of the RAC (Guo et al., 2020a). Optimized BP models using Particle Swarm Optimization (PSO) and Grey Wolf Optimizer (GWO) to predict the non-linear relationship between random displacement and trigger factors in landslide displacement, providing a solid basis for early warning. The prediction models will have different prediction accuracies under other hyperparameter configuration methods. When the model is complex and the hyperparameters are increased, it requires a lot of computational resources and time. Exploring Various hyperparameter configuration methods has an important impact on the accuracy and modelling efficiency of the RAC compressive strength prediction model.
This paper developed XGBoost, RF, KNN, SVR and GBDT algorithm models to predict the compressive strength of RAC using hyperparameter optimization with Grid search, Random search, Bayesian optimization-Tree-structured Parzen Estimator, Bayesian optimization-Gaussian Process Regression methods. Twelve key factors, including effective water–cement ratio (weff/c), aggregate-cement ratio (a/c), RCA replacement ratio (ρ), Parent concrete strength (PCS), nominal maximum RA size (δR), nominal maximum NA size (δN), bulk density of RCA (mR), bulk density of NA (mN), water absorption of RCA (rR), water absorption of NA (rN), Los Angeles abrasion index of RCA (lR), Los Angeles abrasion index of NA (lN) were used to predict the compressive strength of RAC. The prediction accuracy of the proposed models was evaluated in terms of evaluation indicators such as the coefficient of determination (R2), mean absolute error (MAE), Root Mean Square Error (RMSE), and the RAC compressive strength prediction model with the highest accuracy was selected. At the same time, the time spent by different hyperparameter optimization methods and the degree of model optimization is calculated, and the hyperparameter optimization method with high efficiency and good results is selected. Although this paper only discusses the use of machine learning and hyperparametric optimization methods for the compressive strength of RAC, the model proposed in this paper can be easily extended to predict other mechanical capacities of RAC. Therefore, the machine learning approach proposed in this paper can be widely applied to the construction industry.
2 Machine learning methods
2.1 Support vector regression (SVR)
Support Vector Regression (SVR) (Smola and Schölkopf, 2004) is a supervised learning algorithm for predicting discrete values. The schematic diagram of the SVR algorithm is shown in Figure 1. The basic idea of SVR is to find a regression plane such that the total distance of all sample points to the plane is minimized. Achieving this goal requires mapping linearly indistinguishable low-dimensional data to a higher-dimensional space with the help of kernel functions to make them linearly distinguishable. SVR has the robustness to outliers, excellent generalization ability, strong learning ability for high-dimensional data, and high prediction accuracy (Vapnik et al., 1996; Schölkopf et al., 2000; Basak et al., 2007; Awad and Khanna, 2015) The SVR problem can be formalized as the following equation:
Where,
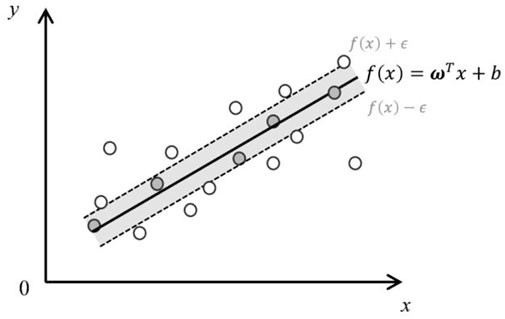
FIGURE 1. Schematic diagram of the SVR algorithm.
2.2 K-nearest neighbor (KNN)
K-Nearest Neighbor (KNN) (Peterson, 2009) is an instance-based learning model. The schematic diagram of the KNN algorithm is shown in Figure 2. The core idea of the KNN algorithm is that a sample is classified into a category if most of its K nearest neighbors in the feature space belong to that category. When using KNN to calculate the predicted value of a data point, the model selects the K nearest data points from the training data set and uses their mean values as the predicted value of the new data point. The KNN algorithm, which does not require estimation of parameters, does not require training and is simple and easy to implement (Ray, 2019; Sen et al., 2020).
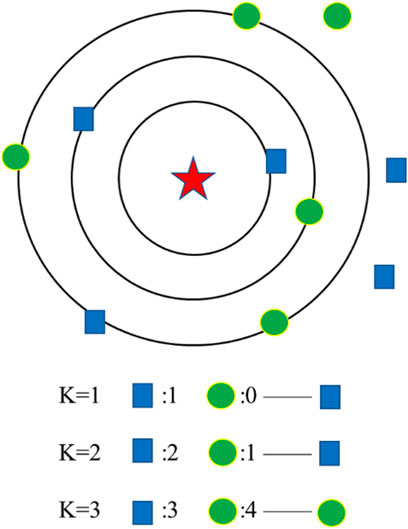
FIGURE 2. Schematic diagram of the KNN algorithm.
2.3 Random forest (RF)
Random forests (Breiman, 2001) are ensemble learning algorithms that contain multiple decision trees. The schematic diagram of the RF algorithm is shown in Figure 3. The decision trees are grown randomly, and a randomly selected fraction of the samples brought back for release from the training data is used to construct the decision trees. Similarly, a portion of the features is randomly selected for training. Each tree has different samples and features, and the result differs. When dealing with classification problems, the random forest prediction category is the plurality of the class to which the random forest prediction sample units belong. When dealing with regression problems, the output value is the average of all tree predictions. The random forest algorithm takes less time, is less prone to overfitting, can handle high-dimensional data with more features, and is the algorithm with higher accuracy (Liu et al., 2012; Yuan et al., 2022).
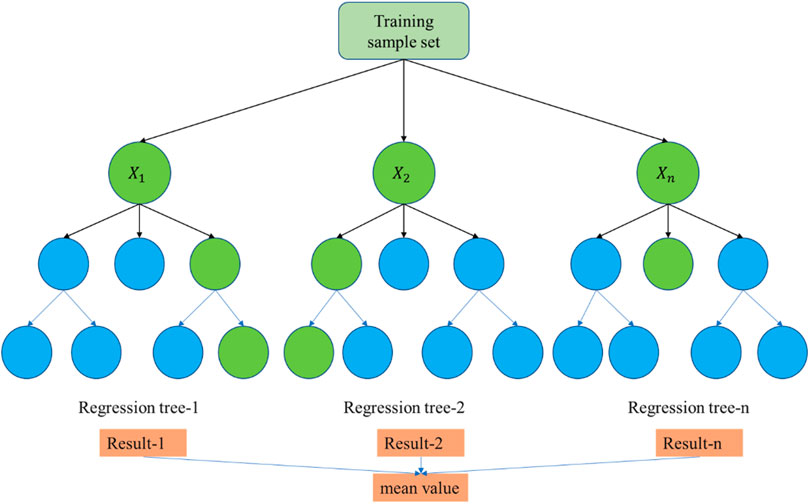
FIGURE 3. Schematic diagram of the RF algorithm.
2.4 Gradient boosting decision tree algorithm (GBDT)
Gradient Boosting Decision Tree (Friedman, 2001), which is a representative algorithm in boosting and the most used ML algorithm in the industry. The schematic diagram of the GBDT algorithm is shown in Figure 4. GBDT can flexibly handle various types of data, including continuous and discrete values, and has the advantages of high efficiency, nominal missing values, easy model construction, high training accuracy, and good generalization ability. GBDT consists of two parts: Decision Tree (Quinlan, 1986), and Gradient Boosting (Freund et al., 1999).
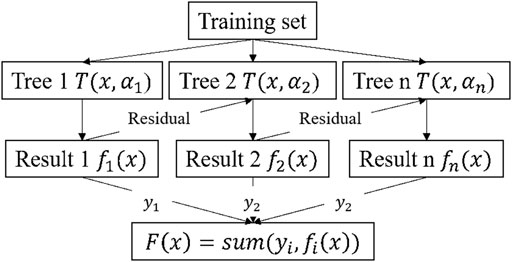
FIGURE 4. Schematic diagram of the GBDT algorithm.
The value of the negative gradient of the loss function in the current model is used as an approximation of the residuals of the boosted tree algorithm in the regression problem. That is, the iterative decision tree uses the residuals formed after the result of the previous tree construction as input data to construct the next subtree when constructing trees; the final prediction results are obtained by accumulating the subtree prediction results in the order of construction (Liang et al., 2020).
2.5 Extreme gradient boosting algorithm (XGBoost)
Extreme Boosting Tree (XGBoost) (Chen and Guestrin, 2016) is an ensemble algorithm based on Decision Trees, an upgrade of the Gradient Boosting Decision Tree algorithm. By constructing weak learners, continuously iterating to reduce the residuals of the last iteration, and accumulating the results of multiple weak learners as the final prediction output, XGBoost achieves a balance between the accuracy and complexity of the Tree model through loss functions and regularization items. At the same time, it greatly reduces the complexity of the model and improves the efficiency of the model operation (Li and Chen, 2020; Liang et al., 2020).
XGBoost is a ML algorithm based on the additive model framework, which uses a forward distribution algorithm and Regression Trees as the base learners. An optimal solution is sought for each Regression Tree to gradually approximate the optimal loss function. Expressed as Eq. 3 (Friedman, 2001).
Where,
In the XGBoost algorithm, the objective function is specific to each tree. For an arbitrary tree, the objective function has two components; one is an arbitrarily differentiable loss function that controls the empirical risk of the model. The remaining component contains the model complexity. Expressed as Eqs. 4, 5 (Chen and Guestrin, 2016).
Where,
Splitting the objective function with the sample as the objective into one with the leaf nodes as the objective and substituting the second-order Taylor expansion formula into the objective function yields (Chen and Guestrin, 2016):
Where,
Minimize the objective function to obtain the predicted values of leaf nodes; minimize the objective function
The key problem of the decision tree growth process is how to split the nodes. The XGBoost algorithm adopts a greedy strategy. For each leaf node division, the structural fraction gain is calculated, and the point with the largest gain is selected for branching. Expressed as Eq 10 (Chen and Guestrin, 2016).
Where
2.6 Hyperparameter configuration method
Grid search (GS) and random search (RS) (Feurer and Hutter, 2019) are the most common hyperparameter configuration methods. The schematic diagram of GS and RS is shown in Figure 5. GS brings all parameter combinations in the parameter space into the model for training and finally selects the best-performing hyperparameter combination (Bergstra et al., 2011). The larger the parameter space, the greater the arithmetic power and time required for GS. The computational effort needed for grid search increases exponentially when the parameter dimension rises. RS does not use the whole hyperparameter space and constructs a parameter subspace using partial parameter combinations to search within the subspace, which improves the computational speed yet ensures the accuracy of the search. For high-dimensional data, random search is more effective than grid search.
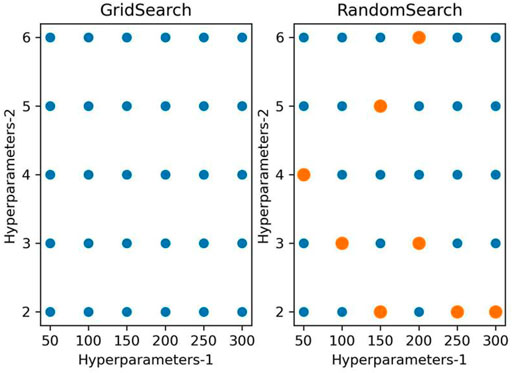
FIGURE 5. Schematic diagram of GS and RS.
Unlike the enumeration idea of GS and RS, Bayesian Optimization (BO) is based on the a priori idea. The core idea of BO is to use the prior probability of the objective function and known observation points to update the posterior probability distribution and then find the next minimal value point with a more posterior probability distribution and get the optimal hyperparameter after numerous iterations. The later hyperparameters are taken based on the results of the previous hyperparameters so that the best combination of hyperparameters can be configured in less time.BO is an application of machine learning automation that aims to configure hyperparameters automatically to achieve the best performance and reduce the human effort required to apply machine learning (Bergstra and Bengio, 2012; Eggensperger et al., 2015).BO can be expressed as the following equation:
where
The key steps in BO are the probabilistic surrogate model and the acquisition function. The probabilistic proxy model builds a probability distribution model based on the existing history data; the acquisition function is used to select the basis for the next parameter combination and continuously adds different parameter combinations to the probabilistic surrogate model until the maximum number of iterations is reached.
The main difference between different Bayesian optimization methods lies in the probabilistic agent models and collection functions, main including Gaussian process (GP), and tree-structured Parzen estimators (TPE) models (Ozaki et al., 2020).
GP brings much convenience to modeling tasks in machine learning and statistics, and it can be used to specify functional distributions without the need for a specific functional form (Rasmussen and Nickisch, 2010). Assume that the hyperparameters to be optimized are
From Bayes theorem:
The optimal hyperparameters are finally obtained by continuously updating the iteration to make
TPE utilizes tree-structured adaptive Parzen estimators that handle discrete, categorical, and conditional variables with lower computational complexity than GP (Rasmussen, 2003). It shows better performance in complex parameter search space problems (Bergstra et al., 2013). The procedure is as follows.
Where
The collection function chosen for the TPE model is EI, defined as follows:
Let
The process of determining the next sampling point is achieved by maximizing the EI function. Eq. 12 indicates that the maximum EI value is obtained when the hyperparameter
3 Experimental process
3.1 Experimental framework
The RAC compressive strength prediction model’s core is to use Python to access the database of RAC compressive strength, train the XGBoost, RF, KNN, SVR, and GBDT models, and then use cross-validation and the Hyperparameter configuration method (GS, RS, BO-TPE, BO-GPR) to optimize the hyperparameters in the specified hyperparameter space to produce a high-precision RAC compressive strength prediction model. The specific process is as Figure 6.
Step 1: The Experimental data of RAC compressive strength were collected to train the prediction model.
Step 2: Using Python to call the XGBoost, RF, KNN, SVR and GBDT module in the machine learning library, input the data into the model for training without adjusting the hyperparameters, and then use the model to fit the test set data to see the prediction effect.
Step 3: Hyperparameter tuning of the models. Hyperparameter optimization is performed on the XGBoost model and RF model, KNN model, SVR model, and GBDT model using 10-fold cross-validation combined with the Hyperparameter configuration method in the training set.
Step 4: The optimized hyperparameters are input to each model for training. The test set data are input to the trained models, and the accuracy and generalization ability of the models are verified by calculating R2, RMSE and MAE to compare the performance of different models.
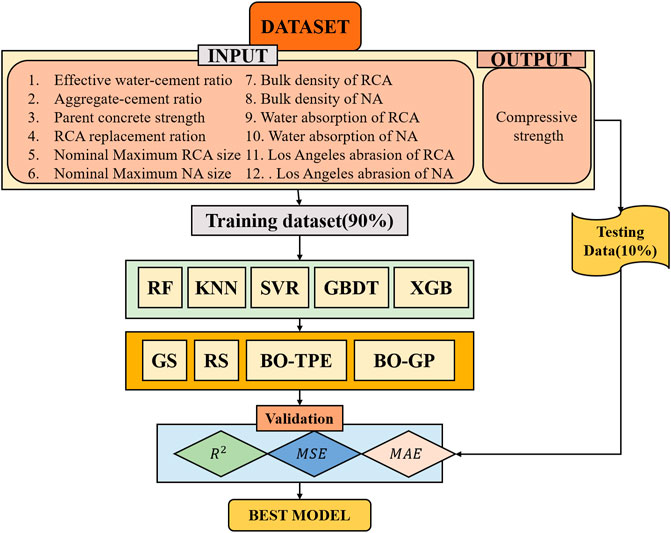
FIGURE 6. Framework of compressive strength prediction model of RAC.
3.2 Experimental procedure
3.2.1 Data analysis
Various studies have investigated the compressive strength (CS) of RAC. As a result, an extensive dataset with experiments on the CS of RAC was recently assembled in reference (Yuan et al., 2022). 521 of these data were selected for training and testing the machine learning model. Twelve key factors, including effective water–cement ratio (
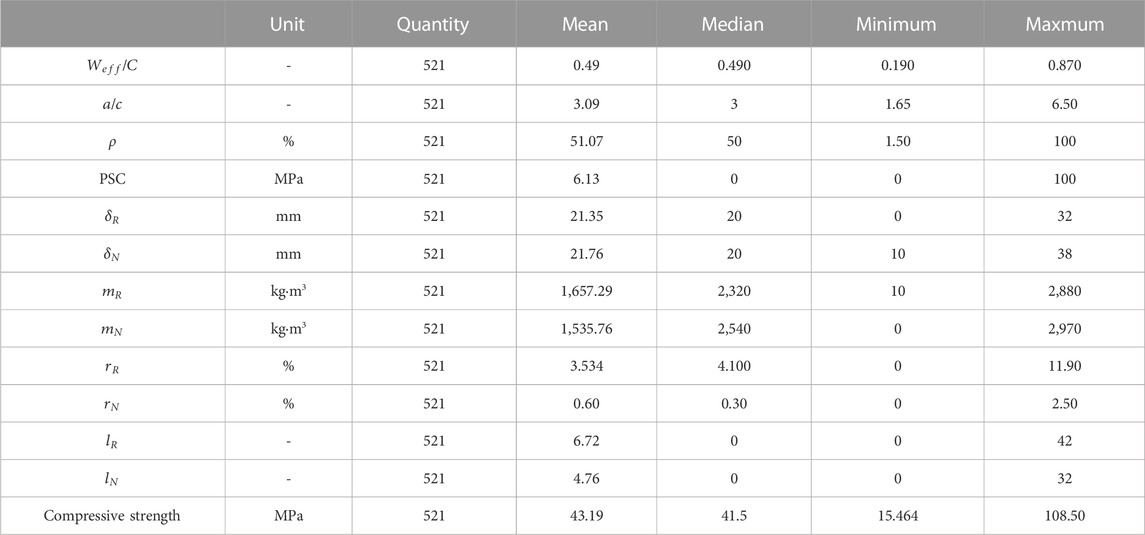
TABLE 1. Description of data used in this study.
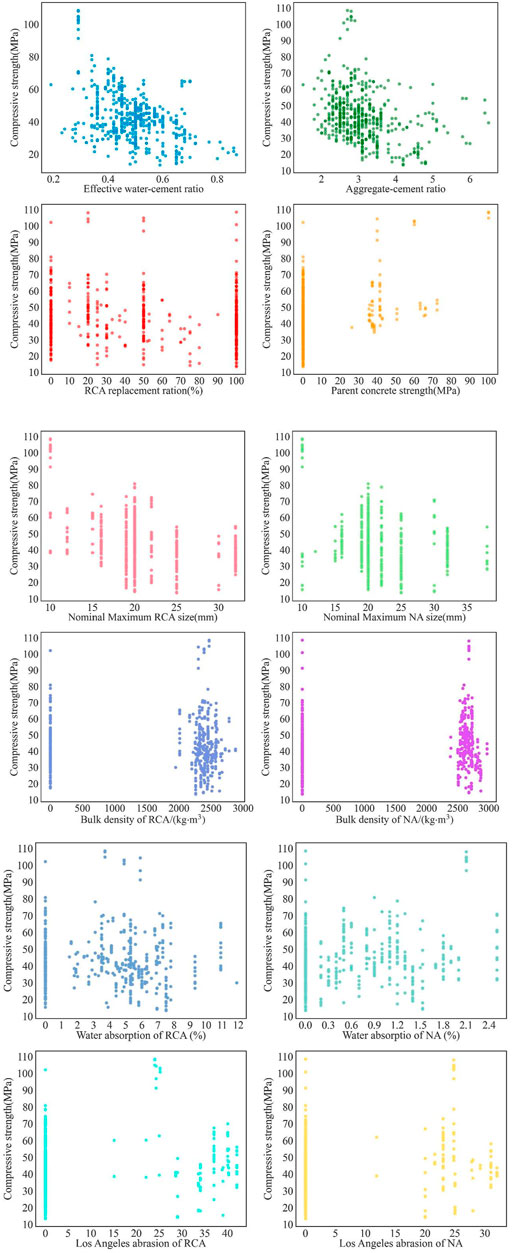
FIGURE 7. This paper uses data distribution.
Figure 8 illustrates the multiple correlation matrix of the input parameters and outputs used in this study. The shades of color indicate the magnitude of the correlations. Among the input variables, the highest correlation was found between bulk density of RCA (
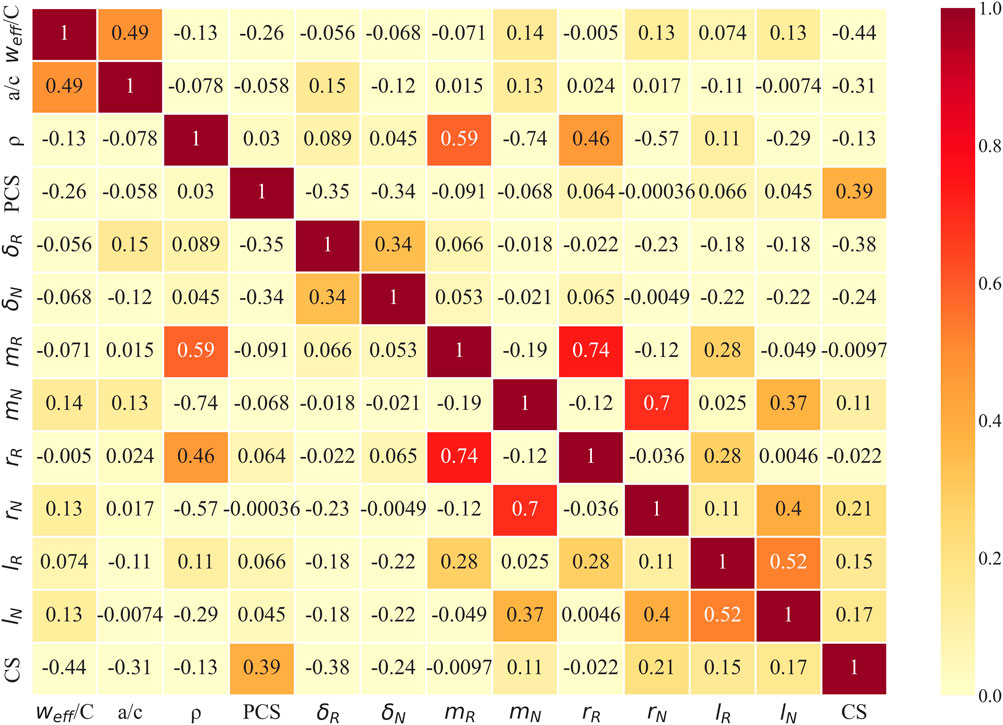
FIGURE 8. Input parameter data distribution Multi-correlation matrix of the input parameters and output.
3.2.2 Hyperparameter configuration
The grid search algorithm brings all the parameter combinations in the parameter space into the model for training. The grid search algorithm traverses each parameter combination, which consumes a lot of computational resources; the random grid search selects some parameter combinations as “subspace” by non-relaxed sampling and searches only these parameter combinations. The hyperparameter combinations are shown in Table 2. Bayesian optimization is a state-of-the-art automated method for tuning parameters, which proceeds as follows:
Step 1: According to the determined parameter space, randomly generate hyperparameter combinations
Step 2: The sample points are classified as good or poor based on the prediction accuracy dataset, and an agent model is built.
Step 3: The next set of hyperparameter sampling points
Step 4: If the cross-validation assessment index meets the requirements,
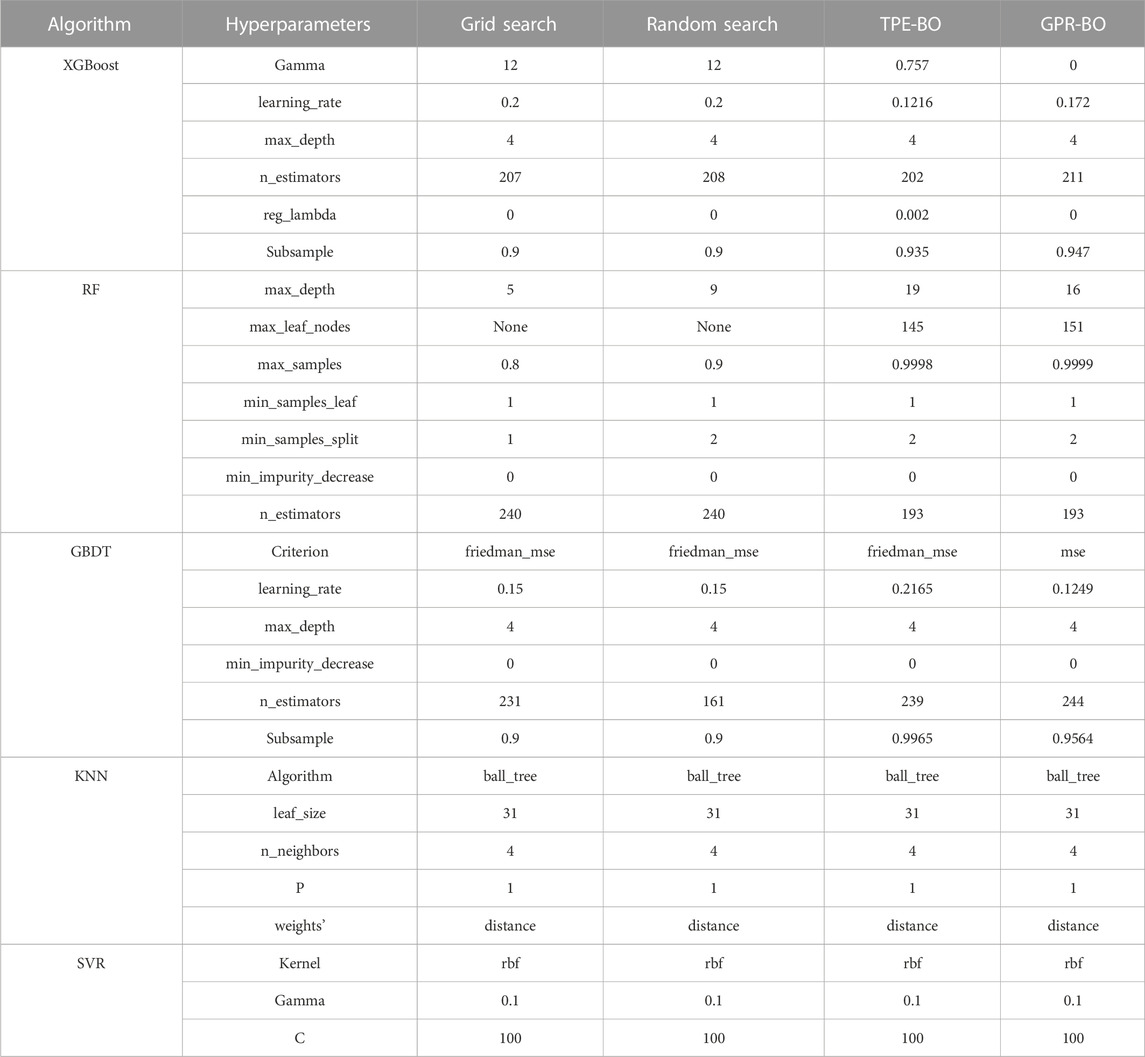
TABLE 2. The optimal combination of super parameters of prediction models determined under different hyperparameter configuration methods.
3.2.3 Model evaluation
After the prediction model is built, its performance needs to be evaluated. The model evaluation indexes used in this paper are: correlation coefficient (R2), Root Mean Square Error (RMSE), and mean absolute error (MAE). Of these, R2 judges the feasibility and linearity of the model; MAE reflects the mean of the absolute errors between the predicted and actual values; RMSE represents the square root of the second order sample moments of the difference between the predicted and observed values, the equation is as follows:
Where:
4 Results and analysis
4.1 Analysis of the impact of hyperparametric configuration methods on model performance
The grid search hyperparameters consume more computational resources for the same parameter space. Therefore, the grid search hyperparameter space is smaller than the Bayesian optimization hyperparameter space. The grid search hyperparameter space is the same as the random search hyperparameter space. This makes it easier to compare how different hyperparameter optimization methods affect how well a model works. Moreover, the number of iterations is the same for Gaussian Process (GP)-based Bayesian optimization and TPE-based Bayesian optimization, which is 1,000 iterations. The optimization effect of the hyperparameter configuration method in different models is shown in Figure 9 and Table 3.
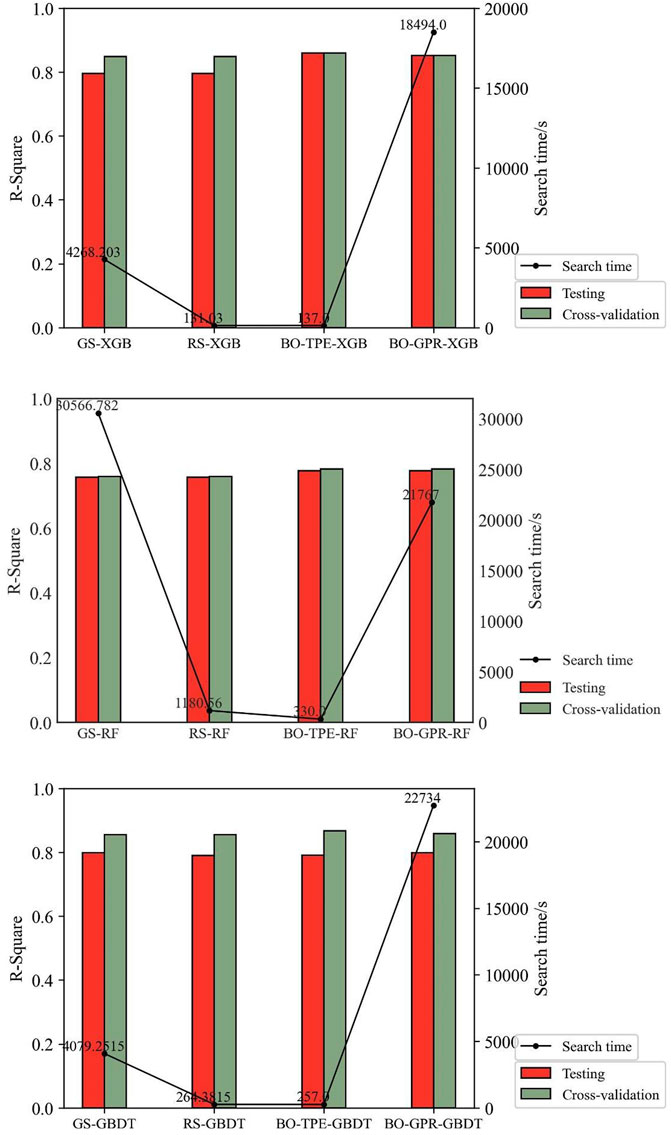
FIGURE 9. Optimization Effect of Hyperparameter configuration Method in Different Models.
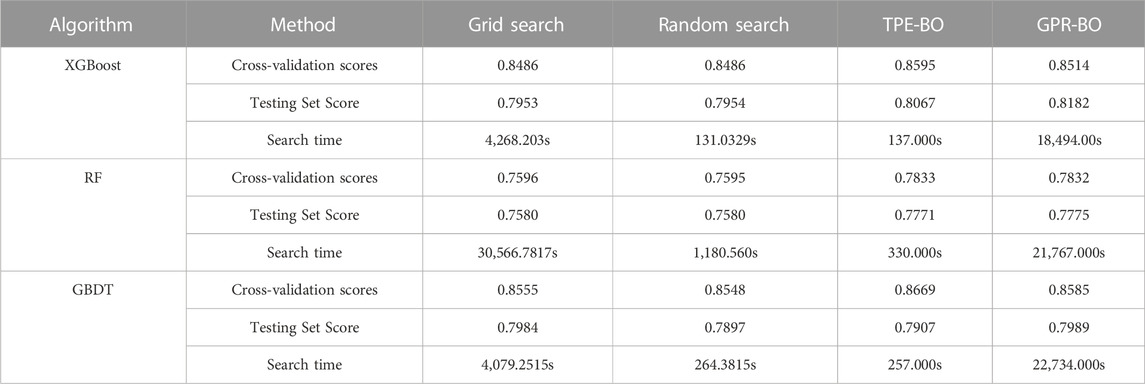
TABLE 3. Performance comparison of prediction models under different hyperparameter optimization methods.
The grid and the random search methods are essentially enumerative, with a similar combination of hyperparameters searched and not much difference in cross-validation scores. However, because the search space of random search is only a subspace of the full domain space, the hyperparameter search time is substantially reduced compared with grid search, and the speed of random search is 15–32 times faster than grid search in this experiment. The larger the hyperparameter search space and the more complex the model, the more significant the difference in search time between the two. The performance of the prediction models under TPE-based Bayesian optimization was better than that of the grid search method and the random grid search method, and the fit of the XGBoost, RF, and GBDT models increased by 0.00109, 0.0238, and 0.004, respectively. The performance of the prediction models under TPE-based Bayesian hyperparameter optimization was better than that of GPR-based Bayesian hyperparameter optimization. In the prediction models under Bayesian hyperparameter optimization, the degree of fit of XGBoost, RF, and GBDT models increased by 0.0081, 0.0001, and 0.0084 in turn, and was faster, with the average search time of the TPE method being about 241 s and the average search time of the GPR method being 20,998 s. In this experiment, the TPE-BO hyperparameter optimization method reduced the search time by a factor of 65–134 compared to the GPR-BO method.
4.2 Comparative analysis of the performance of different models
The comparison graphs of the predicted values of different models are shown in Figure 10. All the following prediction models adopt BO-TPE super-parameter configuration method. As seen from the figure, the predicted values of the SVR prediction model deviate significantly from the actual values. In each prediction model, the predicted values of sample 12 and sample 44 deviated substantially from the true values, with a relative error of up to 140%, possibly because the sample was an outlier. Excluding the above abnormal samples, the KNN prediction model is unstable, with a minimum relative error of 3.18% and a maximum relative error of 39.62% between the predicted and true values; the deviations between the predicted and true values of the XGBoost, RF and GBDT models were relatively small, with an average relative error of 12.2%, 13.02%, and 10.94% for each model respectively; the minimum relative error between the predicted and actual values was 0.24% for the XGBoost model, 0.16% for the RF model and 0% for the GBDT model. Ensemble learning models outperform individual learning models, and the GBDT model has the smallest deviation from the true value and the highest prediction accuracy of any Ensemble learning model.
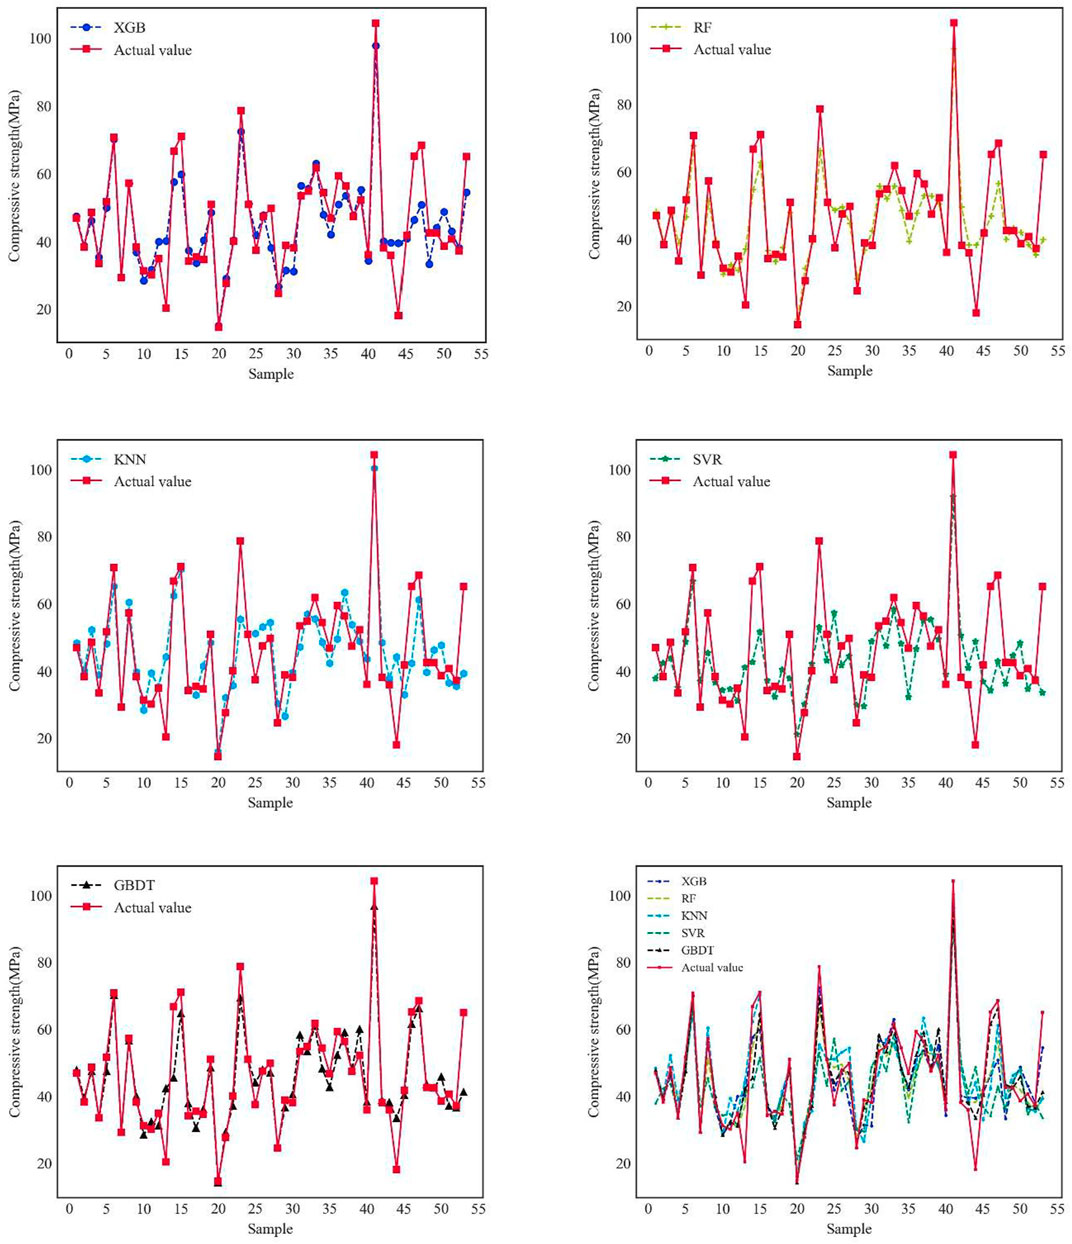
FIGURE 10. Comparison of predicted values of models.
As seen in Table 4, Figure 11, the cross-validation R2 score for the GBDT model was the highest, being 0.0074, 0.0836, 0.1925, and 0.317 more heightened than the XGB, RF, KNN, and SVR models, respectively. Therefore, the GBDT model has better fitting and generalization capabilities, followed by the XGBoost model, RF model, KNN model, and SVM model. The cross-validation R2 scores and training set R2 scores of the XGBoost, SVR, and GBDT models were all higher than the test set scores, which shows that the overall prediction effect of the models was higher than the prediction effect in the test set, and the models did not predict well in this randomly selected test set. The cross-validation R2 scores and training set R2 scores of the RF and KNN models were not significantly different from the test set scores. The model normally performed in prediction on this randomly selected test set. The XGBoost, RF, and GBDT models have smaller differences between training set R2 and test set R2 than the other models. Their generalization error and empirical error balance are higher than the other models. The single model learning has higher empirical risk and easy overfitting compared to integrated learning (XGBoost, RF, GBDT); The training set R2 of the KNN model is larger than the test set, and the training set R2 of the SVR model is smaller than the test set R2. The SVR model may have structural risk.
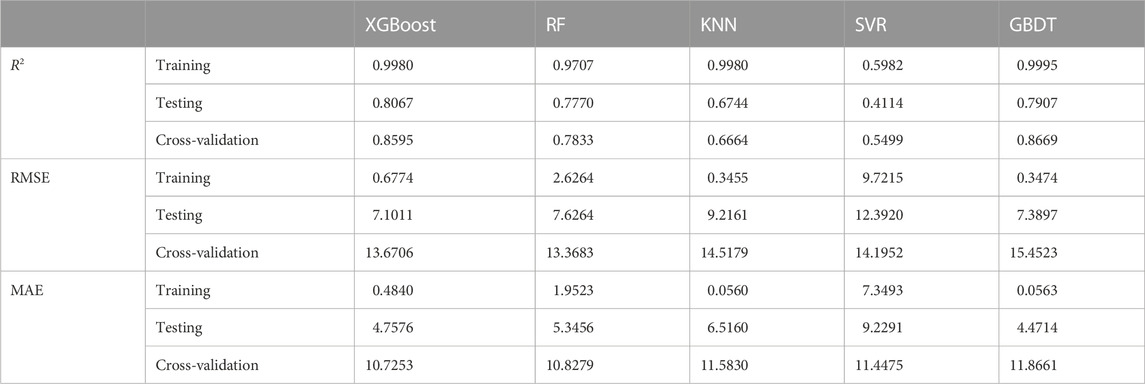
TABLE 4. Performance comparison of prediction models of different RA concrete.
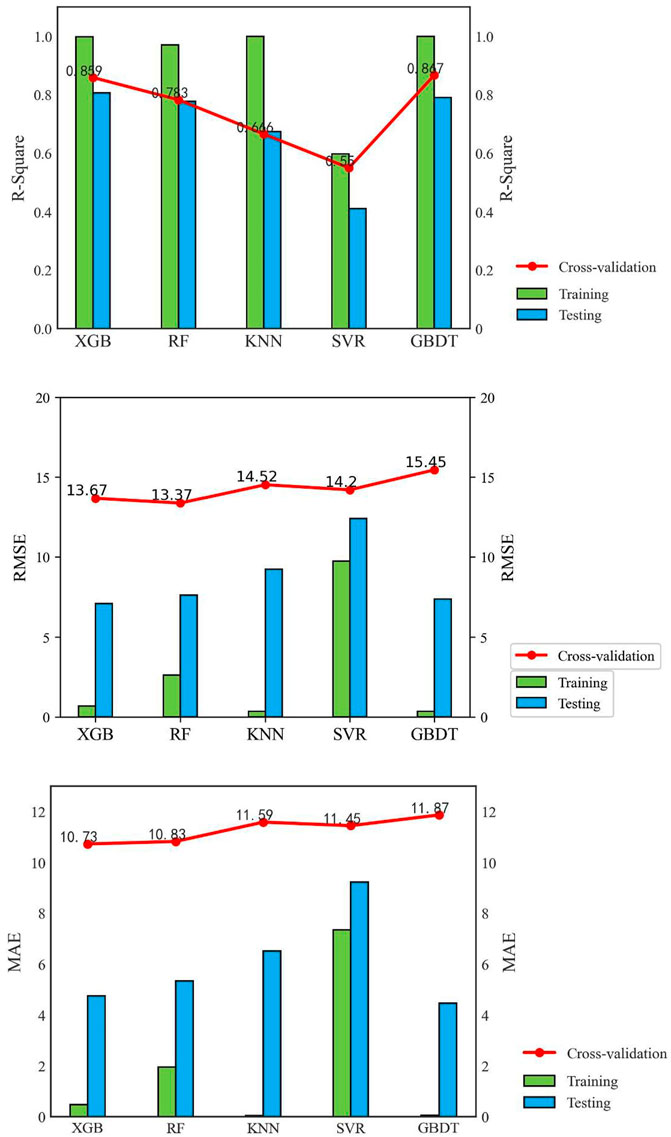
FIGURE 11. Comparison of model prediction performance.
The RMSE evaluates the degree of variability in the data, with smaller values of RMSE indicating that the predictive model describes the experimental data with better accuracy. The prediction models in descending order of RMSE are the RF model, XGBoost model, SVR model, KNN model, and GBDT model with RMSE of 13.37, 13.47, 14.2, 14.52, and 15.45, respectively. The RF, SVR, and XGBoost models have better data description capability. The KNN and GBDT models have a large RMSE and may be affected by outliers.
The MAE indicator avoids the problem of forecast deviations and true values canceling each other out. The MAE of each model was not very different, and the smallest XGBoost model. The MAE of the XGBoost model was smaller than the RF model, KNN model, SVR model, and GBDT model by 0.1, 0.86, 0.72, and 1.14 respectively.
The average R2 of the cross-validation set for each prediction model is smaller than the training and validation sets, and the average RMSE and MAE are larger than the training and validation sets. The possible reasons for this are 1. The small size of the recycled coarse aggregate concrete sample data; 2. Insufficient relevant features given about recycled coarse aggregate concrete; and 3. The presence of outliers in the collected data. Collecting additional data and features for model training and improving the model’s generalization capability is necessary.
4.3 Feature sensitivity analysis
The objectives of the work are to 1) Determine the importance of each input parameter to the compressive strength of the RAC (Medina et al., 2021). 2) Quantitatively calculating the importance of different features affecting the compressive strength of RAC helps to understand the intrinsic mechanism of the compressive strength of RAC. XGBoost prediction model ranks the importance of different features affecting the strength of concrete, and their results are shown in Figure 12.
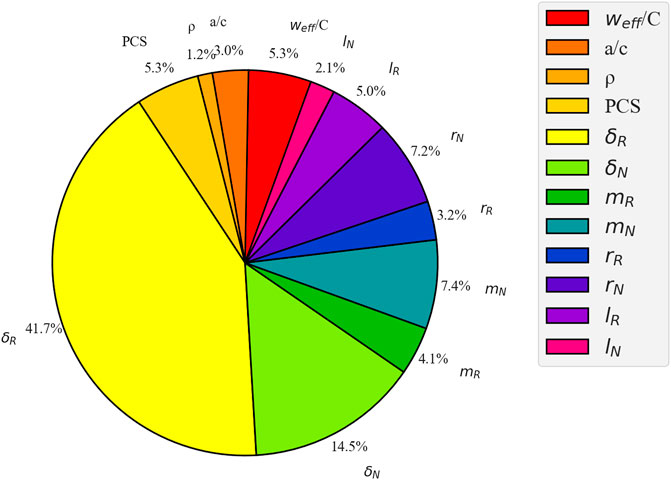
FIGURE 12. Ranking of feature importance of XGBoost Model.
The feature importance ranking in the XGBoost prediction model is nominal maximum RA size (
5 Conclusion
In this study, Bayesian optimization methods were used to tune the hyperparameters of the machine learning model to predict the non-linear relationship between the compressive strength of the RAC and the relevant influencing factors. The following conclusions were drawn:
(1) Based on the TPE-BO hyperparameter optimization method, the performance of the RAC compressive strength prediction model is effectively improved, and the efficiency is higher than other hyperparameter optimization methods.
(2) The TPE-BO optimized model was put to predict the compressive strength of RAC, and the TPE-BO-GBDT model obtained a higher prediction accuracy with a 10-fold cross-validation R2 = 0.8669 when comparing the R2, RMSE, and MAE of different models.
(3) The ranking of the importance of the features affecting the compressive strength of RAC are:
Although this paper only discusses the use of machine learning combined with Bayesian optimization in predicting the compressive strength of RAC, the TPE-BO optimization machine learning approach proposed in this paper can be extended to predict the mechanical properties of other types of concrete. In future work, we will collect more RAC experimental data and related influencing factors and try more hyperparameters optimization methods, such as PSO, GWO algorithm, and Differential Evolution (DE), to improve the accuracy and efficiency of the model prediction.
Data availability statement
Publicly available datasets were analyzed in this study. This data can be found here: https://www.mdpi.com/article/10.3390/ma15082823/s1.
Author contributions
ZX carried out the main writing of the article and the content of numerical test. DC revised the structure of the article and provided financial support. LW and CY has sorted out the references and layout of the article.
Funding
This research was completed under the support of the GuangXi Key Laboratory of New Energy and Building Energy Saving.
Conflict of interest
The authors declare that the research was conducted in the absence of any commercial or financial relationships that could be construed as a potential conflict of interest.
Publisher’s note
All claims expressed in this article are solely those of the authors and do not necessarily represent those of their affiliated organizations, or those of the publisher, the editors and the reviewers. Any product that may be evaluated in this article, or claim that may be made by its manufacturer, is not guaranteed or endorsed by the publisher.
References
Ahmad Bhat, J. (2021). Effect of strength of parent concrete on the mechanical properties of recycled aggregate concrete. Mater. Today Proc. 42, 1462–1469. doi:10.1016/j.matpr.2021.01.310
Alam, M. S., Sultana, N., and Hossain, S. Z. (2021). Bayesian optimization algorithm based support vector regression analysis for estimation of shear capacity of FRP reinforced concrete members. Appl. Soft Comput. 105, 107281. doi:10.1016/j.asoc.2021.107281
Alhakeem, Z. M., Jebur, Y. M., Henedy, S. N., Imran, H., Bernardo, L. F., and Hussein, H. M. (2022). Prediction of ecofriendly concrete compressive strength using gradient boosting regression tree combined with GridSearchCV hyperparameter-optimization techniques. Materials 15 (21), 7432. doi:10.3390/ma15217432
Awad, M., and Khanna, R. (2015). “Support vector regression,” in Efficient learning machines (Berlin, Germany: Springer), 67–80.
Bai, B., Zhou, R., Cai, G., Hu, W., and Yang, G. (2021). Coupled thermo-hydro-mechanical mechanism in view of the soil particle rearrangement of granular thermodynamics. Comput. Geotechnics 137, 104272. doi:10.1016/j.compgeo.2021.104272
Bai, B., Zhou, R., Yang, G., Zou, W., and Yuan, W. (2023). The constitutive behavior and dissociation effect of hydrate-bearing sediment within a granular thermodynamic framework. Ocean. Eng. 268, 113408. doi:10.1016/j.oceaneng.2022.113408
Bai, G., Zhu, C., Liu, C., and Liu, B. (2020). An evaluation of the recycled aggregate characteristics and the recycled aggregate concrete mechanical properties. Constr. Build. Mater. 240, 117978. doi:10.1016/j.conbuildmat.2019.117978
Basak, D., Pal, S., and Patranabis, D. C. (2007). Support vector regression. Statistics Comput. 11 (10).
Bergstra, J., Bardenet, R., Bengio, Y., and Kégl, B. (2011). Algorithms for hyper-parameter optimization. Adv. neural Inf. Process. Syst. 24.
Bergstra, J., and Bengio, Y. (2012). Random search for hyper-parameter optimization. J. Mach. Learn. Res. 13 (2).
Bergstra, J., Yamins, D., and Cox, D. (2013). “Making a science of model search: Hyperparameter optimization in hundreds of dimensions for vision architectures,” in Proceedings of the International conference on machine learning: PMLR), Atlanta, Georgia, USA, June 2013, 115–123.
Catherina, V. P., and Chella, K. N. (2021). Prediction of compressive strength of recycled aggregate concrete using artificial neural network and cuckoo search method. Mater. Today Proc. 46, 8480–8488. doi:10.1016/j.matpr.2021.03.500
Chakradhara Rao, M., Bhattacharyya, S., and Barai, S. (2011). Influence of field recycled coarse aggregate on properties of concrete. Mater. Struct. 44 (1), 205–220. doi:10.1617/s11527-010-9620-x
Chakradhara Rao, M. (2018). Properties of recycled aggregate and recycled aggregate concrete: Effect of parent concrete. Asian J. Civ. Eng. 19 (1), 103–110. doi:10.1007/s42107-018-0011-x
Chen, T., and Guestrin, C. (2016). “Xgboost: A scalable tree boosting system,” in Proceedings of the 22nd acm sigkdd international conference on knowledge discovery and data mining, San Francisco, CA, USA, August 2016, 785–794.
Duan, Z.-H., Kou, S.-C., and Poon, C.-S. (2013). Prediction of compressive strength of recycled aggregate concrete using artificial neural networks. Constr. Build. Mater. 40, 1200–1206. doi:10.1016/j.conbuildmat.2012.04.063
Duan, Z., and Poon, C. (2014). Properties of recycled aggregate concrete made with recycled aggregates with different amounts of old adhered mortars. Mater. Des. 58, 19–29. doi:10.1016/j.matdes.2014.01.044
Eggensperger, K., Hutter, F., Hoos, H., and Leyton-Brown, K. (2015). “Efficient benchmarking of hyperparameter optimizers via surrogates,” in Proceedings of the AAAI Conference on Artificial Intelligence, Austin, TX, USA, January 2015.()
Feurer, M., and Hutter, F. (2019). “Hyperparameter optimization,” in Automated machine learning (Berlin, Germany: Springer), 3–33.
Freund, Y., Schapire, R., and Abe, N. (1999). A short introduction to boosting. Journal-Japanese Soc. Artif. Intell. 14 (771-780), 1612. .
Friedman, J. H. (2001). Greedy function approximation: A gradient boosting machine. Ann. statistics 29, 1189–1232. doi:10.1214/aos/1013203451
Giesekam, J., Barrett, J. R., and Taylor, P. (2016). Construction sector views on low carbon building materials. Build. Res. Inf. 44 (4), 423–444. doi:10.1080/09613218.2016.1086872
González-Taboada, I., González-Fonteboa, B., Martínez-Abella, F., and Carro-López, D. (2016). Study of recycled concrete aggregate quality and its relationship with recycled concrete compressive strength using database analysis. Materiales de Construcción 66 (323), e099. doi:10.3989/mc.2016.06415
Gull, I. (2011). Testing of strength of recycled waste concrete and its applicability. J. Constr. Eng. Manag. 137 (1), 1–5. doi:10.1061/(asce)co.1943-7862.0000255
Guo, Z., Chen, L., Gui, L., Du, J., Yin, K., and Do, H. M. (2020a). Landslide displacement prediction based on variational mode decomposition and WA-GWO-BP model. Landslides 17 (3), 567–583. doi:10.1007/s10346-019-01314-4
Guo, Z., Chen, L., Yin, K., Shrestha, D. P., and Zhang, L. (2020b). Quantitative risk assessment of slow-moving landslides from the viewpoint of decision-making: A case study of the three gorges reservoir in China. Eng. Geol. 273, 105667. doi:10.1016/j.enggeo.2020.105667
Khademi, F., Jamal, S. M., Deshpande, N., and Londhe, S. (2016). Predicting strength of recycled aggregate concrete using artificial neural network, adaptive neuro-fuzzy inference system and multiple linear regression. Int. J. Sustain. Built Environ. 5 (2), 355–369. doi:10.1016/j.ijsbe.2016.09.003
Koper, A., Koper, W., and Koper, M. (2017). Influence of raw concrete material quality on selected properties of recycled concrete aggregates. Procedia Eng. 172, 536–543. doi:10.1016/j.proeng.2017.02.063
Kou, S.-c., and Poon, C.-s. (2015). Effect of the quality of parent concrete on the properties of high performance recycled aggregate concrete. Constr. Build. Mater. 77, 501–508. doi:10.1016/j.conbuildmat.2014.12.035
Li, Y., and Chen, W. (2020). A comparative performance assessment of ensemble learning for credit scoring. Mathematics 8 (10), 1756. doi:10.3390/math8101756
Liang, W., Luo, S., Zhao, G., and Wu, H. (2020). Predicting hard rock pillar stability using GBDT, XGBoost, and LightGBM algorithms. Mathematics 8 (5), 765. doi:10.3390/math8050765
Liu, Y., Wang, Y., and Zhang, J. (2012). “New machine learning algorithm: Random forest,” in Proceedings of the International Conference on Information Computing and Applications, Wuhan, China, October 2012, 246–252.
McNeil, K., and Kang, T. H.-K. (2013). Recycled concrete aggregates: A review. Int. J. Concr. Struct. Mater. 7 (1), 61–69. doi:10.1007/s40069-013-0032-5
Medina, V., Hürlimann, M., Guo, Z., Lloret, A., and Vaunat, J. (2021). Fast physically-based model for rainfall-induced landslide susceptibility assessment at regional scale. Catena 201, 105213. doi:10.1016/j.catena.2021.105213
Meng, T., Wei, H., Yang, X., Zhang, B., Zhang, Y., and Zhang, C. (2021). Effect of mixed recycled aggregate on the mechanical strength and microstructure of concrete under different water cement ratios. Materials 14 (10), 2631. doi:10.3390/ma14102631
Nunez, I., Marani, A., and Nehdi, M. L. (2020). Mixture optimization of recycled aggregate concrete using hybrid machine learning model. Materials 13 (19), 4331. doi:10.3390/ma13194331
Ozaki, Y., Tanigaki, Y., Watanabe, S., and Onishi, M. (2020). “Multiobjective tree-structured parzen estimator for computationally expensive optimization problems,” in Proceedings of the 2020 genetic and evolutionary computation conference, Cancun Mexico, July 2020, 533–541.
Park, S. S., Kim, S. J., Chen, K. Q., Lee, Y. J., and Lee, S. B. (2018). Crushing characteristics of a recycled aggregate from waste concrete. Constr. Build. Mater. 160, 100–105. doi:10.1016/j.conbuildmat.2017.11.036
Quinlan, J. R. (1986). Induction of decision trees. Mach. Learn. 1 (1), 81–106. doi:10.1007/bf00116251
Rakshvir, M., and Barai, S. V. (2006). Studies on recycled aggregates-based concrete. Waste Manag. Res. 24 (3), 225–233. doi:10.1177/0734242x06064820
Rasmussen, C. E. (2003). “Gaussian processes in machine learning,” in Summer school on machine learning (Berlin, Germany: Springer), 63–71.
Rasmussen, C. E., and Nickisch, H. (2010). Gaussian processes for machine learning (GPML) toolbox. J. Mach. Learn. Res. 11, 3011–3015.
Ray, S. (2019). “A quick review of machine learning algorithms,” in Proceedings of the 2019 International conference on machine learning, big data, cloud and parallel computing (COMITCon): IEEE), Faridabad, India, February 2019, 35–39.
Schölkopf, B., Smola, A. J., Williamson, R. C., and Bartlett, P. L. (2000). New support vector algorithms. Neural Comput. 12 (5), 1207–1245. doi:10.1162/089976600300015565
Sen, P. C., Hajra, M., and Ghosh, M. (2020). “Supervised classification algorithms in machine learning: A survey and review,” in Emerging technology in modelling and graphics (Berlin, Germany: Springer), 99–111.
Sev, A. (2009). How can the construction industry contribute to sustainable development? A conceptual framework. Sustain. Dev. 17 (3), 161–173. doi:10.1002/sd.373
Shi, F., Huang, T., Tanikawa, H., Han, J., Hashimoto, S., and Moriguchi, Y. (2012). Toward a low carbon–dematerialization society: Measuring the materials demand and CO2 emissions of building and transport infrastructure construction in China. J. Industrial Ecol. 16 (4), 493–505. doi:10.1111/j.1530-9290.2012.00523.x
Silva, R., de Brito, J., and Dhir, R. (2015). The influence of the use of recycled aggregates on the compressive strength of concrete: A review. Eur. J. Environ. Civ. Eng. 19 (7), 825–849. doi:10.1080/19648189.2014.974831
Smola, A. J., and Schölkopf, B. (2004). A tutorial on support vector regression. Statistics Comput. 14 (3), 199–222. doi:10.1023/b:stco.0000035301.49549.88
Spence, R., and Mulligan, H. (1995). Sustainable development and the construction industry. Habitat Int. 19 (3), 279–292. doi:10.1016/0197-3975(94)00071-9
Vapnik, V., Golowich, S., and Smola, A. (1996). Support vector method for function approximation, regression estimation and signal processing. Adv. neural Inf. Process. Syst. 9.
Wagih, A. M., El-Karmoty, H. Z., Ebid, M., and Okba, S. H. (2013). Recycled construction and demolition concrete waste as aggregate for structural concrete. HBRC J. 9 (3), 193–200. doi:10.1016/j.hbrcj.2013.08.007
Wang, Y., Li, X., Wang, Z., and Liu, J. (2022a). Deep learning for magnitude prediction in earthquake early warning. Gondwana Res. doi:10.1016/j.gr.2022.06.009
Wang, Y., Zhao, Q., Li, Y., Zhang, M., and Zhu, W. (2022b). Detecting cable force anomalies on cable-stayed bridges using the STA/LTA method. Sustainability 14 (18), 11373. doi:10.3390/su141811373
Xia, B., Olanipekun, A., Chen, Q., Xie, L., and Liu, Y. (2018). Conceptualising the state of the art of corporate social responsibility (CSR) in the construction industry and its nexus to sustainable development. J. Clean. Prod. 195, 340–353. doi:10.1016/j.jclepro.2018.05.157
Ying, J., Su, F., and Chen, S. (2022). Long term performance of recycled concrete beams with different water—Cement ratio and recycled aggregate replacement rate. Front. Struct. Civ. Eng. 16, 302–315. doi:10.1007/s11709-022-0803-7
Yuan, X., Tian, Y., Ahmad, W., Ahmad, A., Usanova, K. I., Mohamed, A. M., et al. (2022). Machine learning prediction models to evaluate the strength of recycled aggregate concrete. Materials 15 (8), 2823. doi:10.3390/ma15082823
Zhang, L., Li, Q., and Zhou, J. (2017). Critical factors of low-carbon building development in China's urban area. J. Clean. Prod. 142, 3075–3082. doi:10.1016/j.jclepro.2016.10.160
Keywords: machine learning, recycled coarse aggregate concrete, compressive strength prediction, Bayesian optimization, ensemble learning
Citation: Zhang X, Dai C, Li W and Chen Y (2023) Prediction of compressive strength of recycled aggregate concrete using machine learning and Bayesian optimization methods. Front. Earth Sci. 11:1112105. doi: 10.3389/feart.2023.1112105
Received: 30 November 2022; Accepted: 19 January 2023;
Published: 03 February 2023.
Edited by:
Zizheng Guo, Hebei University of Technology, ChinaReviewed by:
Jun He, Hebei University of Technology, ChinaBing Bai, Beijing Jiaotong University, China
Copyright © 2023 Zhang, Dai, Li and Chen. This is an open-access article distributed under the terms of the Creative Commons Attribution License (CC BY). The use, distribution or reproduction in other forums is permitted, provided the original author(s) and the copyright owner(s) are credited and that the original publication in this journal is cited, in accordance with accepted academic practice. No use, distribution or reproduction is permitted which does not comply with these terms.
*Correspondence: Chengyuan Dai, MjAxNjAxNUBnbHV0LmVkdS5jbg==