
95% of researchers rate our articles as excellent or good
Learn more about the work of our research integrity team to safeguard the quality of each article we publish.
Find out more
ORIGINAL RESEARCH article
Front. Earth Sci. , 03 April 2023
Sec. Solid Earth Geophysics
Volume 11 - 2023 | https://doi.org/10.3389/feart.2023.1107068
This article is part of the Research Topic The State-of-Art Techniques of Seismic Imaging for the Deep and Ultra-deep Hydrocarbon Reservoirs - Volume II View all 9 articles
Young’s modulus and Poisson’s ratio are important for reservoir characterization and rock brittleness prediction in unconventional resource exploration and development. Conventional methods can estimate Young’s modulus and Poisson’s ratio by indirect calculations and direct inversion using approximate expressions, which have cumulative errors and limited accuracy of the estimated results, especially at large incident angles. In this study, we derived a new form of the Zoeppritz equation and P-to-P wave reflection coefficient in terms of density and Young’s modulus, Poisson’s ratio. It has the same accuracy as the original Zoeppritz equation over a wide range of incident angles. A robust non-linear inversion method based on the iteratively regularized Levenberg Marquardt (IRLM) algorithm, is used to invert all three parameters based on the new equation directly and simultaneously. Synthetic data and field data are used to test and verify the proposed direct inversion method, ensuring the feasibility and effectiveness of the proposed method and the high accuracy and stability of the inversion results. This study has a great potential and valuable guidance for “sweet spot” evaluation and subsequent horizontal well deployment and hydraulic fracturing.
Unconventional resources have become the main targets of oil and gas exploration (Jarvie et al., 2007; Vernik et al., 2018). In recent years, shale oil and gas have gradually attracted attention in the energy field. However, different from conventional oil and gas exploration focusing on finding traps, unconventional oil and gas belong to the “continuous accumulation type” oil and gas reservoir (Aguilera, 2016). It is necessary to find a rich and easy-to-develop area, namely, the “sweet spot” area (Curtis, 2002; Zhang et al., 2020; Ding et al., 2021).
Brittleness has a significant role in unconventional resource exploration (Xie et al., 2019). Reservoir geophysicists suggest using the minerals content in rocks (Yang et al., 2015) and elastic parameters (Rickman et al., 2008; Goodway et al., 2010; Guo et al., 2013; Gong et al., 2018a; Gong et al., 2018b; Qian et al., 2020) to build brittle evaluation parameters. Knowledge of Young’s modulus and Poisson’s ratio is essential for “sweet spot” and brittleness prediction and characterization. High Young’s modulus and low Poisson’s ratio can be used to evaluate the higher brittleness of shale reservoirs (Rybacki et al., 2015; Jin et al., 2018). A low Poisson’s ratio and a high Young’s modulus often mean that shale is brittle. The rock brittleness index can also be calculated by using Poisson’s ratio and Young’s modulus to evaluate the “sweet spot” and provide guidance for subsequent horizontal well deployment and hydraulic fracturing (Sone and Zoback, 2013a; b).
To identify the potential hydrocarbon accumulation using geophysical information, seismic amplitude interpretation was used to indicate the bright spot on the seismic section (Shuey, 1985; Castagna et al., 1993). Then, quantitative interpretation for seismic data is used to extract Young’s modulus and Poisson’s ratio as important parameters for reservoir evaluation. Obtaining elastic parameters to reflect lithology and fluid properties from stacking and pre-stack seismic data has been widely used in exploration geophysics (Avseth et al., 2005).
Elastic parameters can be recovered by using pre-stack amplitude variation with offset (AVO) inversion in oil and gas exploration (Minato and Ghose, 2016; Xu et al., 2016; Zhang et al., 2019). Due to the strongly non-linear inverse problems based on the exact Zoeppritz equation, several approximate Zoeppritz equations have been proposed and used in practice. Aki and Richards (1980) proposed a simplification by assuming weak layer contrasts. Shuey (1985) offered a similar form to the Aki-Richards equation based on Poisson’s ratio, P-wave velocity, and density. Zong et al. (2012) presented a modified equation to invert Young’s modulus and Poisson’s ratio, which avoided the cumulative errors caused by the calculation of P- and S-wave velocities and density. However, those approximations, which assume small incident angles and small layer contrasts, limited the high-resolution inversion results. Zhi et al. (2018) inverted high-accuracy density and velocity by non-linear AVO inversion based on the exact Zoeppritz equation.
Pre-stack seismic inversion technology directly extracts multiple elastic parameter data volumes (P-wave impedance, S-wave impedance, and density) by using AVO information of pre-stack gathers (Goodway et al., 2010; Huang et al., 2015; Vernik et al., 2018), and then indirectly obtains Young’s modulus and Poisson’s ratio by combining the conversion relationship between elastic parameters. For example, the Poisson’s ratio was used to identify the gas-bearing sandstone with high porosity (Ostrander, 1984). In general, Young’s modulus and Poisson’s ratio are calculated indirectly from P wave, S wave, and density data and directly from pre-stack inversion. However, density data is difficult to be estimated and the results are usually unreliable (Downton, 2005; Behura et al., 2010). In addition, the above indirect calculation method may lead to accumulative error. Zong et al. (2012) obtained a new approximation (YPD equation) based on the equation of Young’s modulus and Poisson’s ratio, and established the elastic impedance inversion method of Young’s modulus and Poisson’s ratio.
The use of the linear approximate formula of the Zoeppritz equation needs to meet many assumptions such as small and medium incident angles, constant background P/S wave velocity ratio, and weak elastic parameter change rate, which limits its application in different geological conditions (Aki and Richards, 1980). Therefore, the use of approximate equations to estimate Young’s modulus and Poisson’s ratio usually limits scenarios where inversion would lead to non-compliance with these assumptions. The accuracy of Young’s modulus and Poisson’s ratio predicted by conventional pre-stack seismic inversion cannot meet the interpretation requirements due to the cumulative error introduced by elastic parameter conversion. The use of the accurate Zoeppritz equation can not only avoid the introduction of cumulative deviation by approximate equation but also directly and conveniently invert elastic parameters, improving the inversion effect (Zhou et al., 2017; Zhi et al., 2018). For this reason, many scholars have carried out research on the pre-stack inversion of the accurate Zoeppritz equation (Pan et al., 2017; Cheng et al., 2021). (Chen et al., 2022) derived a non-linear PP-wave reflection coefficient equation in terms of the reflectivity of Young’s modulus, Poisson’s ratio, and density based on the exact Zoeppritz equation to improve the accuracy of the inversion results.
In this study, we derive a new form of the exact Zoeppritz equation and the P-to-P wave reflection coefficient based on Young’s modulus, Poisson’s ratio, and density, which have the same accuracy as the original Zoeppritz equation over the range of incident angles. Then, we develop a direct and simultaneous AVO inversion of Young’s modulus, Poisson’s ratio, and density based on the new form of the exact Zoeppritz equation of the P-to-P wave reflection coefficient. A robust non-linear inversion method based on the iteratively regularized Levenberg Marquardt (IRLM) algorithm, is used to invert all three parameters. The applications of synthetic and field seismic data demonstrate the good performance of the proposed inversion method.
P-wave velocity, S-wave velocity, and density, as the conventional elastic parameters of underground media, are the main target parameters for pre-stack AVO inversion. The pre-stack AVO inversion based on the approximate formula of the Zoeppritz equation is limited by the assumption that there is little difference in the properties of the media on both sides of the incident interface and that the incident angle is small or medium (generally less than 30°). Due to the noise in the actual data and the finiteness of the data, the inversion is highly ill-conditioned and non-linear. As the longitudinal wave is not very sensitive to S wave velocity and density, and the corresponding shear wave is less affected by pore fluid, it is very sensitive to S wave velocity and density. Adding converted wave information to conduct PP-PS joint inversion can obtain more accurate shear wave velocity, especially density information, and reduce the uncertainty and multi-solution of reservoir interpretation. Based on the complete Zoeppritz equation and pre-stack seismic data, the AVO inversion strategy is studied. It mainly includes inversion based on PP wave data and joint inversion of PP wave and P-SV wave data. For different inversion target parameters, direct inversion of density, P wave velocity, and S wave velocity are carried out. At the same time, Poisson’s ratio and Young’s modulus are also important research objects. The iterative regularizing Levenberg Marquardt (IRLM) algorithm is introduced to solve the ill-posed and highly non-linear problems of inversion and increase the stability and accuracy of estimation results.
Generally, there are two ways to obtain Young’s modulus and Poisson’s ratio. One method is obtained by indirect calculation using density, velocity, and other information, which is mainly based on the direct inversion of approximate expressions. However, there are many noises and other interferences in the actual situation. In the indirect calculation process, the calculation error is often accumulated continuously, resulting in large errors and low accuracy of the required results. Another method is that the results directly estimated by simplified expressions (such as the YPD equation) are often difficult to obtain robustly and accurately under complex geological conditions with noise and other disturbances. The approximation of the equation limits the accuracy of the estimation results of Young’s modulus and Poisson’s ratio especially when the incident angle is large. Given these problems, based on the accurate Zoeppritz equation, this paper derives a new expression of the accurate Zoeppritz equation and its Frechet derivative based on Young’s modulus and Poisson’s ratio and proposes a direct inversion strategy, which not only solves the limitation of insufficient accuracy of the approximate expression but also avoids the problem of error accumulation caused by indirect calculation. The application of model data and practical data verifies the feasibility and robustness of the method.
The new form of Zoeppritz equation with Young’s modulus, Poisson’s ratio, and density.
The exact Zoeppritz equation (Aki and Richards, 1980) related to the P-wave equation can be expressed as:
in which, the P-and S-wave velocities and density of the upper and lower layers are given by Vp1, Vs1, ρ1, and Vp2, Vs2, ρ2, respectively. The incident and transmitted angles of P- and S- waves are given by α, α′, and β, β′, respectively. The coefficients of reflected and transmitted P-wave for incident P-wave are donated by Rpp, Rps, and Tpp, Tps, respectively.
Snell’s law is given by:
Substituting Eq. 2 into Eq. 1, and Eq. 1 becomes:
We can denote:
in which, Young’s modulus, Poisson’s ratio, P-and S-wave velocities, and density of the media are given by E, v, Vp, Vs, ρ, respectively.
Hence, the Zoeppritz equation in terms of Young’s modulus, Poisson’s ratio, and density can be derived by substituting Eq. 4 and Eq. 5 into Eq. 3, as follows:
in which
The most useful complete solution of the P-to-P wave reflection coefficient in terms of Young’s modulus, Poisson’s ratio, and density, Rpp, can be expressed as follows:
in which
Four single-interface models, as shown in Table 1 and constructed by well logs in the study area, are designed for four AVO classes (Rutherford and Williams, 1989; Castagna and Swan, 1997) and used to modify the accuracy and advantage of the new form of the Zoeppritz equation, especially at large incident angles. Model I - IV belong to AVO Class I - IV, respectively, which are referred to in the paper as: Class I lower layer has higher impedance than the upper layer with relatively large positive normal incident reflection coefficient (R0) and negative gradient; Class II lower layer has almost the same impedance as upper layer with near zero R0 and negative gradient; Class III lower layer has lower impedance than the upper layer with negative R0 and negative gradient; Class IV lower layer has lower impedance than the upper layer with negative R0 and positive gradient. The angle of the incident P-wave is set to 0°–80°. Figure 1 shows the comparison of the P-to-P wave reflection coefficients calculated by the original exact Zoeppritz equation (black dotted curves), the new rewritten expression (red curves), the YPD approximation (blue curves), and the non-linear YPD equation (green curves). The YPD approximations of Zoeppritz PP equation is given by (Zong et al., 2012) as follows:
where α is the incident angle of the PP-wave; k = VS2/VP2 represents the square of the ratio of S-and P-wave velocities; the reflectivity of Young’s modulus, Poisson’s ratio, and density are given by ΔE/E, Δv/v, and Δρ/ρ, respectively.
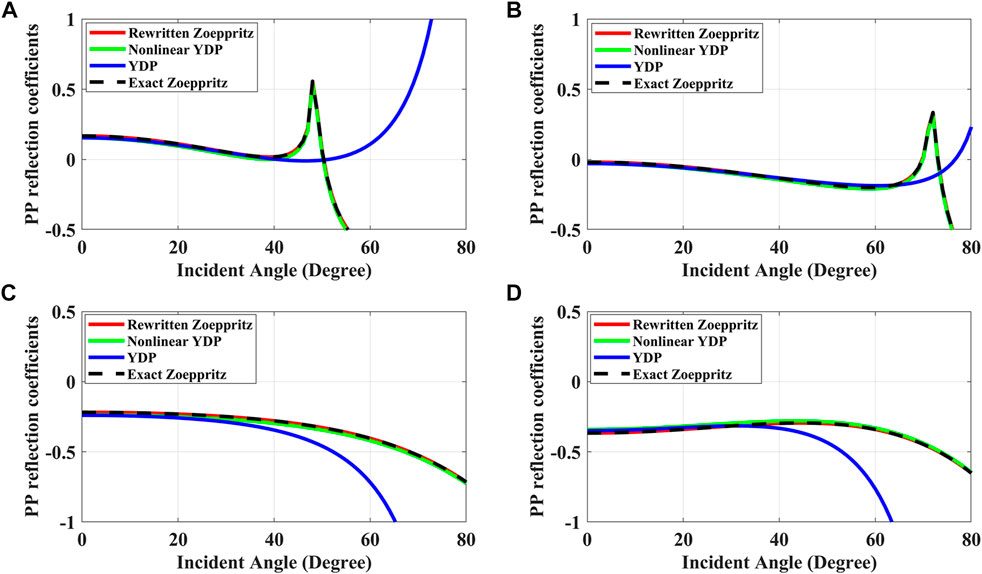
FIGURE 1. Comparison of the P-to-P wave reflection coefficients calculated by the newly rewritten Zoeppritz equation (red curves), the exact Zoeppritz equation (black dotted curves), the YPD approximation (blue curves), and the non-linear YPD equation (green curves) for four models [(A) I (B) II (C) III (D) IV].
The non-linear YPD equation is given by (Chen et al., 2022) as follows:
Figure 2 shows the error analysis of the P-to-P wave reflection coefficients calculated by the rewritten new form equation (red curves), the YPD approximation (blue dotted curves), and the non-linear YPD equation (green dotted curves) for four models.
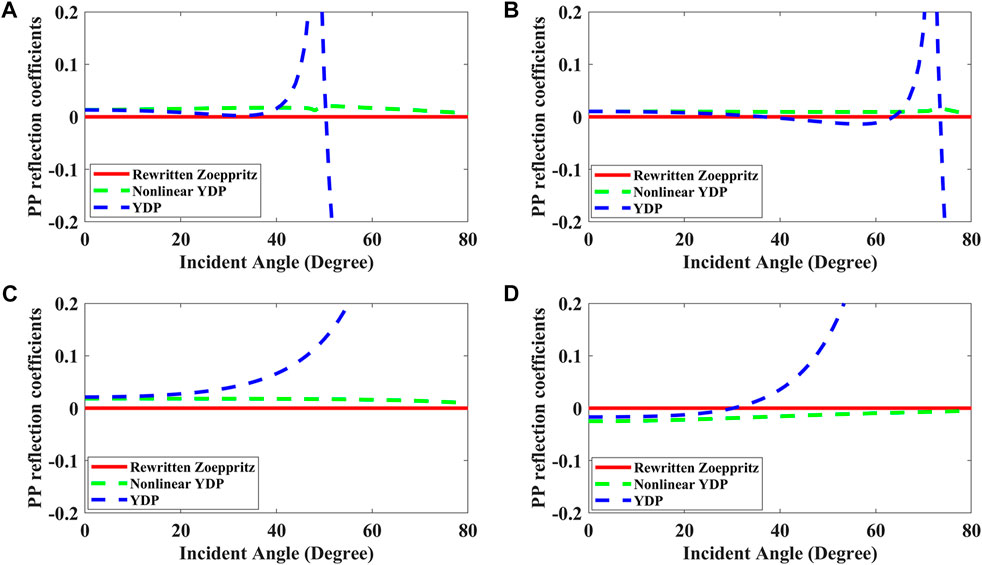
FIGURE 2. Error analysis of the P-to-P wave reflection coefficients calculated by the newly rewritten Zoeppritz equation (red curves), the YPD approximation (blue dotted curves), and the non-linear YPD equation (green dotted curves) for four models [(A) I (B) II (C) III (D) IV].
Figures 1, 2 show that the newly rewritten expression exactly agrees with the original Zoeppritz equation over a range of angles for all models and the YPD approximation has lower accuracy than that of the newly rewritten expression, especially when the incident angle is large. The YPD approximate equation is derived from the Aki-Richards equation by assuming angles of incidence less than about 30° and small contrasts between layer properties. The non-linear YPD equation has nearly the same accuracy as the YPD approximation at normal incident angle (less than 35°) and higher accuracy at large incident angle. However, the accuracy of the non-linear YPD equation is still lower than that of the newly rewritten Zoeppritz expression. Therefore, the newly rewritten Zoeppritz expression has obvious advantages compared with the YPD approximation and the non-linear YPD equation.
The reliable and high-precision elastic parameters, especially the density, are difficult to be recovered due to the different sensitivities of geophysical measurements to them. The sensitivity analysis of the reflection coefficient to elastic parameters is of significance to obtain stable and accurate inversion results by optimizing the inversion algorithm and adjusting the input data in pre-stack inversion. We use the four two-layer models (listed in Table 1) to analyze the effect of Young’s modulus, Poisson’s ratio, and density on the P-to-P wave reflection coefficient. We calculate the variation of the P-to-P wave reflection coefficient when Young’s modulus (red), Poisson’s ratio (blue), and density (green) of the lower layer increase by 2% and 10%, as shown in Figure 3.
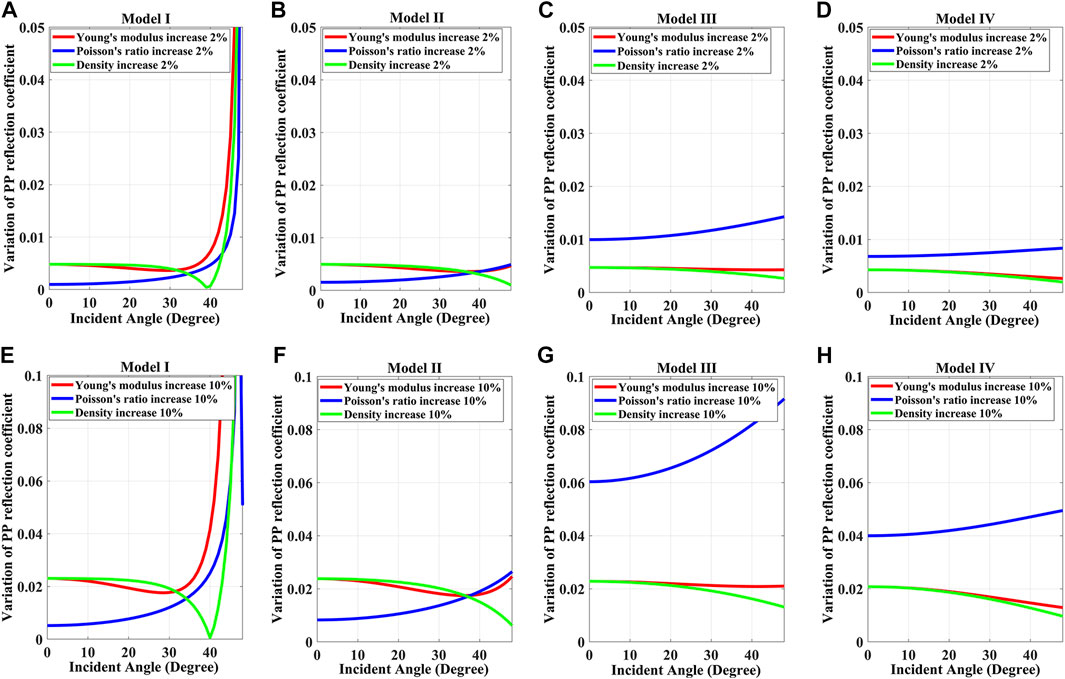
FIGURE 3. Variation of the P-to-P wave reflection coefficients for increasing Young’s modulus (red), Poisson’s ratio (blue), and density (green) of the lower layer by (A–D) 2% and (E–H) 10% in four different models.
From Figure 3 we can see that if Young’s modulus, or Poisson’s ratio and density of the lower layer increases, the sensitivity of the reflection coefficient to them slightly differs in the four models. The variations of the reflection coefficients for Young’s modulus are similar to density, which are not obvious in all models at small or moderate incident angles (0° - 30°), which means this range of incident angle is not sensitive to them. However, we can see that the sensitivity of the reflection coefficient to Young’s modulus increases with an increase in incident angle (>30°). The variations of the reflection coefficients increase with an increasing incident angle for Poisson’s ratio, especially at moderate and large angles, which demonstrates that moderate- and large-angle pre-stack seismic data are sensitive to the variations of those elastic parameters. The variations of the reflection coefficients increase with increasing elastic-parameters variations, especially for Poisson’s ratio, which has the highest sensitivity in models III and IV compared with models I and II. We can see that different AVO classes have different effects on elastic parameters, especially for Poisson’s ratio. Therefore, the exact Zoeppritz equation and moderate- and large-angle (>30°) pre-stack seismic data can be used to improve the stability and accuracy of the inversion elastic parameters in pre-stack inversion.
Following weighted least-square estimation principles, we invert Young’s modulus, Poisson’s ratio, and density by minimizing the misfit errors between the observed seismic data and the model or synthetic data which is given by the convolution of the P-to-P wave reflection coefficient and seismic wavelet. Thus, the inversion problem reduces to find m that minimizes the following objective function:
In which, m= [E1, E2, … , En, v1, v2, … , vn, ρ1, ρ2, ,ρn]Τ is the elastic parameters, Spp(αi) is the observed seismic angle gather, Wpp(αi) is the seismic wavelet. We applied an iteratively regularizing Levenberg-Marquardt (IRLM) algorithm (Song et al., 2016; Zhi et al., 2016; Zhi et al., 2018) to derive the increment Δm (Eq. 12) and to overcome the highly non-linear and ill-posed inversion problems.
in which, J(m)=f'(m) is the Jacobian matrix, g=▽F(m) is the gradient, and L is a first-order derivative operator. μ and λ are related to ||f(m)||2.
Please refer to Supplementary Appendix A1 for the derivation of the Jacobian matrix based on the exact Zoeppritz equation with Young’s modulus, Poisson’s ratio, and density.
Finally, the updated iteration formula of the model parameters can be expressed as:
Where k is the number of iterations.
The flow chart of direct pre-stack inversion of Young’s modulus, Poisson’s ratio, and density using the new form of the Zoeppritz equation is shown in Figure 4.
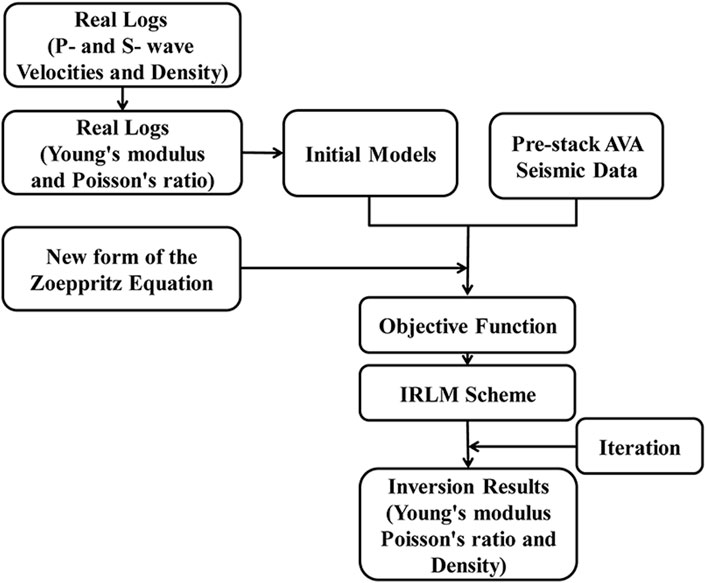
FIGURE 4. The flow chart of direct pre-stack inversion of elastic modulus using the exact Zoeppritz equation.
First of all, a multilayer geologic model (Table 2) is used to verify the feasibility and stability of the inversion method and test the precision of inversion results compared with the indirect calculated value. Figure 5A shows Young’s modulus, Poisson’s ratio, and density respectively. The synthetic P-to-P wave angle gathers (Figure 5B) are generated based on the convolution model with Eq. 8 and a 35 Hz zero-phase Ricker wavelet without noise. The incident angle is 0°–50° to verify the robustness of the proposed inversion method in the synthetic examples at large incident angles. Reliable low-frequency information on model parameters is important for obtaining stable inversion results. The multilayer geologic model is smoothed by a moving average filter to generate the low-frequency initial models.
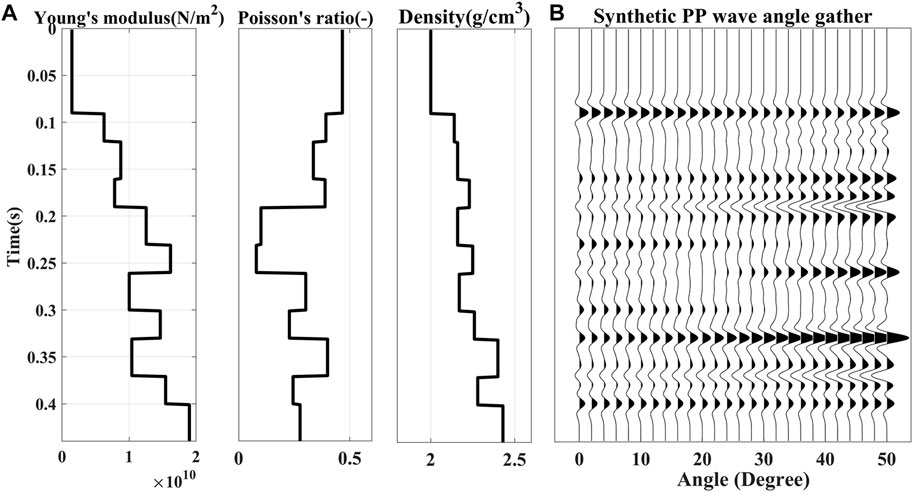
FIGURE 5. (A) Young’s modulus, Poisson’s ratio, and density (B) Synthetic PP wave angle gather without noise.
Figure 6 shows the true (black lines) and initial (gray lines) values and the direct inversion results (Figure 6A red, blue, and green lines respectively) and the indirect calculated results (Figure 6B red, blue and green lines respectively) of Young’s modulus, Poisson’s ratio and density without noise. The exact forward modeling and robust and effective inversion method and input data without noise ensure that the direct inversion results agree well with the true models than the indirect calculated results.
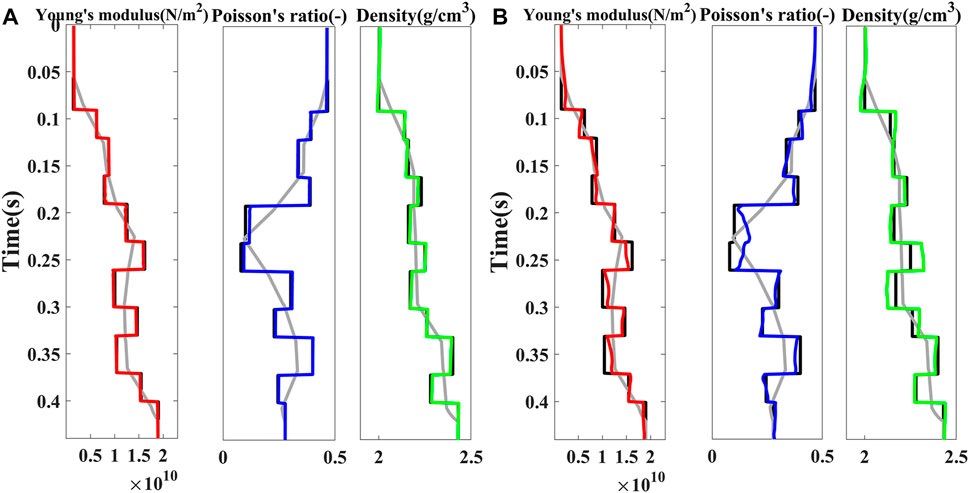
FIGURE 6. Young’s modulus (red), Poisson’s ratio (blue), and density (green) of (A) direct inversion results and (B) indirect calculated results without noise. The black lines and gray lines are the true and initial models respectively.
Correlation analysis for the direct inversion and indirect calculation (Figure 7) quantifies these improvements: the correlation coefficients (CC) of Young’s modulus, Poisson’s ratio, and density for direct inversion are 0.9998, 0.9997, and 0.9985, respectively; while the coefficients for indirect calculation are 0.9906, 0.9894, and 0.9817, respectively. Meanwhile, we calculated the mean-relative error (mr error) of direct inversion results and indirect calculated results, as shown in Table 3. Correlation coefficients of Young’s modulus (red), Poisson’s ratio (blue), and density (green) obtained by the direct estimation method (solid line) and the indirect calculation method (dashed line) as the number of calculation iterations increases, it was found that after 3 iterations, the directly estimated Young’s modulus and the Poisson’s ratio correlation coefficients had reached a high value and tended to be flat, and the density term also tended to be high and flat after 5 iterations, while the indirectly calculated Young’s modulus and Poisson’s ratio correlation coefficient had not reached a relatively high value after 7 iterations, and the correlation coefficient of the density term begins to gradually decrease after 4 iterations, which also shows that the direct estimation method can obtain relatively stable and accurate results. From the above, it can be seen that the direct inversion method is more advantageous than indirect calculation.

TABLE 3. The mr error and CC between the true models and the estimation results of E, v, and ρ, respectively, for different methods in a multilayer geologic model.
Next, a synthetic test from real field well-logging data in the study area is used to verify the practicability and robustness of our proposed inversion method. The real values of Young’s modulus and Poisson’s ratio are calculated from the P- and S- wave velocities in original well-logging data. The newly rewritten Zoeppritz equation, the YPD approximation, and the non-linear YPD equation are used to calculate the P-to-P wave reflection coefficients, respectively. The synthetic angle gather is generated based on the convolution model and a 35 Hz zero-phase Ricker wavelet. The low-frequency initial models are built using the smoothed real well-logging data. The incident angle is 0°–46° to test the feasibility and stability of the proposed inversion method. Figures 8A–D present the true (black lines) and initial (gray lines) values and the direct inversion results (red, blue, and green lines respectively) of Young’s modulus, Poisson’s ratio, and density based on the newly rewritten Zoeppritz equation with no noise, Gaussian white noise of signal-to-noise ratio (S/N) equal to 5, Gaussian white noise of S/N = 2, and pink noise of S/N = 2, respectively. Figures 8E–H show the same parameters as Figures 8A–D based on the YPD approximation with no noise, Gaussian white noise of S/N = 5, Gaussian white noise of S/N = 2, and pink noise of S/N = 2, respectively. Figures 8I–L present the same parameters as Figures 8A–D based on the non-linear YPD equation with no noise, Gaussian white noise of S/N = 5, Gaussian white noise of S/N = 2, and pink noise of S/N = 2, respectively. Then Young’s modulus and Poisson’s ratio are calculated indirectly from P- and S- wave velocities and density, which are inverted using the exact Zoeppritz equation and the proposed inversion method. The mean relative error and correlation coefficient between the target parameter estimation results based on different estimation methods and the real model data are used to analyze the inversion stability, as shown in Table 4. It can be seen that the mr errors increase and CCs decrease with a decreasing S/N and the density, Young’s modulus, and Poisson’s ratio can be satisfactorily estimated even when the white noise of S/N is very low. Colored noise is more correlated with real seismic data than white noise. The inversion results with pink noise (S/N = 2) have narrowly higher mean relative errors and lower correlation coefficients than the inversion results with white noise (S/N = 2), which demonstrates that the proposed direct inversion method has good robustness for white noise and pink noise and the inversion results have limited dependency on different types of noise with different S/Ns. Figure 8 and Table 4 also show that the direct inversion method based on the newly rewritten Zoeppritz equation has lower mr errors and higher CCs than the indirect calculation based on the Zoeppritz equation and the direct inversion method based on the YPD approximation and the non-linear YPD equation, which verifies that the proposed method can generate high-accuracy inversion results.
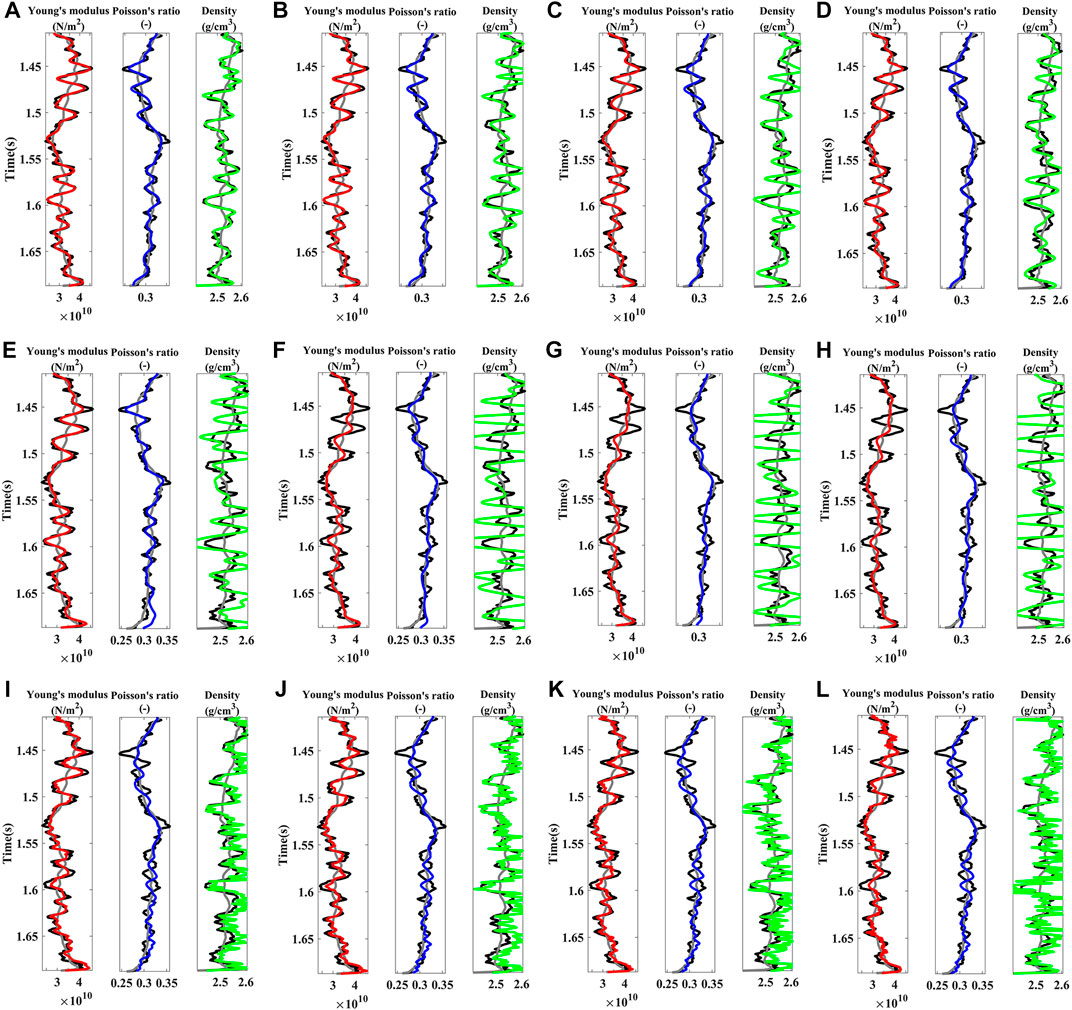
FIGURE 8. Comparison among the true models (black), initial models (gray), and PP wave inversion results for Young’s modulus (red), Poisson’s ratio (blue), and density (green) based on the newly rewritten Zoeppritz equation with (A) no noise, (B) white noise (S/N = 5), (C) white noise (S/N = 2), (D) pink noise (S/N = 2), and the YPD approximation with (E) no noise, (F) white noise (S/N = 5), (G) white noise (S/N = 2), (H) pink noise (S/N = 2), and the non-linear YPD equation with (I) no noise, (J) white noise (S/N = 5), (K) white noise (S/N = 2), (L) pink noise (S/N = 2).

TABLE 4. The mr error and CC between the true models and the estimation results of E, v, and ρ, respectively, for different methods and S/Ns.
It is difficult to recover reliable density from the PP-wave alone. Roy et al. (2008) show that stable density may be estimated from wide-angle PP-wave seismic data. The proposed method based on the newly rewritten Zoeppritz equation has a better performance than approximate equation inversion, especially for the large incident angles. Therefore, the real field well-logging data, as shown in Figure 8, is used to analyze the advantage of the proposed method. The synthetic angle gathers are added with the white noise of S/N = 2 and the maximum incident angle is set from 20° to 50° at 5° intervals. Figure 9A and Figure 9B show the analysis of the mr error and CCs between the true models and the inversion results of Young’s modulus (red), Poisson’s ratio (blue), and density (green) based on the newly rewritten Zoeppritz equation (solid lines), the YPD approximation (dotted lines with squares), and the non-linear YPD equation (dotted lines with triangles) with the white noise of S/N=2, respectively. The mr errors and CCs based on the proposed method decrease and increase with an increase of maximum incident angle, respectively, especially for the density information when the incident angle is larger than 35°. However, the mr errors based on the YPD approximation slightly change with increased maximum incident angle, which is larger than that of the proposed method, especially at large incident angles (>30°). The CCs based on the YPD equation slightly change for Young’s modulus, decrease for density, and decrease for Poisson’s ratio (incident angle >40°) with increased maximum incident angle, which is lower than that of the proposed method, especially at large incident angles (>30°). The mr errors based on the non-linear YPD equation are lower than that of the YPD approximation for Young’s modulus and density, slightly higher in terms of Poisson’s ratio. And the CCs based on the non-linear YPD equation are higher than that of the YPD approximation for Young’s modulus and density and lower in terms of Poisson’s ratio. However, the proposed method has a better performance than the non-linear YPD equation in terms of mr errors and CCs. It can be seen that the results inverted from the proposed method have higher accuracy compared with the results obtained from the YPD and non-linear YPD inversion method. And large-angle data is significant to recover the high-resolution density, which has a good performance in the proposed method and has large errors in the approximate equation inversion. Therefore, large-angle or far-offset data is important to obtain stable and accurate results in PP-wave inversion, especially for density, and the proposed method is superior to the approximate equation inversion method.
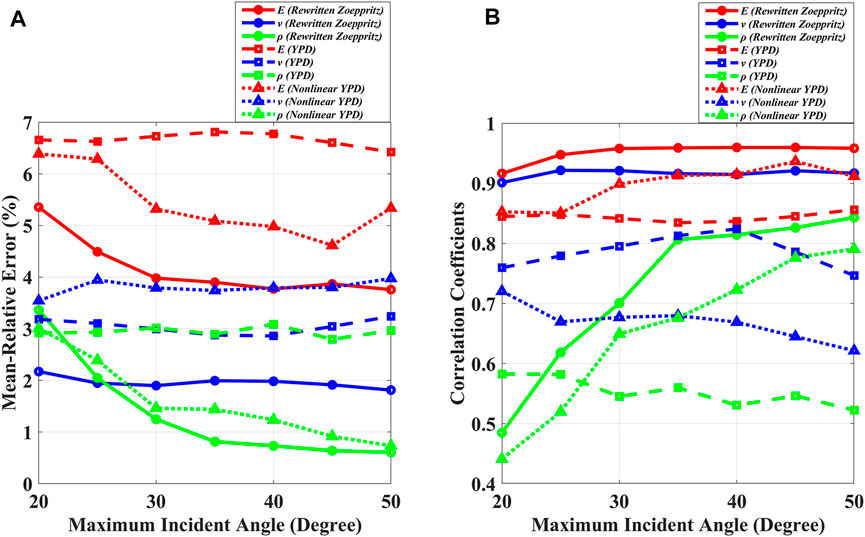
FIGURE 9. Analysis of (A) the mr error and (B) CCs between the true models and the inversion results of Young’s modulus (red), Poisson’s ratio (blue), and density (green) based on the newly rewritten Zoeppritz equation (solid lines), the YPD approximation (dotted lines with squares), and the non-linear YPD equation (dotted lines with triangles) with the white noise of S/N=2.
The proposed inversion method is applied to a field P- to -P wave pre-stack data obtained from a study area of the western Sichuan Depression, China. The target area is a shale-gas reservoir formation in the Xujiahe Group in the Upper Triassic. The seismic data are processed by normal moveout and pre-stack time migration. The P-to-P wave angle gathers, transformed from the offset domain, are used to invert Young’s modulus, Poisson’s ratio, and density, and the maximum incident angle is about 36° due to the limitations of the field data. The post-stack section and the pre-stack angle gather near the well are shown in Figure 10A and Figure 10B, respectively. A calibrated well log, located in CDP 1396 as shown in Figure 10A, is smoothed and deduced along with interpreted horizons to build the initial models by using the Hampson-Russell software for the inversion.
Figures 11A–C show Young’s modulus, Poisson’s ratio, and density profile results obtained by direct inversion, respectively. The black ellipse indicates the target reservoir. There is no Young’s modulus and Poisson’s ratio data in the original logging data, so Young’s modulus and Poisson’s ratio data are indirectly calculated from the P-wave velocity and the shear-wave velocity, correspondingly displayed in the black curve at CDP1396. It can be seen from the inversion profiles that the estimation results of Young’s modulus are high value and Poisson’s ratio are low value in the target reservoir (black ellipse), which are in good agreement with the drilling and rock physics analysis results. Figure 11D shows the comparison among the inversion results (red, blue, and green lines) and corresponding true logs (black) at the location of the well. Inversion stability analysis is executed on the estimation results. The mean-relative errors between the real and estimated Young’s modulus, Poisson’s ratio, and density are 12.59%, 5.13%, and 2.46%, respectively. Although the results of this field data example do not completely match the original well data curves and have more errors than synthetic tests, the overall trend is the same as the original well data. The inversion methods with more advanced regularizations and field seismic data gathers with larger incident angles can be improved the accuracy of the inversion results. The practical application results verify that the proposed direct inversion method is reliable in field data applications, and the accuracy of the estimation results can meet the requirements of brittleness calculation and sweet spot favorable area planning.
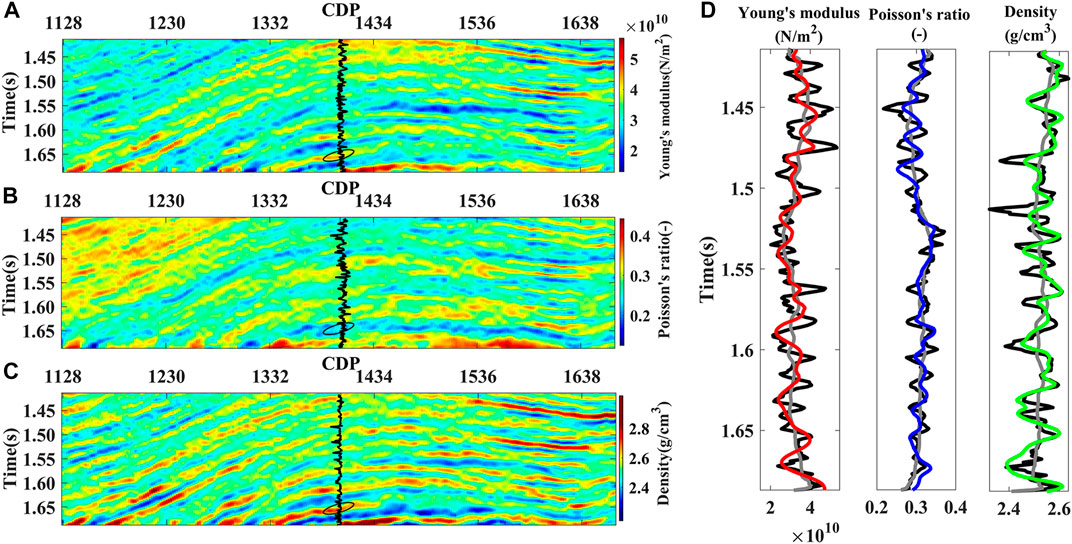
FIGURE 11. Inversion results for (A) Young’s modulus (B) Poisson’s ratio (C) Density. (D) Comparison among the true logs (black), initial models (gray), and inversion results (red, blue, and green) at the well location. The black ellipse indicates the target reservoir.
Young’s modulus and Poisson’s ratio are of great significance to reservoir characterization and rock brittleness prediction in shale gas exploration and development. The proposed inversion method provides an efficient technique to obtain stable and high-resolution density, Young’s modulus, and Poisson’s ratio directly and simultaneously, rather than indirect calculation and approximate equation inversion. The new method has a good performance in wide-angle or wide-offset data with different levels of noise. The proposed method may have great potential in the “sweet spot” evaluation and guidance for subsequent horizontal well deployment and hydraulic fracturing. Note that the original Young’s modulus and Poisson’s ratio need to be calculated by P- and S- wave velocities in well logs. In practice, joint inversion with S-wave data and anisotropic inversion deserve further study in future research.
The requirement that the high-accuracy inversion results of Young’s modulus, Poisson’s ratio, and density cannot meet due to the utilization of the approximate expression of the Zoeppritz equation and indirect calculations. In this study, a new form of the exact Zoeppritz equation and P-to-P wave reflection coefficient based on Young’s modulus, Poisson’s ratio, and density, which have the same accuracy as the original Zoeppritz equation over a wide range of incident angles, were derived. Then a direct and simultaneous AVO inversion of Young’s modulus, Poisson’s ratio, and density based on the new Zoeppritz expression of the P-to-P wave reflection coefficient were presented. The iterative regularized Levenberg Marquardt (IRLM) algorithm was introduced to the inversion method to solve the ill-posed inverse problems. The applications of synthetic data and field seismic data indicate that reliable Young’s modulus, Poisson’s ratio, and density can be recovered directly and simultaneously by using the proposed inversion method based on the new Zoeppritz expression. The proposed direct inversion method for Young’s modulus and Poisson’s ratio supplies an effective and practical technique for “sweet spots” prediction and reservoir characterization in unconventional shale gas exploration and development.
The raw data supporting the conclusion of this article will be made available by the authors, without undue reservation.
BS contributed to the idea, methodology, model and field data testing, and original draft, X-YL collected important background information and edited the manuscript, PD was responsible for the conception and design of the study, reviewing and editing, and supervision, SC and JC checked and polished the manuscript. All authors have read the manuscript and agreed to publish it.
This work is sponsored by the R&D Department of China National Petroleum Corporation (Grant No. 2022DQ0604) and the National Science and Technology Major Project (Grant No. 2017ZX05018005). The funder was not involved in the study design, collection, analysis, interpretation of data, the writing of this article, or the decision to submit it for publication.
The authors are grateful to the editors and reviewers for their review of this manuscript.
The authors declare that the research was conducted in the absence of any commercial or financial relationships that could be construed as a potential conflict of interest.
All claims expressed in this article are solely those of the authors and do not necessarily represent those of their affiliated organizations, or those of the publisher, the editors and the reviewers. Any product that may be evaluated in this article, or claim that may be made by its manufacturer, is not guaranteed or endorsed by the publisher.
The Supplementary Material for this article can be found online at: https://www.frontiersin.org/articles/10.3389/feart.2023.1107068/full#supplementary-material
Aguilera, R. (2016). Shale gas reservoirs: Theoretical, practical and research issues. Petroleum Res. 1 (1), 10–26. doi:10.1016/S2096-2495(17)30027-3
Aki, K., and Richards, P. G. (1980). Quantitative seismology theory. New york, NY, USA: W. H. Freeman.
Avseth, P., Mukerji, T., and Mavko, G. (2005). Quantitative seismic interpretation: Applying rock physics tools to reduce interpretation risk. Cambridge, UK: Cambridge University Press.
Behura, J., Kabir, N., Crider, R., Jilek, P., and Lake, E. (2010). Density extraction from P-wave AVO inversion: Tuscaloosa Trend example. Lead Edge 29 (7), 772–777. doi:10.1190/1.3462777
Castagna, J. P., Spratt, R. S., Goins, N. R., Fitch, T. J., Dey-Sarkar, S. K., and Svatek, S. V. (1993). “Principles,” in Offset-dependent reflectivity–theory and practice of AVO analysis. Editors J. P. Castagna, and M. M. Backus (Houston, TX, USA: Society of Exploration Geophysicists).
Castagna, J. P., and Swan, H. W. (1997). Principles of AVO crossplotting. Lead edge 16 (4), 337–344. doi:10.1190/1.1437626
Chen, X., Zong, Z., and Qu, X. (2022). P-wave reflectivity parameterization and nonlinear inversion in terms of Young’s modulus and Poisson ratio. Interpretation 10 (3), T415–T428. doi:10.1190/INT-2021-0241.1
Cheng, J.-W., Zhang, F., and Li, X.-Y. (2021). Nonlinear amplitude inversion using a Hybrid Quantum Genetic algorithm and the exact Zoeppritz equation. Petroleum Sci. 19, 1048–1064. doi:10.1016/j.petsci.2021.12.014
Curtis, J. B. (2002). Fractured shale-gas systems. AAPG Bull. 86 (11), 1921–1938. doi:10.1306/61eeddbe-173e-11d7-8645000102c1865d
Ding, P.-B., Gong, F., Zhang, F., and Li, X.-Y. (2021). A physical model study of shale seismic responses and anisotropic inversion. Petroleum Sci. 18 (4), 1059–1068. doi:10.1016/j.petsci.2021.01.001
Downton, J. (2005). Seismic parameter estimation from AVO inversion. Calgary, Canada: University of Calgary.
Gong, F., Di, B., Wei, J., Ding, P., Li, H., and Li, D. (2018a). Experimental investigation of the effects of clay content and compaction stress on the elastic properties and anisotropy of dry and saturated synthetic shale. GEOPHYSICS 83 (5), C195–C208. doi:10.1190/geo2017-0555.1
Gong, F., Di, B., Wei, J., Ding, P., and Shuai, D. (2018b). Dynamic mechanical properties and anisotropy of synthetic shales with different clay minerals under confining pressure. Geophys J Int. 212 (3), 2003–2015. doi:10.1093/gji/ggx537
Goodway, B., Perez, M., Varsek, J., and Abaco, C. (2010). Seismic petrophysics and isotropic-anisotropic AVO methods for unconventional gas exploration. Geophysics 29 (12), 1500–1508. doi:10.1190/1.3525367
Guo, Z., Li, X., Liu, C., Feng, X., and Shen, Y. (2013). A shale rock physics model for analysis of brittleness index, mineralogy and porosity in the Barnett Shale. J Geophys Eng. 10 (2), 025006. doi:10.1088/1742-2132/10/2/025006
Huang, H.-D., Wang, Y.-C., Guo, F., Zhang, S., Ji, Y.-Z., and Liu, C.-H. (2015). Zoeppritz equation-based prestack inversion and its application in fluid identification. Appl. Geophys. 12 (2), 199–211. doi:10.1007/s11770-015-0483-3
Jarvie, D. M., Hill, R. J., Ruble, T. E., and Pollastro, R. M. (2007). Unconventional shale-gas systems: The Mississippian Barnett Shale of north-central Texas as one model for thermogenic shale-gas assessment. AAPG Bull. 91 (4), 475–499. doi:10.1306/12190606068
Jin, Z., Li, W., Jin, C., Hambleton, J., and Cusatis, G. (2018). Anisotropic elastic, strength, and fracture properties of Marcellus shale. Int J Rock Mech Min Sci. 109, 124–137. doi:10.1016/j.ijrmms.2018.06.009
Minato, S., and Ghose, R. (2016). AVO inversion for a non-welded interface: Estimating compliances of a fluid-filled fracture. Geophys. J. Int. 206 (1), 56–62. doi:10.1093/gji/ggw138
Ostrander, W. J. (1984). Plane wave reflection coefficients for gas sands at nonnormal angles of incidence. GEOPHYSICS 49 (10), 1637–1648. doi:10.1190/1.1441571
Pan, X.-P., Zhang, G.-Z., Zhang, J.-J., and Yin, X.-Y. (2017). Zoeppritz-based AVO inversion using an improved Markov chain Monte Carlo method. Petroleum Sci. 14 (1), 75–83. doi:10.1007/s12182-016-0131-4
Qian, K.-R., Liu, T., Liu, J.-Z., Liu, X.-W., He, Z.-L., and Jiang, D.-J. (2020). Construction of a novel brittleness index equation and analysis of anisotropic brittleness characteristics for unconventional shale formations. Petroleum Sci. 17 (1), 70–85. doi:10.1007/s12182-019-00372-6
Rickman, R., Mullen, M. J., Petre, J. E., Grieser, W. V., and Kundert, D. (2008). “A practical use of shale petrophysics for stimulation design optimization: All shale plays are not clones of the barnett shale,” in Proceedings of the Spe Technical Conference and Exhibition, Denver, Colorado, USA, Sept 2008.
Roy, B., Anno, P., and Gurch, M. (2008). Imaging oil-sand reservoir heterogeneities using wide-angle prestack seismic inversion. Lead. Edge 27 (9), 1192–1201. doi:10.1190/1.2978982
Rutherford, S. R., and Williams, R. H. (1989). Amplitude-versus-offset variations in gas sands. Geophysics 54 (6), 680–688. doi:10.1190/1.1442696
Rybacki, E., Reinicke, A., Meier, T., Makasi, M., and Dresen, G. (2015). What controls the mechanical properties of shale rocks? – Part I: Strength and Young's modulus. J. Petroleum Sci. Eng. 135, 702–722. doi:10.1016/j.petrol.2015.10.028
Shuey, R. T. (1985). A simplification of the Zoeppritz equations. GEOPHYSICS 50 (4), 609–614. doi:10.1190/1.1441936
Sone, H., and Zoback, M. D. (2013a). Mechanical properties of shale-gas reservoir rocks — Part 1: Static and dynamic elastic properties and anisotropy. Geophysics 78 (5), D381–D392. doi:10.1190/geo2013-0050.1
Sone, H., and Zoback, M. D. (2013b). Mechanical properties of shale-gas reservoir rocks — Part 2: Ductile creep, brittle strength, and their relation to the elastic modulus. Geophysics 78 (5), D393–D402. doi:10.1190/geo2013-0051.1
Song, B., Zhi, L., Chen, S., Zeng, L., and Li, X.-Y. (2016). “Nonlinear PP and PS joint inversion based on the Zoeppritz equations,” in SEG technical program expanded abstracts 2016 (Tulsa, Oklahoma: SEG Library), 538–542.
Vernik, L., Castagna, J., and Omovie, S. J. (2018). S-wave velocity prediction in unconventional shale reservoirs. GEOPHYSICS 83 (1), MR35–MR45. doi:10.1190/geo2017-0349.1
Xie, J., Cao, J., Schmitt, D. R., Di, B., Xiao, L., and Wang, X. (2019). Effects of kerogen content on elastic properties-based on artificial organic-rich shale (AORS). J. Geophys. Res. Solid Earth 124 (12), 12660–12678. doi:10.1029/2019jb017595
Xu, C., Wei, J., and Di, B. (2016). The impact of reservoir scale on amplitude variation with offset. Geophys. Prospect. 65 (3), 736–746. doi:10.1111/1365-2478.12431
Yang, Z., Hou, L., Tao, S., Cui, J., Wu, S., and Lin, S. (2015). Formation and “sweet area” evaluation of liquid-rich hydrocarbons in shale strata. Petroleum Explor. Dev. 42 (5), 609–620. doi:10.1016/S1876-3804(15)30056-2
Zhang, F., Wang, L., and Li, X.-y. (2020). Characterization of a shale-gas reservoir based on a seismic amplitude variation with offset inversion for transverse isotropy with vertical axis of symmetry media and quantitative seismic interpretation. Interpretation 8 (1), SA11–SA23. doi:10.1190/int-2019-0050.1
Zhang, F., Zhang, T., and Li, X.-Y. (2019). Seismic amplitude inversion for the transversely isotropic media with vertical axis of symmetry. Geophys. Prospect. 67 (9), 2368–2385. doi:10.1111/1365-2478.12842
Zhi, L., Chen, S., and Li, X.-y. (2016). Amplitude variation with angle inversion using the exact Zoeppritz equations — theory and methodology. GEOPHYSICS 81 (2), N1–N15. doi:10.1190/geo2014-0582.1
Zhi, L., Chen, S., Song, B., and Li, X.-y. (2018). Nonlinear PP and PS joint inversion based on the exact Zoeppritz equations: A two-stage procedure. J. Geophys. Eng. 15 (2), 397–410. doi:10.1088/1742-2140/aa9a5c
Zhou, L., Li, J., Chen, X., Liu, X., and Chen, L. (2017). Prestack AVA inversion of exact Zoeppritz equations based on modified Trivariate Cauchy distribution. J. Appl. Geophys. 138, 80–90. doi:10.1016/j.jappgeo.2017.01.009
Keywords: Young’s modulus, Poisson’s ratio, sweet spot, Zoeppritz equation, pre-stack inversion, shale
Citation: Song B, Li X-Y, Ding P, Chen S and Cai J (2023) Direct pre-stack inversion of elastic modulus using the exact Zoeppritz equation and the application in shale reservoir. Front. Earth Sci. 11:1107068. doi: 10.3389/feart.2023.1107068
Received: 24 November 2022; Accepted: 20 March 2023;
Published: 03 April 2023.
Edited by:
Hua-Wei Zhou, University of Houston, United StatesReviewed by:
Xinpeng Pan, Central South University, ChinaCopyright © 2023 Song, Li, Ding, Chen and Cai. This is an open-access article distributed under the terms of the Creative Commons Attribution License (CC BY). The use, distribution or reproduction in other forums is permitted, provided the original author(s) and the copyright owner(s) are credited and that the original publication in this journal is cited, in accordance with accepted academic practice. No use, distribution or reproduction is permitted which does not comply with these terms.
*Correspondence: Pinbo Ding, ZGluZ3BpbmJvQGN1cC5lZHUuY24=
Disclaimer: All claims expressed in this article are solely those of the authors and do not necessarily represent those of their affiliated organizations, or those of the publisher, the editors and the reviewers. Any product that may be evaluated in this article or claim that may be made by its manufacturer is not guaranteed or endorsed by the publisher.
Research integrity at Frontiers

Learn more about the work of our research integrity team to safeguard the quality of each article we publish.