 Jiahui Tang
 Xiangde Xu2*
 Wenyue Cai
- 1Collaborative Innovation Center on Forecast and Evaluation of Meteorological Disasters/Key Laboratory of Meteorological Disasters of Ministry of Education, Nanjing University of Information Science and Technology, Nanjing, China
- 2State Key Laboratory of Severe Weather, Chinese Academy of Meteorological Sciences, Beijing, China
A high-resolution numerical simulation was carried out for the extremely heavy rainfall in Henan Province caused by the remote water vapor transport of the binary typhoons In-fa and Cempaka on 20 July 2021. The control simulation successfully captured the evolution process and spatial distribution of the rainfall. The key water vapor supply area of the event was a triangle moisture transport influence domain formed by the local low vortex and the multi-vapor vortex system at low-latitude. By separating the effects of multiple tropical cyclones one by one, we found that In-fa dominated the main water vapor transport in the meridional direction, and directly affected the local water vapor supply in this rainfall process. Cempaka affected intermediate moisture transfer and impacted the location of precipitations, by regulating the distribution of water vapor input and output in the meridional and zonal directions. Removing Cempaka, In-fa, and binary typhoons can reduce the rainstorm area by about 7%, 65%, and 86%, respectively. These differences underscore the importance of binary typhoons in transforming a normal heavy rain event into a high-impact, record-breaking rain event. In addition, the Qinghai-Tibet Plateau exerts a modulation effect on the remote moisture transport of typhoons by multi-scale interactions. Eliminating the influence of plateau topography weakens the maximum precipitation by about 30% and the distribution of heavy rain by about 62%. After comprehensive diagnosis, a conceptual model of typhoon remote water vapor transport based on moisture multi-vortex structure under multi-scale interactions is proposed. The extremity and uncertainty of this rainstorm event can be attributed to the maintenance and development of binary typhoons, the northward extension of the subtropical high, and the anomalous convergence mechanism of water vapor due to the large terrain blocking effect on the plateau.
1 Introduction
Generally, summer water vapor transport in China is closely related to the activities of the Asian monsoon. Large-scale monsoon circulation is one of the key factors of water vapor transport carrying warm and humid air from tropical regions to high latitudes (Wu et al., 2009). The interaction in synergy with tropical cyclones (TCs), the summer monsoon and the large plateau topography is further influences the water circulation in East Asia and its surrounding areas (Zhao et al., 2019; Zhao et al., 2020). Xu et al. (2019) suggested a key area of water vapor transport affecting China and its downstream East Asian region with precipitation anomalies that is a large triangular water vapor transport domain formed by the shift of moisture from the Bay of Bengal through the eastern Qinghai-Tibet Plateau to the Yangtze River basin of China and Japanese Archipelago. Under the influence of large plateau topography, the Indian southwest monsoon drives water vapor transport along the southern edge of the Qinghai-Tibet Plateau and across the Indo-China Peninsula, which then converges with the moisture of the western Pacific in the South China Sea or the East China Sea (Xu and Du, 2015; Chen and Wu, 2016). The above mechanism forms the basic water vapor transport pattern of TC-related precipitation over China in summer.
In addition, TC act as water vapor sources, resulting in TC-related heavy rainfall due to multi-scale interactions (Galarneau et al., 2010; Lin and Wu, 2021). The high-value area of the pressure gradient between TCs and the subtropical high is conducive to the formation of a low-level jet, which pulls water vapor along the channel between the north side of the TCs and the subtropical high, and deep in front of the TCs resulting in the East Asian monsoon, thereby forming local precipitation (Yu and Cheng, 2014; Chen and Wu, 2016). Such long-distance moisture transport can generate a long-lived, quasi-stationary mesoscale convective system outside the TC’s circulation, and associated precipitation event is called predecessor rain event (PRE) (Cote, 2007; Galarneau et al., 2010; Schumacher, 2011).
PREs are of extraordinary significance to precipitation in northern China, as one-third to one-half of the rainfall events in northern China are typhoon-induced indirect precipitation caused by the interaction of mid- and low-latitude systems with TCs (Chou, 1997; Sun and Zhao, 2000). Historically, many typical northern catastrophic heavy rains displayed the characteristics of PRE, such as the rainstorm events known as “75.8 Henan,” “7.21 Beijing,” and “7.20 Zhengzhou”.
From 17 to 22 July 2021, an extremely heavy rainfall event occurred in Zhengzhou, China, and produced an hourly rainfall rate of 201.9 mm, which broke the station record for mainland China. As a typical and extreme PRE, the diagnosis and simulation of multi-scale characteristics showed that the rainstorm was caused by the interaction of atmospheric systems in the middle and lower latitudes, and combined with the influence of topography (Ran et al., 2021; Liang et al., 2022). The terrestrial and oceanic moisture over southern China-western North Pacific was both crucial for the extreme precipitation event over Henan (Nie and Sun, 2022). The main moisture transport was driven by airflows on the peripheries of binary tropical typhoon (BT) In-fa and Cempaka (Deng et al., 2022; Sun et al., 2023). The event produced well-organized mesoscale convective systems whose unique dynamic structure contributes significantly to record-high hourly rainfall (Yin et al., 2021).
Although some studies have been carried out on the mesoscale conditions, topographic effects, and the triggering and development process of the convective system, some studies have shown that the predictability of this event is essentially limited, and the rainfall prediction accuracy is insufficient (Zhang et al., 2022). The interactions between multiple TCs and atmospheric circulation are very complex. For BT, differences in the distance, intensity, influence radius, and peripheral airflow all have an impact on the interaction (Bosart et al., 2012; Xu et al., 2022a; Xu et al., 2022b). It is still challenging to forecast and understand the water vapor transport of this extreme precipitation events under the influence of BT.
Previous studies have shown that moisture transport in front of TCs can substantially increase rainfall in mid-latitudes and exacerbate the impact of the resulting disaster events. However, the specific mechanism of moisture transport caused by the interaction between TCs and mid-latitude systems remains unclear. High-resolution numerical models can be used to study the uncertainty of the effect of BT on extreme precipitation events and further express the overall effect of large-scale water vapor budget of PREs. These initiatives help to quantify water vapor transport and the ultimate impact on precipitation.
Our study focuses on the Zhengzhou rainstorm event on 20 July 2021. We investigate the effect of abnormal water vapor transport caused by the related circulation of the multi-system on this extreme precipitation event. Specifically, this paper aims to quantify the remote effects of the BTs moisture on extreme precipitation, discuss the water vapor transport effect between multiple vortex systems at low latitudes, and further explore the contribution and correlation mechanism of the large topography of the Qinghai-Tibet Plateau to the development and maintenance of heavy rainfall events in the north of China.
2 Model configuration and experimental design
In this paper, WRF Advanced Research Weather (WRF-ARW) model, version 4 (Skamarock et al., 2019) was used to simulate the extreme rainstorm in Henan Province on 20 July 2021. The initial field and lateral boundary conditions was from the ECMWF Reanalysis v5 (ERA5, 0.25° × 0.25°) data set (Hersbach et al., 2020). Other data used in this paper included ground station observation data and high spatiotemporal resolution (10 km grid spacing and 1 h temporal resolution) gauge-satellite merged (Shen et al., 2014) precipitation analysis data set provided by the China Meteorological Administration (CMA). The rainfall product of CMA was estimated based on >30,000 hourly rainfall gauge station data from China and the Climatic Prediction Center Morphing Technique (CMORPH) precipitation products. Compared with the station data, the grid point precipitation was more advantageous for reflecting precipitation characteristics in areas with sparse stations and mountains.
All the simulations were initialized at 0000 UTC on 19 July 2021 with 76 h integration time. We also carried out the simulation with earlier initial times (not shown), but the results were not as good as with the above settings. The horizontal grids include three nested domains with a minimum size of 3 km (Figure 1). The 38 vertical levels expand from the surface to 10 hPa, with 8 levels below 1 km. The parameterization scheme settings of the schema are shown in Table 1.
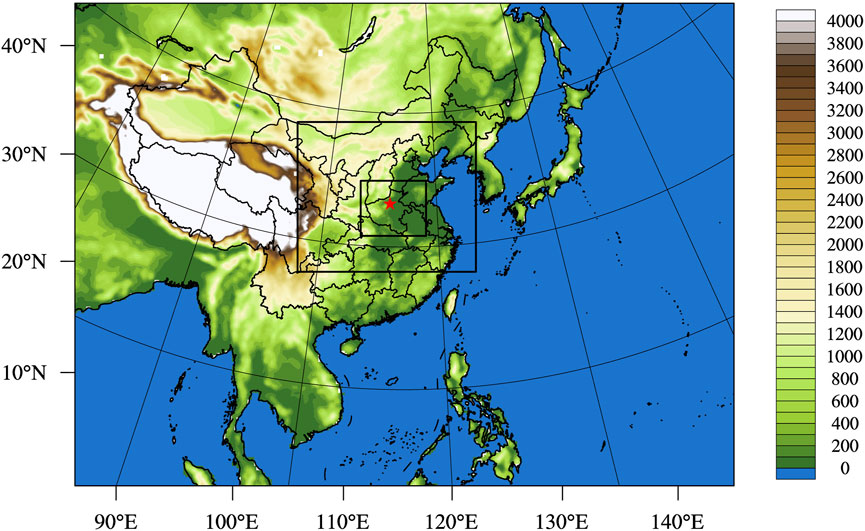
FIGURE 1. Configuration of the Weather Research and Forecasting (WRF) model domains (D01-D03); shading represents the terrain height (unit: m). The location of Zhengzhou city is marked as a red pentagram.
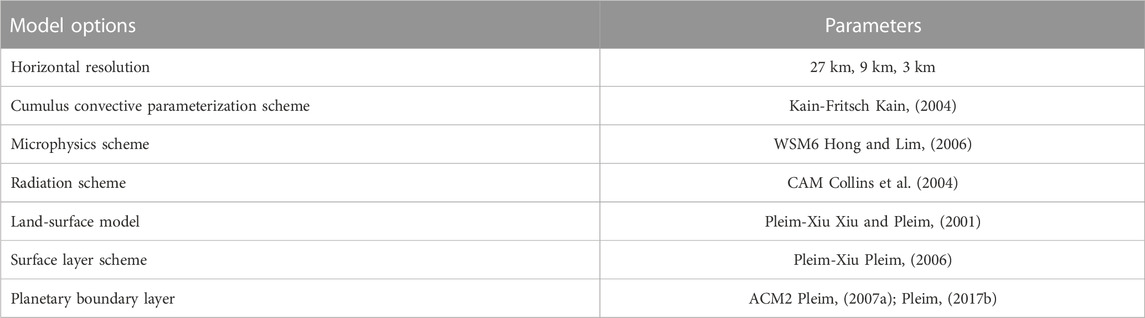
TABLE 1. Model configuration and parameters.
We consider that the extreme precipitation event was influenced by remote binary typhoons with the interaction of multi-scale systems, the multiple vortex systems at low latitudes exerting a significant water vapor transport effect (Xu et al., 2022b). To investigate the mechanism of the influence of the BT on this extreme precipitation, the following sensitivity experiments were designed in Table 2.
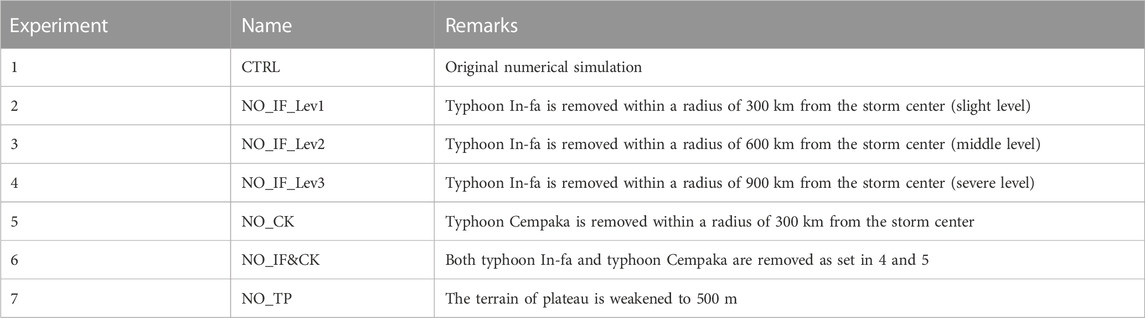
TABLE 2. List of experiments.
Experiment 1 was a control experiment, representing the original simulation results of the precipitations. Three additional sensitivity experiments (Experiments 2–4) were conducted to quantitatively determine the water vapor transport effect of typhoon In-fa, by removing In-fa slightly, moderately, and severely in the initial fields. Experiment 5 was designed to remove Typhoon Cempaka, while Experiment 6 removed the binary typhoons. The sensitive experiments 2–6 are conducted by modifying the TC-related dynamic and thermodynamic fields in the initial condition using the TC bogussing scheme (Low-Nam and Davis, 2001). In order to remove TC circulation in background field, the TC-related correlation vorticity, divergence and geostrophic vorticity are removed within different influencing radius of TC center. The slightly, moderately and severely elimination of typhoon In-fa corresponded to the radius of 300, 600 and 900 km respectively. Due to the small scale of the typhoon Cempaka, the revised radius is limited to 300 km.
Generally, China in topography descends from the west to the east, and forms a three-step “staircase” according to altitude. To further discuss the influence of the large plateau topography on the moisture transport during this extreme rainstorm, the altitude above the second step of China terrain was reduced to 500 m in Experiment 7.
3 Results and discussion
3.1 Background analysis of extreme precipitation event
The configuration of the large-scale environmental field of the “7.20”extreme rainstorm in Henan had significant features. The 200 hPa situation field indicated that the geopotential height field in the upper layer was a distribution pattern of two troughs and one ridge. Among them, the western trough was of large meridional span, extending from the Loess Plateau to the Yunnan-Guizhou Plateau, and the eastern trough was positioned at the Yellow Sea. Henan was in between the two troughs, affected by the ridge of high pressure. Thus, Henan presented an anticyclonic circulation in which the wind direction changed from southwest to northwest, and it was located in the south of the upper jet stream area with remarkable divergences in the upper layer (Figure 2A).
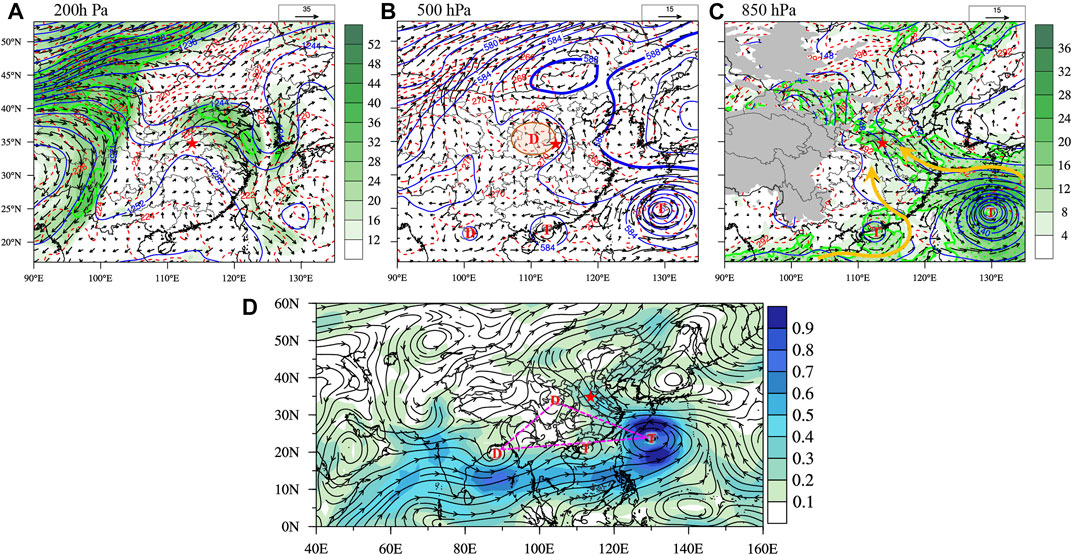
FIGURE 2. (A–C) 200, 500, and 850 hPa large-scale circulation fields at 0600 UTC July 20. The blue solid line represents the potential height (unit: gpm), the blue bold line indicates the isoline of 588 hPa, the red dashed line denotes the isotherm (K), the arrow means the vector wind (unit: m/s), color shading represents wind speed (unit: m/s), the gray shadows represent the terrain, the two yellow arrow means the west and east moisture branch, and the circled area of green dots is upper- and low-level jet areas. (D) Vertically integrated water vapor flux field (unit: 103 kg m−1s−1). The letters “D” and “T” represent the low-pressure center and typhoon, respectively, and the red pentagram represents the location of Zhengzhou.
Figure 2B shows the typical BT system composed of In-fa and Cempaka in 500 hPa. The Huang-Huai region was affected by cyclonic circulations twice before and after, the first of which occurred on 19 July from 0000 to 1500 UTC in southeastern Henan Province (Figure omitted), and the second was a new mesoscale vortex that developed at 2200 UTC 19 July, which was the main system influencing this heavy rainfall in Henan (Yin et al., 2021; Xu et al., 2022a). The Huang-Huai cyclone occurred at the intersection of Shaanxi, Shanxi, and Henan, with Henan in the east. The strong northerly position of the subtropical high was conducive to the transport of southeastern water flow along the edge of the subtropical high to the key rainstorm area; the 588 hPa line was nearly connected with the high pressure near Inner Mongolia at 45°N, developing a “high pressure dam”. This blocked the southeastern airflow from continuing northward and made it gather and sustain in the central plain.
At 850 hPa (Figure 2C), Henan was under the control of a strong low-level jet. The southeastern airflow between subtropical high and In-fa transported a large amount of moisture, which formed the east branch of the typhoon. At the same time, Typhoon Cempaka also acted as a transit station to transfer some of water vapor, which formed the west branch. Blocked by Taihang Mountain, the airflow of the east and west branches accumulated and converged on a windward slope terrain (west of Zhengzhou), which promoted the development of the precipitation system.
The vertically integrated water vapor flux (Figure 2D) shows that a low vortex circulation zone formed, composed of several water vapor vortices in low latitude. This is referred to as a multi-vortex system in this paper. This moisture transport feature combined with the subtropical high to facilitate transport of water vapor from low latitude to high latitude by the typhoon. The South Asian low pressure, typhoons, and local low vortex formed a triangle (dashed lines in Figure 2D), which constituted the key water vapor supply area for this extreme event.
In summary, the large-scale circulation characteristics of this storm were remarkable, with upper-level dispersion and lower-level convergence providing dynamic conditions conducive to the generation of heavy rainfall. The subtropical high, typhoons, and local low vortices were the main influencing systems, triggering strong convective processes with the topographic effects under the interaction of multi-scale systems. In addition, the multi-vortex transport system of moisture based on the BT provided a steady source of water vapor. The resultant dynamic, thermal, and water vapor conditions drove the development of the extreme rainstorm event in Henan.
3.2 Verification of the control run
The heaviest precipitation during this event occurred on July 20. The observed precipitation displayed distribution characteristics along the terrain, with strong mesoscale rain clusters (Figures 3A, B, D, E). The large-range precipitation area was located in the northwest of Henan, and the main center was located in Zhengzhou. The long duration, wide range of heavy rainfall, and high intensity over a short time were the remarkable characteristics of this event.
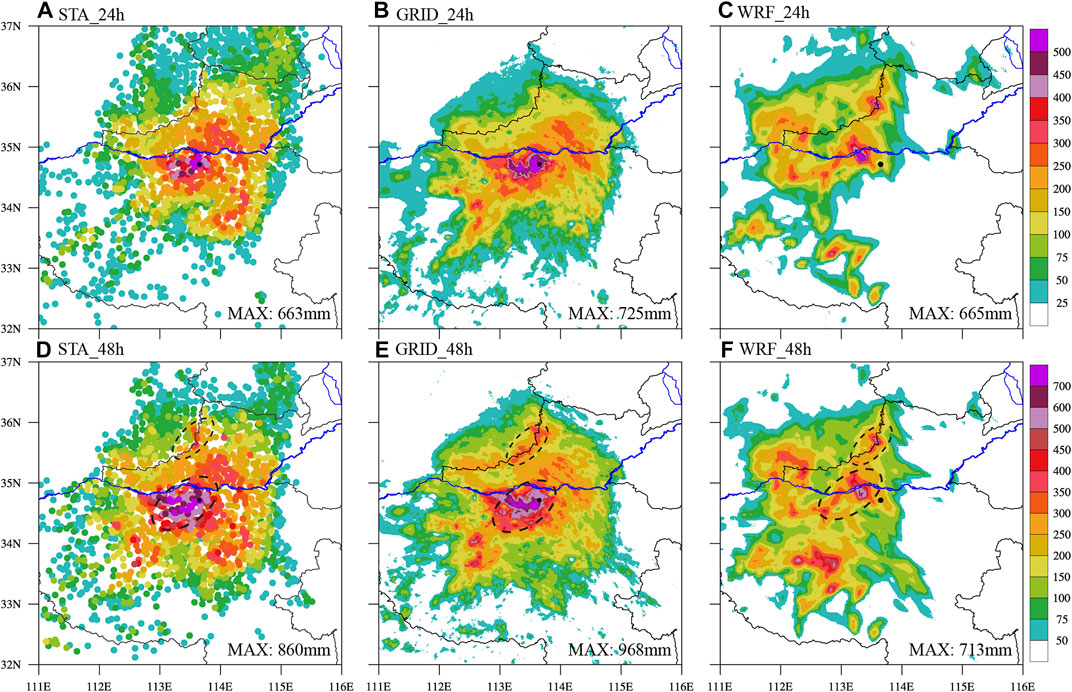
FIGURE 3. Observed and simulated 24 h cumulated precipitation distributions from 0000 UTC July 20 to 0000 UTC 21 July 2021 (A–C) and 48 h (D–F) cumulated precipitation distributions from 0000 UTC July 19 to 0000 UTC 21 July 2021 (unit: mm) (A, D) Observation precipitation of stations (B, E) Grid point precipitation from the China Meteorological Administration observations (C, F) Simulated precipitation distribution of control test. The black dashed circle represents the main rain belt. The black dot represents the location of Zhengzhou.
A control simulation provided a reasonable replication of the observed event, with a simulated 24 h accumulated maximum rainfall amount of 665 mm (Figure 3C), consistent with the observed station maximum of 663 mm (Figure 3A). The location of the centers and distribution pattern of rainfall compared well with observations, although the rain clusters were slightly smaller in the simulation relative to the observations. Further comparing the 48 h accumulated precipitation, the simulated results showed two small-scale intense centers consistent with the observations (dashed circles in Figures 3D–F), which were located in the urban area of Zhengzhou and on the windward slope in the north. The simulated rainfall levels matched with the observations in the 24 h time series of precipitation in the center (Figure 4), while the overall timing of cumulated precipitation lagged behind the observations. In addition to the complexity of the weather process itself, the initial field error and systematic error, as well as the coordination of the parameterization scheme and the spin-up process may lead to the lag of the precipitation forecast.
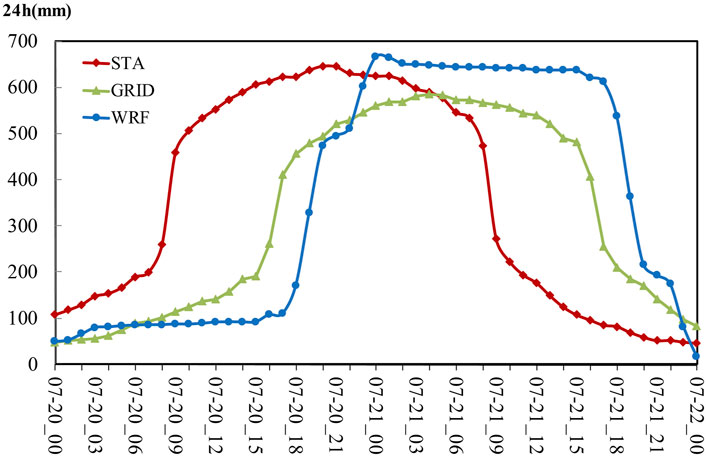
FIGURE 4. 24 h precipitation time series (unit: mm) observed at the Zhengzhou station (The black dot in Figures 3A, B) and simulated locations of maximum precipitation. The red line is the station observation, the grid line is grid point precipitation and the blue line is the simulated precipitation of control test.
In summary, the simulation results accurately captured the evolution process and spatial distribution of the event, and the reproduction of the double rainfall center in the urban area and mountainous areas. The simulation was well suited for use as a control run for quantifying the precipitation change and response caused by tropical moisture transport ahead of the typhoon.
3.3 Sensitivity experimental diagnosis of typhoon
Three quantitative sensitivity numerical experiments were designed for typhoon In-fa. Experiment Lev1-Lev3 represented the gradual attenuation of In-fa, to study the water vapor transport and the interaction mechanism of typhoon In-fa on the typhoon remote rainstorm.
Figures 5A–D shows that with the gradual elimination of In-fa, the precipitation in each experimental area changed compared to the CTRL experiment (Figure 5A). With the slight attenuation of In-fa in Lev1 test (Figure 5B), the change of overall precipitation was not obvious, with even a slightly enhanced trend in extreme precipitation in local areas (Figure 5F). When the typhoon weakened further in Lev2 test (Figure 5C), the rainfall area still occurred, but its organizational structure changed. The heavy precipitation center near Zhengzhou weakened significantly, and the precipitation cluster in the northern mountains began to dissipate (Figure 5G), with maximum precipitation decreased by 58 mm compared with the CTRL experiment (Figure 5I). After complete elimination of In-fa in Lev3 test (Figure 5D), the heavy precipitation center dissipated completely, and the previous heavy precipitation center turned into sparse and scattered light rain areas (Figure 5H), with maximum precipitation reduced by about 135 mm (Figure 5I).
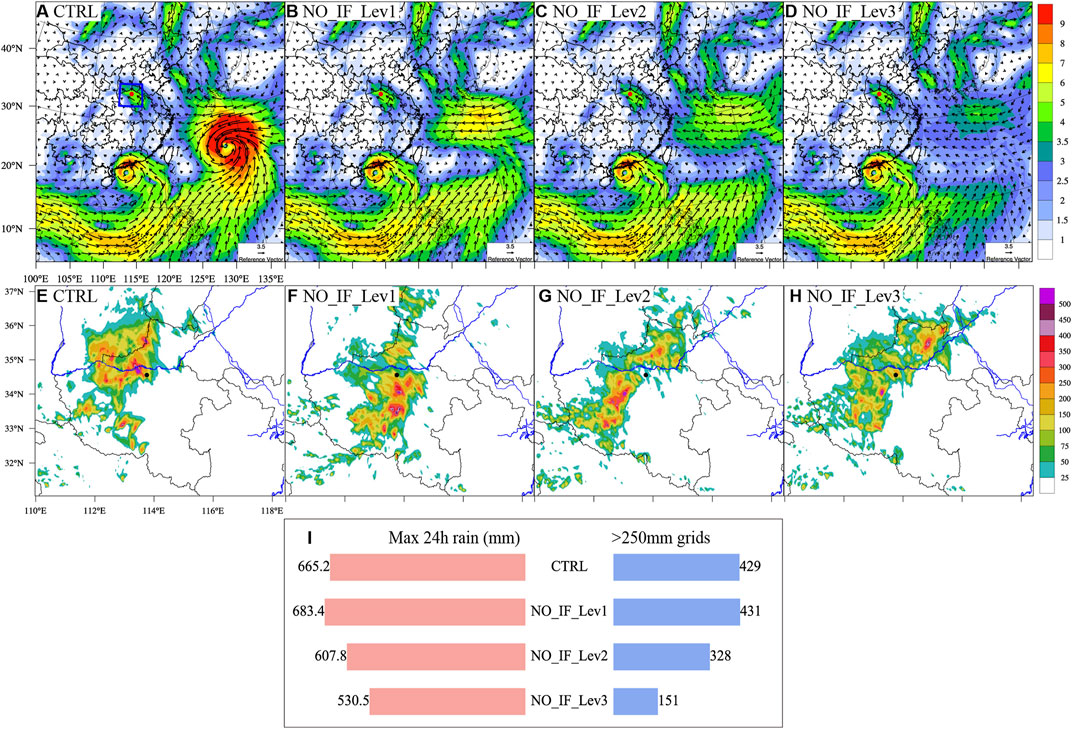
FIGURE 5. Comparison of experiments CTRL, NO_IF_Lev1, NO_IF_Lev2, and NO_IF_Lev3. (A–D) Vertically integrated water vapor flux (unit: 102 kg m−1s−1) of the initial field at 0000 UTC July 19. (E–H) 24 h precipitation (unit: mm) from 0000 UTC July 20 to 0000 UTC 21 July 2021. (I) Histograms of the maximum 24 h precipitation (unit: mm) from 0000 UTC July 20 to 0000 UTC 21 July 2021 and the number of precipitation grid points >250 mm for the above experiment.
The precipitation levels and distribution of heavy precipitation in several groups of experiments were analyzed to obtain the histogram in Figure 5I. Precipitation gradually weakened as the intensity of In-fa gradually decreased. When In-fa was completely removed, the maximum precipitation decreased from 665.2 mm to 530.5 mm, a reduction of about 20%. The number of grids with daily precipitation greater than 250 mm indicate the overall regional distribution of extreme rainfall. Completely removing typhoon In-fa caused the grid number with heavy rainfall to decrease from 429 to 151, which means that the overall distribution of extreme precipitation area decreased by about 65%.
Typhoon In-fa directly affected the rainfall of the rainstorm in Henan Province. This can be temporarily attributed to the close relationship between the intensity of In-fa and the moisture channel formed by In-fa and the subtropical high. This will be verified later in the paper.
Based on previous analyses of weather background and existing studies, we know that extreme rainstorm processes in Henan involve water vapor transport effect among the low-latitude multi-vortex systems, as well as abnormal configuration of the subtropical high and multi-scale circulation (Xu and Du, 2015; Ran et al., 2021). In this study, we removed the single and binary typhoons in the multi-vortex system respectively to investigate the effect of the interaction of typhoons and mid-low latitude circulation on water vapor transport of extreme rainstorm events in northern China.
In Figures 6B, F, typhoon Cempaka was removed compared with the control tests (Figures 6A, E). The corresponding precipitation center moved obviously eastward, but high daily precipitation was still maintained, with a maximum value of 599.2 mm. After the removal of In-fa, the overall rainfall in the entire region significantly weakened, the heavy precipitation center mostly dissipated, and the maximum value was reduced to about 530.5 mm (Figures 6C, G). After the binary typhoons were removed simultaneously, precipitation in the entire region largely disappeared, as well as the pattern of the extreme rainstorm, and maximum precipitation stayed at around 387.2 mm (Figures 6D, H).
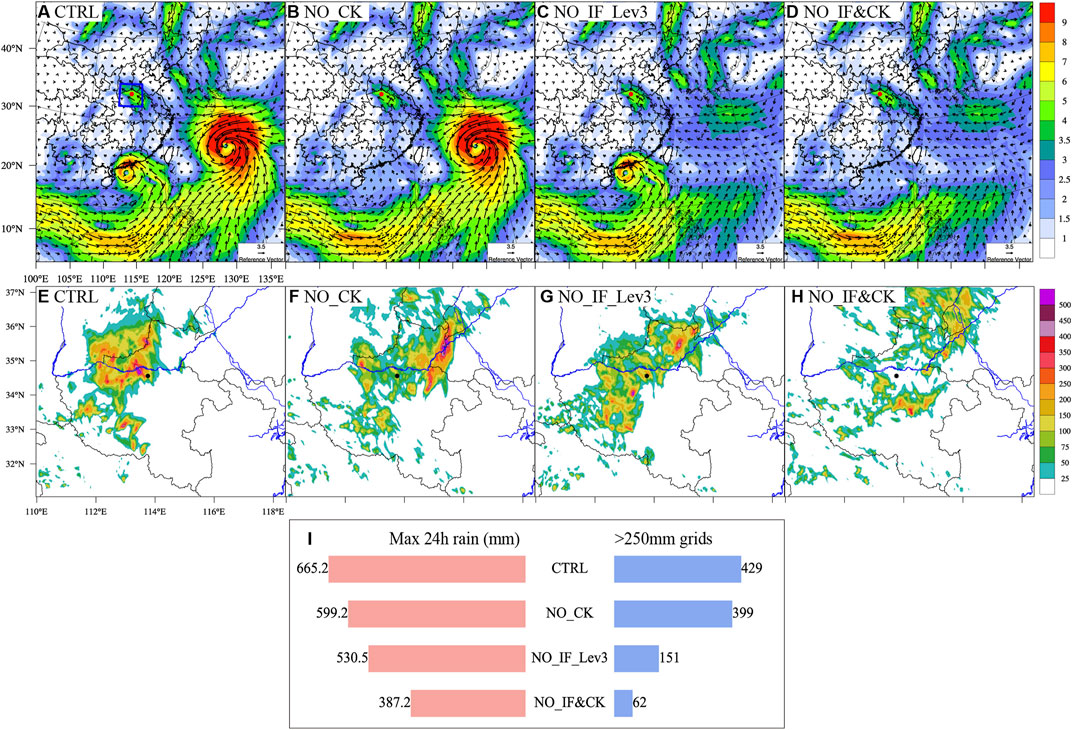
FIGURE 6. Comparison of experiment CTRL, NO_CK, NO_IF_Lev3, and NO_IF&CK. (A–D) Vertically integrated water vapor flux (unit: 102 kg m−1s−1) of the initial field at 0000 UTC July 19. (E–H) 24 h precipitation (unit: mm) from 0000 UTC July 20 to 0000 UTC 21 July 2021. (I) Histograms of the maximum 24 h precipitation (unit: mm) from 0000 UTC July 20 to 0000 UTC 21 July 2021 and the number of precipitation grid points >250 mm for the above experiment.
As seen in the histogram (Figure 6I), the gradual elimination of single and double typhoons gradually weakened precipitation. Specifically, maximum precipitation was reduced by about 10%, 20%, and 42%, respectively, and the corresponding distribution area of extreme rainfall was reduced by about 7, 65, and 86%, respectively, after Cempaka, In-fa, and the binary typhoons were removed.
Therefore, in the multi-vortex type TC remote moisture transport associated with Henan’s “7.20” rainstorm, the western small typhoon Cempaka mainly affected the location of precipitation areas, and the eastern typhoon In-fa located in the western Pacific dominated the distribution pattern and intensity of extreme rainstorms. The combined action of the binary typhoons maintained the basic precipitation pattern of this extreme event. Supposing they disappeared simultaneously, the extreme rainfall would be greatly weakened, and the rainstorm area would dissipate as well.
3.4 Response of large plateau terrain to extreme precipitation
As the “Water Tower of Asia,” the Qinghai-Tibet Plateau is of great significance to water vapor transport under multi-scale interaction (Xu et al., 2019). The terrain effect is also a critical factor influencing sudden and prolonged local extreme precipitation. To further explore the contribution of the large plateau terrain on water vapor transport during this event, the altitude above the second step of China terrain was reduced to 500 m. By comparing with the control run (Figures 7A, C), we found that eliminating the influence of large terrain led to a cluster pattern of precipitation. Due to the lack of terrain obstacles, the rain area shifted to the northwest, which was mountainous in the control run (Figures 7C, D). There were large differences in the distribution of heavy precipitation. The maximum precipitation was reduced by about 30% from 665 mm to 467 mm, and the number of grid points for heavy rainstorm dropped by about 62%–165% (Figure 7E).
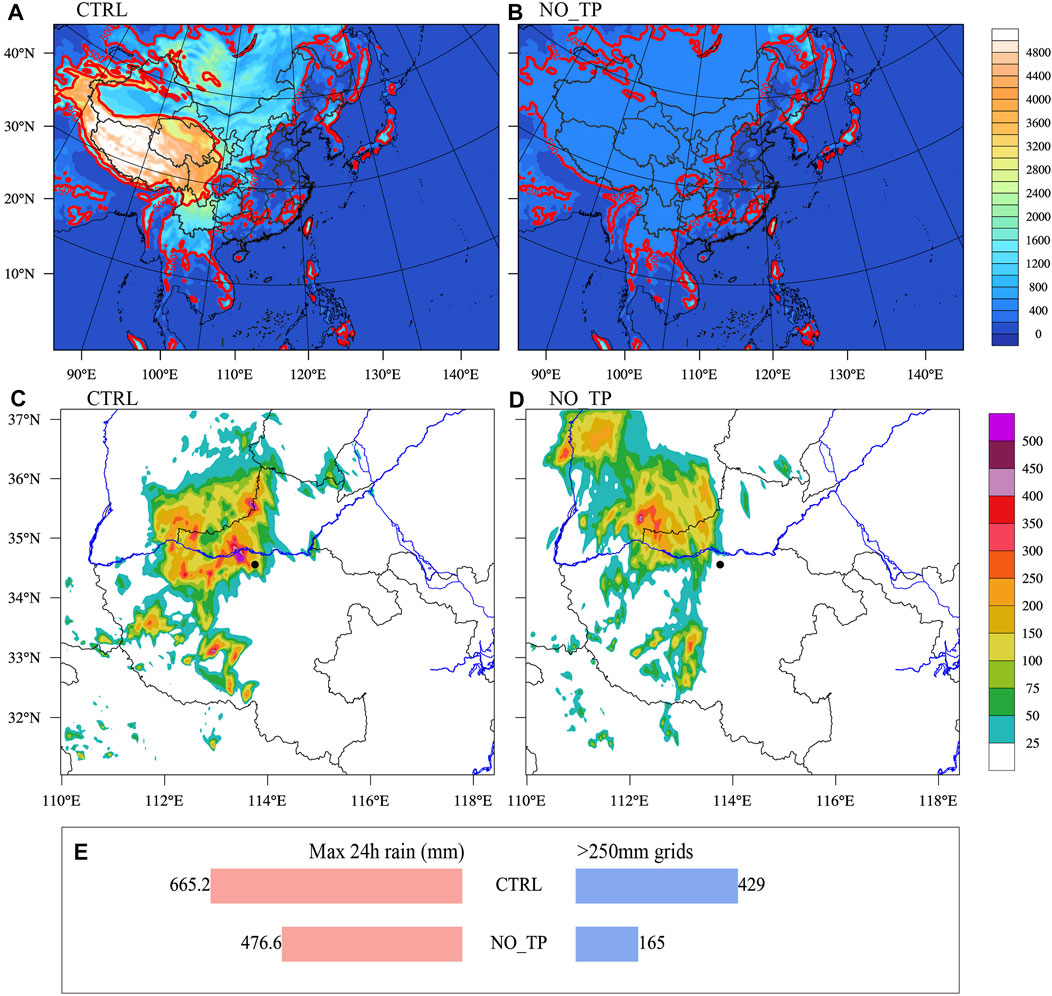
FIGURE 7. Comparison of experiment CTRL and NO_TP. (A–B) Terrain height (unit: m) of the initial field at 1900 UTC. (C–D) 24 h precipitation (unit: mm) from 0000 UTC July 20 to 0000 UTC 21 July 2021. (E) Histograms of the maximum 24 h precipitation (mm) from 0000 UTC July 20 to 0000 UTC 21 July 2021 and the number of precipitation grid points >250 mm for the above experiment.
Such changes in displacement and intensity of precipitation can be attributed to the elimination of plateau changing the moisture transport path on a large scale (Li et al., 2016), and can affect the local moisture convergence on a meso- and micro-scale (Shi et al., 2008; Hua et al., 2020). It has been suggested that during the summer monsoon phase, the Tibetan Plateau and its extended topography affected water transport channels, forcing the moisture from tropical oceans to flow along the eastern and northern part of the Qinghai-Tibet Plateau through low air vortex (Xu et al., 2004; Zhao et al., 2019). The results in this subsection also confirmed the role of the Tibetan Plateau in guiding water vapor from typhoons at low latitudes, which indirectly affected the development of local rainstorm.
3.5 Diagnosis of regional water vapor budgets in different tests
The water vapor budget of the specified key rainstorm area (Figure 5A box) during the “7.20”rainstorm in Henan was diagnosed and analyzed, to further refine the water vapor contribution of each typhoon in the multi-vortex. The time series of water vapor flux in each experiment is given in Figure 8. The positive income for moisture was shown in the all tests, which rose sharply at night on the 20th days.
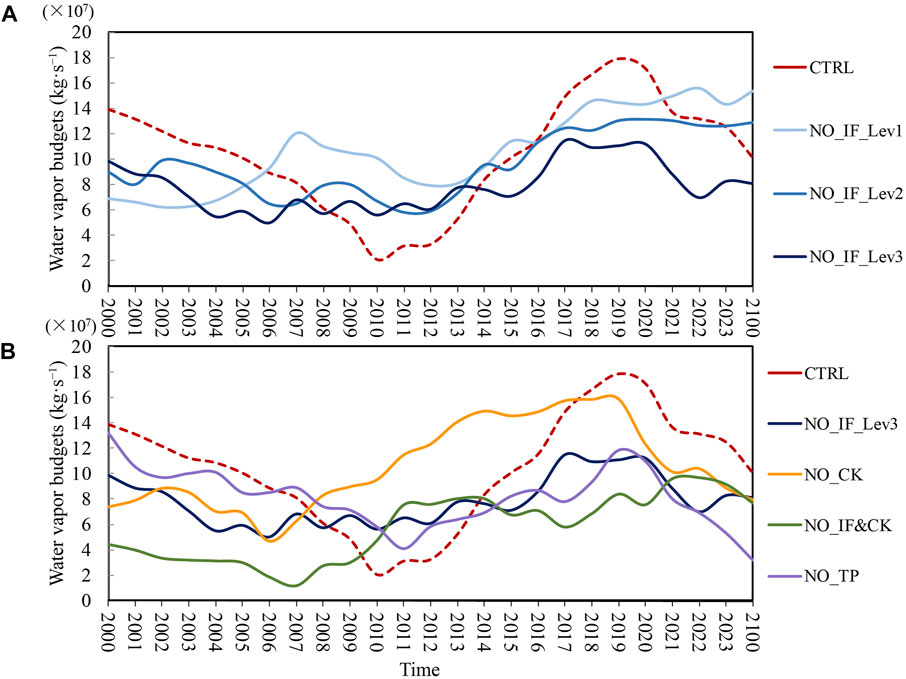
FIGURE 8. Time series of the vertically integrated water vapor flux (from the surface to 50 hPa, unit: 107 kg s−1, positive inward and negative outward) and budget (the sum of four boundaries of box in Figure 5E). (A) Comparison groups of NO_IF in Lev1-Lev3. (B) Comparison groups of CTRL, NO_IF_Lev3, NO_CK, NO_IF&CK, and NO_TP.
According to Figure 8A, the weakening of moisture transport caused by In-fa mainly occurred during the period of 1500 to 2100 UTC on July 20, corresponding to the peak of water vapor transport in the control test. With the gradual elimination of In-fa, the moisture peak of sensitivity tests gradually flattened and the magnitude decreased, reflecting that the transport of In-fa to the key rainstorm area gradually decreased.
Figure 8B shows the water vapor transport budget of the removal tests for different objects. When Cempaka alone was removed, the curve of the transport was similar to that in the control test. The difference in magnitude was not particularly obvious, and only the position was shifted, suggesting that the timing of moisture transport was changed. This further supports the shift of the rain area mentioned above (Figure 6F). After In-fa was removed, the transport curve became gentle and the volume of moisture transported was reduced. After the binary typhoons were removed simultaneously, the magnitude in the peak range of water vapor transport weakened further, to about 75% of the control. In the experiment where the large plateau terrain was eliminated, the transport was also remarkably reduced in the late stages of the event.
Table 3 provides the average regional water vapor budget on the four boundaries. The eastern and southern boundaries were net input (>0), while the western and northern boundaries were net output (<0), consistent with the prevailing southeasterly winds in large-scale circulation of the key area. When In-fa was removed at different intensities in Lev1-Lev3 experiments, the net input slowly weakened compared with the control test. Upon the removal of Lev3, the input of the south and east boundaries and the output of the west and north boundaries were all weakened. In the Lev1 and Lev2 tests, the input at the southern boundary and the output at the northern boundary decreased, while the input at the eastern boundary and the output at the western boundary increased marginally. When the overall net budget changes little, the entry of moisture shifted from the south boundary to the east boundary, indicating the eastward displacement of the water vapor branches. A similar feature of the water vapor budget also appeared after removal of Cempaka alone.
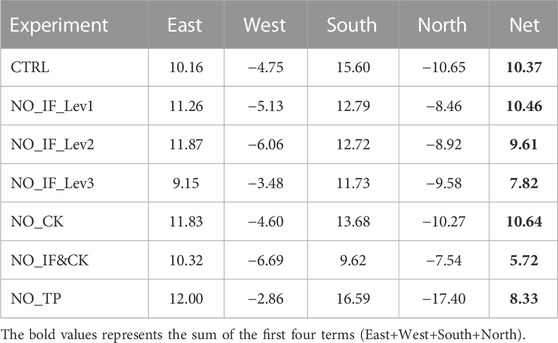
TABLE 3. The average regional water vapor budgets on July 20 (unit: 107 kg s−1, positive inward and negative outward).
Simultaneously removing the binary typhoons resulted in the largest weakening of the water vapor input (9.62 × 10⁷ kg s−1) at the southern boundary, and the lowest water vapor net input. After the blocking effect of the plateau terrain disappeared, the water vapor continuously output from the northern boundary.
The water vapor budgets of the sensitivity tests in the meridional direction (S-N) and zonal direction (E-W) were diagnosed respectively (Figure 9). The E-W input differences were not obvious after typhoon In-fa was removed, while the S-N input was significantly reduced by 57% compared to the control test. The single removal of Cempaka increased E-W input by 33% and decreased S-N input by 31%, which jointly resulted in little difference between the total budgets compared with the control test. The simultaneous elimination of the binary typhoons substantially reduced both the meridional and zonal inputs, reducing the S-N input by 58% and the E-W input by about 33%.
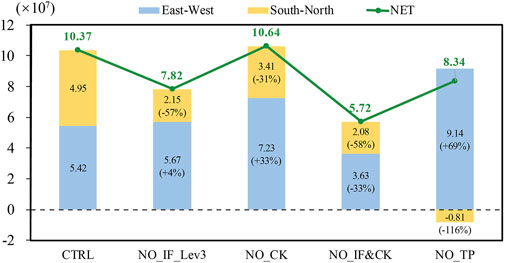
FIGURE 9. Average regional water vapor budgets on July 20 (unit:107 kg s−1) in the meridional and zonal directions of comparison groups.
As can be seen from the above results, In-fa mainly affected the water vapor budget in the meridional direction, widely influencing the overall moisture transport in the key rainstorm area, while Cempaka modulated the distribution of water vapor budget in the meridional and especially in the zonal direction. Removing the binary typhoons generally cut off the supply of moisture branches, and the water vapor in both the meridional and zonal directions was significantly weakened.
After the effect of the plateau terrain was eliminated (Figure 9), the E-W input increased by 69%, while the net S-N output of moisture reduced by 116% compared with the control test. This resulted in a net input of overall water vapor in NO_TP test. The change of meridional water vapor from input to output indicated that the blocking and convergence effect of the terrain disappeared, and the water vapor largely flowed out from the northern boundary. The increase of zonal water vapor, on the other hand, may be related to the displacement of the Huang-huai cyclone.
To further investigate the specific mechanism of water vapor transport in the late stage of the rainfall event, we conducted sensitivity tests on moisture deviation distribution (Figure 10). Compared to the CTRL, removing Cempaka (NO_CK) resulted in the intensity of typhoon In-fa increasing marginally, and positive and negative moisture transport anomalies were seen in the northeast and interior of the key area associated with rainstorm, respectively. Both positive and negative were of comparable intensity (Figure 10A). The effects of removing In-fa (NO_IF_Lev3) included a weakening of the intensity of minor Typhoon Cempaka, decrease in water vapor from the Indian Ocean, and a gradual southward expansion of the subtropical high. The negative anomalies on the south side of the precipitation key area led to the weakening of the main water vapor branch, and the east side of the key area had positive anomalies but basically did not involve the area (Figure 10B). After the simultaneous removal of the binary typhoons (NO_IF&CK), the deviation distribution field of water vapor flux was similar to NO_CK, but with more remarkable southward and westward expansion of the subtropical high. The rainstorm key area was almost covered by the subtropical high causing the local low-pressure vortex to weaken further. The positive abnormal transport in the east side of the key region basically disappeared, and more extreme negative anomalies were seen in the interior and south of the key area (Figure 10C). Without the obstruction of terrain, the water vapor passed directly through the key area to the north, resulting in moisture-positive anomalies in the northwest of the key area. The cyclonic anomalous circulation in the northwest region of the box indicated that the Huang-Huai cyclone of the NO_TP test shifted to the northwest area which was mountainous in the original CTRL test (Figure 10D).
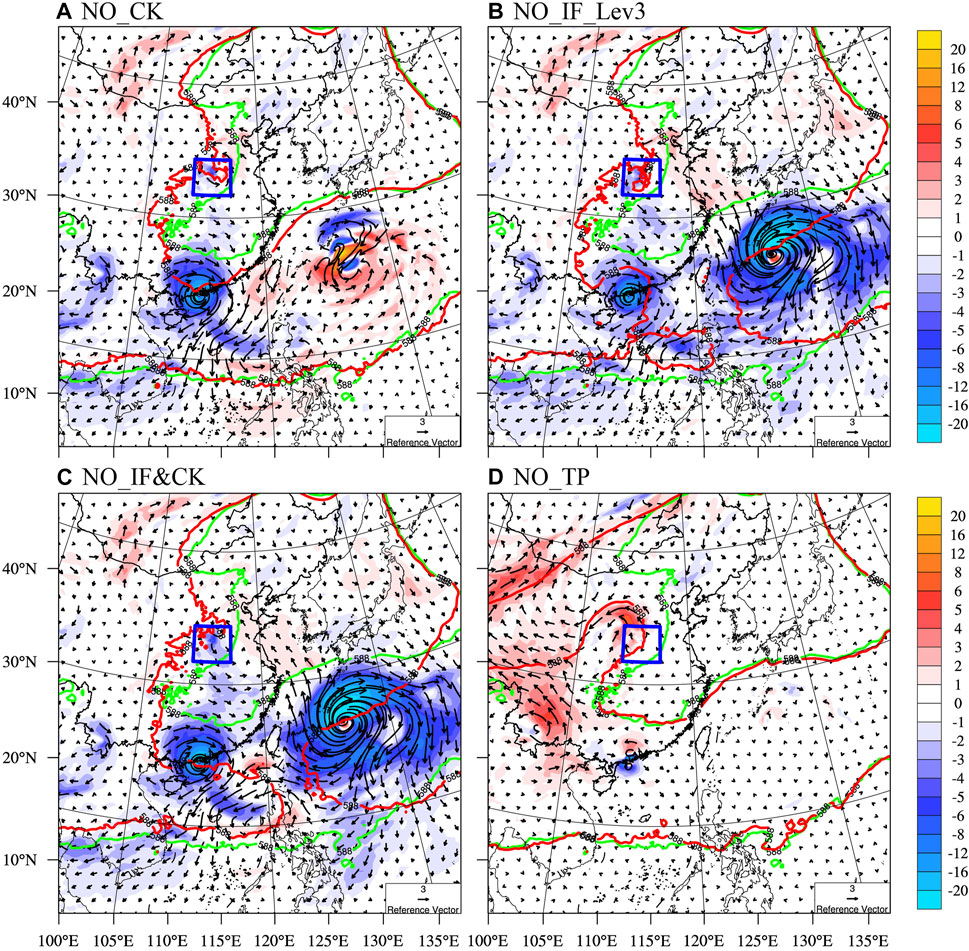
FIGURE 10. Deviation distribution field of the vertically integrated water vapor flux (unit: kg m−1s−1) of each sensitivity test compared with the CTRL test at 1800 UTC on July 20. (A) NO_CK (B) NO_IF_Lev3 (C) NO_IF&CK (D) NO_TP. The shading represents deviation of water vapor flux (sensitivity test minus ctrl test, unit: kg m−1s−1) and the arrow represents the vector flux (unit: kg m−1s−1). The green solid line represents the isoline of 588 dagpm geopotential height in the CTRL test, and the solid red line represents the isoline of 588 dagpm in the sensitivity tests. The blue box represents the key area associated with rainstorm.
The well-organized mesoscale convective system is the primary producer of extremely heavy rainfall. The variation of the mesoscale system can be seen in the blue boxes of Figure 10, especially the NO_IF&CK. The divergence of the geostrophic wind was strengthened during NO_IF&CK, and the rainstorm key area was almost covered by the subtropical high. The intensity of the corresponding mesoscale vortex weakened in the area around Zhengzhou (Figure 10C). The max reflectivity of the convective system of NO_IF&CK (Supplementary Figure 1D) also showed that the heavy rain well-organized convective cell was dissipated and the wind speed at the lower level of 850 hPa was significantly reduced.
Compare to the CTRL test, the strong center of reflectivity dispersed and split into two parts in NO_IF_Lev3 (Supplementary Figure 1C). In NO_CK and NO_TP, the convective system moved to the northeast and northwest respectively (Supplementary Figures 1B, E), which coincided with the change of the rain belt.
3.6 Conceptual model of water vapor transport under multi-system configuration during the extreme rainstorm in Henan
Based on the above analysis, the water vapor transport mechanism of the remote extreme typhoon rainstorm under the multi-system interaction is summarized into the following conceptual diagram (Figure 11). The South Asian low pressure, multiple typhoons, and local low vortex formed a triangle region, which constituted the key water vapor supply area for this extreme event. There were two main sources of water vapor in this extreme rainstorm, namely, the west branch and east branch. The abnormal vortex belt of water vapor formed by the zonal distribution of low-latitude multiple vortices resulted in transport eastward from the Indian Ocean. The west typhoon Cempaka in BT acted as a transit station, transporting part of the moisture from low-latitudes to the northern mid-latitudes (west branch) and part to the typhoon In-fa. The water vapor from the Indian and Pacific Oceans converged on the east side of In-fa, and were then continuously transported for a long distance along the northeast channel between the northern side of TC and subtropical high (east branch), causing extreme precipitation under the effect of terrain convergence (Figure 11A).
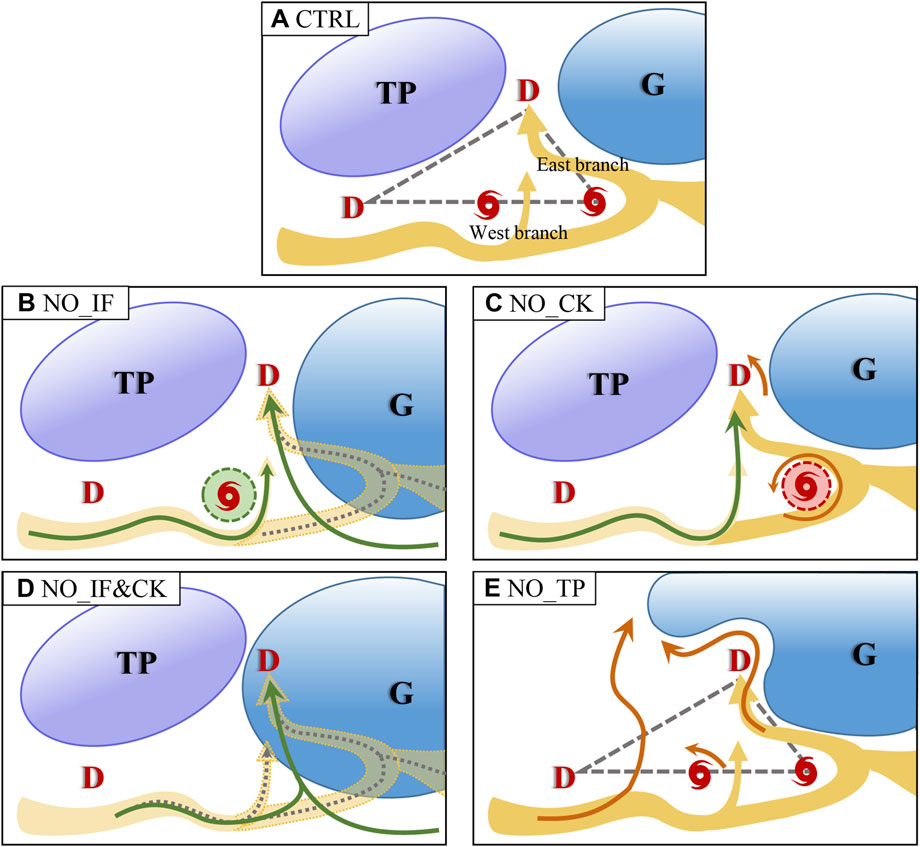
FIGURE 11. Conceptual model of water vapor transport during the extreme rainstorm in Henan under multi-system configuration (A) CTRL (B) NO_CK (C) NO_IF_Lev3 (D) NO_IF&CK (E) NO_TP. “G” represents the subtropical high and “TP” represents the large plateau terrain. “D” and typhoon marks correspond to low-pressure water”vapor vortexes and typhoons, respectively. The thick yellow arrows represent the main water vapor transport branches, and yellow color depth represents changes in strength. Thin green and orange arrows represent weakened and increased water vapor flow directions. Grey dotted lines represent the disappearance of the water vapor branches. The colored areas surrounded by green and red dashed lines represent the weakening and strengthening of the cyclone, respectively.
As the effect of typhoon In-fa was eliminated, Cempaka weakened and the subtropical high extended southward, connecting with the low-latitude subtropical high. At this point, both water vapor branches decreased. The weakening of the west branch was accompanied by the weakening of minor typhoon Cempaka, while the east branch was influenced by the interaction between typhoon In-fa and the subtropical high. The removal of In-fa greatly reduced the pressure gradient in the channel between it and the subtropical high, which further cut the moisture transport within this channel. As a result, the concentrated heavy precipitation became scattered and sparse (Figure 11B).
With the elimination of Cempaka alone, the water vapor transport in the west branch decreased, and some water vapor transferred to the east branch, resulting in a slight increase in the intensity of typhoon In-fa. The increasing and decreasing trends were of comparable intensity. The entry of moisture in the rainstorm area shifted from the south boundary to the east boundary, indicating the eastward displacement of the water vapor branches, manifested in the precipitation distribution as a marked shift of the final precipitation area to the east (Figure 11C).
The elimination of binary typhoons resulted in a pattern similar to the elimination of In-fa alone, but the westward extension of the subtropical high was more significant, and the weakening of moisture transport via the west branch and east branch was greatly increased. Without the multi-vortex synergistic transport mechanism, the water vapor from both the Indian Ocean and the West Pacific was reduced, which converged at the base of the subtropical high in the south, then directly entered the North China Plain, with its intensity weakened much (Figure 11D).
The Qinghai-Tibet Plateau played an important role in modulating the water vapor transport in the middle and lower reaches. After the large plateau terrain was eliminated, the northern end of the subtropical high extended further westward, and the Huang-Huai cyclone shifted to the northwest. Moreover, the main water vapor branches of the key precipitation area passed directly through the Taihang Mountains, a barrier that blocked and gathered water vapor. Then the water vapor flowed out of the key area along the north side of the Huang-Huai cyclone, leading to the dispersion of water vapor, thus failing to develop an extremely intense local rainstorm (Figure 11E).
4 Conclusion and discussion
We explored the mechanism of the extreme rainstorm event in Henan with the interaction between the water vapor transport anomalies and the mid-low latitude circulation system. The corresponding BT remote water vapor transport characteristics and the abnormal structure of remote moisture paths were affected by the large plateau terrain. The main conclusions are as follows:
During this extreme rainstorm event on 20 July 2021, the triangular influence domain of water vapor transport composed of the multi-vortex systems at low latitudes and the local low vortex represented the key water vapor supply area. Under the above configuration, the moisture multi-vortex belt transported water vapor from low latitudes to middle latitudes, and the BT produced double moisture transport channels in the east and west.
By separating the individual TC in BT, it is found that the water vapor transport mechanism of each individual was diverse. After eliminating Cempaka, the precipitation area shifted eastward. It was closely related to the modulating effect of Cempaka on the distribution of water vapor input and output in the meridional and zonal directions. After eliminating In-fa, the subtropical high expanded to the south, and Cempaka gradually weakened, which resulted in the reduction of water vapor transport at the southern boundary. The presence of In-fa enhanced the transport effect of BT on water vapor of low-latitude.
When simultaneously removing BT, the water vapor from both the Indian Ocean and the West Pacific all decreased, and the transport of the double moisture channels was reduced remarkably. Due to the lack of multi-vortex synergistic transport mechanism, the local maximum precipitation dropped by about 46%, and the fall area of extremely rainstorms shrank by 86%, which means that the rainstorm pattern disappeared completely.
As the “Asian Water Tower,” the Qinghai-Tibet Plateau exerts a modulating effect for the remote typhoon water vapor transport under multi-scale interaction, and its large terrain blocking effect results in an abnormal convergence mechanism for water vapor. After the influence of the large terrain of the plateau was eliminated, the Huang-Huai cyclone moved to the northeast, and most water vapor passed through the northern mountains and flowed out of the rainfall key area, resulting in water vapor divergence. The precipitation area shifted to the northwest, and its central intensity decreased by about 30%.
Our studies demonstrate the “7.20”extreme precipitation event in Henan had the characteristics of multi-vortex typhoon remote water vapor transport. The BT dominated the remote moisture transport from the South China Sea and the Northwest Pacific Ocean, in which typhoon In-fa played a major role. This impact of BT on large-scale circulation has been demonstrated in moisture sources and moisture proportions of different trajectories experiments (Nie and Sun, 2022; Sun et al., 2023). Compared with the general overview of the BT effect above, our conclusions highlight the specific mechanism of the Western Pacific typhoon in BT. The Western Pacific typhoon not only directly dominated the moisture transport in the Northwest Pacific but also transported water vapor to the South China Sea, which conducted the strength of typhoons and moisture distribution in this region. It is worth noting that our study further demonstrated this conclusion through a quantitative water vapor budget and emphasized the complex effects of plateau terrain and of the subtropical high on the uncertainty of the PRE process.
Finally, the proposed conceptual model provided a multi-system perspective to assess unexpected weather disasters in real-time forecasting caused by remote rainfall effect of TCs, especially the unpredictable effects of double typhoons with multi-vortex water vapor flux structure. In the future, larger sample sizes are required to further investigate the dynamical processes and the source of errors governing the predictability and variability of these contributing factors.
Data availability statement
The raw data supporting the conclusion of this article will be made available by the authors, without undue reservation.
Author contributions
XX conceptualized this study. JT was responsible for methodology, model and data analyses, writing-original drafts, writing-review, editing, and visualization. SZ, HX, and WC contributed to methodology, writing-review, and editing. All authors contributed to the article and approved the submitted version.
Funding
This study was supported by the Second Tibetan Plateau Scientific Expedition and Research (STEP, 2019QZKK0105) program, the S&T Development Fund of CAMS (2022KJ021) and the Major Program of the National Natura Science Foundation of China (91337000).
Conflict of interest
The authors declare that the research was conducted in the absence of any commercial or financial relationships that could be construed as a potential conflict of interest.
Publisher’s note
All claims expressed in this article are solely those of the authors and do not necessarily represent those of their affiliated organizations, or those of the publisher, the editors and the reviewers. Any product that may be evaluated in this article, or claim that may be made by its manufacturer, is not guaranteed or endorsed by the publisher.
Supplementary material
The Supplementary Material for this article can be found online at: https://www.frontiersin.org/articles/10.3389/feart.2023.1106990/full#supplementary-material
References
Bosart, L. F., Cordeira, J. M., Galarneau, T. J., Moore, B. J., and Archambault, H. M. (2012). An analysis of multiple predecessor rain events ahead of tropical cyclones ike and lowell: 10–15 september 2008. Mon. Wea. Rev. 140 (4), 1081–1107. doi:10.1175/MWR-D-11-00163.1
Chen, T., and Wu, C. (2016). The remote effect of Typhoon Megi (2010) on the heavy rainfall over northeastern Taiwan. Mon. Wea. Rev. 144 (9), 3109–3131. doi:10.1175/MWR-D-15-0269.1
Chou, Y. (1997). Weather patterns and interannual variations of typhoon torrential rain during midsummer in North China (in Chinese). Meteor. Mon. 07, 3–9. doi:10.7519/j.issn.1000-0526.1997.7.001
Collins, W. D., Rasch, P. J., Boville, B. A., Hack, J. J., McCaa, J. R., Williamson, D. L., et al. (2004). Description of the NCAR community atmosphere model (CAM 3.0). NCAR Tech. Note NCAR/TN-464+ Str. 226, 1326–1334.
Cote, M. R. (2007). Predecessor rain events in advance of tropical cyclones. M.S. thesis. New York: Dept. of Atmospheric and Environmental Sciences. University at Albany, State University, 200.
Deng, L., Feng, J., Zhao, Y., Bao, X., Huang, W., Hu, H., et al. (2022). The remote effect of binary Typhoon Infa and Cempaka on the “21.7” heavy rainfall in Henan Province, China. J. Geophys. Res. 127, e2021JD036260. doi:10.1029/2021JD036260
Galarneau, T. J., Bosart, L. F., and Schumacher, R. S. (2010). Predecessor rain events ahead of tropical cyclones. Mon. Wea. Rev. 138 (8), 3272–3297. doi:10.1175/2010MWR3243.1
Hersbach, H., Bell, B., Berrisford, P., Hirahara, S., Horányi, A., Muñoz-Sabater, J., et al. (2020). The ERA5 global reanalysis. Q. J. Roy. Meteor. Soc. 146 (730), 1999–2049. doi:10.1002/qj.3803
Hong, S. Y., and Lim, J. O. J. (2006). The WRF single-moment 6-class microphysics scheme (WSM6). J. Korean Meteor. Soc. 42 (2), 129–151.
Hua, S., Xu, X., and Chen, B. (2020). Influence of multiscale orography on the initiation and maintenance of a precipitating convective system in north China: A case study. J. Geophys. Res. 125 (13), e2019JD031731. doi:10.1029/2019JD031731
Kain, J. S. (2004). The kain–fritsch convective parameterization: An update. J. Appl. Meteor. 43 (1), 170–181. doi:10.1175/1520-0450(2004)043<0170:TKCPAU>2.0.CO;2
Li, C., Zuo, Q., Xu, X., and Gao, S. (2016). Water vapor transport around the Tibetan Plateau and its effect on summer rainfall over the Yangtze River valley. J. Meteorol. Res. 30 (4), 472–482. doi:10.1007/s13351-016-5123-1
Liang, X., Xia, R., Bao, X., Zhang, X., Wang, X., Su, A., et al. (2022). Preliminary investigation on the extreme rainfall event during July 2021 in Henan Province and its multi-scale processes. Chin. Sci. Bull. 67 (10), 997–1011. doi:10.1360/TB-2021-0827
Lin, Y., and Wu, C. (2021). Remote rainfall of Typhoon Khanun (2017): Monsoon mode and topographic mode. Mon. Wea. Rev. 149 (3), 733–752. doi:10.1175/MWR-D-20-0037.1
Low-Nam, S., and Davis, C. (2001). “Development of a tropical cyclone bogussing scheme for the MM5 system,” in 11th PSU–ncar mesoscale model users’ workshop (Boulder, CO: PSU–NCAR), 130–134.
Nie, Y., and Sun, J. (2022). Moisture sources and transport for extreme precipitation over Henan in July 2021. Geophys. Res. Lett. 49 (4), e2021GL097446. doi:10.1029/2021GL097446
Pleim, J. E. (2007a). A combined local and nonlocal closure model for the atmospheric boundary layer. Part I: Model description and testing. J. Appl. Meteor. Clim. 46 (9), 1383–1395. doi:10.1175/JAM2539.1
Pleim, J. E. (2007b). A combined local and nonlocal closure model for the atmospheric boundary layer. Part II: Application and evaluation in a mesoscale meteorological model. J. Appl. Meteor. Clim. 46 (9), 1396–1409. doi:10.1175/JAM2534.1
Pleim, J. E. (2006). A simple, efficient solution of flux–profile relationships in the atmospheric surface layer. J. Appl. Meteor. Clim. 45 (2), 341–347. doi:10.1175/JAM2339.1
Ran, L., Li, S., Zhou, Y., Yang, S., Ma, S., Zhou, K., et al. (2021). Observational analysis of the dynamic, thermal, and water vapor characteristics of the "7.20" extreme rainstorm event in Henan province (in Chinese). Chin. J. Atmos. Sci. 45 (6), 1366–1383. doi:10.3878/j.issn.1006-9895.2109.21160
Schumacher, R. S. (2011). Ensemble-based analysis of factors leading to the development of a multiday warm-season heavy rain event. Mon. Wea. Rev. 139 (9), 3016–3035. doi:10.1175/MWR-D-10-05022.1
Shen, Y., Zhao, P., Pan, Y., and Yu, J. (2014). A high spatiotemporal gauge-satellite merged precipitation analysis over China. J. Geophys. Res. 119 (6), 3063–3075. doi:10.1002/2013JD020686
Shi, X., Wang, Y., and Xu, X. (2008). Effect of mesoscale topography over the Tibetan plateau on summer precipitation in China: A regional model study. J. Geophys. Res. 35 (19), L19707. doi:10.1029/2008GL034740
Skamarock, W. C., Klemp, J. B., Dudhia, J., Gill, D. O., Liu, Z., Berner, J., et al. (2019). A description of the advanced research WRF model version 4. Boulder, CO, USA: National Center for Atmospheric Research, 145.
Sun, J., Fu, S., Wang, H., Zhang, Y., Chen, Y., Su, A., et al. (2023). Primary characteristics of the extreme heavy rainfall event over Henan in July 2021. Atmos. Sci. Lett. 24 (1), e1131. doi:10.1002/asl.1131
Sun, J., and Zhao, S. (2000). Diagnoses and simulations of typhoon (Tim) landing and producing heavy rainfall in China (in Chinese). Chin. J. Atmos. Sci. 24 (2), 15. doi:10.3878/j.issn.1006-9895.2000.02.11
Wu, C. C., Cheung, K. K., and Lo, Y. Y. (2009). Numerical study of the rainfall event due to the interaction of Typhoon Babs (1998) and the northeasterly monsoon. Mon. Wea. Rev. 137 (7), 2049–2064. doi:10.1175/2009MWR2757.1
Xiu, A., and Pleim, J. E. (2001). Development of a land surface model. Part I: Application in a mesoscale meteorological model. J. Appl. Meteor. Clim. 40 (2), 192–209. doi:10.1175/1520-0450(2001)040<0192:DOALSM>2.0.CO;2
Xu, H., and Du, B. (2015). The impact of typhoon Danas (2013) on the torrential rainfall associated with typhoon Fitow (2013) in East China. Adv. Meteorol. 2015, 1–11. doi:10.1155/2015/383712
Xu, H., Duan, Y. H., Li, Y., and Wang, H. (2022b). Indirect effects of binary typhoons on an extreme rainfall event in henan province, China from 19 to 21 july 2021: 2. Numerical study. J. Geophys. Res. 127, 36083. doi:10.1029/2021JD036083
Xu, H., Duan, Y. H., and Xu, X. D. (2022a). Indirect effects of binary typhoons on an extreme rainfall event in henan province, China from 19 to 21 july 2021: 1. Ensemble-Based analysis. J. Geophys. Res. e2021JD036265 127, 36265. doi:10.1029/2021JD036265
Xu, X., Chen, L., Wang, X., Miao, Q., and Tao, S. (2004). Moisture transport source/sink structure of the Meiyu rain belt along the Yangtze River valley (in Chinese). Chin. Sci. Bull. 49, 181–188. doi:10.1360/03wd0047
Xu, X., Dong, L., Zhao, Y., and Wang, Y. (2019). Effect of the asian water tower over the Qinghai-Tibet Plateau and the characteristics of atmospheric water circulation. Chin. Sci. Bull. 64 (27), 2830–2841. doi:10.1360/TB-2019-0203
Yin, J., Gu, H., Liang, X., Miao, Y., Sun, J., Xie, Y., et al. (2021). A possible dynamic mechanism for rapid production of the extreme hourly rainfall in Zhengzhou City on 20 July 2021. J. Meteorol. Res. 36 (1), 6–25. doi:10.1007/s13351-022-1166-7
Yu, C., and Cheng, L. (2014). Dual-Doppler-derived profiles of the southwesterly flow associated with southwest and ordinary typhoons off the southwestern coast of Taiwan. J. Atmos. Sci. 71 (9), 3202–3222. doi:10.1175/JAS-D-13-0379.1
Zhang, Y., Yu, H., Zhang, M., Yang, Y., and Meng, Z. (2022). Uncertainties and error growth in forecasting the record-breaking rainfall in Zhengzhou, Henan on 19–20 July 2021. Sci. China Earth Sci. 65 (10), 1903–1920. doi:10.1007/s11430-022-9991-4
Zhao, Y., Chen, D., Li, J., Chen, D., Chang, Y., Li, J., et al. (2020). Enhancement of the summer extreme precipitation over North China by interactions between moisture convergence and topographic settings. Clim. Dyn. 54 (5–6), 2713–2730. doi:10.1007/s00382-020-05139-z
Keywords: remote rainfall, binary typhoons, multi-vortex, water vapor transport, monsoon
Citation: Tang J, Xu X, Zhang S, Xu H and Cai W (2023) Response of remote water vapor transport to large topographic effects and the multi-scale system during the “7.20” rainstorm event in Henan Province, China. Front. Earth Sci. 11:1106990. doi: 10.3389/feart.2023.1106990
Received: 24 November 2022; Accepted: 13 February 2023;
Published: 23 February 2023.
Edited by:
Jianhua Sun, Institute of Atmospheric Physics (CAS), ChinaReviewed by:
Shuai Yang, Institute of Atmospheric Physics (CAS), ChinaYuanchun Zhang, IAP (CAS), China
Copyright © 2023 Tang, Xu, Zhang, Xu and Cai. This is an open-access article distributed under the terms of the Creative Commons Attribution License (CC BY). The use, distribution or reproduction in other forums is permitted, provided the original author(s) and the copyright owner(s) are credited and that the original publication in this journal is cited, in accordance with accepted academic practice. No use, distribution or reproduction is permitted which does not comply with these terms.
*Correspondence: Xiangde Xu, eHV4ZEBjbWEuZ292LmNu