 Mingyu Bi
 Ruifang Wang2*
 Xuyang Ge
- 1Key Laboratory of Meteorological Disaster, Ministry of Education (KLME) / Collaborative Innovation Center on Forecast and Evaluation of Meteorological Disasters (CIC-FEMD), Nanjing University of Information Science and Technology, Nanjing, China
- 2College of Geography and Environmental Sciences, Zhejiang Normal University, Jinhua, China
- 3Department of Atmospheric Sciences, University of Hawai’i at Manoa, Honolulu, HI, United States
Idealized experiments were conducted to examine the impacts of moderate vertical wind shear (VWS, i.e., magnitude of 12 m s−1) on the intensification of tropical cyclones (TCs) of different initial sizes. The results showed that the intensity of all the simulated TCs decreased at the first 12-hour integration after imposing the shear. Larger TCs resumed intensification earlier, whereas smaller ones re-intensified more slowly or even failed to intensify. The differences in the intensification rate are likely due to the tilting magnitude. Under VWS, the upper-level TC center exhibited a horizontal displacement relative to the low-level circulation. In general, this displacement was smaller in larger TCs, indicating that larger TCs are less susceptible to VWS. Thermodynamically, the intrusion of mid-level low moist entropy also played a role in suppressing upshear convection. This negative impact was pronounced in smaller TCs. By using the PV-ω equation, the resilience of TC to VWS was compared. The second circulation forced by both dry dynamic and diabatic heating acted to restore the system to a vertically upright position. For larger TCs, more extensive convection was prolific on the downshear side, and its corresponding forced second circulation offset a larger part of the low-to mid-level environmental shear, which made larger TCs more resilient to VWS; i.e., larger TCs produced stronger low to middle counter shear circulation and facilitated vertical realignment. In contrast, for smaller TCs, the updrafts forced by dry dynamic and diabatic heating were deeper but narrower at the initial time, which did not efficiently reduce the mid-level VWS, resulting in greater tilting of the TC, thus making the smaller TCs more vulnerable to VWS.
1 Introduction
Although much work has been carried out to understand changes in intensity of tropical cyclones (TCs), improvement of accuracy in TC forecast is still needed. Difficulties in TC intensity prediction may arise from the complexities of dynamic processes and the various factors involved in modifying TC structure, such as sea surface temperature, environmental vertical wind shear (VWS) and humidity, TC size, and environmental temperature profile. Each aforementioned factor may change TC intensity, but their combined effect remains a major challenge for prediction of TC intensity.
Environmental VWS has long been considered one of the most detrimental factors in TC intensity change. For instance, VWS can modify TC structure and precipitation distribution. VWS may impair TC intensity in several ways. First, the warm core of a TC in the upper levels may be advected apart from the center of the low-level vortex, which leads to a sea level pressure rise according to the hydrostatic equation (Simpson et al., 1958). Second, VWS may directly magnify the mixing of the dry mid-level air into the moist TC inner core, reducing the amount of work produced by the TC power machine (Tang and Emanuel, 2010; Tang and Emanual, 2012). Third, the shear induced downdrafts may transport mid-level low moist entropy air into the boundary layer, then minimize convection in the eyewall (Riemer et al., 2010). Generally, the detrimental effect of VWS on TC intensity change is roughly proportional to its magnitude (Reasor et al., 2013). Weak vertical shear (with smaller than 5 m s−1 between 850 and 250 hPa) has little effect on TC intensity. When the magnitude of VWS increases, the probability of TC intensification decreases. However, the magnitude of VWS alone cannot account for changes in TC intensity. Different TCs under VWS of the same magnitude may have different growth curves, even if their differences are tiny stochastic disturbances in mass or wind fields (Zhang and Tao, 2012; Chen et al., 2019). In addition, VWS also heightens the sensitivity of TC intensity to other dynamic and thermodynamic factors (Emanuel et al., 2004). For instance, if dry air is cyclonically advected into the downshear area, convection on the downshear side, where vigorous convection occurs, will be substantially suppressed (Ge et al., 2015). In short, the development of TC intensification is slowed, or even decays, due to the combined effects of VWS and humidity. In addition, a TC with a small Coriolis parameter is more susceptible to vertical shear, and its development is suppressed much more than it would otherwise be without shear (Bi et al., 2018).
In reality, it is not only the magnitude of VWS that relates to TC intensity change; its vertical profile can also affect TC intensity. When a TC is exposed to VWS of shallow depth, the TC is more prone to fail to develop (Finocchio et al., 2016). The height of VWS also influences the TC intensification rate. VWS in upper levels seems to have diminished effects in impeding the development of TCs (Finocchio et al., 2016; Dai et al., 2021). Numerous simulations have shown that by specifying the same magnitude of VWS, but changing rotations with height, the TC intensifies at a higher rate than the anticlockwise rotating mean wind (Onderlinde and Nolan, 2014). The authors argued that it is the helicity of environmental wind that acts to modulate the TC intensification rate (Chen et al., 2006). The orientation of low-level mean flow with respect to the vertical shear also has a relationship with TC intensification and expansion (Chen et al., 2019; Chen et al., 2021). Meanwhile, surface environmental wind plays a role in modulating the locations of convection excited in the core region (Rappin and Nolan, 2012). If the surface zonal wind is negative under westerly shear, the convection preferentially happens in the downshear left semicircle. This process favors the updrafts propagating cyclonically into the upshear region and constrains the magnitude of the vortex tilt, thus acting to reduce the adverse effect of vertical shear (Shi and Chen, 2021; Huang et al., 2022). The evolution of TCs of different size shows diversity under the same VWS. Although previous studies have implied that strong TCs are more resilient to VWS (Reasor et al., 2004; Zhang, 2005; Zhang and Kieu, 2006; Reasor and Montgomery, 2015), one remaining issue is whether the process is size-dependent. Through this study, we revealed underlying processes affecting structural changes under VWS, with the main purpose of identifying the effects of VWS modulated by TC size.
The remainder of this article is organized as follows. Section 2 describes the configurations of the experimental simulations and the preliminary results. Section 3 shows the major differences of the dynamic and thermodynamic aspects of relatively small and large TCs under similar VWS. Section 4 describes use of the PV-ω equation to characterize shear induced vertical motion, for which we provide possible mechanisms accounting for intensity change associated with the effect of VWS. Conclusions and discussion are included in the final section.
2 Experimental design
In this study, the WRF_ARW model (version 4.2) was employed to investigate the changes in intensity of TCs of different sizes under a westerly VWS of 12 m s−1 between 850 and 200 hPa. Following Bi et al. (2018), the zonal environmental wind was introduced according to
where u is zonal wind, p is pressure,
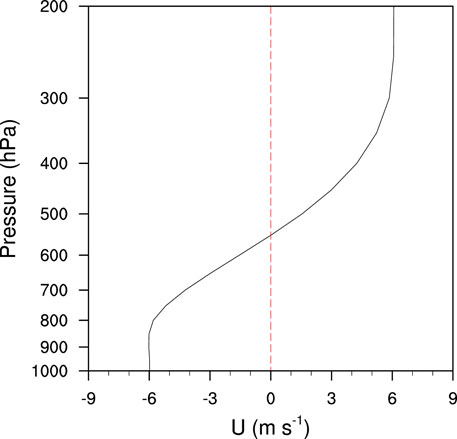
FIGURE 1. Vertical profile of environmental zonal wind (m s−1).
The model domains were triply nested. The three domain resolutions were 18, 6, and 2 km, and the domain sizes were 361x361, 451x451, and 451x451, respectively. The model vertical level was 41. The innermost two nests had two-way interaction. The physical parameterization schemes in cumulus, microphysics, boundary, and longwave and shortwave radiation were Grell–Freitas (Grell and Freitas, 2014), WSM6 (Hong and Lim, 2006), YSU (Hong et al., 2006), and RRTMG (Iacono et al., 2008), respectively.
Six vortexes with the same maximum surface wind but different sizes were separately embedded in a quiescent environment. SST was uniformly set to 29°C, and the Coriolis parameter was set to the value of latitude of 15 ºN across the domain. The initial wind profiles of the six vortexes at the surface are shown in Figure 2. The wind profile was developed based on the modified Rankine vortex (Wang and Li, 1992), and the formula used to generate the wind profile of a TC is as follows:
where
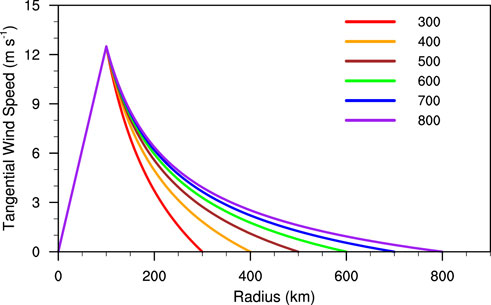
FIGURE 2. Initial surface tangential wind profiles in EXP300 (red), EXP400 (orange), EXP500 (brown), EXP600 (green), EXP700 (blue), and EXP800 (purple).
Provided that a larger TC will maintain its larger size in observation and simulation (Wang and Holland, 1996; Wang et al., 1997; Xu and Wang, 2010a; Lee et al., 2010), a vortex with a larger initial size could generate a larger TC in the first 36 h integration, during which the model spins up the storm. After the spin up period, the VWS was imposed. The wind and temperature in the outermost domain were nudged to ensure the VWS could continuously exert its influence on the TC circulation. Because a TC may deflect from its original position during integration (Wu and Emanuel, 1993; Wang and Holland, 1996), the two innermost domains were configured vortex following.
3 The simulated results
The resultant changes in intensity of the experimental TCs are shown in Figure 3. All the vortexes intensified at roughly the same rate (Xu and Wang, 2010b; Ge et al., 2015). After the VWS was added, the intensity of the smaller TCs dropped more rapidly than their larger counterparts despite a small TC (in EXP300) that had higher maximum surface wind at the time that shear was imposed. The larger TCs resumed intensification earlier than the smaller ones, while the smaller TCs had more delayed intensification or failed to intensify.
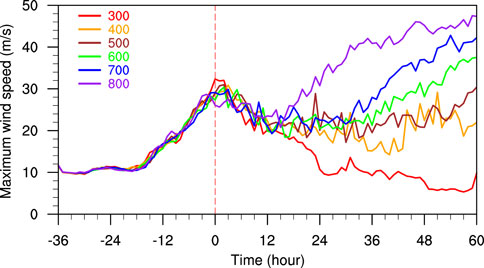
FIGURE 3. Time series of maximum surface winds of the experiments (m s−1). The red dashed line indicates the imposed shear time. The red, orange, brown, green, blue, and purple solid lines indicate the intensity changes of TCs in EXP300, EXP400, EXP500, EXP600, EXP700, and EXP800, respectively.
Previous studies have shown that the realignment of the TC vortex is essential for a TC to intensify (Reasor et al., 2004; Finocchio et al., 2016). To this end, Figure 4 describes the evolution of the process of tilting under shear. At the early stage, the vortex centers tilted northeastward in all the experiments. The magnitudes of tilting in all experiments increased during the first 12 h. Thereafter, the larger TCs became less tilted, whereas the smaller TCs displayed a large amount of tilt without any precession and realignment processes. Comparison of tilting magnitude in Figure 4 and the change in intensity in Figure 3 indicated that the configuration of tilting upshear was coincident with the onset of intensification. It was clear that the initially larger TCs had smaller magnitude of tilting and realigned more rapidly compared to the smaller ones. These results agree with results reported by Finocchio et al. (2016), which indicated that tilting into the upshear-left quadrant can be considered a precursor to intensification.
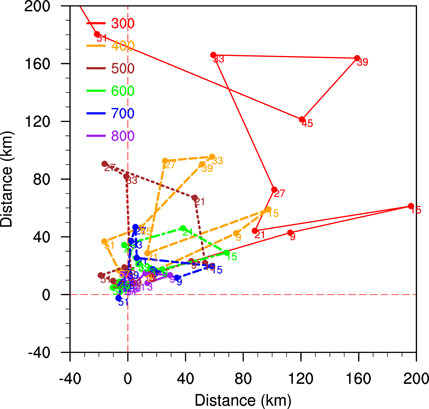
FIGURE 4. Position of the vortex center at 8 km relative to the vortex center at 2 km in EXP300, EXP400, EXP500, EXP600, EXP700, and EXP800. The numbers indicate the simulation time, and the relative positions are labeled every 6 h.
After the VWS was imposed, the maximum surface wind of all the experiments showed a drop off in the first 12 h. To demonstrate this feature, two experiments, EXP800 and EXP400, were selected to represent large and small TCs, respectively. EXP800 began to intensify at hour 15, while EXP400 persisted in low intensity. As a result, a remarkable difference in TC structure was observed in the first 15 h. The radar reflectivity of these two cases is compared in Figure 5. Most convection in the outer core region in both cases was enhanced on the downshear side, especially in the downshear-left quadrant. In EXP400, the convection shrank rapidly in the first 12 h. In contrast, the convection in EXP800 seemed more vigorous. Although the upshear semicircle was unfavorable for the development of convective cells, the convection in larger TCs was able to survive the adverse condition and eventually propagate cyclonically into the upshear left quadrant. Huang et al. (2022) pointed out that the corresponding divergence wind of upshear convection counteracts the storm-relative flow, thus decreasing the magnitude of VWS and minimizing the detrimental effects of VWS. This is also called the “outflow blocking” effect (Ryglicki et al., 2019; Shi and Chen, 2021). In this regard, the vertical velocities at different levels were compared (Figure 5). Basically, the updrafts on the upshear side were significantly suppressed. The low-level updrafts were generated in the vicinity of the TC, whereas the majority of updrafts in the upshear semicircle failed to penetrate the middle and upper troposphere, or were advected far away from the low-level vortex center in small TCs after hour 9. Conversely, the vertical motions in EXP800 at 5 km were much closer to the vortex center and eventually propagated into the upshear quadrant.
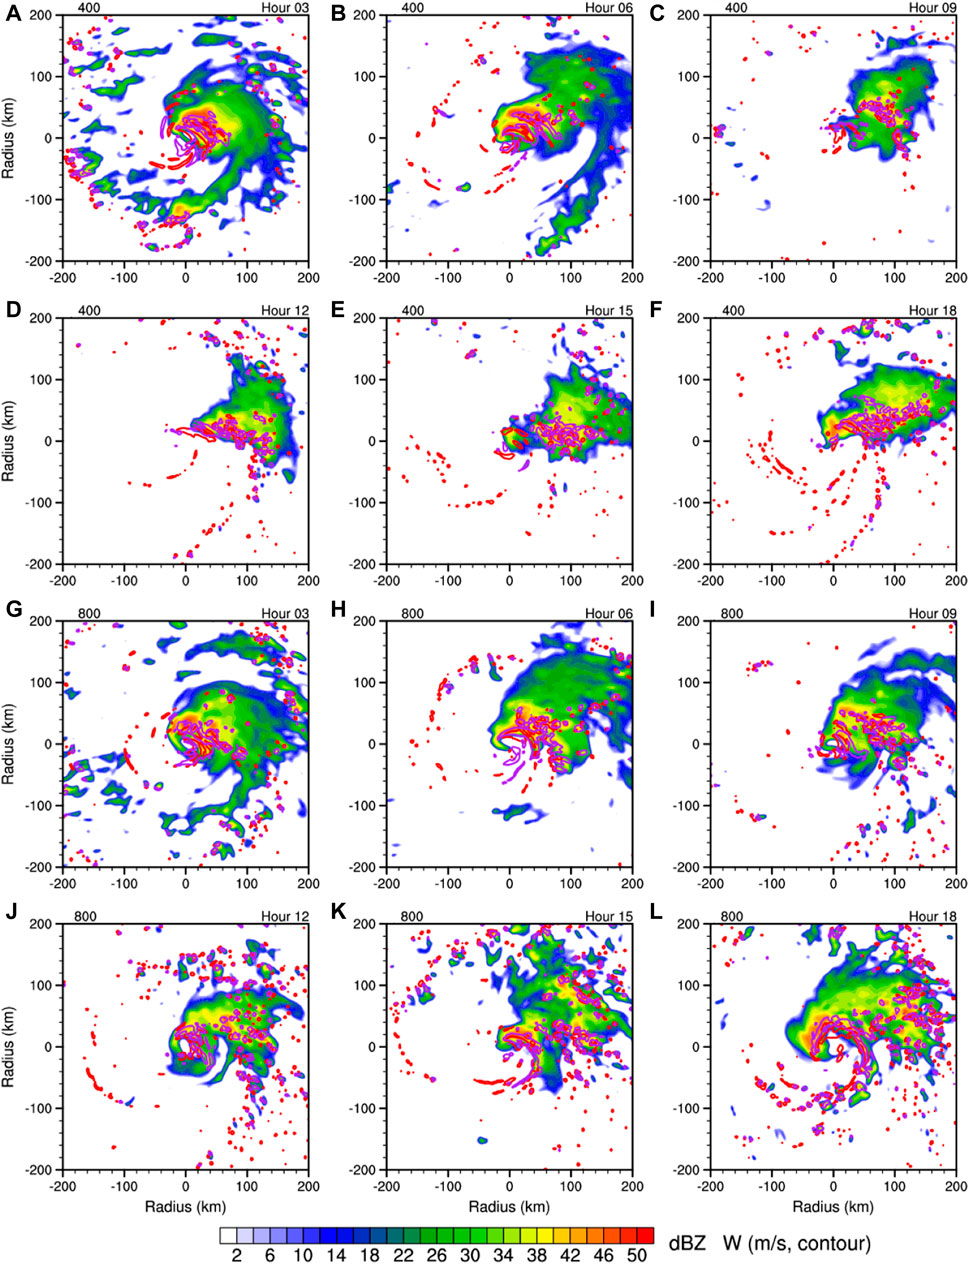
FIGURE 5. Evolution of the radar reflectivity (shaded, dBZ) at 1.5 km and vertical velocity (contour at 0.5 m s−1) at 1.5 (red) and 5 (purple) km in the first 18 h. (A–F) Data from EXP400. (G–L) Data from EXP800.
Jones (1995) argued that a balanced positive potential temperature
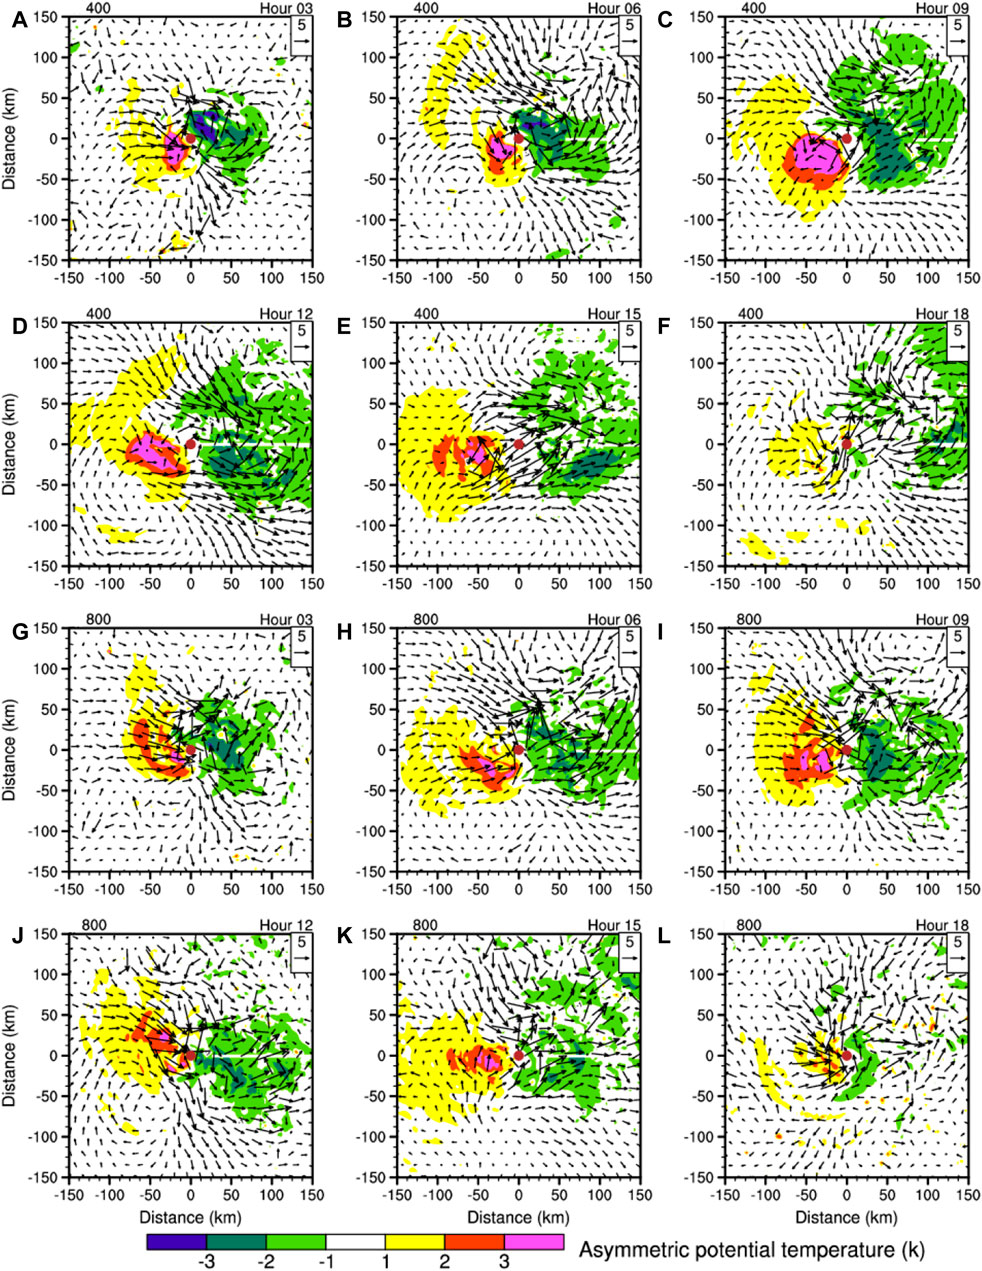
FIGURE 6. Evolution of diabatic heating (k hour−1) at 3 km, asymmetric potential temperature (blue contours at −3, −2, and −1 K and red contours at 1, 2, and 3 K) at 5 km, and asymmetric winds (vector, m s−1) at 5 km at hour 3, 6, 9, 12, 15, and 18. (A–F) Data from EXP400. (G–L) Data from EXP800. Brown dots indicate the vortex centers at 5 km.
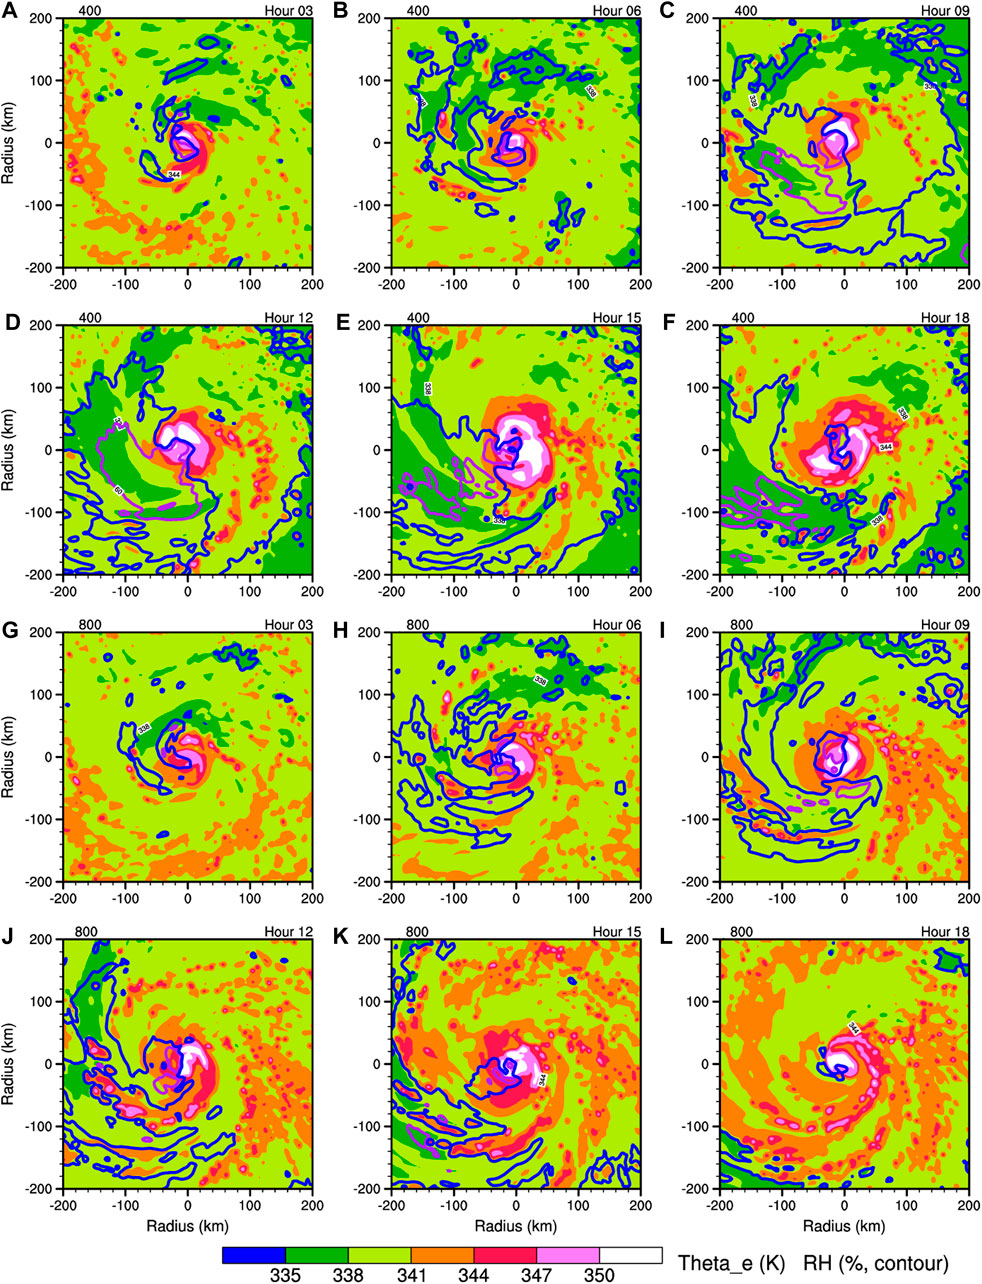
FIGURE 7. Evolution of
The radial band average of
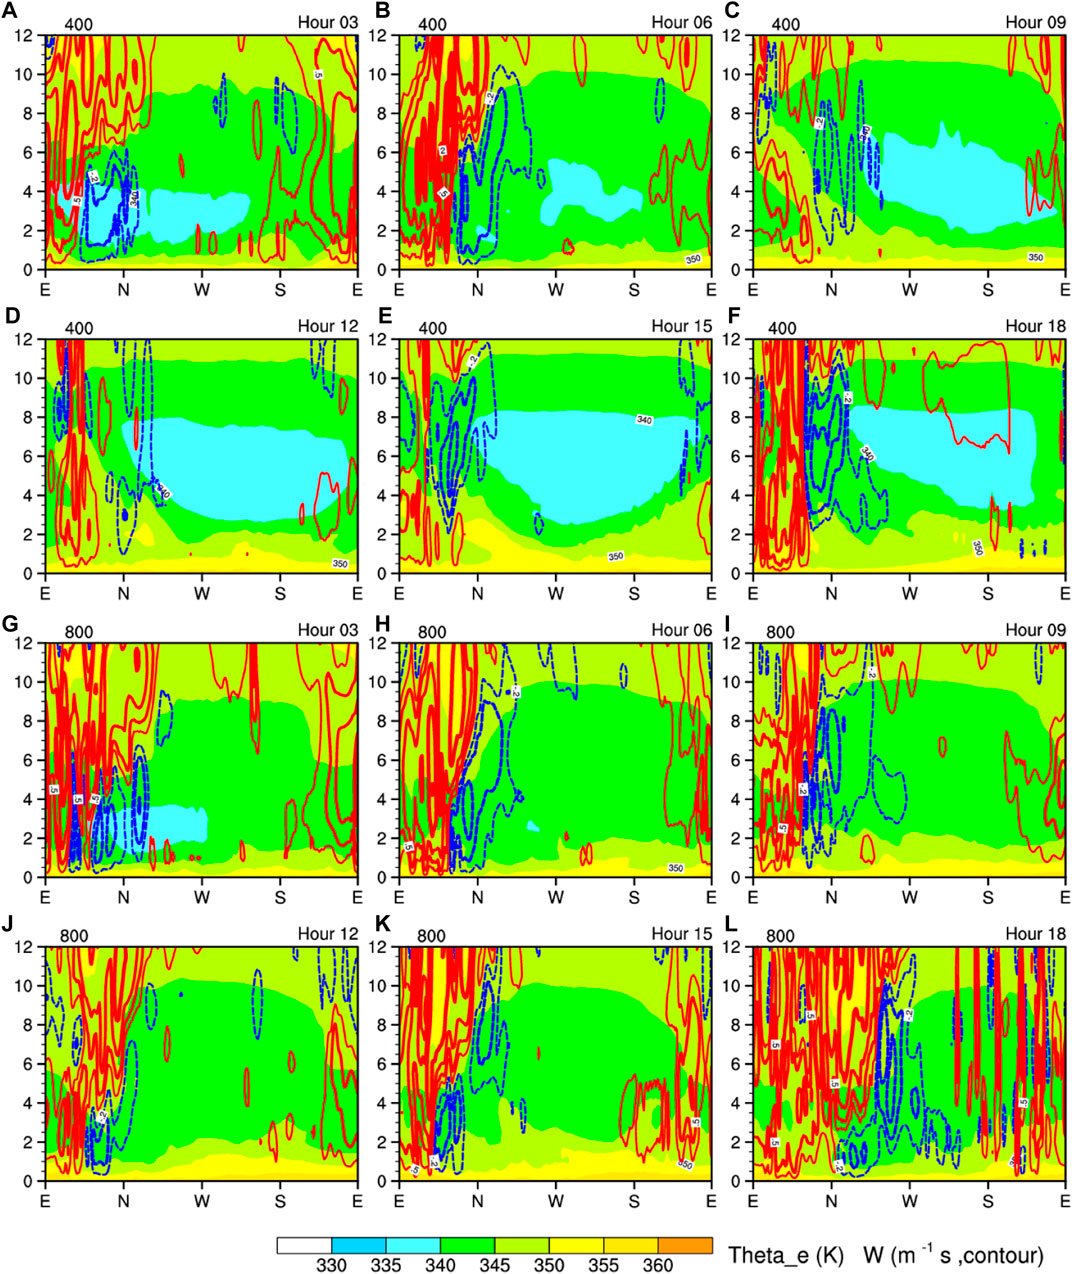
FIGURE 8. Vertical section of
Energy input from the surface may have significant effects on convection near the TC center (Xu and Wang, 2010a; Chan et al., 2019). The surface latent flux was not significantly different near the TC center when comparing large and small TCs (Figure 9), indicating that the surface latent heat flux did not directly influence the changes in intensity and that those changes were more related to the dynamic and thermodynamic processes associated with VWS.
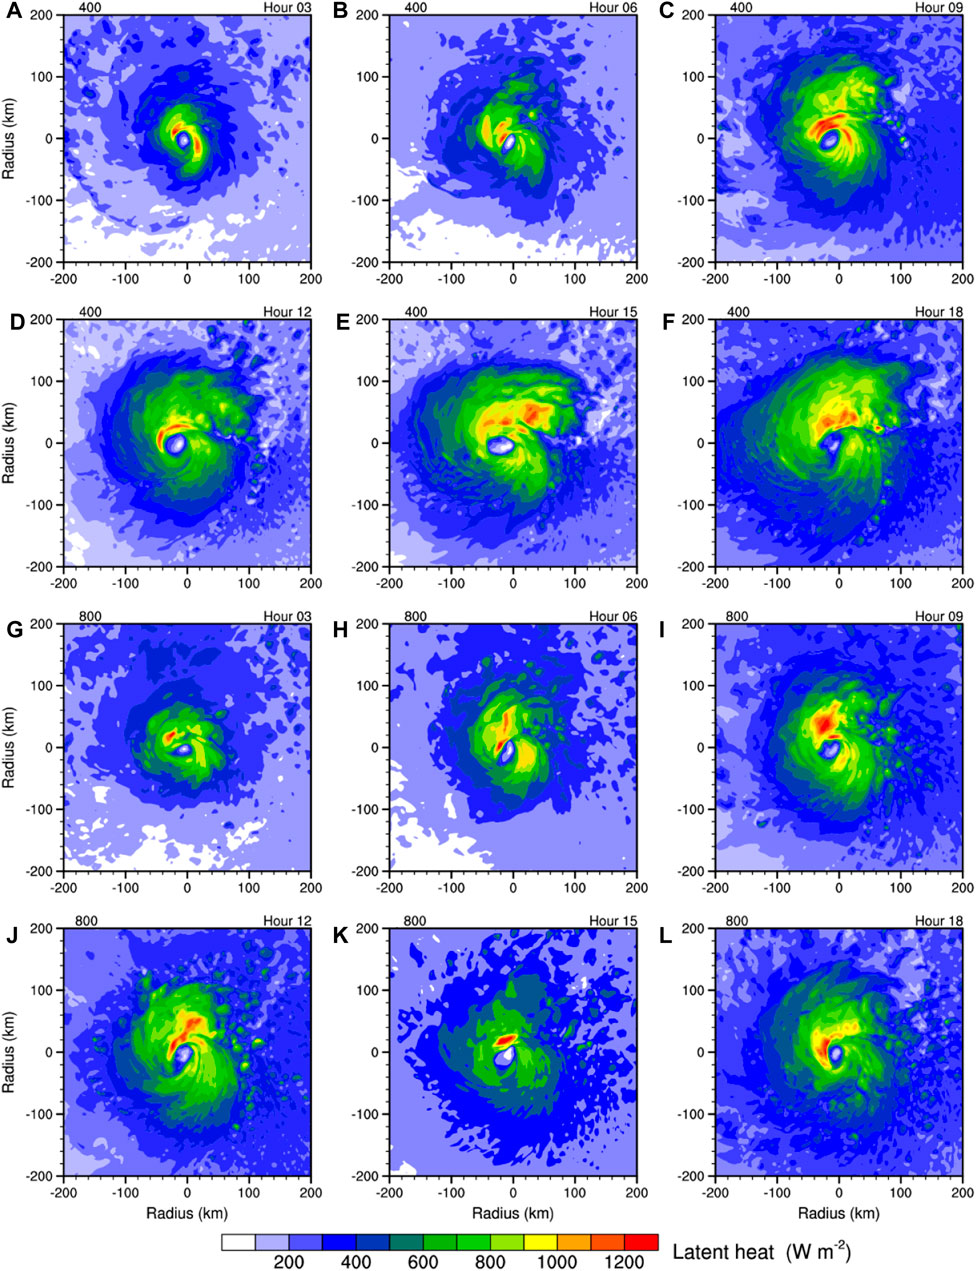
FIGURE 9. Evolution of latent heat (W m−2) flux from the surface in EXP400 (A–F) and EXP800 (G–L).
4 Evaluation of the forced second flow
The vortex centers at each level were examined to characterize vortex tilting magnitude and direction (Figure 10). The vortex center did not rotate cyclonically with height and tilted almost linearly at low and middle levels. It is interesting that the upshear shifting of the upper-level center preceded that of the low and middle levels. This is counterintuitive considering that the upper levels have the largest storm-relative wind, and the vortex centers in these levels would be advected farther. Moreover, small TCs tilted more northward, and the tilting magnitude of large TCs decreased, whereas that of small TCs increased, over time.
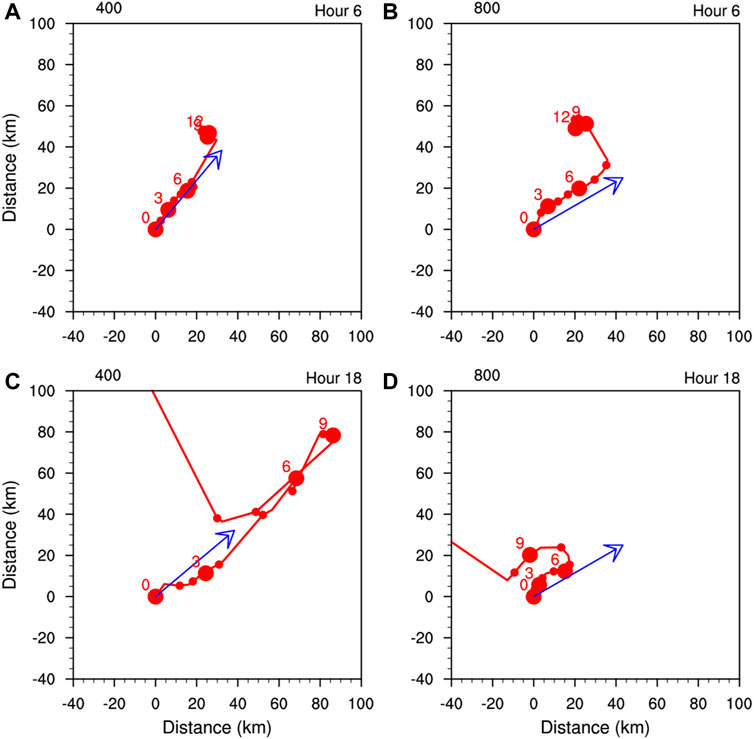
FIGURE 10. Hodographs of the vortex centers at different heights (km); (A,C) show data from EXP400 and (B,D) show data from EXP800; (A,B) are at hour 6 and (C,D) are at hour 18. Small dots are plotted every 1 km, and large dots are plotted every 3 km. Numbers indicate the height (km) of the vortex center. The titling direction is indicated by the blue vector.
Corbosiero and Molinari (2002) argued that the resilience of TCs to VWS was subject to the Vortex Rossby wave, which acted as a precession process to offset the detrimental effects of VWS. Nevertheless, we believe the shear-induced structural changes of TCs themselves resist the shear since the prominent feature of a shear TC is enhanced quasi-steady convection to the left-of-shear, which does not exhibit obvious wave-like characteristics.
To evaluate the changes of second circulation of TCs, the PV-ω equation was used (DeHart et al., 2014). This equation describes the vertical motions forced by dry dynamic and diabatic heating and friction, given a non-divergent balanced vortex. Once
The diabatic heating in the west–east direction in the eyewall region was slightly greater and extended vertically higher in EXP400 than in EXP800 at 6 hours, whereas the horizontal distribution of diabatic heating in EXP800 became wider (Figure 11). In EXP800, the broader diabatic heating may have arisen from stronger surface heat flux induced by stronger outer core surface winds (Xu and Wang, 2010b). This broader convection may have induced more extensive low-level convergence and mid-to high-level divergence. The corresponding divergence winds may have influenced the shifting of the vortex center, and thus sequential vertical realignment.
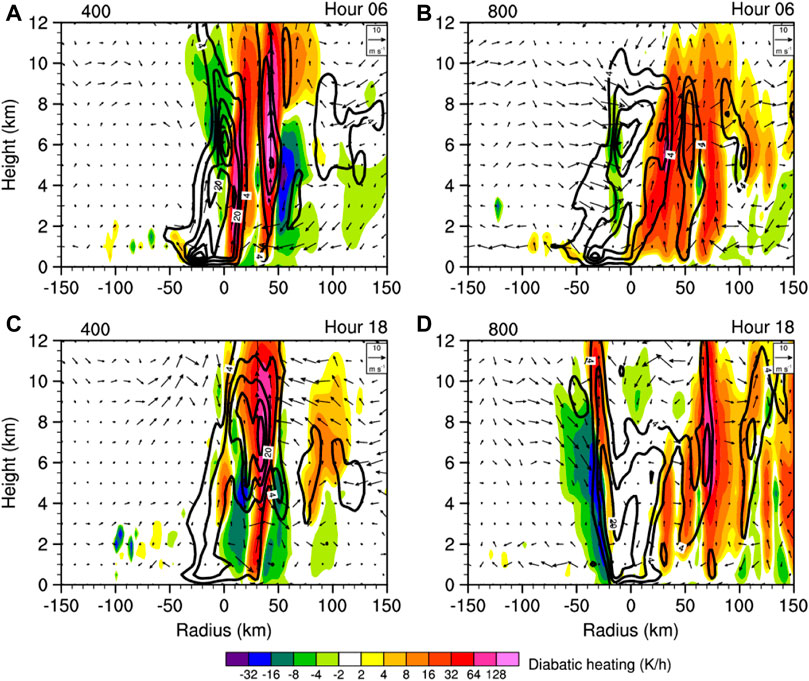
FIGURE 11. Vertical section of diabatic heating (k h−1) and potential vorticity (contours at 4, 12, 20, and 28 PVU) across the TC center along the vector shown in Figure 10. (A,C) Data from EXP400 at hour 6 and 18, respectively. (B,D) Data from EXP800 at hour 6 and 18, respectively.
First, we tested the resilience of different sized TCs under the same VWS in an adiabatic framework. At the initial time point, since the inserted TC was symmetric, there was no asymmetric second circulation forced by diabatic heating. When the VWS was imposed on the initial vortex (hour 0), the ascent was excited on the downshear side and the descent on upshear side (Figures 12A, B). Since the maximum tangential wind of TC in EXP400 was a little larger and closer to the TC center than that in EXP800, the vorticity maxima of the TC in EXP400 was larger as well. According to the PV-ω equation, the vertical velocity is proportional to the vertical differential of horizontal vorticity advection. The horizontal gradient of vorticity was certainly larger in EXP400, thus leading to greater vorticity advection and then greater magnitude of vertical velocities. Furthermore, the environmental temperature gradient point to right-of-shear, reflecting the horizontal advection of temperature, was positive (negative) on the downshear (upshear) side. This led to the generation of updrafts downshear (downdrafts upshear). Both processes accounted for the generation of forced secondary circulation (FSC). Meanwhile, diabatic heating played an important role in producing the FSC. Figure 12 shows second circulation forced by diabatic heating along the tilting vector. Apparently, the divergence wind induced by the dry dynamics and diabatic heating acted to oppose the tilting and helped move the vortex back toward vertical realignment.
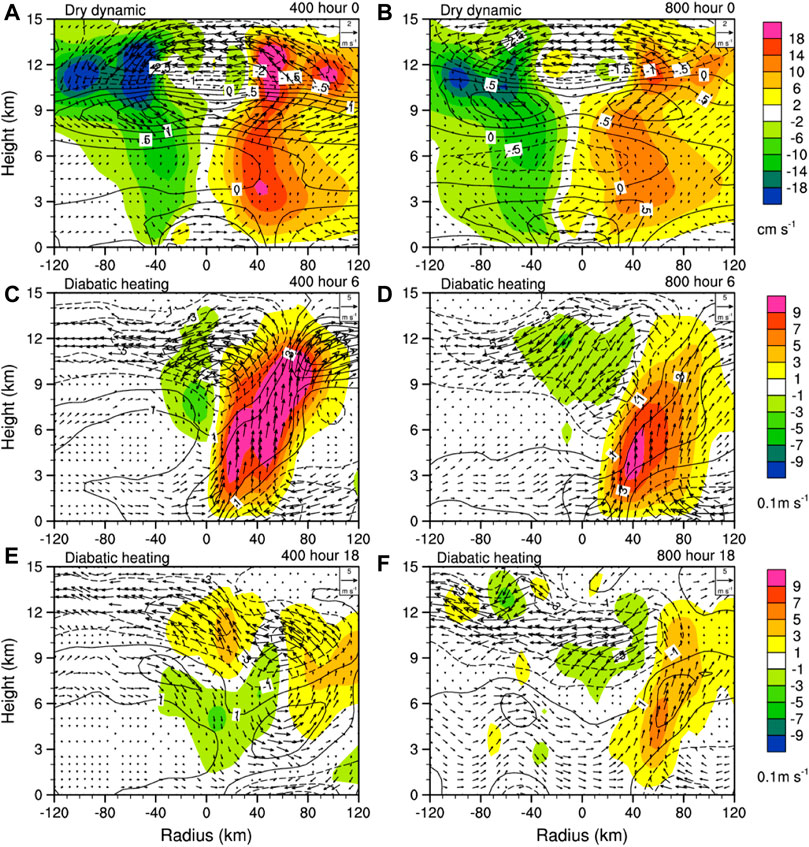
FIGURE 12. Shear induced second circulation. Shading indicates the induced vertical velocities (m s−1), the vectors denote the in plane horizontal and vertical winds, and the contours indicate the magnitudes of divergence wind. The top panels are the dry dynamic-induced vertical velocity at hour 0 in EXP400 (A) and EXP800 (B). (C–F) Vertical section of the diabatic heating induced divergence wind and vertical wind (vector) along the tilting vector shown in Figure 10.
The broader inner core vorticity in the larger TC produced a wider second circulation. Although the larger TC had a smaller vertical wind maximum, its ascent in the eyewall region was wider and shallower, which provided stronger convergence wind at low levels and divergence wind at middle and upper levels. As shown in Figure 12, although smaller TCs can excite stronger vertical velocity maxima, their ascending flow extends into high levels and the divergence and convergence winds nearly all concentrate at very high and low altitudes. Specifically, the divergence wind at middle levels in smaller TCs was considerably weaker than that in larger TCs. As a result, the convergence and divergence winds corresponding to the updrafts and downdrafts in the core region could offset more detrimental effects of environmental shear at low and middle levels. The mean induced divergence wind forced by dry dynamics and diabatic heating and the total mean winds are shown in Figure 13. The magnitude of mean winds averaging a radius of 50 km forced by dry dynamic and diabatic heating were almost all on the same order, and both dry dynamic and diabatic heating acted to offset the environmental shear. Indeed, the counter shear circulation is slightly greater in larger TCs. In smaller TCs, the induced second circulation could not efficiently offset the low- and mid-level VWS, which made the smaller TCs tilt significantly and become more susceptible to VWS. The reason we focused on shear in the low and middle levels is that the detrimental effects of shear at upper levels have been shown to be relatively weak (Finocchio et al., 2016; Dai et al., 2021). The wind shear at upper levels can be easily offset by the outflow of asymmetric convective activities. This was demonstrated by the shifting of the vortex center at upper levels. In both small and large TCs, the shifting of vortex centers toward the upshear direction at upper levels precedes the shifting at low and middle levels, which is pronounced in the hour 18 data presented in Figure 10.
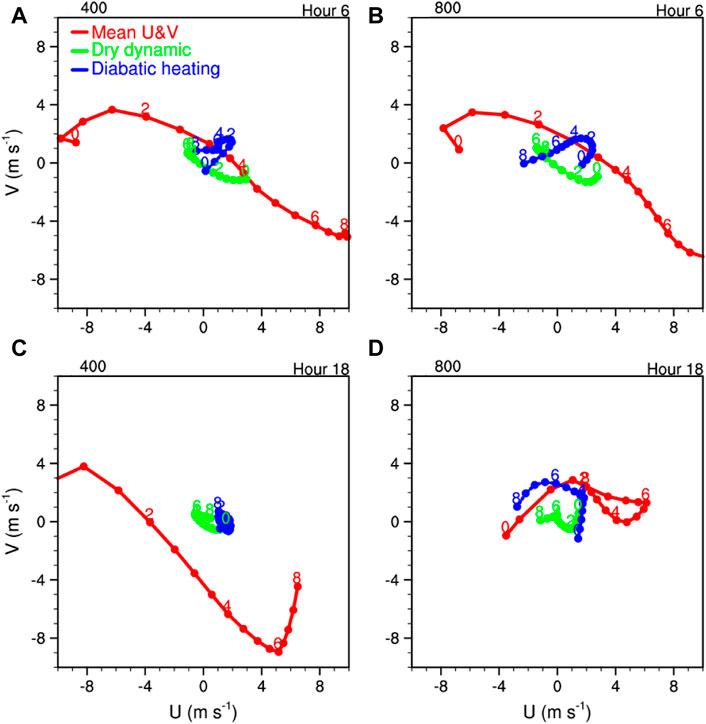
FIGURE 13. Hodographs of the divergence wind forced by dry dynamic heating (green), diabatic heating (blue), and the mean horizontal wind (red) averaged within a 50-km radius centered in the eye. Each dot indicates a 0.5 km height increment, beginning at the surface and ending at 8 km. (A,C) Data from EXP400. (B,D) Data from EXP800. (A,B) are at hour 6, and (C,D) are at hour 18.
5 Conclusions and discussion
In this study, we modeled the effects of initial TC size on storm intensity in the presence of VWS. By specifying the same sounding and uniform SST, under the same VWS, we demonstrated size-dependent evolution of TC intensity. That is, the intensity of smaller TCs tended to decrease more rapidly than that of larger TCs. Detailed examination of the structure of the simulated TCs showed that the vortex center tilted more in smaller TCs. The re-intensification of a TC is indicated by the process of the TC eyewall resuming an upright position. An erect eyewall can not only produce stronger vertical motions but also reduce the interface area between the eyewall and the environment, thus decreasing the entrainment of environmental low entropy air into the eyewall.
Possible mechanisms are proposed. It was expected that the adjustment of the TC in response to VWS would act to oppose the shear forced tilting. Use of the PV-
The larger TC eyewall resumed its upright status faster than did the smaller TC. First, the counter shear circulation induced by asymmetric vertical motion was shallower in larger TCs due to the relative shallow extent of vertical convection; therefore, the cross eye counter shear circulation was shallower than that in small TCs. As a result, the environmental vertical shear was reduced more at low and middle levels. Hence, larger TCs can survive the destructive effects of VWS. Second, the larger TC has a larger eyewall radius. Even with the same magnitude of vortex center tilt, there is more opportunity for the convection to cyclonically rotate into the upshear region in larger TCs due to the larger eyewall radius. The slantwise rising ascent and its divergence and convergence winds act to oppose the shear forced tilt and account for the resilience of the vortex to VWS. In dry model framework, Black et al. (2002) pointed out that, in the absence of diabatic heating, VWS can result in downdrafts and updrafts on the downshear and upshear sides. The downdrafts and updrafts associated divergence wind may also help move the vortex back toward vertical orientation. This accounts for the precession process and provides a rationale for why the vortex center was not advected further by the environmental shear. In the presence of diabatic heating, the VWS at upper levels was strongly offset by the shear forced circulation. The horizontal branch of counter shear circulation was remarkably strong at the upper levels, which was recognized as the outflow blocking effect, which substantially reduced, or even reversed, the advection storm center at upper levels. In short, our data demonstrates that larger TCs have stronger forced second circulation and are therefore more resilient to the detrimental effects of VWS.
The intrusion of upshear low moist entropy may also play a role in weakening small TCs. That is, the downward deposition of low moist entropy flux can reduce emergence into the eyewall region, thus weakening the TC. When the low entropy approached the upshear eyewall, it was transported downward by shear forced downdrafts or diabatic cooled descent. Once this low moist entropy air was advected into the eyewall, the intensity of the TC deceased significantly. Further study is needed to investigate these ventilation pathways in more detail, and to assess to what extent low moist entropy can change the intensity of TCs.
Data availability statement
The raw data supporting the conclusion of this article will be made available by the authors, without undue reservation.
Author contributions
MB prepared all the figures in the manuscript, RW completed all diagnostic analyses, XG contributed significantly to writing the manuscript, and TL provided many useful ideas and comments.
Funding
This work was jointly sponsored by the National Natural Science Foundation of China (42088101), the National Science Foundation of China (Grants 41805039 and 42175003), and the Natural Science Foundation of Zhejiang Province (LQ22D050002).
Acknowledgments
The authors acknowledge the High Performance Computing Center of Nanjing University of Information Science and Technology for their support of this work.
Conflict of interest
The authors declare that the research was conducted in the absence of any commercial or financial relationships that could be construed as a potential conflict of interest.
Publisher’s note
All claims expressed in this article are solely those of the authors and do not necessarily represent those of their affiliated organizations, or those of the publisher, the editors, and the reviewers. Any product that may be evaluated in this article, or claim that may be made by its manufacturer, is not guaranteed or endorsed by the publisher.
References
Bi, M., Ge, X., and Li, T. (2018). Dependence of tropical cyclone intensification on the latitude under vertical shear. J. Meteor. Res. 32, 113–123. doi:10.1007/s13351-018-7055-4
Black, M. L., Gamache, J. F., Marks, F. D., Samsury, C. E., and Willoughby, H. E. (2002). Eastern pacific hurricanes jimena of 1991 and olivia of 1994: The effect of vertical shear on structure and intensity. Mon. Weather Rev. 130, 2291–2312. doi:10.1175/1520-0493(2002)130<2291:ephjoa>2.0.co;2
Chan, K. T. F., Wang, D., Zhang, Y., Wanawong, W., He, M., and Yu, X. (2019). Does strong vertical wind shear certainly lead to the weakening of a tropical cyclone? Environ. Res. Commun. 1, 015002. doi:10.1088/2515-7620/aaecac
Chen, B.-F., Davis, C. A., and Kuo, Y.-H. (2019). An idealized numerical study of shear-relative low-level mean flow on tropical cyclone intensity and size. J. Atmos. Sci. 76, 2309–2334. doi:10.1175/jas-d-18-0315.1
Chen, B.-F., Davis, C. A., and Kuo, Y.-H. (2021). Examination of the combined effect of deep-layer vertical shear direction and lower-tropospheric mean flow on tropical cyclone intensity and size based on the ERA5 reanalysis. Mon. Weather Rev. 149, 4057–4076. doi:10.1175/MWR-D-21-0120.1
Chen, S. S., Knaff, J. A., and Marks, F. D. (2006). Effects of vertical wind shear and storm motion on tropical cyclone rainfall asymmetries deduced from TRMM. Mon. Weather Rev. 134, 3190–3208. doi:10.1175/mwr3245.1
Corbosiero, K. L., and Molinari, J. (2002). The effects of vertical wind shear on the distribution of convection in tropical cyclones. Mon. Weather Rev. 130, 2110–2123. doi:10.1175/1520-0493(2002)130<2110:teovws>2.0.co;2
Dai, Y., Majumdar, S. J., and Nolan, D. S. (2021). Tropical cyclone resistance to strong environmental shear. J. Atmos. Sci. 78, 1275–1293. doi:10.1175/jas-d-20-0231.1
DeHart, J. C., Houze, R. A., and Rogers, R. F. (2014). Quadrant distribution of tropical cyclone inner-core kinematics in relation to environmental shear. J. Atmos. Sci. 71, 2713–2732. doi:10.1175/jas-d-13-0298.1
Emanuel, K., DesAutels, C., Holloway, C., and Korty, R. (2004). Environmental control of tropical cyclone intensity. J. Atmos. Sci. 61, 843–858. doi:10.1175/1520-0469(2004)061<0843:ecotci>2.0.co;2
Finocchio, P. M., Majumdar, S. J., Nolan, D. S., and Iskandarani, M. (2016). Idealized tropical cyclone responses to the height and depth of environmental vertical wind shear. Mon. Weather Rev. 144, 2155–2175. doi:10.1175/mwr-d-15-0320.1
Ge, X., Xu, W., and Zhou, S. (2015). Sensitivity of tropical cyclone intensification to inner-core structure. Adv. Atmos. Sci. 32, 1407–1418. doi:10.1007/s00376-015-4286-5
Grell, G. A., and Freitas, S. R. (2014). A scale and aerosol aware stochastic convective parameterization for weather and air quality modeling. Atmos. Chem. Phys. 14, 5233–5250. doi:10.5194/acp-14-5233-2014
Hong, S.-Y., Noh, Y., and Dudhia, J. (2006). A new vertical diffusion package with an explicit treatment of entrainment processes. Mon. Weather Rev. 134, 2318–2341. doi:10.1175/mwr3199.1
Hong, S. Y., and Lim, J.-O. J. (2006). The WRF single-moment 6-class microphysics scheme (WSM6). Asia-pacific J. Atmos. Sci. 42, 129–151.
Huang, Q., Ge, X., and Bi, M. (2022). Simulation of rapid intensification of super typhoon lekima (2019). Part II: The critical role of cloud-radiation interaction of asymmetric convection. Front. Earth Sci. 9, 832670. doi:10.3389/feart.2021.832670
Iacono, M. J., Delamere, J. S., Mlawer, E. J., Shephard, M. W., Clough, S. A., and Collins, W. D. (2008). Radiative forcing by long-lived greenhouse gases: Calculations with the AER radiative transfer models. J. Geophys. Res. Atmos. 113, D13103. doi:10.1029/2008jd009944
Jones, S. C. (1995). The evolution of vortices in vertical shear. I: Initially barotropic vortices. Q. J. Roy. Meteor Soc. 121, 821–851. doi:10.1002/qj.49712152406
Lee, C.-S., Cheung, K. K. W., Fang, W.-T., and Elsberry, R. L. (2010). Initial maintenance of tropical cyclone size in the western north pacific. Mon. Weather Rev. 138, 3207–3223. doi:10.1175/2010mwr3023.1
Onderlinde, M. J., and Nolan, D. S. (2014). Environmental helicity and its effects on development and intensification of tropical cyclones. J. Atmos. Sci. 71, 4308–4320. doi:10.1175/jas-d-14-0085.1
Rappin, E. D., and Nolan, D. S. (2012). The effect of vertical shear orientation on tropical cyclogenesis. Q. J. Roy. Meteor Soc. 138, 1035–1054. doi:10.1002/qj.977
Reasor, P. D., and Montgomery, M. T. (2015). Evaluation of a heuristic model for tropical cyclone resilience. J. Atmos. Sci. 72, 1765–1782. doi:10.1175/jas-d-14-0318.1
Reasor, P. D., Montgomery, M. T., and Grasso, L. D. (2004). A new look at the problem of tropical cyclones in vertical shear flow: Vortex resiliency. J. Atmos. Sci. 61, 3–22. doi:10.1175/1520-0469(2004)061<0003:anlatp>2.0.co;2
Reasor, P. D., Rogers, R., and Lorsolo, S. (2013). Environmental flow impacts on tropical cyclone structure diagnosed from airborne Doppler radar composites. Mon. Weather Rev. 141, 2949–2969. doi:10.1175/mwr-d-12-00334.1
Riemer, M., Montgomery, M. T., and Nicholls, M. E. (2010). A new paradigm for intensity modification of tropical cyclones: Thermodynamic impact of vertical wind shear on the inflow layer. Atmos. Chem. Phys. 10, 3163–3188. doi:10.5194/acp-10-3163-2010
Ryglicki, D. R., Doyle, J. D., Hodyss, D., Cossuth, J. H., Jin, Y., Viner, K. C., et al. (2019). The unexpected rapid intensification of tropical cyclones in moderate vertical wind shear. Part III: Outflow–Environment interaction. Mon. Weather Rev. 147, 2919–2940. doi:10.1175/mwr-d-18-0370.1
Shi, D., and Chen, G. (2021). The implication of outflow structure for the rapid intensification of tropical cyclones under vertical wind shear. Mon. Weather Rev. 149, 4107–4127. doi:10.1175/MWR-D-21-0141.1
Simpson, R. H., Bureau, U., and Riehl, H. (1958). “Mid-tropospheric ventilation as a constraint on hurricane development and maintenance,” in Preprints, Tech. Conf. on Hurricanes, 12-June 1958 (Miami Beach, FL: Amer. Meteor. Soc.), 1–10.
Tang, B., and Emanuel, K. (2012). A ventilation index for tropical cyclones. Bull. Am. Meteorological Soc. 93, 1901–1912. doi:10.1175/bams-d-11-00165.1
Tang, B., and Emanuel, K. (2010). Midlevel ventilation’s constraint on tropical cyclone intensity. J. Atmos. Sci. 67, 1817–1830. doi:10.1175/2010jas3318.1
Wang, B., and Li, X. (1992). The beta drift of three-dimensional vortices: A numerical study. Mon. Weather Rev. 120, 579–593. doi:10.1175/1520-0493(1992)120<0579:tbdotd>2.0.co;2
Wang, B., Li, X., and Wu, L. (1997). Direction of hurricane beta drift in horizontally sheared flows. J. Atmos. Sci. 54, 1462–1471. doi:10.1175/1520-0469(1997)054<1462:dohbdi>2.0.co;2
Wang, Y., and Holland, G. J. (1996). Tropical cyclone motion and evolution in vertical shear. J. Atmos. Sci. 53, 3313–3332. doi:10.1175/1520-0469(1996)053<3313:tcmaei>2.0.co;2
Wu, C.-C., and Emanuel, K. A. (1993). Interaction of a baroclinic vortex with background shear: Application to hurricane movement. J. Atmos. Sci. 50, 62–76. doi:10.1175/1520-0469(1993)050<0062:ioabvw>2.0.co;2
Xu, J., and Wang, Y. (2010a). Sensitivity of the simulated tropical cyclone inner-core size to the initial vortex size. Mon. Weather Rev. 138, 4135–4157. doi:10.1175/2010mwr3335.1
Xu, J., and Wang, Y. (2010b). Sensitivity of tropical cyclone inner-core size and intensity to the radial distribution of surface entropy flux. J. Atmos. Sci. 67, 1831–1852. doi:10.1175/2010jas3387.1
Zhang, D.-L., and Kieu, C. Q. (2006). Potential vorticity diagnosis of a simulated hurricane. Part II: Quasi-balanced contributions to forced secondary circulations. J. Atmos. Sci. 63, 2898–2914. doi:10.1175/jas3790.1
Zhang, D.-L. (2005). Shear-forced vertical circulations in tropical cyclones. Geophys. Res. Lett. 32, L13822. doi:10.1029/2005gl023146
Keywords: TC intensity, tropical cyclone, size, intensification, vertical wind shear
Citation: Bi M, Wang R, Li T and Ge X (2023) Effects of vertical shear on intensification of tropical cyclones of different initial sizes. Front. Earth Sci. 11:1106204. doi: 10.3389/feart.2023.1106204
Received: 23 November 2022; Accepted: 04 January 2023;
Published: 19 January 2023.
Edited by:
Yunheng Wang, University of Oklahoma, United StatesCopyright © 2023 Bi, Wang, Li and Ge. This is an open-access article distributed under the terms of the Creative Commons Attribution License (CC BY). The use, distribution or reproduction in other forums is permitted, provided the original author(s) and the copyright owner(s) are credited and that the original publication in this journal is cited, in accordance with accepted academic practice. No use, distribution or reproduction is permitted which does not comply with these terms.
*Correspondence: Ruifang Wang, cnVpZndhbmdAempudS5lZHUuY24=