 Mahmood Ahmad1,2*
 Badr T. Alsulami3
 Ahmad Hakamy3
 Ali Majdi4Muwaffaq Alqurashi5
 Mohanad Muayad Sabri Sabri6Ramez A. Al-Mansob1Mohd Rasdan Bin Ibrahim7
- 1Department of Civil Engineering, Faculty of Engineering, International Islamic University Malaysia, Jalan Gombak, Malaysia
- 2Department of Civil Engineering, University of Engineering and Technology Peshawar (Bannu Campus), Bannu, Pakistan
- 3Department of Civil Engineering, College of Engineering and Islamic Architecture, Umm Al-Qura University, Makkah, Saudi Arabia
- 4Department of Building and Construction Techniques Engineering, Al-Mustaqbal University College, Al-Hilla, Iraq
- 5Department of Civil Engineering, College of Engineering, Taif University, Taif, Saudi Arabia
- 6Peter the Great St. Petersburg Polytechnic University, Saint Petersburg, Russia
- 7Department of Civil Engineering, Center for Transportation Research, Engineering Faculty, Universiti Malaya, Kuala Lumpur, Malaysia
Seismic liquefaction has been reported in sandy soils as well as gravelly soils. Despite sandy soils, a comprehensive case history record is still lacking for developing empirical, semi-empirical, and soft computing models to predict this phenomenon in gravelly soils. This work compiles documentation from 234 case histories of gravelly soil liquefaction from across the world to generate a database, which will then be used to develop seismic gravelly soil liquefaction potential models. The performance measures, namely, accuracy, precision, recall, F-score, and area under the receiver operating characteristic curve, were used to evaluate the training and testing tree-based models’ performance and highlight the capability of the logistic model tree over reduced error pruning tree, random tree and random forest models. The findings of this research can provide theoretical support for researchers in selecting appropriate tree-based models and improving the predictive performance of seismic gravelly soil liquefaction potential.
1 Introduction
Liquefaction occurs when a saturated soil loses its strength due to a rise in pore water pressure caused by dynamic loads. It is a condition in which earthquake shaking or other rapid loading weakens the stiffness and strength of a soil. When soil liquefies, it loses its strength and the ability of a soil deposit to sustain the structure above it. This phenomenon causes destructions to environment, structures and human life. Geotechnical engineers must examine soil liquefaction characteristics as part of their profession, in the design stage of civil engineering project (Ghani et al., 2021). Most prior studies concentrated on developing liquefaction evaluation models for sandy or silty soils while ignoring the potential of liquefaction in gravelly soils. Because gravelly soils are very permeable and contain big particles, extra pore water pressure cannot build up quickly during earthquake loading. Many studies of historical liquefaction-induced risks, however, have revealed that loose to medium density gravelly soil can also liquefy after major earthquakes (Youd et al., 1985; Yegian et al., 1994; Sirovich, 1996; Hatanaka et al., 1997; Lin et al., 2004; Cao et al., 2011).
Recent research on the mechanism and behavior of gravelly soil liquefaction has revealed that the triggering conditions for gravelly soil liquefaction differ from those for sandy or silty soil (Wang and Wang, 2017; Chen et al., 2018; Hu, 2021a). For example, a review of the majority of the soil profile reveals a thick non-liquefiable sandy gravel layer with high penetration resistance (potentially indicating a dense soil deposit) that may have acted as a less-permeable capping layer, contributing to the development of high excess pore water pressures leading to liquefaction while also preventing sand ejecta from reaching the ground surface and liquefaction manifestation to be observed. Because of these differences, gravel soil liquefies differently than sandy or silty soil. Researchers and engineers are attempting to assess the liquefaction potential in this type of soil owing to the widespread occurrence of seismic gravelly soil liquefaction during major earthquakes around the world. However, there is a scarcity of case histories of gravelly soil liquefaction created to develop capable models (Yegian et al., 1994; Hatanaka et al., 1997).
Andrus and Stokoe (2000) proposed the first simplified approach based on Vs and cyclic resistance ratio (CRR) to evaluate the liquefaction of gravelly soils with fines content of less than 5% using 36 shear wave velocity test (Vs) data from the 1906 San Francisco earthquake, 1983 Borah Peak earthquake, 1989 Loma Prieta earthquake, 1993 Hokkaido-nansei earthquake, and 1995 Hyogo-ken Nanbu earthquake. Later, the simplified technique was adjusted to account for the influence of void ratio and GC on the liquefaction of gravelly soil (Chang, 2016). Following the enhancement of the data by the dynamic penetration test (DPT) and shear wave velocity test in the 2008 Wenchuan earthquake, an increasing number of models, such as the fundamental procedures (Cao and Yuan, 2010; Yuan and Cao, 2011), logistic regression (LR) models (Cao et al., 2011; Cao et al., 2013), and artificial neural network (ANN) models (Kang et al., 2014) were developed. However, the historical DPT data utilized to develop these approaches and models came from a single earthquake (the 2008 Wenchuan earthquake), therefore the models’ generalization abilities need to be tested further using additional historical data. Despite their reliable and accurate results, most algorithms are difficult to apply in reality due to their extensive training and modeling procedures, as well as their “black box” aspects. Decision tree algorithms have been successfully applied to numerous geotechnical problems, such as pillar stability (Ahmad et al., 2021) and soil liquefaction potential (Ahmad et al., 2019a). When using tree algorithms to evaluate seismic gravelly soil liquefaction potential, outputs should be discrete values such as “yes” or “liquefied”, “no” or “non-liquefied.”
Artificial intelligence (AI) techniques have been widely used to solve real-world problems in the last 10 years, particularly in civil engineering. AI techniques have been successfully applied to a wide range of real-world scenarios, paving the way for a number of promising opportunities in civil engineering and other fields such as environmental (Froemelt et al., 2018), geotechnical and geological (Momeni et al., 2014; Armaghani et al., 2017; Mikaeil et al., 2018a; Mikaeil et al., 2018b; Ahmad et al., 2019a; Ahmad et al., 2019b; Dormishi et al., 2019; Ahmad et al., 2020a; Ahmad et al., 2020b; Ahmad et al., 2020c; Ahmad et al., 2020d; Noori et al., 2020; Ahmad et al., 2021; Ahmad et al., 2022; Amjad et al., 2022; Xie et al., 2022; Yan et al., 2022), and other sciences (Hajihassani et al., 2014; Guido et al., 2020; Morosini et al., 2021; Asteris et al., 2022) including seismic gravelly soil liquefaction potential evaluation (Kang et al., 2014). These studies introduced new ideas and methods for assessing the seismic liquefaction potential of gravelly soils. This field, however, is still being researched. The main purpose of this research is to develop new decision tree models for predicting seismic gravelly soil liquefaction potential. The decision tree algorithms have the advantage of dealing with the classification problem, making it a rational choice in classification and decision-making. The main applications of the decision tree algorithms—C4.5, random tree (RT), and logistic model tree (LMT)—have mostly been used in geotechnical engineering to predict pillar stability, slope stability, and liquefaction susceptibility (Ahmad et al., 2019a; Ahmad et al., 2021; Li et al., 2022), but critical review of existing literature suggests that despite the successful implementation of LMT, RT, reduced error pruning tree (REPT), and random forest (RF) in various domains, their implementation to predict seismic gravelly soil liquefaction potential is scarcely explored. Furthermore, one of the main significance of the developed decision tree models is that in these models, there is no need to add functional parameters (such as cyclic stress ratio in the LR model proposed by Cao et al. (2013) values affecting parameters; all parameters can be put into the model as they are, without any normalization or calibration.
2 Sample library and correlation analysis
The existing soil liquefaction case histories data are collected as supportive data for the establishment of prediction models. In this study, the dynamic penetration test (DPT) data of gravelly soil liquefaction to 234 from 17 historical earthquakes were ascertained from Hu (2021a). Most of these cases have been reviewed, screened, and corrected to result in robust database and recently referred by Hu (2021a). The seismic gravelly soil liquefaction case history data is shown in Table 1 (the complete database is available in Supplementary Appendix Table SA1), where X1 indicates moment magnitude (Mw), X2 indicates the epicentral distance (R), X3 indicates the bracketed duration (t), X4 indicates the peak ground acceleration (PGA), X5 indicates gravel content (GC), X6 indicates fines content (FC), X7 indicates average particle size (D50), X8 indicates overburden stress-corrected dynamic penetration test blow count (N′120), X9 indicates vertical effective overburden stress (σ′v), X10 indicates depth to the water table (Dw), X11 indicates thickness of the impreable capping layer (Hn), and X12 indicates thickness of the unsaturated zone between groundwater table and capping layer (Dn). These tweleve parameters have been widely accepted, among the researchers such as (Yuan and Cao, 2011; Hu, 2021b) as their values are relatively easy to be obtained and suitable set to evaluate seismic gravelly soil liquefaction potential. The summary of descriptive statistics of the input paramaters (i.e., Mw, R, t, PGA, GC, FC, D50, N′120, σ′v, Dw, Hn, and Dn) are given in Table 2. The mean or mode imputation method is a simple and widely used method for replacing missing values (Batista and Monard, 2003). This approach is used in this study. For each of these parameters in the considered database, the minimum (Min) and maximum (Max) limits, standard deviation (SD), kurtosis, and skewness values have been tabulated. A lower SD number indicates that the results are mainly close to the mean (PGA, Mw, Dn, Hn, Dw, FC, and N'120), while a larger SD suggests a greater spread out (R, σ'v, t, GC, and D50) (Edjabou et al., 2017). Skewness (value might be positive, zero, negative, or undefined) assists in evaluating the extent of asymmetry of the probability distribution in the case of a real-valued arbitrary parameter from the perspective of its average value (Sharma and Ojha, 2020). Furthermore, kurtosis is typically between −10 (heavy-tailed) and +10 (light-tailed), which aids in determining the form of a probability distribution, as explained by Brown and Greene (Brown and Greene, 2006). The kurtosis values for Mw and t are negative and range between −0.3 and −0.1 (follow mesokurtic distribution), whereas the rest are positive values (follow leptokurtic distribution) (Benson, 1993; Lee and Ahn, 2019).
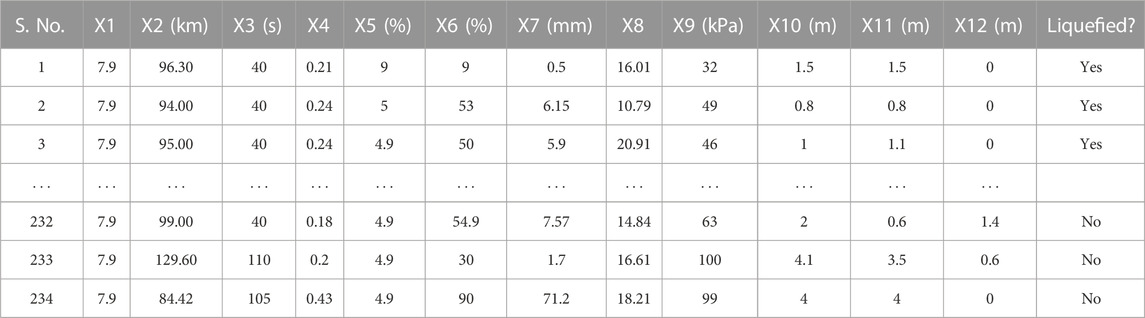
Table 1. Seismic gravelly soil liquefaction history data.

Table 2. Descriptive statistics of each parameter.
Pearson’s correlation coefficient (ρ) was used to measure the strength of a linear association between two variables. Given a pair of random variables (p, q), the following equation is used to calculate ρ:
where cov denotes covariance,
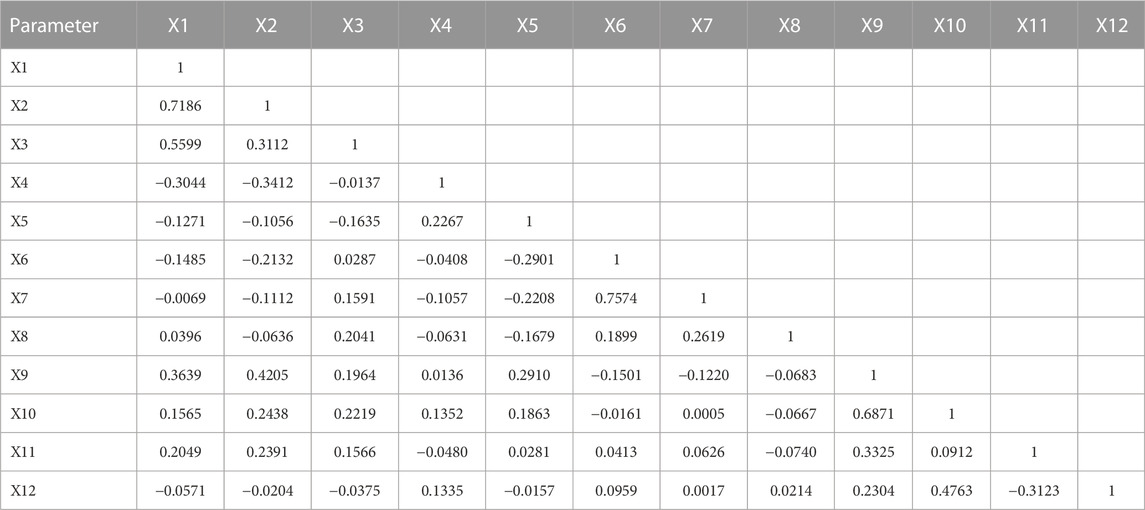
Table 3. Correlation coefficients between various parameters.
3 Decision tree algorithms
3.1 Random tree
Random trees comprise a forest of predictor trees. Random tree is an algorithm halfway between a simple decision tree and a random forest. The classification mechanisms include the following: The random tree classifier classifies the input vector of characteristic with each tree in the forest and then outputs the class label with the most “votes” (Witten et al., 2011).
A random tree is one that is randomly created from a set of possible trees, each of which has K random attributes at each node. In this context, “at random” indicates that any tree in the set has an equal chance of being chosen for sampling. The tree distribution is “uniform.” Rapidly constructing random trees and integrating them with large sets of random trees typically yields accurate models. In recent years, there has been extensive research on random trees in the field of machine learning. This model employed the random tree approach in order to achieve the highest level of accuracy in its numerous classifier parameters, such as MinNum value–a minimum number of instances, depth–maximum depth of the tree, and seed–randomly selecting attributes, K value–number of sets utilized for randomly chosen attributes. The Decision Tree must be basic and compact for improved classification. Otherwise, the level of precision will be diminished. To obtain the highest level of precision, a random tree algorithm modifies the depth, seed, and K value. To determine the maximum parameter value, one parameter was held constant while the other was adjusted to determine the parameter with the highest accuracy.
3.2 Reduced error pruning tree
The Reduced Error Pruning Tree (REPT) is a fast decision tree learning algorithm method that combines Reduced Error Pruning (REP) and the Decision Tree (DT) (Quinlan, 1987). When the output of a decision tree is large, the DT is used to simplify the modeling process using training dataset, and the REP is used to reduce complicity of the tree structure (Mohamed et al., 2012). The pruning process in the REPT algorithm addresses the problem of backward overfitting (Quinlan, 1987). Based on the post-pruning method, the REPT algorithm attempts to find the minimal version of the most accurate sub-tree (Esposito et al., 1999; Chen et al., 2009). This model’s performance is based on information gain from entropy or variance reduction and error pruning techniques (Srinivasan and Mekala, 2014). The complex decision trees can lead to overfitting and make a model less interpretable, REP helps to reduce complexity by removing the DT structure’s leaves and branches (Quinlan, 1987; Galathiya et al., 2012; Mohamed et al., 2012; Pham et al., 2019).
3.3 Random forest
Breiman (2001) developed the Random Forest (RF) classifier and may be characterized as a collection of classification trees in which each tree votes on the class assigned to a given sample, with the most frequently occurring answer winning the vote (Sun and Schulz, 2015). The RF method has demonstrated its ability to handle high-dimensional data and is relatively resistant to overfitting (Breiman, 2001). This algorithm is widely used in various domains of civil engineering, including geotechnical engineering. Before model training, two parameters must be selected: the number of predictors considered at each fork of the tree and the number of random trees constructed during model construction. This machine learning has various advantages, including great performance with complicated datasets utilizing tiny calibrating and the ability to handle with high noise factors. The bagging approach is always used in a random forest to randomly select variables from the entire dataset for model calibration.
3.4 Logistic model tree
Logistic Model Tree combines the C4.5 algorithm (Quinlan, 1992) and Logistic Regression (LR) functions. The information gain ratio technique is utilized to divide the tree into nodes and leaves, and the LogitBoost algorithm (Landwehr et al., 2005) is used to fit the logistic regression functions at each node of the tree. Because it is the quickest approach for giving dependable classification accuracy, the C4.5 algorithm employs the entropy methodology for feature selection (Lim et al., 2000). The CART technique, which prunes the tree for modeling the training dataset, overcomes the overfitting problem, which is a significant challenge in LMT modeling (Shahabi et al., 2013). The IGR can be expressed as follows:
where gain (a) is the information obtained after attribute an is chosen as a test for training sample classification and split info (a) is the information obtained after categorizing x training samples into n subsets (Quinlan, 1993).
The LogitBoost algorithm then conducts additive Logistic Regression with least-squares fit for each class Ci (yes or no) using the equation below (Doetsch et al., 2009):
where Lc(x) is the least-squares fit, and CF, αi are, respectively, the number of liquefaction potential conditioning factors and the coefficient of the ith element of vector x. The posteriori probabilities in the leaves of the LMT are calculated using the linear Logistic Regression model (Landwehr et al., 2005):
where c is the number of liquefaction classes and Lc (x), the least-squares fit, is transformed in such a way that
4 Performance measures
The accuracy (Acc), Matthews correlation coefficient (Mcc), precision (Prec), recall (Rec), F-score, and area under the receiver operator characteristic (ROC) curve (AUC) were used to evaluate the model’s performance. The performance metrics, together with their formulations and definitions, based on the confusion matrix (Table 4) described in Table 5.
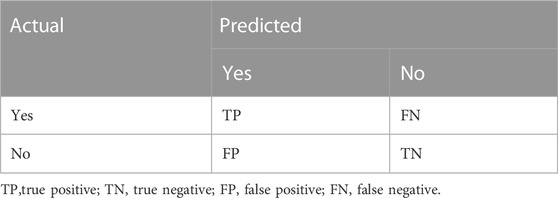
Table 4. Confusion matrix of binary problem.
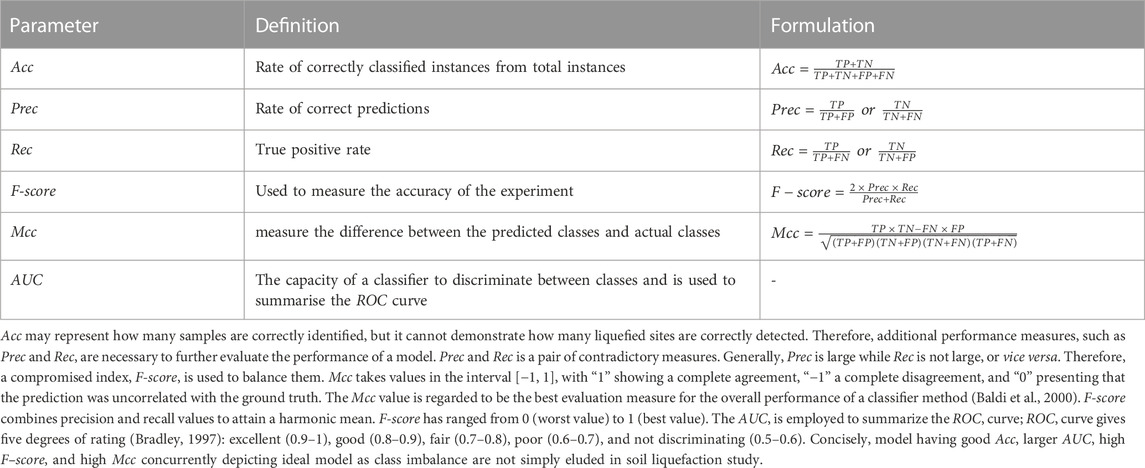
Table 5. Definition and formulation of performance measures.
5 Results and discussion
The manner in which data is divided into training and test sets has a significant impact on the results of data mining techniques (Javadi et al., 2006). The optimal parameter configuration is used to fit the prediction model to the training set, and the test set is used to evaluate model performance based on overall prediction outcomes and prediction ability for each class. Finally, the best model is chosen by comparing the overall performance of various models. If the model’s prediction performance is satisfactory, it can be used for deployment. The methodological framework of tree-based classifier for predicting seismic gravelly soil liquefaction potential models is shown in Figure 1.
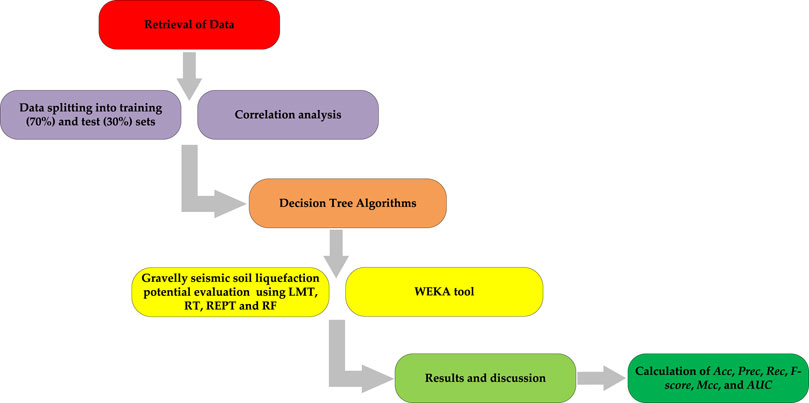
Figure 1. Methodological framework of Tree-based classifier for predicting seismic gravelly soil liquefaction potential.
The entire calculation process is performed in Waikato Environment for Knowledge Analysis (WEKA) software (Version 3.9.6), a java-based and open-source application, trained the decision tree models. It contains tools for data preparation, classification, regression, clustering, association rules mining, and visualization. The details of the different parameters of classifiers used for the implementation of developed models in WEKA framework are summarized in Table 6. First, the search range of different parameters values is specified. In particular, for different algorithms, the search range of the same parameters is kept consistent. Further on, according to the maximum average accuracy, the optimal values for each set of parameters are obtained, which are indicated in Table 6. Based on the same dataset, these algorithms with optimal hyperparameters were then used to predict seismic gravelly soil liquefaction potential. Several performance measures based on a confusion matrix are made using training and testing datasets for gravelly soil liquefaction potential were used in order to quantify the performance measures of the proposed models. The performance results of the proposed models were obtained and compared with each other based on the same training and testing datasets. Subsequently, the confusion matrix of each model was determined, as shown in Table 7.
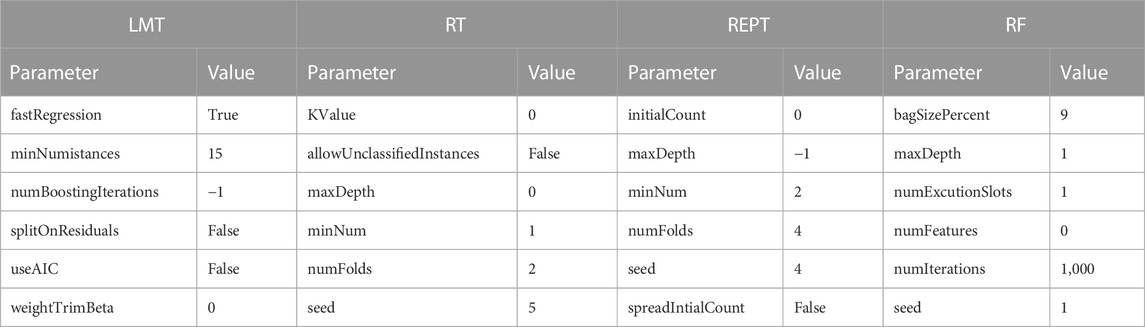
Table 6. Classifiers’ parameters.
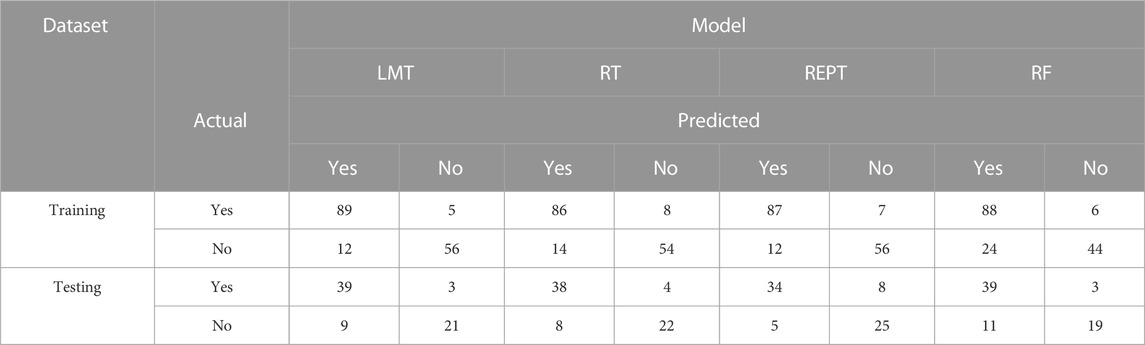
Table 7. Confusion matrices results for training and testing datasets.
The values on the main diagonal indicated the number of cases correctly predicted. The Acc, Prec, Rec, F-score, Mcc, and AUC were calculated, which were listed in Table 6. To make a fair comparison, all the models are developed by applying them to the same seismic gravelly soil liquefaction case history training and testing data sets.
Figure 2, displays the bar plot of the yes and the no classes of the seismic gravelly soil liquefaction for the training and test phases. The analysis of the Acc together with Rec, Prec, F-score, Mcc, and AUC for the seismic gravelly soil liquefaction potential data set demonstrates that the LMT achieved a better prediction performance in training set succeeded by the REPT model, RT model and the RF model. Similarly, in test set, the LMT also achieved better prediction succeeded by the REPT model, RT model, and the RF model (see Figure 2). It can be seen that most of the cases, i.e., 145 were accurately classified using the LMT in the training dataset whereas the performance of the LMT and RT models are at par, i.e., 60 cases in the test set. Decision trees algorithms, i.e., RT and REPT are quite transparent, and are white box models that are more intuitive and interpretable than ones with other model, i.e., logistic regression and ANN models for seismic gravelly soil liquefaction potential proposed in the literature. Due to tree-like structures, the proposed models can not only obtain accurate classification results, but can also show the internal mechanism for classification results. Figure 3 shows the results of implementing RT. The size of this tree is 29 with the number of nodes being 14 and 15 leaves. The leaves of the tree represent the predictive rules of the tree. The process time of building this tree is 0.02 s. Similarly, the size of REPT is 11 with the number of nodes being 5 and 6 leaves is shown in Figure 4. The process time of building REPT is 0.01 s. The overall accuracy of LMT model based on the training and test sets were found better than the RT model. By comprehensively analyzing the Acc together with Rec, Prec, F-score, Mcc, and AUC, the rank of overall prediction performance was LMT>REPT>RT>RF. According to the Rec, Prec, F-score of each yes and no levels, the prediction performance for yes level was better than that for no level. The graphical output of the RT and REPT models are presented in Figures 3, 4 respectively. The numbers in parentheses at each leaf node, represent the total number of instances and the number of incorrectly classified cases. It is clear that some instances are misclassified in some leaves. The number of misclassified instances is specified after a slash. In order to create the most accurate RT and REPT models, the optimal values for the minimum number of instances per leaf in WEKA were obtained through trial and error. The developed RT and REPT models, Figures 3, 4 can be used by geotechnical engineering professionals with the help of a spreadsheet to evaluate the gravelly soil liquefaction potential for a future seismic event without going into complexities of model development.
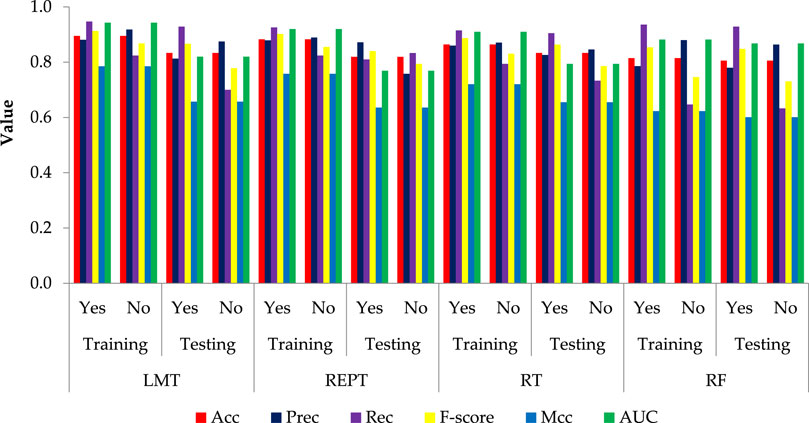
Figure 2. Comparison of results of developed DT models.
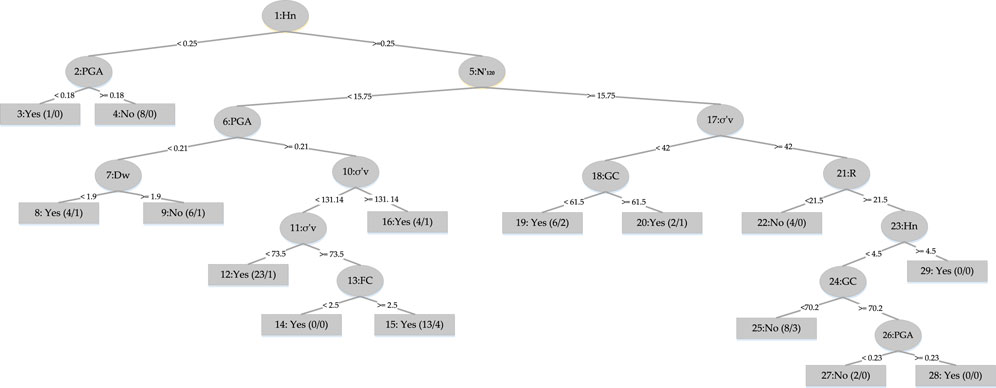
Figure 3. RT model.
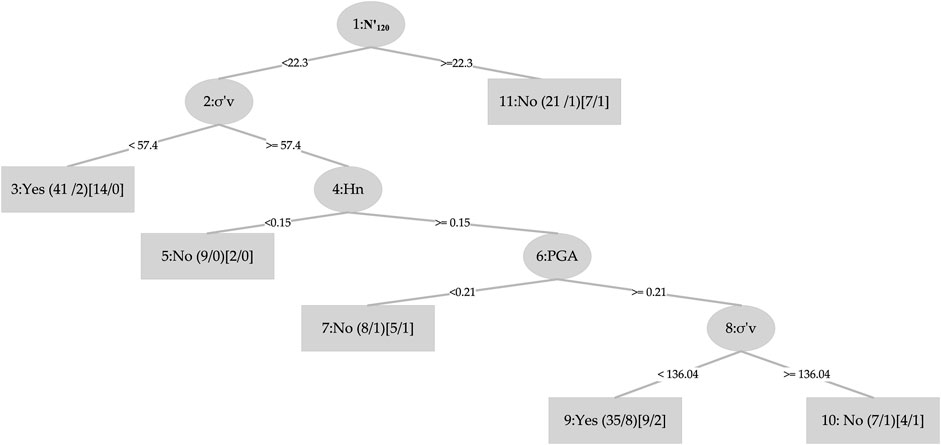
Figure 4. REPT model.
Furthermore, Figure 5 shows that the LMT was able to achieve excellent results with the lowest number of unmatched cases. For LMT, REPT, RT, and RF models, the matched and unmatched numbers were 205 and 29, 202 and 32, 200, and 34, and 190 and 44, respectively, indicating the LMT model’s superiority over the other models used in this study. The error rate throughout the testing phase was low, illustrating the LMT model’s high performance. It was determined that the model with the best performance for seismic gravelly soil liquefaction was the LMT, and that it could be utilized in this field for the same purpose of minimizing the associated risk.
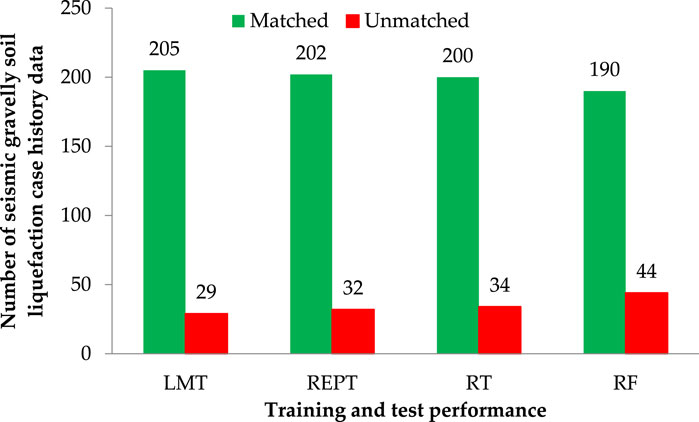
Figure 5. Comparison of results obtained from different models.
Although the proposed models produce desired predictions, it has some limitations, such as a limited and class imbalanced dataset. In general, a limited dataset will have an impact on model generalization and reliability. While the generated models perform well with limited data sets, with Acc greater than 80%, prediction performance on a larger dataset should be improved. Furthermore, the dataset is class imbalanced because yes (liquefied) instances outnumber no (non-liquefied) cases. As a result, it is critical to make a larger and more balanced seismic gravelly soil liquefaction database.
For determining the effectiveness of developed models and comparing their robustness, rank analysis method is used. The statistical parameters are used to assign the score value in this study, with their ideal values serving as the benchmark. It depends on how many models are used. The greatest score is given to the best performing results model, and vice versa. The ranking ratings for two models with the same outcomes may be the same. The score attained by LMT is the highest in the training phase (12), followed by REPT (9) and RT (6) and RF (3) as presented in Table 8.
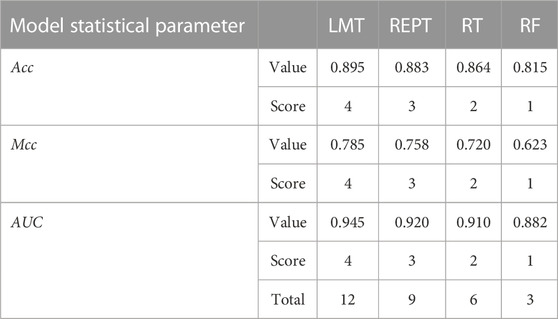
Table 8. Rank analysis of the develop model outcomes for training dataset.
6 Conclusion
In this paper, prediction models were developed by using decision tree models such as LMT, REPT, RT, and RF for the seismic gravelly soil liquefaction potential and compared the model performances. Totally 234 case history data were used for the study with twelve different input parameters for seismic gravelly soil liquefaction potential were selected as the input variables: Mw, R, t, PGA, GC, FC, D50, N′120, σ′v, Dw, Hn, and Dn. The predictive performance of the proposed models is verified and compared. In this study, the LMT model successfully achieved a high level of modeling prediction efficiency to REPT model, RT model and RF model in the training and test sets. Because all models were developed using the same methods (with the same training and test data sets), the LMT model performed the best and highest in this aspect. By comprehensively analyzing the Acc, Prec, Rec, F-score, Mcc, and AUC for yes and no classes, the LMT performed better than REPT, RT, and RF models in the training and test sets. However, in this study, the RF was deemed the lowest-performing model. For LMT, REPT, RT, and RF models, the matched and unmatched numbers were 205 and 29, 202 and 32, 200 and 34, and 190 and 44, respectively, indicating the LMT model’s superiority over the other models used in this study. Furthermore, rank values of LMT, REPT, RT and RF are 12, 9, 6, and 3, respectively and the error rate throughout the testing phase was low, illustrating the LMT model’s high performance. It is believed that the limitation on achieving more successful results is due to the limited number of data (234 case history data) and it is thought that the success rates of different decision tree models will increase if the data set is expanded in the future.
Data availability statement
The datasets presented in this study can be found in online repositories. The names of the repository/repositories and accession number(s) can be found in the article/Supplementary Material.
Author contributions
MA: Conceptualization, Methodology, Software, Writing—Original draft preparation. BTA: Methodology, Data curation, Writing—Original draft preparation. AH: Visualization, Investigation. AM: Investigation, Conceptualization. MA: Software, Validation. MMSS: Methodology, Formal analysis, Resources, Funding acquisition. RAA: Investigation, Project administration, Validation, Writing—Reviewing and Editing. MRBI: Investigation, Methodology, Writing—Reviewing and Editing.
Funding
This research was supported by a grant from the Russian Science Foundation No. 22-79-10021, https://rscf.ru/project/22-79-10021/.
Conflict of interest
The authors declare that the research was conducted in the absence of any commercial or financial relationships that could be construed as a potential conflict of interest.
Publisher’s note
All claims expressed in this article are solely those of the authors and do not necessarily represent those of their affiliated organizations, or those of the publisher, the editors and the reviewers. Any product that may be evaluated in this article, or claim that may be made by its manufacturer, is not guaranteed or endorsed by the publisher.
Supplementary material
The Supplementary Material for this article can be found online at: https://www.frontiersin.org/articles/10.3389/feart.2023.1105610/full#supplementary-material
References
Ahmad, M., Al-Mansob, R. A., Kashyzadeh, K. R., Keawsawasvong, S., Sabri Sabri, M. M., Jamil, I., et al. (2022). Extreme gradient boosting algorithm for predicting shear strengths of rockfill materials. Complexity 2022, 1–11. doi:10.1155/2022/9415863
Ahmad, M., Al-Shayea, N. A., Tang, X.-W., Jamal, A., M Al-Ahmadi, H., and Ahmad, F. (2020d). Predicting the pillar stability of underground mines with random trees and C4. 5 decision trees. Appl. Sci. 10, 6486. doi:10.3390/app10186486
Ahmad, M., Kamiński, P., Olczak, P., Alam, M., Iqbal, M. J., Ahmad, F., et al. (2021). Development of prediction models for shear strength of rockfill material using machine learning techniques. Appl. Sci. 11, 6167. doi:10.3390/app11136167
Ahmad, M., Tang, X.-W., Qiu, J.-N., and Ahmad, F. (2019a). Evaluating seismic soil liquefaction potential using bayesian belief network and C4. 5 decision tree approaches. Appl. Sci. 9, 4226. doi:10.3390/app9204226
Ahmad, M., Tang, X.-W., Qiu, J.-N., Ahmad, F., and Gu, W.-J. (2020b). A step forward towards a comprehensive framework for assessing liquefaction land damage vulnerability: Exploration from historical data. Front. Struct. Civ. Eng. 14, 1476–1491. doi:10.1007/s11709-020-0670-z
Ahmad, M., Tang, X.-W., Qiu, J.-N., Gu, W.-J., and Ahmad, F. (2020a). A hybrid approach for evaluating CPT-based seismic soil liquefaction potential using Bayesian belief networks. J. Central South Univ. 27, 500–516. doi:10.1007/s11771-020-4312-3
Ahmad, M., Tang, X., and Ahmad, F. (2020c). “Evaluation of liquefaction-induced settlement using random forest and REP tree models: Taking pohang earthquake as a case of illustration,” in Natural hazards-impacts (IntechOpen: Adjustments & Resilience).
Ahmad, M., Tang, X., Qiu, J., Ahmad, F., and Gu, W. (2019b). “LLDV-A comprehensive framework for assessing the effects of liquefaction land damage potential,” in Proceedings of 2019 IEEE 14th international conference on intelligent systems and Knowledge engineering (ISKE) (IEEE), 527–533.
Amjad, M., Ahmad, I., Ahmad, M., Wróblewski, P., Kamiński, P., and Amjad, U. (2022). Prediction of pile bearing capacity using XGBoost algorithm: Modeling and performance evaluation. Appl. Sci. 12, 2126. doi:10.3390/app12042126
Andrus, R. D., and Stokoe, K. H. (2000). Liquefaction resistance of soils from shear-wave velocity. J. geotechnical geoenvironmental Eng. 126, 1015–1025. doi:10.1061/(asce)1090-0241(2000)126:11(1015)
Armaghani, D. J., Mohamad, E. T., Narayanasamy, M. S., Narita, N., and Yagiz, S. (2017). Development of hybrid intelligent models for predicting TBM penetration rate in hard rock condition. Tunn. Undergr. Space Technol. 63, 29–43. doi:10.1016/j.tust.2016.12.009
Asteris, P. G., Lourenço, P. B., Roussis, P. C., Adami, C. E., Armaghani, D. J., Cavaleri, L., et al. (2022). Revealing the nature of metakaolin-based concrete materials using artificial intelligence techniques. Constr. Build. Mater. 322, 126500. doi:10.1016/j.conbuildmat.2022.126500
Baldi, P., Brunak, S., Chauvin, Y., Andersen, C. A., and Nielsen, H. (2000). Assessing the accuracy of prediction algorithms for classification: An overview. Bioinformatics 16, 412–424. doi:10.1093/bioinformatics/16.5.412
Batista, G. E., and Monard, M. C. (2003). An analysis of four missing data treatment methods for supervised learning. Appl. Artif. Intell. 17, 519–533. doi:10.1080/713827181
Benson, C. H. (1993). Probability distributions for hydraulic conductivity of compacted soil liners. J. geotechnical Eng. 119, 471–486. doi:10.1061/(asce)0733-9410(1993)119:3(471)
Bradley, A. P. (1997). The use of the area under the ROC curve in the evaluation of machine learning algorithms. Pattern Recognit. 30, 1145–1159. doi:10.1016/s0031-3203(96)00142-2
Brown, S. C., and Greene, J. A. (2006). The wisdom development scale: Translating the conceptual to the concrete. J. Coll. Student Dev. 47, 1–19. doi:10.1353/csd.2006.0002
Cao, Z., Youd, T. L., and Yuan, X. (2013). Chinese dynamic penetration test for liquefaction evaluation in gravelly soils. J. Geotechnical Geoenvironmental Eng. 139, 1320–1333. doi:10.1061/(asce)gt.1943-5606.0000857
Cao, Z., Youd, T. L., and Yuan, X. (2011). Gravelly soils that liquefied during 2008 Wenchuan, China earthquake, Ms= 8.0. Soil Dyn. Earthq. Eng. 31, 1132–1143. doi:10.1016/j.soildyn.2011.04.001
Cao, Z., and Yuan, X. (2010). Shear wave velocity-based approach for evaluating gravel soils liquefaction. Chin. J. Rock Mech. Eng. 29, 943–951.
Chang, W.-J. (2016). Evaluation of liquefaction resistance for gravelly sands using gravel content–corrected shear-wave velocity. J. Geotechnical Geoenvironmental Eng. 142, 04016002. doi:10.1061/(asce)gt.1943-5606.0001427
Chen, J., Wang, X., and Zhai, J. (2009). “Pruning decision tree using genetic algorithms,” in Proceedings of 2009 international conference on artificial intelligence and computational intelligence, 244–248.
Chen, L., Yuan, X., Cao, Z., Sun, R., Wang, W., and Liu, H. (2018). Characteristics and triggering conditions for naturally deposited gravelly soils that liquefied following the 2008 Wenchuan Mw 7.9 earthquake, China. Earthq. Spectra 34, 1091–1111. doi:10.1193/032017eqs050m
Doetsch, P., Buck, C., Golik, P., Hoppe, N., Kramp, M., Laudenberg, J., et al. (2009). “Logistic model trees with auc split criterion for the kdd cup 2009 small challenge,” in Proceedings of KDD-cup 2009 competition, 77–88.
Dormishi, A., Ataei, M., Mikaeil, R., Khalokakaei, R., and Haghshenas, S. S. (2019). Evaluation of gang saws’ performance in the carbonate rock cutting process using feasibility of intelligent approaches. Eng. Sci. Technol. Int. J. 22, 990–1000. doi:10.1016/j.jestch.2019.01.007
Edjabou, M. E., Martín-Fernández, J. A., Scheutz, C., and Astrup, T. F. (2017). Statistical analysis of solid waste composition data: Arithmetic mean, standard deviation and correlation coefficients. Waste Manag. 69, 13–23. doi:10.1016/j.wasman.2017.08.036
Esposito, F., Malerba, D., Semeraro, G., and Tamma, V. (1999). The effects of pruning methods on the predictive accuracy of induced decision trees. Appl. Stoch. Models Bus. Industry 15, 277–299. doi:10.1002/(sici)1526-4025(199910/12)15:4<277::aid-asmb393>3.0.co;2-b
Froemelt, A., Durrenmatt, D. J., and Hellweg, S. (2018). Using data mining to assess environmental impacts of household consumption behaviors. Environ. Sci. Technol. 52, 8467–8478. doi:10.1021/acs.est.8b01452
Galathiya, A., Ganatra, A., and Bhensdadia, C. (2012). Improved decision tree induction algorithm with feature selection, cross validation, model complexity and reduced error pruning. Int. J. Comput. Sci. Inf. Technol. 3, 3427–3431.
Ghani, S., Kumari, S., and Bardhan, A. (2021). A novel liquefaction study for fine-grained soil using PCA-based hybrid soft computing models. Sādhanā 46, 113–117. doi:10.1007/s12046-021-01640-1
Guido, G., Haghshenas, S. S., Haghshenas, S. S., Vitale, A., Gallelli, V., and Astarita, V. (2020). Development of a binary classification model to assess safety in transportation systems using GMDH-type neural network algorithm. Sustainability 12, 6735. doi:10.3390/su12176735
Hajihassani, M., Armaghani, D. J., Sohaei, H., Mohamad, E. T., and Marto, A. (2014). Prediction of airblast-overpressure induced by blasting using a hybrid artificial neural network and particle swarm optimization. Appl. Acoust. 80, 57–67. doi:10.1016/j.apacoust.2014.01.005
Hatanaka, M., Uchida, A., and Ohara, J. (1997). Liquefaction characteristics of a gravelly fill liquefied during the 1995 Hyogo-Ken Nanbu earthquake. Soils Found. 37, 107–115. doi:10.3208/sandf.37.3_107
Hu, J. (2021b). A new approach for constructing two Bayesian network models for predicting the liquefaction of gravelly soil. Comput. Geotechnics 137, 104304. doi:10.1016/j.compgeo.2021.104304
Hu, J. (2021a). Data cleaning and feature selection for gravelly soil liquefaction. Soil Dyn. Earthq. Eng. 145, 106711. doi:10.1016/j.soildyn.2021.106711
Javadi, A. A., Rezania, M., and Nezhad, M. M. (2006). Evaluation of liquefaction induced lateral displacements using genetic programming. Comput. Geotechnics 33, 222–233. doi:10.1016/j.compgeo.2006.05.001
Kang, F., Li, J., and Zhou, H. (2014). “Artificial neural network model for evaluating gravelly soils liquefaction using shear wave velocity,” in International efforts in lifeline earthquake engineering, 608–615.
Landwehr, N., Hall, M., and Frank, E. (2005). Logistic model trees. Mach. Learn. 59, 161–205. doi:10.1007/s10994-005-0466-3
Lee, J. H., and Ahn, C. K. (2019). Stochastic relaxation of nonlinear soil moisture ocean salinity (SMOS) soil moisture retrieval errors with maximal Lyapunov exponent optimization. Nonlinear Dyn. 95, 653–667. doi:10.1007/s11071-018-4588-0
Li, N., Zare, M., Yi, C., and Jimenez, R. (2022). Stability risk assessment of underground rock pillars using logistic model trees. Int. J. Environ. Res. public health 19, 2136. doi:10.3390/ijerph19042136
Lim, T.-S., Loh, W.-Y., and Shih, Y.-S. (2000). A comparison of prediction accuracy, complexity, and training time of thirty-three old and new classification algorithms. Mach. Learn. 40, 203–228. doi:10.1023/a:1007608224229
Lin, P.-S., Chang, C.-W., and Chang, W.-J. (2004). Characterization of liquefaction resistance in gravelly soil: Large hammer penetration test and shear wave velocity approach. Soil Dyn. Earthq. Eng. 24, 675–687. doi:10.1016/j.soildyn.2004.06.010
Mikaeil, R., Haghshenas, S. S., and Hoseinie, S. H. (2018a). Rock penetrability classification using artificial bee colony (ABC) algorithm and self-organizing map. Geotechnical Geol. Eng. 36, 1309–1318. doi:10.1007/s10706-017-0394-6
Mikaeil, R., Haghshenas, S. S., Ozcelik, Y., and Gharehgheshlagh, H. H. (2018b). Performance evaluation of adaptive neuro-fuzzy inference system and group method of data handling-type neural network for estimating wear rate of diamond wire saw. Geotechnical Geol. Eng. 36, 3779–3791. doi:10.1007/s10706-018-0571-2
Mohamed, W. N. H. W., Salleh, M. N. M., and Omar, A. H. (2012). “A comparative study of reduced error pruning method in decision tree algorithms,” in Proceedings of 2012 IEEE International conference on control system, computing and engineering, 392–397.
Momeni, E., Nazir, R., Armaghani, D. J., and Maizir, H. (2014). Prediction of pile bearing capacity using a hybrid genetic algorithm-based ANN. Measurement 57, 122–131. doi:10.1016/j.measurement.2014.08.007
Morosini, A. F., Haghshenas, S. S., Haghshenas, S. S., Choi, D. Y., and Geem, Z. W. (2021). Sensitivity analysis for performance evaluation of a real water distribution system by a pressure driven analysis approach and artificial intelligence method. Water 13, 1116. doi:10.3390/w13081116
Noori, A. M., Mikaeil, R., Mokhtarian, M., Haghshenas, S. S., and Foroughi, M. (2020). Feasibility of intelligent models for prediction of utilization factor of TBM. Geotechnical Geol. Eng. 38, 3125–3143. doi:10.1007/s10706-020-01213-9
Pham, B. T., Prakash, I., Singh, S. K., Shirzadi, A., Shahabi, H., Bui, D. T., et al. (2019). Landslide susceptibility modeling using Reduced Error Pruning Trees and different ensemble techniques: Hybrid machine learning approaches. Catena 175, 203–218. doi:10.1016/j.catena.2018.12.018
Quinlan, J. R. (1992). “Learning with continuous classes,” in Proceedings of 5th Australian joint conference on artificial intelligence, 343–348.
Quinlan, J. R. (1987). Simplifying decision trees. Int. J. man-machine Stud. 27, 221–234. doi:10.1016/s0020-7373(87)80053-6
Quinlan, R. 4.5 (1993). Programs for machine learning morgan. San Francisco, USA: kaufmann publishers inc.
Shahabi, H., Ahmad, B., and Khezri, S. (2013). Evaluation and comparison of bivariate and multivariate statistical methods for landslide susceptibility mapping (case study: Zab basin). Arabian J. geosciences 6, 3885–3907. doi:10.1007/s12517-012-0650-2
Sharma, C., and Ojha, C. (2020). “Statistical parameters of hydrometeorological variables: Standard deviation, SNR, skewness and kurtosis,” in Advances in water Resources engineering and management (Springer), 59–70.
Sirovich, L. (1996). Repetitive liquefaction at a gravelly site and liquefaction in overconsolidated sands. Soils Found. 36, 23–34. doi:10.3208/sandf.36.4_23
Srinivasan, D. B., and Mekala, P. (2014). “Mining social networking data for classification using reptree,” in International journal of advance research in computer science and management studies, 2.
Sun, L., and Schulz, K. (2015). The improvement of land cover classification by thermal remote sensing. Remote Sens. 7, 8368–8390. doi:10.3390/rs70708368
van Vuren, T. (2018). Modeling of transport demand–analyzing, calculating, and forecasting transport demand: By VA profillidis and GN botzoris. Amsterdam: Elsevier, 472. $125 (paperback and ebook), eBook ISBN: 9780128115145, Paperback ISBN: 9780128115138. Taylor & Francis: 2020.
Wang, Y., and Wang, Y.-L. (2017). Liquefaction characteristics of gravelly soil under cyclic loading with constant strain amplitude by experimental and numerical investigations. Soil Dyn. Earthq. Eng. 92, 388–396. doi:10.1016/j.soildyn.2016.10.029
Witten, I., Frank, E., and Hall, M. (2011). Data mining: Practical machine learning tools and techniques 3 edition. San Francisco: Morgan Kaufmann.
Xie, C., Nguyen, H., Choi, Y., and Armaghani, D. J. (2022). Optimized functional linked neural network for predicting diaphragm wall deflection induced by braced excavations in clays. Geosci. Front. 13, 101313. doi:10.1016/j.gsf.2021.101313
Yan, T., Shen, S.-L., and Zhou, A. (2022). Identification of geological characteristics from construction parameters during shield tunnelling. Acta Geotech. 18, 535–551. doi:10.1007/s11440-022-01590-w
Yegian, M., Ghahraman, V., and Harutiunyan, R. (1994). Liquefaction and embankment failure case histories, 1988 Armenia earthquake. J. geotechnical Eng. 120, 581–596. doi:10.1061/(asce)0733-9410(1994)120:3(581)
Youd, T., Harp, E., Keefer, D., and Wilson, R. (1985). The Borah peak, Idaho earthquake of october 28, 1983—liquefaction. Earthq. spectra 2, 71–89. doi:10.1193/1.1585303
Keywords: gravelly soil, liquefaction, reduced error pruning tree, random forest, dynamic penetration test, logistic model tree, random tree
Citation: Ahmad M, Alsulami BT, Hakamy A, Majdi A, Alqurashi M, Sabri Sabri MM, Al-Mansob RA and Bin Ibrahim MR (2023) The performance comparison of the decision tree models on the prediction of seismic gravelly soil liquefaction potential based on dynamic penetration test. Front. Earth Sci. 11:1105610. doi: 10.3389/feart.2023.1105610
Received: 22 November 2022; Accepted: 13 July 2023;
Published: 21 July 2023.
Edited by:
Zefa Yang, Central South University, ChinaCopyright © 2023 Ahmad, Alsulami, Hakamy, Majdi, Alqurashi, Sabri Sabri, Al-Mansob and Bin Ibrahim. This is an open-access article distributed under the terms of the Creative Commons Attribution License (CC BY). The use, distribution or reproduction in other forums is permitted, provided the original author(s) and the copyright owner(s) are credited and that the original publication in this journal is cited, in accordance with accepted academic practice. No use, distribution or reproduction is permitted which does not comply with these terms.
*Correspondence: Mahmood Ahmad, YWhtYWRtQHVldHBlc2hhd2FyLmVkdS5waw==