 Dawei Tang
 Weipeng Ge
 Xiyu Cao1
- 1Lanzhou Institute of Seismology, China Earthquake Administration, Lanzhou, China
- 2Gansu Lanzhou National Geophysical Observation and Research Station, Lanzhou, China
It remains unknown how stress triggering causes earthquakes in the eastern Tibetan Plateau following the Wenchuan Earthquake in 2008. The MS 6.1 Lushan earthquake on 1 June 2022 in a seismic gap between the 2008 MW 7.9 Wenchuan earthquake and the 2013 MW 6.6 Lushan earthquake provided an opportunity to detect stress evolution and seismic activity on the fault in this study. We calculated the Coulomb stress change of the June 2022 Lushan–Maerkang earthquake sequence using a Burgers viscoelastic model and, herein, discuss how the sequence have been triggered by historical earthquakes since 1900 in the eastern Tibetan Plateau. Our results suggest the following trends: 1) the 1955 M 7.6 Kangding and 2008 MW 7.9 Wenchuan earthquakes contributed most significant loading effects on the 2022 MS 6.1 Lushan earthquake; however, the 2013 MW 6.6 Lushan earthquake had an unloading effect on the 2022 Lushan earthquake. 2) The 2021 MW 7.3 Maduo earthquake contributed a loading effect on the 2022 Lushan earthquake, and the 2022 Lushan earthquake may have triggered the subsequent Maerkang earthquake swarm on 10 June 2022. 3) Viscoelastic relaxation of the lower crust and upper mantle contributed significantly to fault stress level, while a fault in a late-phase earthquake cycle may have ruptured via slight stress perturbation near a cross-border conversion between positive and negative stress from a far-field earthquake. We also provide a seismic potential assessment along the faults in the eastern Tibet. Notably, the MW 6.8 Luding earthquake that ruptured the southern segment of the Xianshuihe Fault on 5 September 2022 supports the conclusions of this study.
1 Introduction
An MS 6.1 earthquake occurred on 1 June 2022, in Lushan County, China. The earthquake hypocenter corresponds to an epicenter of 30.37°N, 102.94°E and a depth of 17 km, according to the China Earthquake Network Center (CENC). Other institutions provided similar, but varying, results (Table 1); for example, the United States Geological Survey (USGS) indicated an epicenter of 30.395°N, 102.958°E, with a moment magnitude of MW 5.8 and a source depth of 12.0 km, and the Global Centroid Moment Tensor (GCMT) provided an epicenter of 30.35°N, 103.08°E, with a moment magnitude of MW 5.8 and a source depth of 21.6 km.
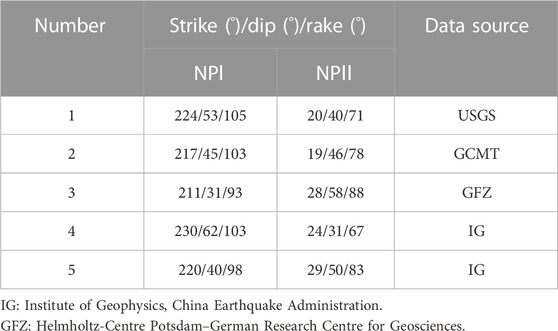
TABLE 1. Focal mechanisms of the 2022 MS 6.1 Lushan earthquake given by various research institutions.
The Lushan MS 6.1 earthquake in 2022 occurred along the southern segment of the Longmenshan Fault between the Songpan–Ganzi Terrane and the Sichuan Basin (Figure 1) (Royden et al., 1997; Royden et al., 2008; Zhang et al., 2003; Zhang, 2013; Hubbard and Shaw, 2009; Burchfiel et al., 1995; Clark et al., 2005; Medvedev and Beaumont, 2006; Rui and Stamps, 2016; Densmore et al., 2007; Hu et al., 2012; Luo and Liu, 2018; Chen et al., 2000; Deng et al., 2003). Before the 2008 MW 7.9 Wenchuan earthquake, the Longmenshan fault zone was in a moderately inactive state due to a slow slip rate (Wang et al., 2010; Burchfiel et al., 2008; Gan et al., 2007; Ma et al., 2005; Wang et al., 2008). However, postseismic deformation after the Wenchuan earthquake became relatively complicated (Huang et al., 2014; Diao et al., 2019; Wang et al., 2021). The 2013 MW 6.6 Lushan earthquake occurred in the southwest section of the rupture (Jiang et al., 2014). Moreover, the 2022 MS 6.1 Lushan earthquake occurred in the seismic gap between the 2013 MW 6.6 Lushan earthquake and the 2008 MW 7.9 Wenchuan earthquake (Chen et al., 2013; Gao et al., 2014). Therefore, the successive occurrence of these three earthquakes has attracted interest in the scientific community.
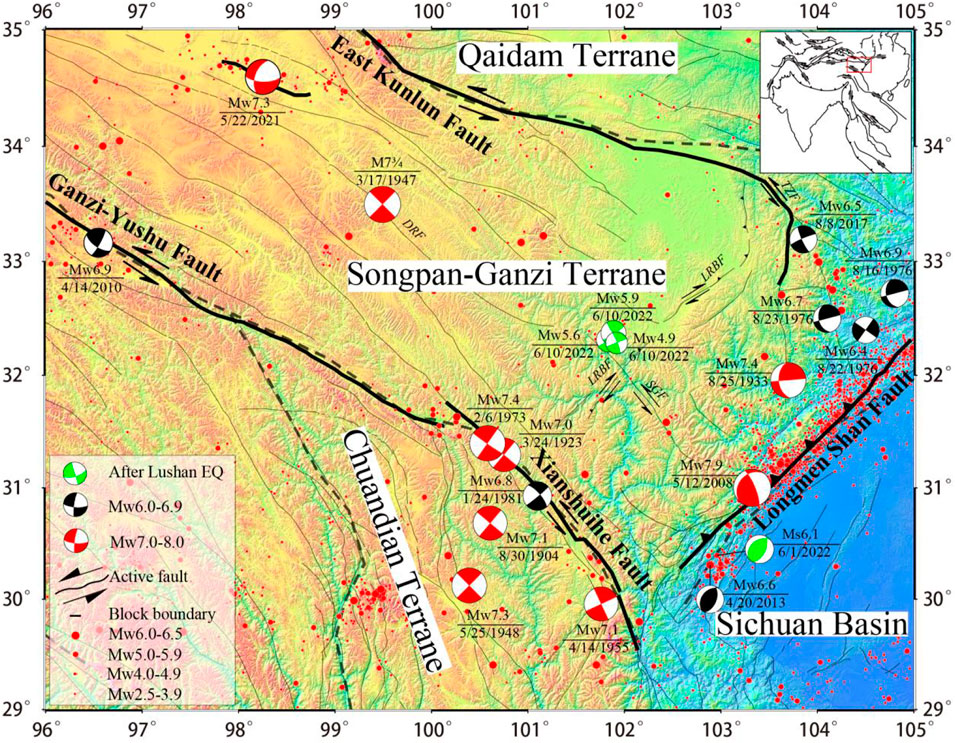
FIGURE 1. Tectonic map of the eastern Tibetan Plateau, southern Qaidam Terrane, Songpan–Ganzi Terrane, northern Chuandian Terrane, and western Sichuan Basin, showing the topography, active faults, and earthquake epicenters. Lower hemisphere diagrams of focal spheres show fault plane solutions from the USGS catalog from January 1904 to July 2022. The green beach balls indicate the 2022 MS 6.1 Lushan earthquake and the 2022 Maerkang earthquake swarm; the black beach balls indicate the MW 6.0–6.9 earthquakes; and the nine red beach balls indicate the 1904 MW 7.1 Daofu earthquake, the 1923 MW 7.0 Luhuo earthquake, the 1933 MW 7.4 Diexi earthquake, the 1947 M 7.75 Dari earthquake, the 1948 MW 7.3 Litang earthquake, the 1955 MW 7.1 Kangding earthquake, the 1973 MW 7.4 Luhuo earthquake, the 2008 MW 7.9 Wenchuan earthquake, and the 2021 MW 7.3 Maduo earthquake, respectively. The inset shows the tectonic setting of the Indo-Asian collision zone.
Previous studies have indicated that the 2013 Lushan earthquake was located in an area where the Coulomb stress change increased due to the 2008 Wenchuan earthquake and was triggered by that earthquake (Toda et al., 2008; Lei et al., 2013; Jia K et al., 2014; Liu et al., 2014; Wang et al., 2014; Xie et al., 2014; Zhu and Miao, 2015; Zhu, 2016; Lin et al., 2019). If a triggering correlation exists, it is unclear why the 2022 Lushan earthquake occurred 9 years later. The potential seismogenic trend of faults around the Longmenshan fault system is also in question. The Lushan earthquake and Maerkang earthquake swarm that occurred in June 2022 provided a significant opportunity to study the correlation of earthquake triggering. Therefore, we studied the stress triggering of the 2022 Lushan earthquake and the three subsequent Maerkang earthquakes from the events shown in Table 2. Herein, we discuss the subsequent seismic trend of surrounding faults and the triggering pattern of the Lushan–Maerkang earthquake sequence via historical earthquakes.
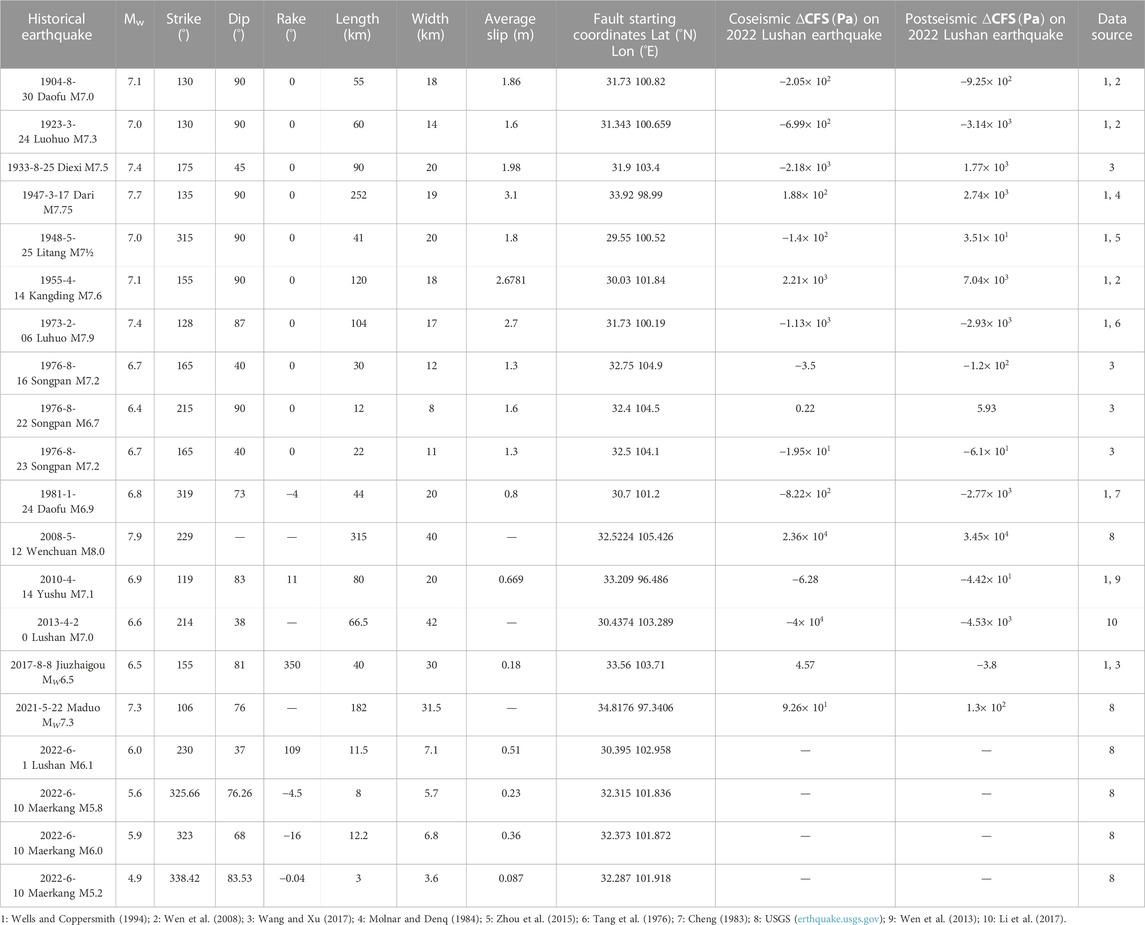
TABLE 2. Earthquake rupture parameters.
2 Data and method
2.1 Stratified viscoelastic model
We used a stratified viscoelastic model to simulate the Songpan–Ganzi Terrane, where earthquakes mainly occur along the Longmenshan Fault. The wave velocity and density structure of the crust and upper mantle were taken from Jia S et al. (2014) and Xu et al. (2010). We assumed that the thickness of the elastic layer of the crust was 30 km, and that the viscoelastic material was below that depth. The viscosity coefficient mainly refers to the rheological structural parameters of the lithosphere in eastern Tibet obtained by Wang et al. (2021) based on deformation simulation after the 2008 MW 7.9 Wenchuan earthquake, as shown in Table 3.
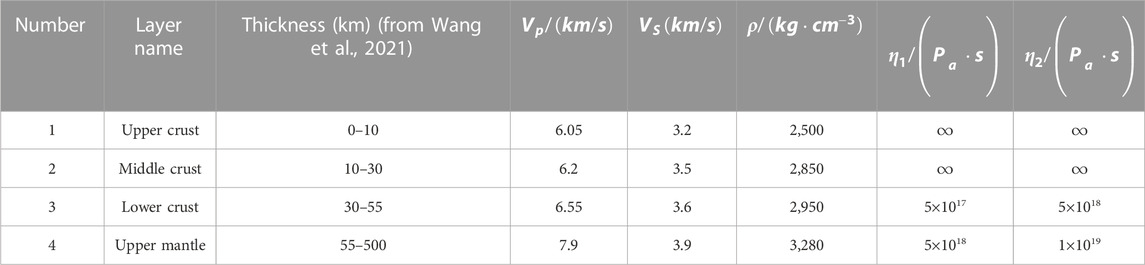
TABLE 3. Parameters of the crust and upper mantle.
The Maxwell body and Kelvin body in rheological structures have defects in fitting short-term and long-term deformation, respectively. Therefore, we chose the Burgers body, which is suitable for simulating transient elastic response, short-term exponential decay response, and long-term linear increase response (Pollitz and Wicks, 2001; Pollitz and Sacks, 2002; Shao et al., 2007). The constitutive relation (Malkin and Isayev, 2022) is as follows:
where
2.2 Method
The formula for calculating the Coulomb failure stress change on the fault plane is as follows (King et al., 1994; Harris, 1998):
where
2.3 Coseismic slip model
The stress field induced by an earthquake can be calculated using fault dislocation theory and the source fault slip model. The Coulomb stress change on the receiving fault plane can be obtained using Formula (1). In our study, we used two methods to obtain the slip model of the source fault: one method used the existing accurate slip distribution model of an earthquake, such as that of the 2021 MW 7.3 Maduo earthquake released by the USGS; in the second method, the empirical formula of the relationship between the fault length and magnitude was obtained using statistics (Wells and Coppersmith, 1994), the scalar seismic distance formula, and the moment magnitude definition formula (Knopoff, 1958; Hanks and Kanamori, 1979):
The thrust earthquake equations are as follows (coefficients are the average values):
The strike–slip earthquake equations are as follows (coefficients are the average values):
where RLD is the length of the fault along the strike direction, RW is the width of the fault along the dip direction, MW is the magnitude of the moment,
Afterslip on historical earthquake faults can affect some simulation results (Nur and Mavko, 1974). However, we did not consider the afterslip effect in the calculation; compared with the main earthquake, the contribution of afterslip is concentrated in the near field, and the stress change it causes is much smaller than the effect of the coseismic slip model (Shen et al., 2009; 2011; Wang et al., 2011).
3 Results
3.1 Triggering effect on Coulomb stress change in the 2022 Lushan earthquake
We calculated the coseismic and postseismic viscoelastic Coulomb stress change effects of historical earthquakes on the 2022 Lushan earthquake using the seismic rupture parameters, as shown in Table 2. We show the Coulomb stress change at a depth of 12 km, which is also the result of waveform fitting, and from the USGS. The focal mechanism parameter of the receiving fault is the result from the USGS in Table 1.
The postseismic shear stress change (
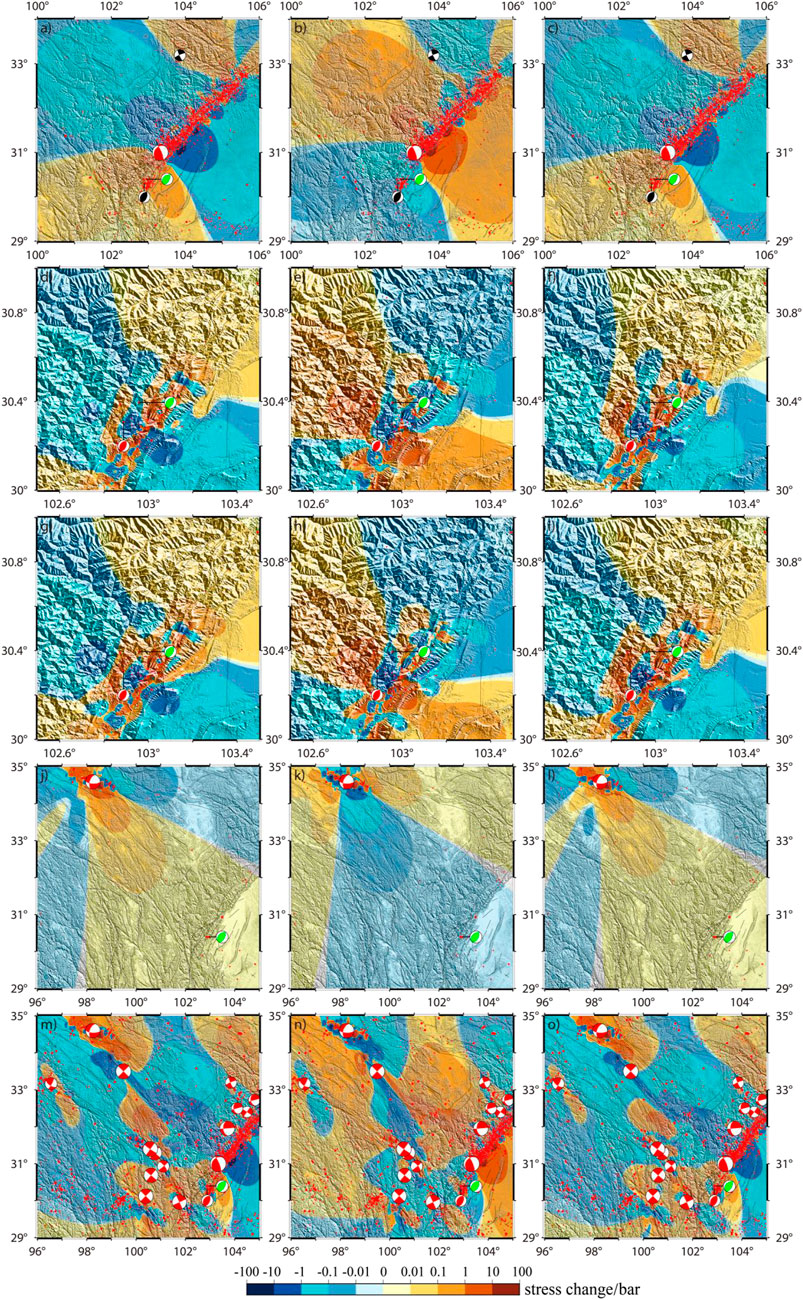
FIGURE 2. Contour map of Coulomb stress change in the 2022 Lushan earthquake. The red beach balls are the source events, the green beach balls are the receiving events, and the black beach balls are events between the source and receiving events. (A–C) Effects of postseismic shear stress change, normal stress change, and Coulomb stress change of the 2008 Wenchuan earthquake on the 2022 Lushan earthquake, respectively. (D–F) Same display (coseismic) as for effects of the 2013 Lushan earthquake on the 2022 Lushan earthquake. (G–I) Same display (postseismic) as for effects of the 2013 Lushan earthquake on the 2022 Lushan earthquake. (J–L) Same display (postseismic) as for effects of the 2021 Maduo earthquake on the 2022 Lushan earthquake. (M–O) Same display (postseismic) as for effects of historical earthquakes on the 2022 Lushan earthquake.
The hypocenter of the 2022 Lushan earthquake was near the cross-border conversion between positive and negative
The postseismic
Under the combined effects of historical earthquakes, the
Figure 3C shows the evolution of
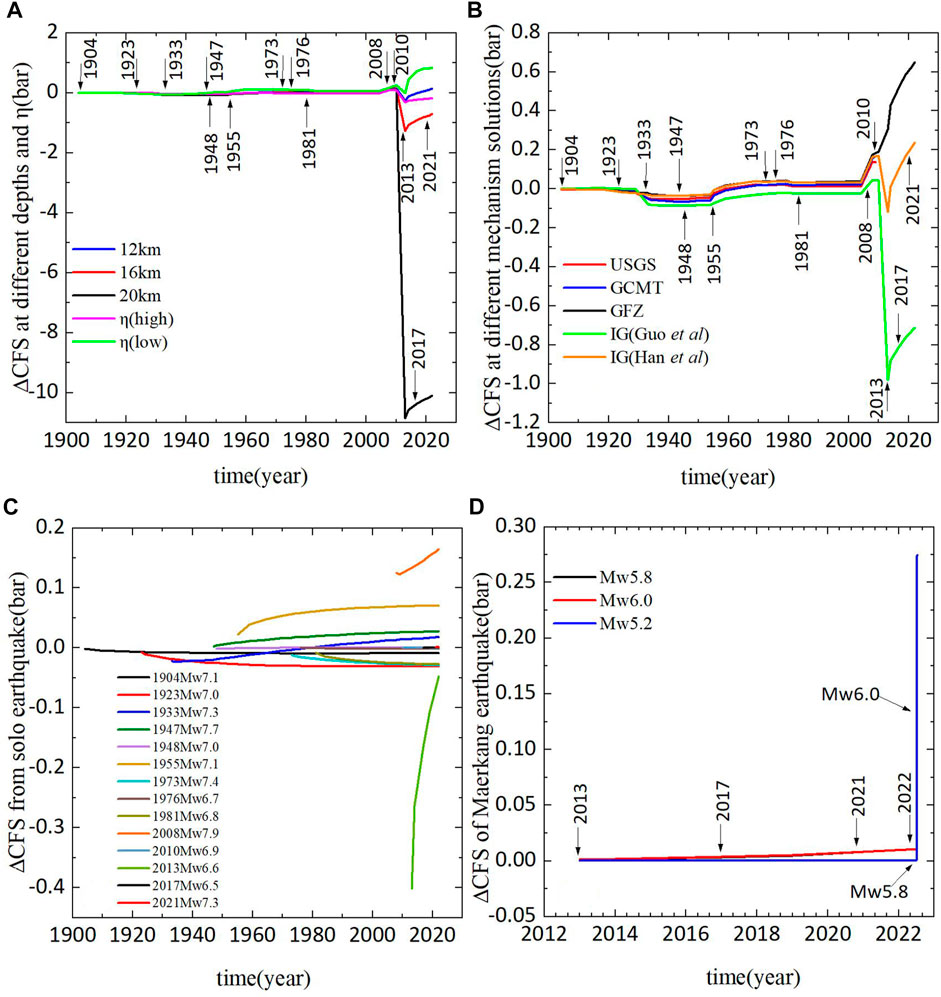
FIGURE 3. Trend of the viscoelastic ∆CFS over time. (A)
3.2 Triggering effect on Coulomb stress change in the Maerkang earthquakes
After the Lushan MS 6.1 earthquake on 1 June 2022, the MW 5.6 (MEK1), MW 5.9 (MEK2), and MW 4.9 (MEK3) earthquakes occurred within a few hours on 10 June 2022 in Maerkang County. The three successive earthquakes were very close in time and space. We studied the triggering effect on Coulomb stress change using the earthquake rupture parameters in Table 2.
We considered a stress change at a depth of 10 km, consistent with the hypocenter depth given by the USGS. The focal mechanism solutions of the three earthquakes in Maerkang were equivalent and similar, and these solutions can be regarded as a single event (MEK1) under the action of historical earthquakes.
The
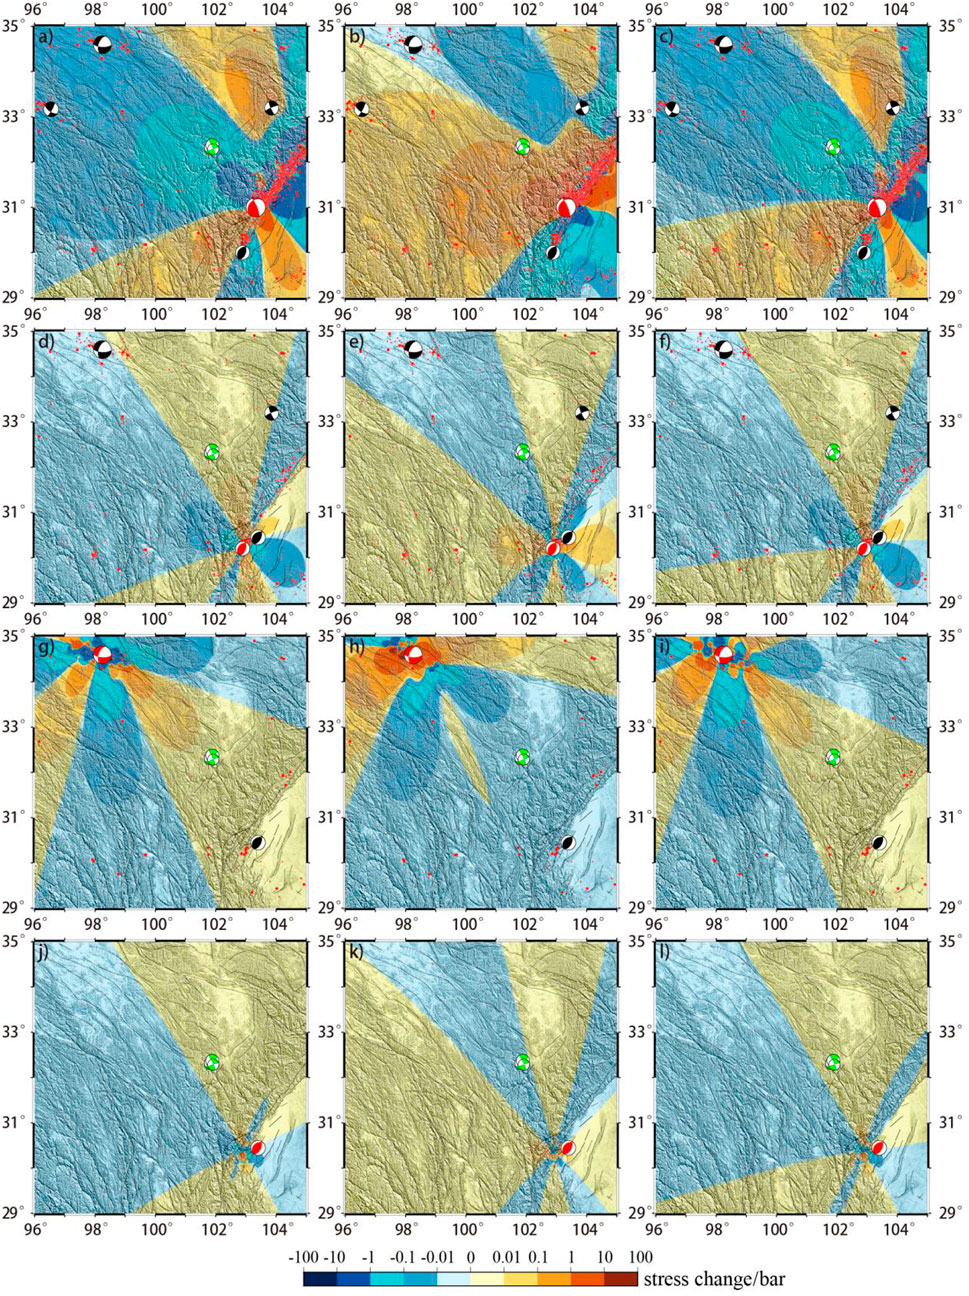
FIGURE 4. Contour map of Coulomb stress change in the 2022 Maerkang earthquakes. The red beach balls are source events, the green beach balls are receiving events, and the black beach balls are events between the source and receiving events. (A–C) Effects of the postseismic shear stress change, normal stress change, and Coulomb stress change of the 2008 Wenchuan earthquake on the 2022 Maerkang earthquakes. (D–F) Same display as for effects of the 2013 Lushan earthquake on the 2022 Maerkang earthquakes. (G–I): Same display as for effects of the 2021 Maduo earthquake on the 2022 Maerkang earthquakes. (J–L) Same display as for effects of the 2022 Lushan earthquake on the 2022 Maerkang earthquakes.
The hypocenter of MEK1 was near the cross-border conversion between positive and negative
The triggering effect of the 2022 Lushan earthquake was similar as shown in Figures 4J–L, the
According to Figure 5, the MEK2 was located in the
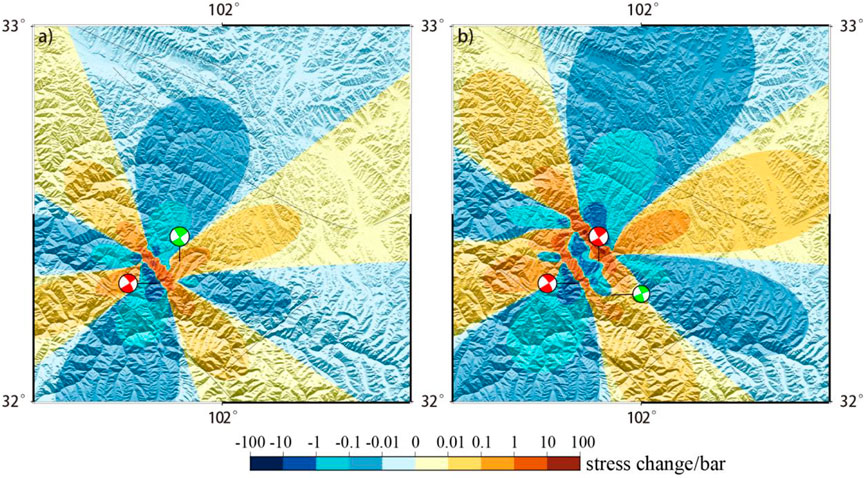
FIGURE 5. Contour map of the Coulomb stress change in the three successive Maerkang earthquakes in 2022. (A) Coseismic Coulomb stress change in the MW 5.6 Maerkang earthquake resulting from the MW 5.9 Maerkang earthquake. (B) Coseismic Coulomb stress change of the MW 4.9 Maerkang earthquake resulting from the MW 5.6 and MW 5.9 Maerkang earthquakes.
The hypocenter of the Lushan-Maerkang earthquake sequence seems to have been near the cross-border conversion between positive and negative stress change. It appears that the stress change at the hypocenter experienced a transform from negative to positive when the hypocenter finally became a starting point of rupture and the earthquake occurred. This phenomenon has been confirmed by Freed (2005), whose work showed that the hypocenter of the 1999 Hector Mine earthquake was very close to the border between positive and negative Coulomb stress change caused by the 1992 Landers earthquake. In addition, Xie et al. (2022) found that the hypocenter of the 2011 MS 9.0 Tokyo earthquake was located near the border between positive and negative normal stress change. We assumed that the positive and negative changes in stress were more likely to cause the rock at the hypocenter to plastically fail and thereby cause an earthquake.
4 Discussion
4.1 Effect of model viscosity parameters on the results
The viscosity of the lower crust and upper mantle in the Tibetan Plateau and its surrounding areas has been studied over the past two decades. Clark and Royden (2000) used the topographic gradient method to estimate the viscosity beneath the lower crust around the Tibetan Plateau and obtained approximate results of 1016∼1021 Pa s. Shao et al. (2011) considered the viscoelastic relaxation effect of the lower crust and upper mantle after the 2008 Wenchuan earthquake. They found that the best long-term viscosity coefficient of the lower crust and upper mantle in the Songpan–Ganzi Terrane was 5×10¹⁷ Pa s. Huang et al. (2014) used GPS and InSAR data to constrain the 1.5-year postseismic deformation of the 2008 Wenchuan earthquake and found that the long-term viscosity coefficient of the upper mantle of the Songpan–Ganzi Terrane was 1×10¹⁸ Pa s. Zhao et al. (2021) determined that the transient viscosity and steady viscosity of the lower crust and upper mantle in Tibet were 5×10¹⁸ Pa s and 4×10¹⁹ Pa s, respectively, through crustal deformation simulation after the 2001 Kekexili earthquake. Wei et al. (2020) estimated the viscosity range beneath the lower crust in the West Qinling–Songpan Terrane and its surrounding areas by a geomorphological analysis method and channel flow model, and the result was
We used the latest results from Wang et al. (2021) and tested the influence of two groups of viscosities (one order of magnitude lower and one order of magnitude higher) on the Coulomb stress change calculation results, as shown in Figures 6A–C. The
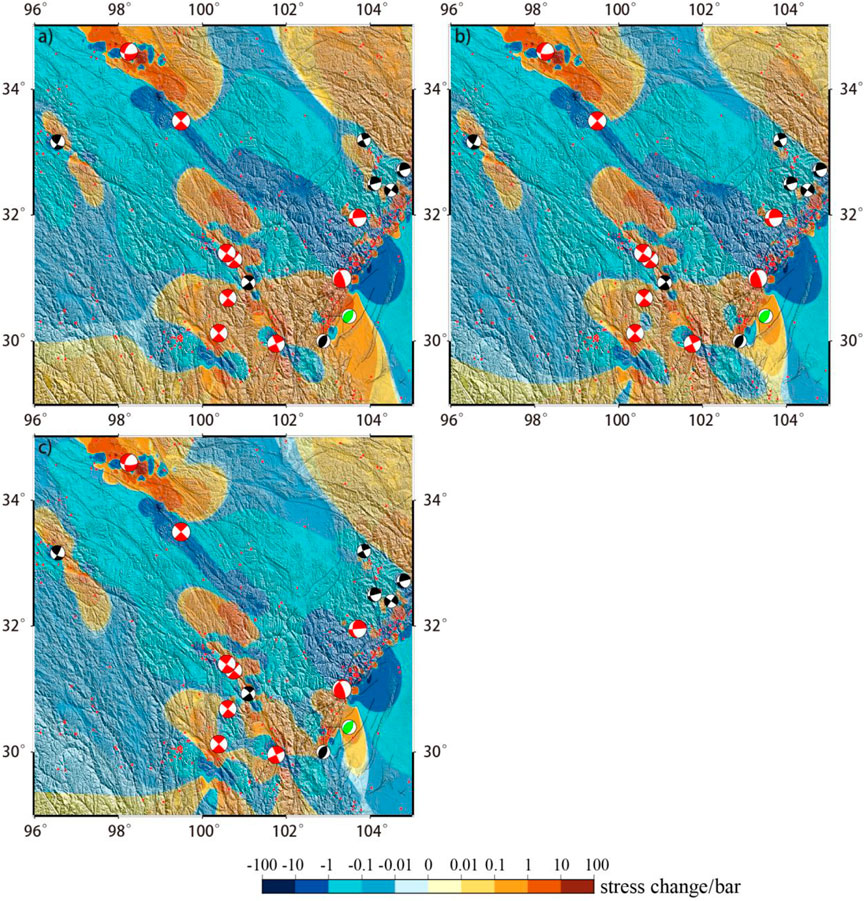
FIGURE 6. Impact of the viscosity coefficient, with low viscosity, normal viscosity, and high viscosity, on the Coulomb stress change contour map of the 2022 Lushan earthquake due to historical earthquakes. (A) Contour map of Coulomb stress change at low viscosity. (B) Contour map of Coulomb stress change at normal viscosity. (C) Contour map of Coulomb stress change at high viscosity.
4.2 Effect of the effective friction coefficient
The effective friction coefficient in Formula (2), involving the pore fluid and medium of the fault plane, is an uncertain parameter in Coulomb stress change calculations (King et al., 1994; Harris, 1998; Tang et al., 2023), and it is important to discuss the influence of its sensitivity on the results. King et al. (1994) proposed that the effective friction coefficients are generally 0.2–0.8. Shen (2003) showed that the effective friction coefficient of most faults can change only the relative magnitude of
To ensure the reliability of our results, we calculated the influence of the four groups of effective friction coefficients, i.e., 0.2, 0.4, 0.6, and 0.8, on the Coulomb stress change. As the effective friction coefficient increased from 0.2 to 0.8, the distribution range of Coulomb stress change in the 2022 Lushan earthquake area showed little variation (Figure 7). The
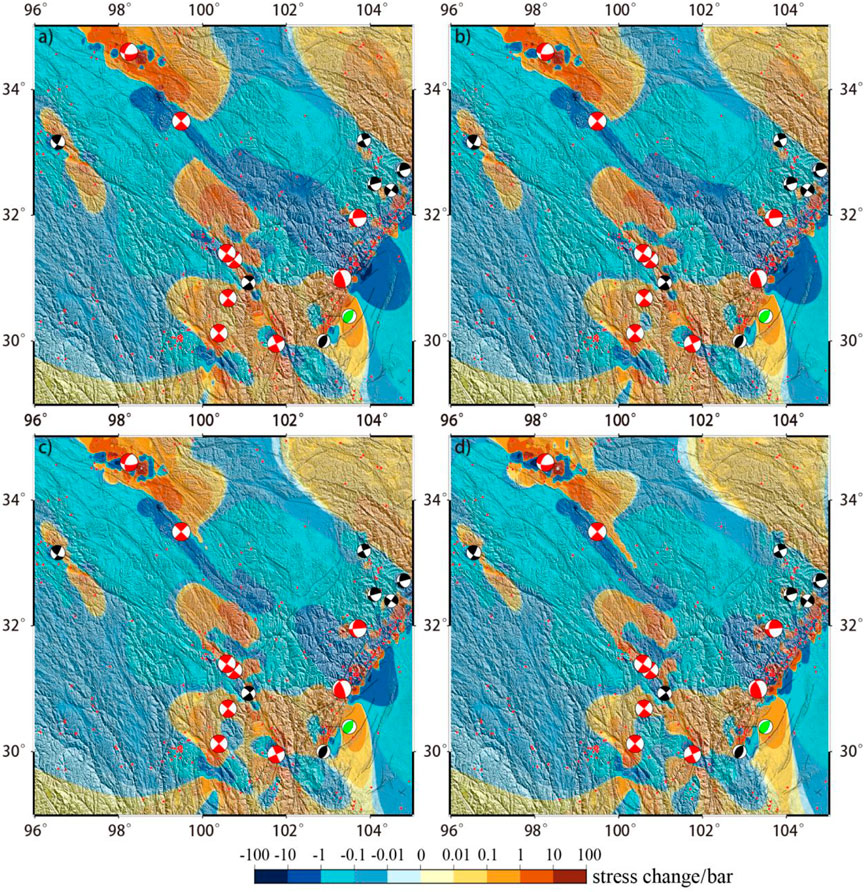
FIGURE 7. Impact of effective friction coefficients of 0.2, 0.4, 0.6, and 0.8 on the Coulomb stress change contour map of the Lushan earthquake in 2022 by historical earthquakes. (A–D) Contour maps of Coulomb stress change with effective friction coefficients of 0.2, 0.4, 0.6, and 0.8, respectively.
4.3 Effect of depth on the results
Previous studies focused on the triggering effect of Coulomb stress change between earthquakes with stress fields at the depth of the hypocenter (Freed and Lin, 2001; Cheng, 2018; Li et al., 2022; Stein, 1999). However, hypocenter depth is difficult to estimate. The USGS suggested two hypocenter depths of 12 km and 19.5 km for the 2022 MS 6.1 Lushan earthquake, and the GFZ and the CENC suggested hypocenter depths of 10 km and 17 km. respectively. For strike–slip faults, the change in the Coulomb stress field with depth is small (Wan et al., 2007), but the Longmenshan Fault is under oblique-strike motion. Thus, the contribution of the Coulomb stress change on fault planes with different depths is discussed in further detail here.
As shown in Figure 8, the
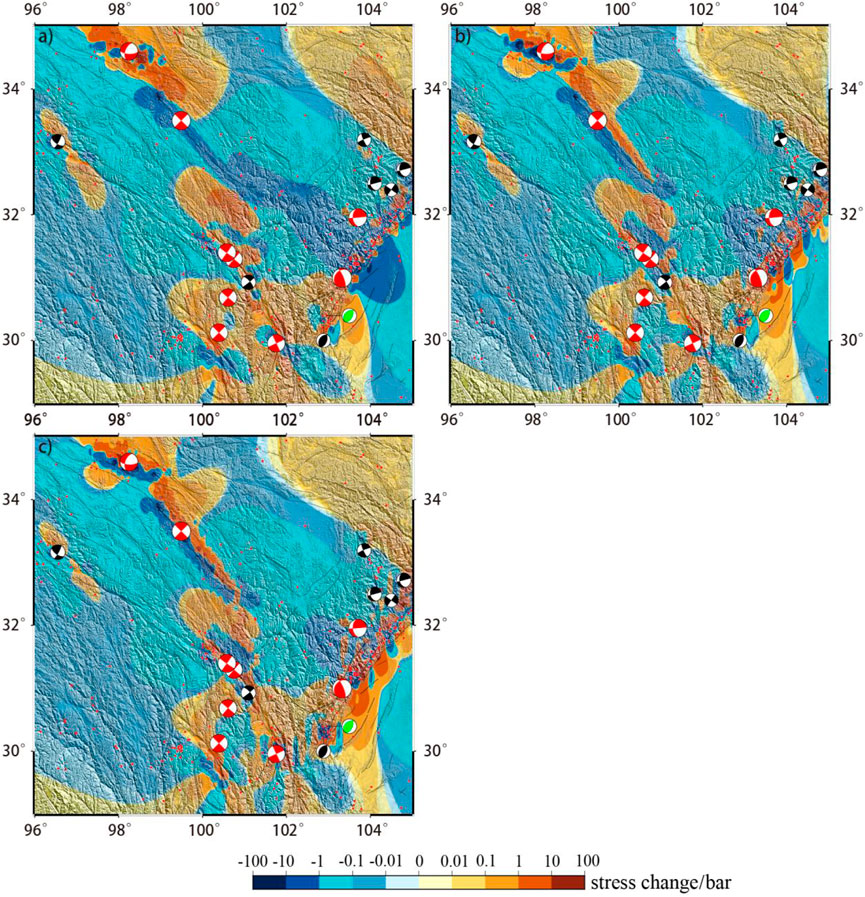
FIGURE 8. Impacts of historical earthquakes, at depths of 12 km, 16 km, and 20 km, on the Coulomb stress change contour map of the Lushan earthquake in 2022. (A) Contour map of Coulomb stress change at a depth of 12 km. (B) Contour map of Coulomb stress change at a depth of 16 km. (C) Contour map of Coulomb stress change at a depth of 20 km.
4.4 Effect of the focal mechanism solution of the receiving fault on the results
We evaluated focal mechanism solutions from the USGS. As shown in Figure 3B, the fluctuations in the curves of different focal mechanism solutions were similar. However, the effects of the 2013 Lushan earthquake on the 2022 Lushan earthquake using the GFZ solution were quite different from those of the other four groups. The large uncertainties in the strike and dip angle in the GFZ inversion results may be the source of the discrepancy. Therefore, the collection of focal mechanism solutions considered in our study greatly influenced the calculated results. We suggest that, when a similar calculation of fault stress change is carried out to study the interaction mechanism between strong earthquakes, focal mechanism solutions as similar as possible to actual earthquakes should be considered.
4.5 Influence of the Lushan–Maerkang earthquake sequence and historical earthquakes on the faults around the Songpan–Ganzi Terrane
We calculated the Coulomb stress change along the faults around the Songpan–Ganzi Terrane after the Lushan–Maerkang earthquake sequence in 2022. The fault slip data were from previous publications (Deng, 2007; Xu et al., 2016, https://www.activefault-datacenter.cn/map).
Figure 9 shows the Coulomb stress change induced by historical earthquakes on the faults in the Songpan–Ganzi Terrane at a depth of 10 km. The eastern section of the East Kunlun fault zone and the central section of the Longriba fault zone are in a continuous zone of high Coulomb stress change, which is consistent with the results of Cheng (1983) and Wang and Xu (2017). The western section of the Songgang Fault lies along an area in which
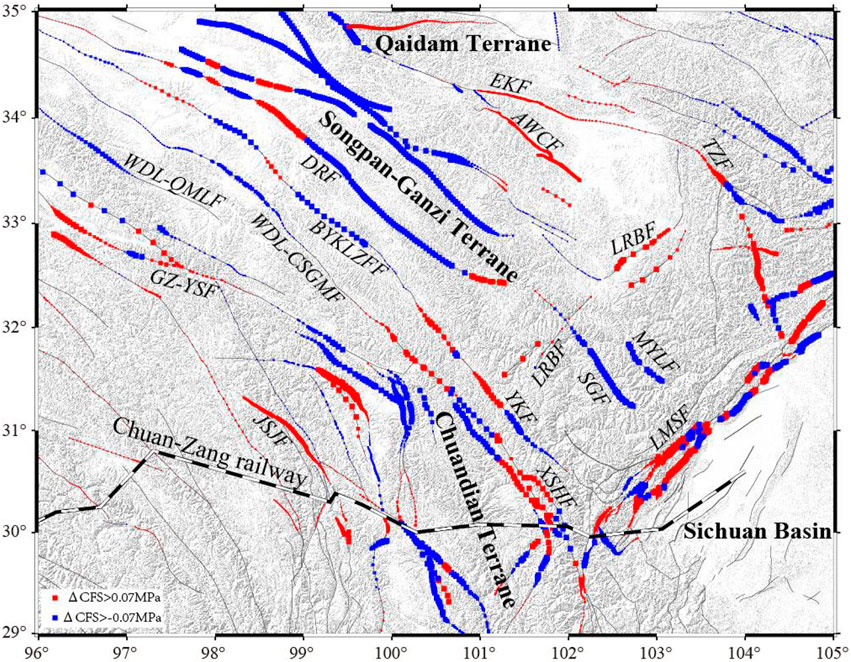
FIGURE 9. Contour map of the Coulomb stress change along faults around the Songpan–Ganzi Terrane effected by historical earthquakes. Abbreviations of major faults: East Kunlun Fault (EKF), Tazan Fault (TZF), Wancang Fault (AWCF), Dari Fault (DRF), Longba Fault (LRBF), Wudaoliang–Qumalai Fault (WDL-QMLF), Wudaoliang–Changshagongma Fault (WDL-CSGMF), Bayankalazhufeng Fault (BYKLZFF), Ganzi–Yushu Fault (GZ-YSF), Miyaluo Fault (MYLF), Songpan–Ganzi Fault (SGF), Jinshajiang Fault (JSJF), Yuke Fault (YKF), Xianshuihe Fault (XSHF), Longmenshan Fault (LMSF), Sichuan‒Tibet railway (Chuan-Zang railway).
Furthermore, the middle section of the Yuke Fault, the southern section of the Xianshuihe Fault, the eastern section of the Dari Fault, the Bayankala Fault, the Wudaoliang–Changshagongma Fault, and the Chuan–Zang railway are near areas in which the
5 Conclusion
We constructed a stratified viscoelastic model to simulate postseismic stress on the 2022 Lushan–Maerkang earthquake sequence from historical strong earthquake data in eastern Tibet. We further assessed the seismic potential of faults in eastern Tibet. Our conclusions are as follows.
(1) The 1955 M 7.6 Kangding and 2008 MW 7.9 Wenchuan earthquakes are the most significant loading events on the 2022 MS 6.1 Lushan earthquake. But, the 2013 MW 6.6 Lushan earthquake is the most significant unloading event. This is a potential explanation for the occurrence of the 2022 Lushan earthquake 9 years later. Effects of viscoelastic relaxation of the lower crust and upper mantle play a significant role in fault activity.
(2) The MW 5.6, MW 5.9, and MW 4.9 Maerkang earthquakes, which occurred after the 2022 Lushan earthquake, could have been due to both the 2013 and 2022 Lushan earthquakes. The 2021 Maduo earthquake had a loading effect on the 2022 Lushan earthquake, and the 2022 Lushan earthquake might have triggered the Maerkang earthquakes. Furthermore, the MW 5.6 Maerkang earthquake may have triggered the MW 5.9 Maerkang earthquake, and the MW 5.6 and MW 5.9 Maerkang earthquakes may have jointly triggered the MW 4.9 Maerkang earthquake.
(3) The tectonic stress of the Songpan–Ganzi Terrane has accumulated to a high level. The hypocenters of the 2022 Lushan–Maerkang earthquake sequence all occurred near the cross-border conversion between positive and negative stress change. Rupture of a fault in a late phase of the seismic cycle near the cross-border conversion between positive and negative stress change may have been induced by a slight stress disturbance from a far-field earthquake. Therefore, study of the the middle section of the Yuke Fault, the southern section of the Xianshuihe Fault (which has been confirmed by the 5 September 2022, MW 6.8 Luding earthquake), the eastern section of the Dari Fault, the Bayankala Fault, and the Wudaoliang–Changshagongma Fault should be emphasized in future research, as they all correspond to areas of cross-border conversion.
Data availability statement
The original contributions presented in the study are included in the article/Supplementary Material, and further inquiries can be directed to the corresponding author.
Author contributions
DT and WG conceived the study and wrote the manuscript. XC helped archive fault trace data. All authors discussed, commented on, and edited the manuscript.
Funding
This work was supported by projects funded by the National Key Research and Development Program of China, Ministry of Science and Technology of China (2017YFC1500102), the Second Tibetan Plateau Scientific Expedition and Research Program (STEP) (2019QZKK0901), the Seismic Spark Scientific program of China Earthquake Administration (XH18048), the Natural Science Foundation of Gansu Province, China (Grant No. 17JR5RA340), and the Basic Research Project of Institute of Earthquake Science, China Earthquake Administration (grant 2014IESLZ05).
Acknowledgments
The first author is very grateful to Liu Chengli (China University of Geosciences, Wuhan) for providing the coseismic slip distribution data from the Lushan earthquake in 2013 and all those who helped to complete the manuscript. The authors are grateful to Professor Wang Rongjiang for providing access to the PSGRN/PSCMP software (Wang et al., 2006). Some figures were plotted using the GMT software (Wessel and Smith, 1998).
Conflict of interest
The authors declare that the research was conducted in the absence of any commercial or financial relationships that could be construed as a potential conflict of interest.
Publisher’s note
All claims expressed in this article are solely those of the authors and do not necessarily represent those of their affiliated organizations, or those of the publisher, the editors, and the reviewers. Any product that may be evaluated in this article, or claim that may be made by its manufacturer, is not guaranteed or endorsed by the publisher.
References
Burchfiel, B. C., Royden, L. H., Hilst, R. D. V. D., Hager, B. H., Chen, Z., King, R. W., et al. (2008). A geological and geophysical context for the wenchuan earthquake of 12 may 2008, sichuan, people's Republic of China. Geol. Soc. Am. 18, 4. doi:10.1002/2013GC005067
Burchfiel, B. C., Zhiliang, C., Yupinc, L., and Royden, L. H. (1995). Tectonics of the Longmen Shan and adjacent regions, central China. Int. Geol. Rev. 37 (8), 661–735. doi:10.1080/00206819509465424
Chen, Y. T., Yang, Z. X., Zhang, Y., and Liu, C. (2013). From 2008 Wenchuan earthquake to 2013 Lushan earthquake (in Chinese). Sci. Sin. Terrae 43, 1064–1072. doi:10.1360/zd-2013-43-6-1064
Chen, Z., Burchfiel, B. C., Liu, Y., King, R. W., Royden, L. H., Tang, W., et al. (2000). Global Positioning System measurements from eastern Tibet and their implications for India/Eurasia intercontinental deformation. J. Geophys. Res. 105, 16215–16227. B7, 16, 215–16. doi:10.1029/2000JB900092
Cheng, Erlin. (1983). Source parameters of Daofu earthquake (Ms=6.9) sichuan province on january 24, 1981[J]. Chin. J. Geophys. (in Chinese) 26 (02), 140–148.
Cheng, J., Yao, S., Liu, J., Yao, Q., Gong, H., and Long, H. (2018). Visoelastic Coulomb stress of historical earthquakes on the 2017 Jiuzhaigou earthquake and the subsequent influence on the seismic hazards of adjacent faults. Chinese Journal of Geophysics (in Chinese) 61 (5), 2133–2151. doi:10.6038/cjg2018L0609
Clark, M. K., and Royden, L. H. (2000). Topographic ooze: Building the eastern margin of Tibet by lower crustal flow. Geology 28 (8), 703–706. doi:10.1130/0091-7613(2000)28<703:TOBTEM>2.0.CO;2
Clark, M. K., Bush, J. W., and Royden, L. H. (2005). Dynamic topography produced by lower crustal flow against rheological strength heterogeneities bordering the Tibetan Plateau. Geophysical Journal International 162 (2), 575–590. doi:10.1111/j.1365-246X.2005.02580.x
Deng, Qidong. (2007). China active tectonic map(1:40000000). Beijing: Seismological Press. ISBN:9787502830519.
Deng, Q., Zhang, P., Ran, Y., Yang, X., Min, W., and Chu, Q. (2003). Basic characteristics of active tectonics of China. Science in China Series D. Earth Sciences 46 (4), 356–372. doi:10.3321/j.issn:1006-9267.2002.12.007
Densmore, A. L., Ellis, M. A., Li, Y., Zhou, R., Hancock, G. S., and Richardson, N. (2007). Active tectonics of the Beichuan and Pengguan faults at the eastern margin of the Tibetan Plateau. Tectonics 26, TC4005. doi:10.1029/2006TC001987
Diao, F., Xiong, X., Wang, R., Walter, T. R., Wang, Y., and Wang, K. (2019). Slip rate variation along the Kunlun fault (Tibet): Results from new GPS observations and a viscoelastic earthquake-cycle deformation model. Geophysical Research Letters 46 (5), 2524–2533. doi:10.1029/2019GL081940
Freed, A. M., and Lin, J. (2001). Delayed triggering of the 1999 Hector Mine earthquake by viscoelastic stress transfer. Nature 411 (6834), 180–183. doi:10.1038/35075548
Freed, A. M. (2005). Earthquake triggering by static, dynamic, and postseismic stress transfer. Annual Review of Earth and Planetary Sciences 33 (1), 335–367. doi:10.1146/annurev.earth.33.092203.122505
Gan, W., Zhang, P., Shen, Z. K., Niu, Z., ang, M. W., an, Y. W., et al. (2007). Present-day crustal motion within the Tibetan Plateau inferred from GPS measurements. Geophys. Res. Solid Earth Planets 112, B08416. doi:10.1029/2005JB004120
Gao, Y., Wang, Q., Zhao, B., and Shi, Y. (2014). A rupture blank zone in middle south part of Longmenshan Faults: Effect after Lushan M s7.0 earthquake of 20 April 2013 in Sichuan, China. China. Science China Earth Sciences 57 (9), 2036–2044. doi:10.1007/s11430-014-4827-2
Hanks, T. C., and Kanamori, H. (1979). A moment magnitude scale. Journal of Geophysical Research Solid Earth 84 (5), 2348–2350. doi:10.1029/JB084iB05p02348)
Harris, R. A. (1998). Introduction to special section: Stress triggers, stress shadows, and implications for seismic hazard. Journal of Geophysical Research Solid Earth 103 (10), 24347–24358. doi:10.1029/98JB01576
Hu, Caibo, Cai, Y., and Wang, Z. (2012). Effects of large historical earthquakes, viscous relaxation, and tectonic loading on the 2008 Wenchuan earthquake. Journal of Geophysical Research 117, 6. doi:10.1029/2011jb009046
Huang, M. H., Bürgmann, R., and Freed, A. M. (2014). Probing the lithospheric rheology across the eastern margin of the Tibetan Plateau. Earth and Planetary Science Letters 396, 88–96. doi:10.1016/j.epsl.2014.04.003
Hubbard, J., and Shaw, J. H. (2009). Uplift of the longmen Shan and Tibetan plateau, and the 2008 wenchuan (M= 7.9) earthquake. Nature 458 (7235), 194–197. doi:10.1038/nature07837
Jia, K., Zhou, S., Zhuang, J., and Jiang, C. (2014). Possibility of the independence between the 2013 lushan earthquake and the 2008 wenchuan earthquake on longmen Shan fault, sichuan, China. Seismol. Res. Lett. 85, 60–67. doi:10.1785/0220130115
Jia S, S., Liu, B., Xu, Z., Liu, Z., Feng, S., Zhang, J., et al. (2014). The crustal structures of the central Longmenshan along and its margins as related to the seismotectonics of the 2008 Wenchuan Earthquake. Science China Earth Sciences 57 (4), 777–790. doi:10.1007/s11430-013-4744-9
Jiang, Z., Wang, M., Wang, Y., Wu, Y., Che, S., Shen, Z. K., et al. (2014). GPS constrained coseismic source and slip distribution of the 2013 Mw6. 6 Lushan, China, earthquake and its tectonic implications. Geophysical Research Letters 41 (2), 407–413. doi:10.1002/2013GL058812
King, G. C. P., Stein, R. S., and Lin, J. (1994). Static stress changes and the triggering of earthquakes[J]. Bulletin of the Seismological Society of America 84 (3), 935–953. doi:10.1016/0148-9062(95)94484-2
Knopoff, L. (1958). Energy release in earthquakes. Geophysical Journal International, 1(1): 44–52. doi:10.1111/j.1365-246x.1958.tb00033.x
Lei, X. L., Ma, S. L., Su, J. R., and Wang, X. L. (2013). Inelastic triggering of the 2013 M W 6.6 Lushan earthquake by the 2008 M W 7.9 Wenchuan earthquake. Seismology and Geology 35 (2), 411–422. doi:10.3969/j.issn.0253-4967.2013.02.019
Li, J., Liu, C., Zheng, Y., and Xiong, X. (2017). Rupture process of the Ms 7.0 Lushan earthquake determined by joint inversion of local static GPS records, strong motion data, and teleseismograms. Journal of Earth Science 28 (2), 404–410. doi:10.1007/s12583-017-0757-1
Li, Y., Shao, Z., Hu, X., Shi, F., Liu, H., and Chen, L. W. (2022). Stress and strain characteristics in the seismic region of the M6.1 Nakchu earthquake on March 19, 2021 and their geodynamic implications. Chinese Journal of Geophysics (in Chinese) 65 (2), 673–685. doi:10.6038/cjg2022P026912
Lin, X., Chu, R., and Zeng, X. (2019). Rupture processes and Coulomb stress changes of the 2017 Mw 6.5 Jiuzhaigou and 2013 Mw 6.6 Lushan earthquakes. Earth, Planets and Space 71 (1), 81–15. doi:10.1186/s40623-019-1061-3
Liu, M., Luo, G., and Wang, H. (2014). The 2013 Lushan earthquake in China tests hazard assessments. Seismological Research Letters 85 (1), 40–43. doi:10.1785/0220130117
Luo, G., and Liu, M. (2018). Stressing rates and seismicity on the major faults in eastern Tibetan Plateau. Journal of Geophysical Research Solid Earth 123 (12), 10. doi:10.1029/2018JB015532
Ma, B., Su, G., Hou, Z., and Su, S. B. (2005). Late quaternary slip rate in the central part of the Longmenshan fault zone from terrace deformation along the Minjiang River. Seismol. Geol. 27, 234–242. doi:10.3969/j.issn.0253-4967.2005.02.006
Malkin, A. Y., and Isayev, A. I. (2022). Rheology: Concepts, methods, and applications. Netherlands: Elsevier. doi:10.1007/978-1-4612-1428-1_7
Medvedev, S., and Beaumont, C. (2006). Growth of continental plateaus by channel injection: Models designed to address constraints and thermomechanical consistency. Geological Society, London, Special Publications 268 (1), 147–164. doi:10.1144/GSL.SP.2006.268.01.06
Molnar, P., and Denq, Q. (1984). Faulting associated with large earthquakes and the average rate of deformation in central and eastern Asia. John Wiley and Sons, Ltd 89 (7), 6203–6227. doi:10.1029/JB089iB07p06203)
Nur, A., and Mavko, G. (1974). Postseismic viscoelastic rebound. Science 183 (4121), 204–206. doi:10.1126/science.183.4121.204
Pollitz, F. F., and Wicks, C. (2001). Mantle flow beneath a continental strike-slip fault: Postseismic deformation after the 1999 hector mine earthquake. science 293 (5536), 1814–1818. doi:10.1126/science.1061361
Pollitz, F. F., and Sacks, I. S. (2002). Stress triggering of the 1999 Hector Mine earthquake by transient deformation following the 1992 Landers earthquake. Bulletin of the Seismological Society of America 92 (4), 1487–1496. doi:10.1785/0120000918
Royden, L. H., Burchfiel, B. C., King, R. W., Wang, E., Chen, Z., Shen, F., et al. (1997). Surface deformation and lower crustal flow in eastern Tibet. science 276 (5313), 788–790. doi:10.1126/science.276.5313.788
Royden, L. H., Burchfiel, B. C., and van der Hilst, R. D. (2008). The geological evolution of the Tibetan Plateau. science 321 (5892), 1054–1058. doi:10.1126/science.1155371
Rui, X., and Stamps, D. S. (2016). Present-day kinematics of the eastern Tibetan Plateau and Sichuan Basin: Implications for lower crustal rheology. Journal of Geophysical Research Solid Earth 121 (5), 3846–3866. doi:10.1002/2016JB012839
Ryder, I., Bürgmann, R., and Pollitz, F. (2011). Lower crustal relaxation beneath the Tibetan Plateau and Qaidam basin following the 2001 kokoxili earthquake. Geophysical Journal International 187 (2), 613–630. doi:10.1111/j.1365-246X.2011.05179.x
Shao, Z., Fu, R., Xue, T., and Huang, J. (2007). Simulating postseismic viscoelastic deformation based on Burgers model. Journal of Geodesy and Geodynamics (05), 31–37. doi:10.3969/j.issn.1671-5942.2007.05.007
Shao, Z., Wang, R., Wu, Y., and Zhang, L. (2011). Rapid afterslip and short-term viscoelastic relaxation following the 2008 MW7. 9 Wenchuan earthquake. Earthquake Science 24 (2), 163–175. doi:10.1007/s11589-010-0781-z
Shen, Z. (2003). Viscoelastic triggering among large earthquakes along the East Kunlun fault system[J]. Chinese Journal of Geophysics (in Chinese) 46 (6), 786–795. doi:10.3321/j.issn:0001-5733.2003.06.010
Shen, Z. K., Sun, J., Zhang, P., Wan, Y., Wang, M., Bürgmann, R., et al. (2009). Slip maxima at fault junctions and rupturing of barriers during the 2008 Wenchuan earthquake. Nature geoscience 2 (10), 718–724. doi:10.1038/NGEO636
Shen, Z., Wang, F., Wang, M., Wan, Y., Zhang, P., Sun, J., et al. (2011). Postseismic deformation of the 2008 Mw 7.9 Wenchuan earthquake and its tectonic implications. AGU Fall Meeting Abstracts 2011, T31E–T07.
Stein, R. S. (1999). The role of stress transfer in earthquake occurrence. Nature 402 (6762), 605–609. doi:10.1038/45144
Tang, D., Ge, W., Yuan, D., Zheng, W., and Hu, C. (2023). Triggering effect of historical earthquakes in the northern Tibetan Plateau on the Coulomb stress of the 2022 Menyuan MS6.9 earthquake and subsequent earthquakes. Chinese Journal of Geophysics. (in Chinese). doi:10.6038/cjg2023Q0400
Tang, R., Wen, D., Deng, T., and Huang, S. (1976). A preliminary study on the characteristics of the ground fractures during the Luhuo M=7.9 earthquake, 1973 and the origin of the earthquake[J]. Chinese Journal of Geophysics (in Chinese) 19 (01), 18–27.
Toda, S., Lin, J., Meghraoui, M., and Stein, R. S. (2008). 12 May 2008 M= 7.9 Wenchuan, China, earthquake calculated to increase failure stress and seismicity rate on three major fault systems. Geophysical Research Letters 35 (17), L17305. doi:10.1029/2008gl034903
Wan, Y., Shen, Z., Zeng, Y., and Sheng, S. (2007). Evolution of cumulative failure stress in Northern Qinghai-Xizang (Tibetan) plateau and its effect on large earthquake occurrence. Acta Seismol Sinica (02), 115–129. doi:10.3321/j.issn:0253-3782.2007.02.001
Wang, H., Liu, M., Shen, X., and Liu, J. (2010). Balance of seismic moment in the songpan-ganze region, eastern Tibet: Implications for the 2008 great wenchuan earthquake. Tectonophysics 491 (1-4), 154–164. doi:10.1016/j.tecto.2009.09.022
Wang, J-J., and Xu, C-J. (2017). Coseismic Coulomb stress changes associated with the 2017 MW6.5 Jiuzhaigou earthquake (China) and its impacts on surrounding major faults. Chinese Journal of Geophysics (in Chinese) 60 (11), 4398–4420. doi:10.6038/cjg20171127
Wang, M., Shen, Z. K., Wang, Y. Z., Bürgmann, R., Wang, F., Zhang, P. Z., et al. (2021). Postseismic deformation of the 2008 Wenchuan earthquake illuminates lithospheric rheological structure and dynamics of eastern Tibet. Journal of Geophysical Research Solid Earth 126 (9), e2021JB022399. doi:10.1029/2021JB022399
Wang, Q., Qiao, X., Lan, Q., Freymueller, J, Shaomin, Y., Caijun, X., et al. (2011). Rupture of deep faults in the 2008 Wenchuan earthquake and uplift of the Longmen Shan. Nature Geoscience 4 (9), 634–640. doi:10.1038/ngeo1210
Wang, R., Lorenzo-Martin, F., and Roth, F. (2006). PSGRN/PSCMP—A new code for calculating co-and post-seismic deformation, geoid and gravity changes based on the viscoelastic-gravitational dislocation theory. Computers and Geosciences 32 (4), 527–541. doi:10.1016/j.cageo.2005.08.006
Wang, Y., Wang, E., Shen, Z., Wang, M., Gan, W., Qiao, X., et al. (2008). GPS-constrained inversion of present-day slip rates along major faults of the Sichuan-Yunnan region, China. Science in China Series D Earth Sciences 51 (9), 1267–1283. doi:10.1007/s11430-008-0106-4
Wang, Y., Wang, F., Wang, M., Shen, Z. K., and Wan, Y. (2014). Coulomb stress change and evolution induced by the 2008 Wenchuan earthquake and its delayed triggering of the 2013 Mw 6.6 Lushan earthquake. Seismological Research Letters 85 (1), 52–59. doi:10.1785/0220130111
Wei, C., Ge, W., and Zhang, B. (2020). Estimating the lower crustal viscosity of the Western Qilian-Songpan Tectonic Node and its adjacent areas by using landform morphology. Seismology and Geology 42 (1), 163. doi:10.3969/j.issn.0253-4967.2020.01.011
Wells, D. L., and Coppersmith, K. J. (1994). New empirical relationships among magnitude, rupture length, rupture width, rupture area, and surface displacement. Bulletin of the seismological Society of America 84 (4), 974–1002. doi:10.1785/BSSA0840040974
Wen, X. Z., Ma, S. L., Xu, X. W., and He, Y. N. (2008). Historical pattern and behavior of earthquake ruptures along the eastern boundary of the Sichuan-Yunnan faulted-block, southwestern China. Physics of the Earth and Planetary Interiors 168 (1-2), 16–36. doi:10.1016/j.pepi.2008.04.013
Wen, Y., Xu, C., Liu, Y., Jiang, G., and He, P. (2013). Coseismic slip in the 2010 Yushu earthquake (China), constrained by wide-swath and strip-map InSAR. Natural Hazards and Earth System Sciences 13 (1), 35–44. doi:10.5194/nhess-13-35-2013
Wessel, P., and Smith, W. H. F. (1998). New, improved version of generic mapping tools released. Eos. Transactions American Geophysical Union 79 (47), 579. doi:10.1029/98eo00426
Xie, Chao-Di, Xing-Lin, L., Wu, X-P., Hu, X-L., Zhao, Xiao-Yan, and Zhu, R-H. (2014). The effect on the nucleation and failure of MS7.0 Lushan earthquake induced by the MS8.0 Wenchuan earthquake. Chinese Journal of Geophysics (in Chinese) 57 (6), 1825–1835. doi:10.6038/cjg20140614
Xie, Z., Cai, Y., Yoshioka, S., and Abe, D. (2022). Exploring the location of large earthquakes using fault stress accumulation—a case study upon M W 9.0 tohoku-oki earthquake in Japan. Chinese Journal of Geophysics (1), 1–11. doi:10.6038/cjg2022P0727
Xu, X. W., Han, Z. J., Yang, X. P., Zhang, S., Yu, G., Zhou, B., et al. (2016). Seismotectonic map in China and its adjacent regions. Beijing: Seismological Press.
Xu, Y., Li, Z., Huang, R., and Xu, Y. (2010). Seismic structure of the Longmen Shan region from S-wave tomography and its relationship with the Wenchuan Ms 8.0 earthquake on 12 May 2008, southwestern China. Geophysical Research Letters 37 (2). doi:10.1029/2009GL041835
Zhang, P. Z. (2013). A review on active tectonics and deep crustal processes of the Western Sichuan region, eastern margin of the Tibetan Plateau. Tectonophysics 584, 7–22. doi:10.1016/j.tecto.2012.02.021
Zhang, P. Z., Deng, Q. D., Zhang, G. M., Ma, J., Gan, W. J., Min, W., et al. (2003). Strong earthquake activity and active land mass in mainland China. Scientia Sinica (Terrae) S 1, 12–20. doi:10.3321/j.issn:1006-9267.2003.z1.002
Zhao, D., Qu, C., Bürgmann, R., Gong, W., and Shan, X. (2021). Relaxation of Tibetan lower crust and afterslip driven by the 2001 Mw7. 8 Kokoxili, China, earthquake constrained by a decade of geodetic measurements. Journal of Geophysical Research Solid Earth 126 (4), e2020JB021314. doi:10.1029/2020JB021314
Zhou, C., Wu, Z., Zhang, K., Li, J., Jiang, Y ., Tian, T., et al. (2015). New chronological constraint on the co-seimic surface rupture segments associated with the Litang Fault. Seismology and Geology 37 (2), 455. doi:10.3969/j.issn.0253-4967.2015.02.009
Zhu, S. (2016). Is the 2013 Lushan earthquake (Mw= 6.6) a strong aftershock of the 2008Wenchuan, China mainshock (Mw= 7.9)? Journal of Geodynamics 99, 16–26. doi:10.1016/j.jog.2016.05.002
Keywords: eastern Tibetan Plateau, the MS 6.1 Lushan earthquake, historical earthquakes since 1900, Coulomb stress trigger, positive and negative cross-border stress conversion
Citation: Tang D, Ge W and Cao X (2023) Stress triggering of the 2022 Lushan–Maerkang earthquake sequence by historical events and its implication for fault stress evolution in eastern Tibet. Front. Earth Sci. 11:1105394. doi: 10.3389/feart.2023.1105394
Received: 22 November 2022; Accepted: 06 February 2023;
Published: 01 March 2023.
Edited by:
Gang Luo, Wuhan University, ChinaReviewed by:
Shoubiao Zhu, Ministry of Emergency Management of the People’s Republic of China, ChinaCaibo Hu, University of Chinese Academy of Sciences, China
Yujiang Li, Ministry of Emergency Management, China
Copyright © 2023 Tang, Ge and Cao. This is an open-access article distributed under the terms of the Creative Commons Attribution License (CC BY). The use, distribution or reproduction in other forums is permitted, provided the original author(s) and the copyright owner(s) are credited and that the original publication in this journal is cited, in accordance with accepted academic practice. No use, distribution or reproduction is permitted which does not comply with these terms.
*Correspondence: Weipeng Ge, Z2V3ZWlwZW5nQGdtYWlsLmNvbQ==