 Bowei Guo
 Fusheng Yu
 Hui Li1,2
95% of researchers rate our articles as excellent or good
Learn more about the work of our research integrity team to safeguard the quality of each article we publish.
Find out more
ORIGINAL RESEARCH article
Front. Earth Sci. , 20 March 2023
Sec. Structural Geology and Tectonics
Volume 11 - 2023 | https://doi.org/10.3389/feart.2023.1103827
This article is part of the Research Topic Basins and Related Tectonics View all 11 articles
The study of changes in normal fault systems during different rift stages is important to understand the genesis and evolution of multi-phase rift basins, such as the Panyu 4 Sag in the Zhu Ⅰ Depression. Using 2D and 3D seismic data and analogue modelling, the Zhu Ⅰ Depression was characterized as a series of half-grabens bounded by NE-NEE-trending normal faults, it was found to have undergone two phases of the extension during the Paleogene. The Zhu Ⅰ Depression exhibited four fault sets with different strikes, including NNE, NE-NEE, EW, and NWW. The main controlling faults were NE-trending and EW-trending with high activity rates during Rift Phase 1 and Rift Phase 2, respectively. The average azimuths of the dominant strikes for type Ⅰa, type Ⅰb, and type Ⅱ faults were 75°, 85°, and 90°, which revealed that the minimum principal stress (σ3) directions during the rift phases 1 and 2 of the Zhu Ⅰ Depression were SSE (∼165°) and near-EW (∼180°), respectively. Two phases of structural-sedimentary evolution, with different directions and analogue modelling results, illustrated that the Panyu 4 Sag was formed as a superimposed basin under multi-phase anisotropic extension. The structural evolution of the Panyu 4 Sag since the Paleogene was mainly controlled by the combined effects of the Pacific, Eurasian, and Indian plates. Since the orientation of subduction of the Pacific plate changed from NNW to NWW, the stress field shifted from NW-SE-trending tension to S-N-trending tension, causing the superimposition of late near-E-W-oriented structural pattern on the early NE-oriented structural pattern.
The evolution of rift basins can be generally divided into the syn-rift subsidence stage, which is controlled by faults, and the post-rift thermal subsidence stage (McKenzie, 1978; Ziegler and Cloetingh, 2004). The syn-rift subsidence stage of rift basins is usually a multi-level and multi-phase stage (Ravnas and Steel, 1998; Morley et al., 2004; Henstra et al., 2015; Deng et al., 2017). Many rift basins have developed through multi-phase extension comprising two or more rift phases, which are separated by a period of tectonic quiescence (Deng et al., 2017), Such as the North Sea Basin (Whipp et al., 2014), the Songkhla Basin, Thailand (Morley et al., 2004), the East African Rift Valley (Korme et al., 2004), the Dampier Basin, Australia (Frankowicz and McClay, 2010), the Bohai Bay Basin (Zhu et al., 2014), the Sichuan Basin (Ma et al., 2022), the Pearl River Mouth Basin (Ge et al., 2017) and the Jianghan Basin (Huang and Hinnov, 2014), China, etc. Multi-phase rifts, which respond to plate or regional tectonic events, are the main controlling factor in the formation of regional multi-cycle sedimentary sequences (McKenzie, 1978; Morley et al., 2004). The extension direction of rift basins usually changes during different rift periods. The fault geometries and kinematics are produced by multiple trends and various interaction styles within these basins (Ma et al., 2020).
The Pearl River Mouth Basin (PRMB) is located at the northern continental margin of the South China Sea (SCS) and is a rift basin that developed on top of the Mesozoic fold basement (Yu, 1990; Zhou et al., 1995; Wu et al., 2001; Chen, 2003; Zhu et al., 2008; Xie et al., 2014). The PRMB has undergone a complex evolutionary process owing to the combined effects of the Indian, Eurasian, and Pacific plates (Zhong et al., 2014). The collision between Eurasia and India and the subduction of the Pacific under the Eurasian plates during the Mesozoic era led to the development of a series of pre-existing structures, which laid the foundation for the formation and development of the basin. The Zhu Ⅰ Depression is an important hydrocarbon-rich unit within the PRMB. The structural evolution of the basin controls hydrocarbon accumulation and reflects the evolution of the SCS (Pigott and Ru, 1994; Zhou et al., 1995; Yao et al., 2005; Shi, 2013; Liu et al., 2019).
The dynamics and evolution of the PRMB are still debated due to the combined influences of the Pacific, Indian, and Eurasian plates during the Cenozoic era. Regarding the dynamics, some scholars consider it to be a rift basin that was controlled by a series of NE-NEE-trending and EW-trending faults (Zhong et al., 2014). However, other researchers consider it to be a pull-apart basin, whose initial formation phase was controlled by strike-slip and pull-apart motions (Cheng et al., 2012; Suo et al., 2014). In terms of its evolution, the PRMB demonstrates obvious characteristics of three-phase rifting (Jiao et al., 1997; Lv et al., 2012; Neng et al., 2013; Wu et al., 2014). However, consensus about the age of each rift stage is lacking, with the representative views being as follows. Some authors proposed that the PRMB mainly underwent the first rifting stage from the Paleocene to the middle Eocene, the second rifting stage from the late Eocene to the early Oligocene, and the third rifting stage during the late Oligocene. Neng et al. (2013) proposed that the PRMB underwent three main stages of rifting evolution. These included the initial rifting stage from the Paleocene to the early Eocene, the early rifting stage during the middle Eocene, and the thermal rifting stage from the late Eocene to the late Oligocene. On the other hand, Wu et al. (2014) suggested a slightly different framework for the rifting evolution of the basin. They identified three stages as well, but with some variation in their timing and nomenclature. These stages included the first rifting stage from the Paleocene to the early Eocene, the second rifting stage during the middle Eocene, and the third rifting stage from the late Eocene to the early Oligocene. These views suggested that the PRMB experienced multi-phase rifting from the Eocene to the early Oligocene.
To improve our understanding of the evolution of the PRMB, we conducted seismic interpretation and analogue modelling to elucidate the structural evolution process of the Zhu Ⅰ Depression in this work, taking the Panyu 4 Sag in the Zhu Ⅰ Depression as an example. Firstly, we described the geological background of the studied area based on existing literature. Secondly, we studied the distribution and evolution of faults and sedimentation according to seismic interpretation and structural-sedimentary features of different units of the Wenchang Formation. Thirdly, we carried out analogue modelling to illustrate the formation of two-phase rifting to better constrain the evolution of the internal sub-structural units of the Panyu 4 Sag. Finally, a model for the formation of the Panyu 4 Sag was proposed to elucidate the structural evolution of the Zhu Ⅰ Depression.
The PRMB is a rift basin that formed from the Mesozoic to the Cenozoic eras. The basin is bounded by a series of NE-NEE trending faults (Chen and Pei, 1993; Robinson et al., 1998; Franke et al., 2014; Jiang et al., 2015; Guo et al., 2022). The pre-existing NEE-trending uplifts and faults divide the basin into the present structural framework of three uplift zones and two depression zones (Li, 1993; Chen et al., 2003; Shi et al., 2012; Zhong et al., 2014; Figure 1A), which are the Northern Uplifted Belt, the Northern Depression Zone (including Zhu Ⅰ Depression and Zhu Ⅲ Depression), the Central Uplifted Belt (including Shenhu Uplift, Panyu Uplift, and Dongsha Uplift), the Southern Depression Zone (consisting of Zhu Ⅱ Depression and Chaoshan Depression), and the Southern Uplifted Belt (Li, 1994; Robinson et al., 1998; Chen, 2000; Zhang et al., 2004; Sun et al., 2010; Leyla et al., 2015).
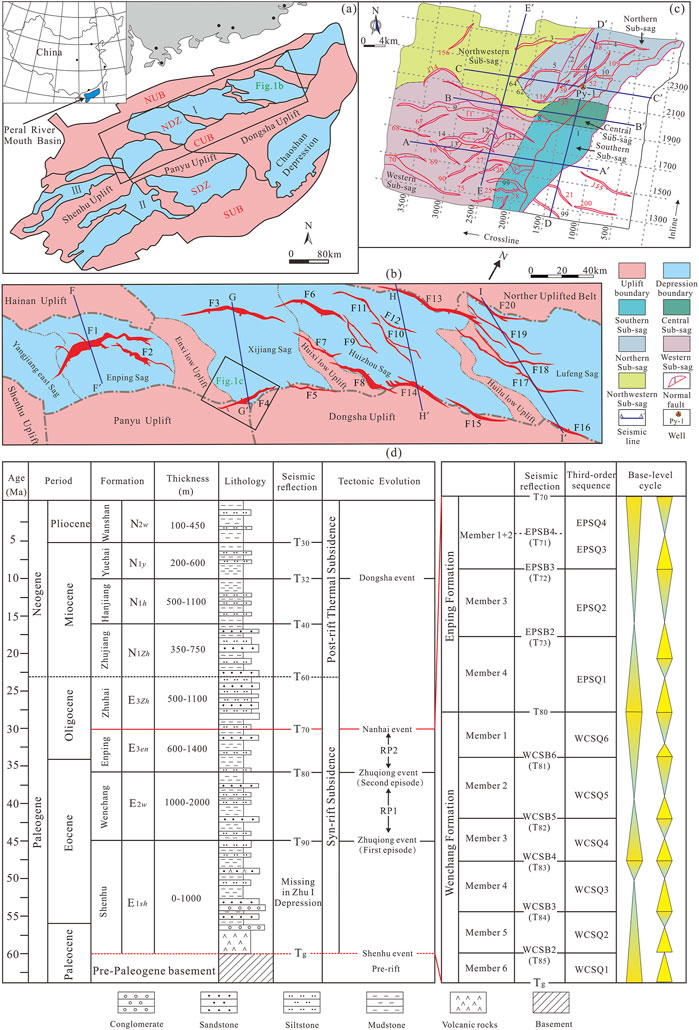
FIGURE 1. (A) Location and structural units of the Pearl River Mouth Basin, South China Sea, NUB - Northern Uplift Belt, NDZ - Northern Depression Zone, CUB- Central Uplift Belt, SDZ- Southern Depression Zone, SUB - Southern Uplift Belt, Ⅰ - Zhu Ⅰ Depression, Ⅱ- Zhu Ⅱ Depression, Ⅲ - Zhu Ⅲ Depression (Liu et al., 2019); (B) The structural units and major faults of the top of the basement in the Zhu Ⅰ Depression (Hu, 2019); (C) The structural units and major faults of the Panyu 4 Sag; (D) Tectonostratigraphic evolution of the Pearl River Mouth Basin (modified after Chen and Zhang, 1991; Zhang et al., 2003; Zhu et al., 2008).
Five typical unconformities relating to the seismic surfaces represented the Shenhu, the First episode of Zhuqiong, and the Second episode of Zhuqiong, Nanhai, and Dongsha events, respectively. (Zhong et al., 2014; Ge et al., 2017; Figure 1A). The Shenhu (undeveloped in the study area), Wenchang (E2w), and Enping (E2en) formations were developed in the syn-rift stage which was affected by the Shenhu, First episode of Zhuqiong and Second episode of Zhuqiong tectonic events (Figure 1D).
The Zhu Ⅰ Depression is a sub-unit on the northern side of the PRMB. It has a NE-SW orientation and covers an area of approximately 38,000 km2, with the Central Uplift Belt to its south, the Zhu Ⅲ Depression to its west, and the Northern Uplift Belt to its north (Figure 1A). The Zhu Ⅰ Depression can divide into five sags, namely, Enping Sag, Xijiang Sag, Huizhou Sag, Lufeng Sag, and Hanjiang Sag from west to east, with four low uplifts - Enxi, Huixi, Huilu, and Haifeng low uplifts, separating them from each other (Zhong et al., 2014). The Zhu I Depression underwent only two rift phases from the middle Eocene to the early Oligocene since the Shenhu event did not occur in this area (Ding et al., 2015). These two rift phases resulted in the creation of the Wenchang and Enping Formations. Therefore, two rift phases were named after “Rift Phase 1 (RP1)” and “Rift Phase 2 (RP2), respectively (Ma et al., 2020; Figure 1D).
The Xijiang south Sag (Panyu 4 Sag), which has similar structure and evolution characteristics to the Zhu Ⅰ Depression, is a sub-unit on the south-central side of the Zhu Ⅰ Depression (Figure 1C). The tectonic location and multi-phase structural evolution have resulted in complex internal structure, and the unit has undergone multi-phase erosion. To the east of the boundary faults, the sequence was terminated by the overlying interface on the west side during the early stage. To the north of the boundary faults, the sequence was terminated by the overlying interface on the south side during the late stage. The Panyu 4 Sag could be subdivided into five secondary negative structural units, namely, Northern, Central, Southern, Western, and Northwestern Sub-sags (Figures 1C, 5). Therefore, the study of the Panyu 4 Sag could well reflect the internal structure and evolution characteristics of the Zhu Ⅰ Depression.
Two-dimensional (2D) and three-dimensional (3D) seismic data were utilized to describe the geometries and kinematics of rift-related faults, including boundary faults and secondary faults. The seismic data, provided by Shenzhen Company of CNOOC, had high dominant frequency and consisted of two parts. The first part was the seismic data of the entire Zhu I Depression (Figure 1B; Figure 2, 3), which was used to explain the geometries of faults and the transformation of the stress field during different rift periods. The second part was the local data volume of the Panyu 4 Sag, which was used to analyze the fault evolution during different periods. Seismic data interpretation and fault throw curves were conducted along the fault strike in the main fault zone of the Panyu 4 Sag.
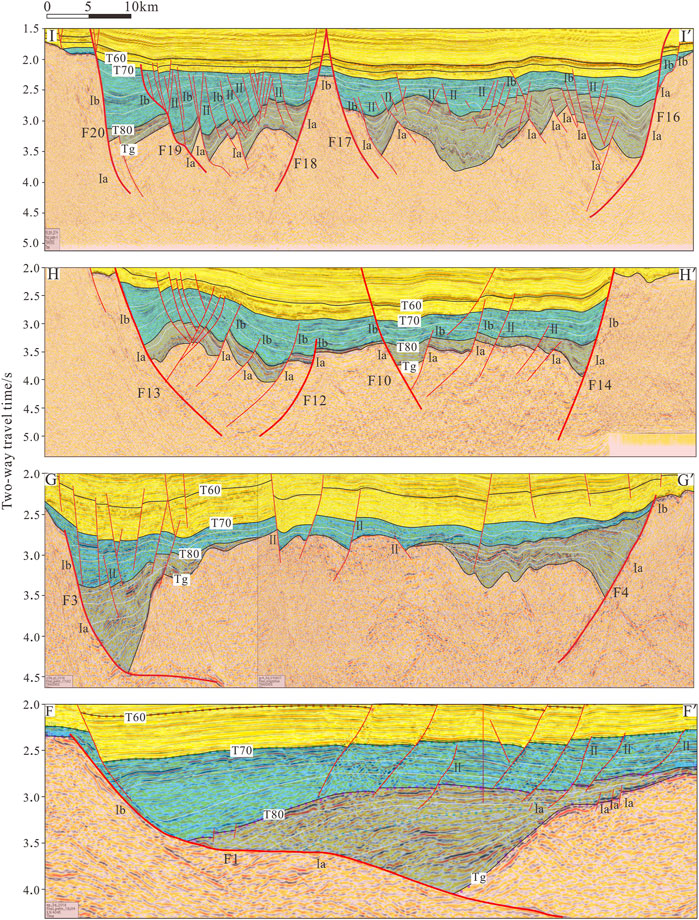
FIGURE 2. Typical seismic profiles of fault system in the Zhu Ⅰ Depression (for section locations, see Figure 1B).
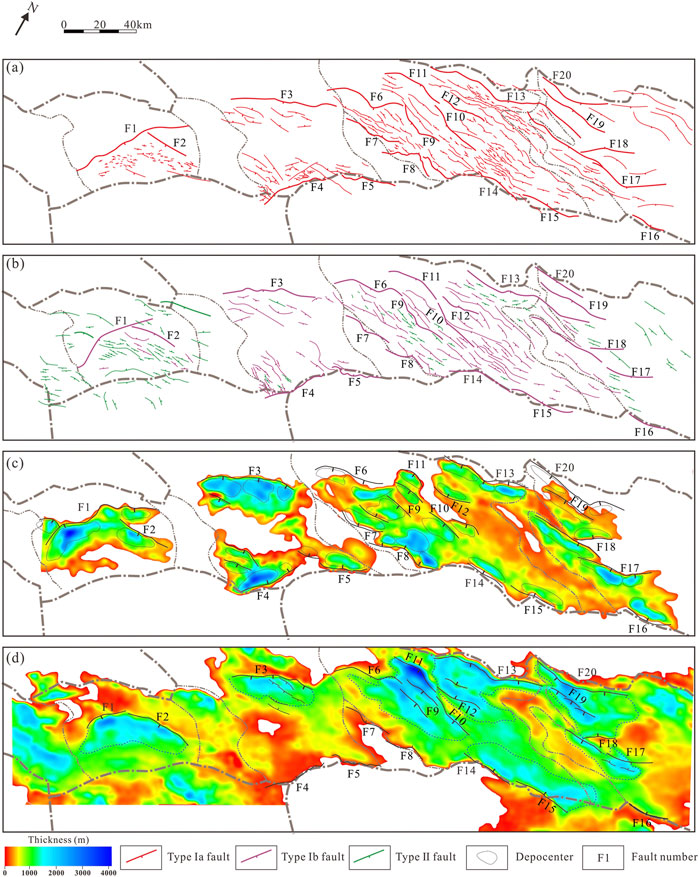
FIGURE 3. (A) The distribution of faults during the RP1; (B) The distribution of faults during the RP2; (C) The sedimentary thickness during the RP1; (D) The sedimentary thickness during the RP2.
In this work, several regional unconformities (Tg, T80 and T70) were identified based on the strata terminations and seismic reflections, separating the pre-rift, RP1, and RP2 periods. In addition, combining drill well data, some unconformity surfaces (T85, T84, T83, T82, T81 from bottom to top) were identified within the RP1 in the Panyu 4 Sag. These unconformity surfaces, together with regional unconformity surfaces (Tg and T80), divided the Wenchang Formation into six members (Members six to one from bottom to top (Figure 8A) in the Eocene rift period. Interpreted horizons were demarcated by synthetic seismograms, which were consistent with stratigraphy, and had the same names (Figure 1D).
Different types of faults were identified based on seismic data, including twenty major faults (F1-F20) representing the boundary faults or interior major faults of the RP1 and RP2 periods in the whole Zhu Ⅰ Depression (The RP1 and the RP2; Figures 1B, 2, 3). The relationship between different types of faults was analyzed by interpreting four NW-SE sections crossing the Zhu Ⅰ Depression (Figure 2). Additionally, three NWW-SEE and two NNE-SSW sections crossing the Panyu 4 Sag were analyzed to illustrate the structural units and evolution of faults in two different rifting directions (Figure 5).
The seismic profiles of the Panyu 4 Sag, PY-1 drilling data, and logging data were used to interpret, calibrate and close layers for each sequence interface. Sedimentary and eroded thickness of six members of the Wenchang Formation (Figures 8B–F) in Panyu 4 Sag were calculated by using seismic interpretation and extrapolation of structural trends (Figure 8). Crossline and inline were extrapolated and closed with an accuracy of 1 km × 1 km on the workstation. Based on these analyses, the prototype basin was established (Figure 10).
The tectonic subsidence history of the Panyu 4 Sag was recognized using the back-stripping analysis (balanced cross section) technique. A seismic line was chosen as a representative profile to demonstrate the basin structure and stratigraphic variations within the sag (Figure 9).
Based on the distribution of faults and local stress field during different stages in Panyu 4 Sag of the Zhu Ⅰ Depression, one analogue model was set up to simulate the structural evolution. The sandbox model measured 57 cm long and 60 cm wide and was driven by one motor at the left side of the model and one plastic sheet measuring 30 cm × 17 cm × 1 mm (Figure 11A). A thin elastic rubber sheet (thickness of 1 mm) was placed at the bottom of the model and fixed on two sidewalls from the left and right sides to initiate extension from the left side. One plastic plate (The size shown in plastic plate 1 of Figure 11A) was placed on the rubber sheet close to the right side to simulate the local granite located on the hanging wall of the Fp1 in the basement. Another plastic plate (Plastic plate 2 in Figure 11A) measuring 30 cm × 15 cm × 5 cm was placed on the steel plate close to the left side to represent the basement granite which was located on the hanging wall of the faults Fp7、Fp8 and Fp64 in the basement. During extension stages 1–3, the left mobile sidewall was made to pull out at a rate of 0.25 mm/min. One layer of loose sand (total thickness of 6.2 cm) was sieved at the bottom of the model to simulate the metamorphic sedimentary layer (Table 1a; Figure 11B). The deformation of the model surface was covered by an additional layer of white sand (thickness of 0.3 cm) to represent Member 6 after 1.5 cm bulk extension from the left side. The left motor continued to move until the total extension reached 12.0 cm, then a 0.5-cm-thick white sand layer was sieved on the depressed area of the deformation model to represent the deposition of Members 5 and 4. The left motor was stopped after 15.0 cm of total extension, and a 0.3-cm-thick white sand layer was sieved on the model surface to represent the deposition of Members 3 and 2. Eventually, three layers of white sand (total thickness of 1.1 cm) were sieved uniformly on the surface of the first layer of sand to represent the deposition of the Wenchang Formation (E2w). Following the subsidence, the model was pulled by the plastic sheet at a rate of 0.2 mm/min to simulate the second extension stage. The model was driven by the plastic sheet to continue the second extension stage simulation until 2.0 cm of total displacement reached.
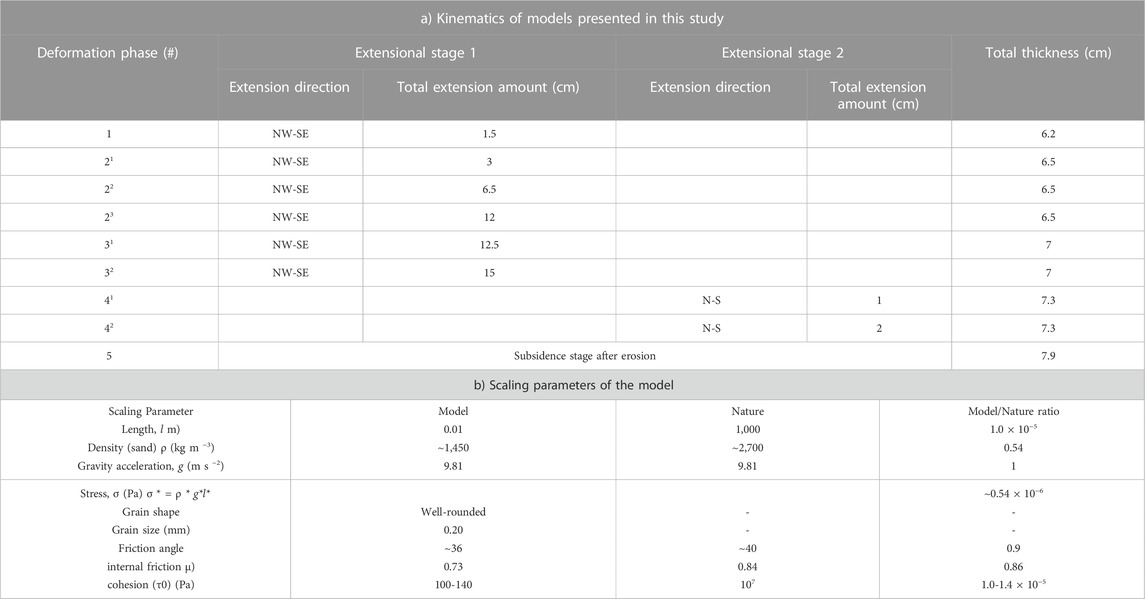
TABLE 1. Kinematics and scaling parameters of models presented in this study.
Finally, we obtained a structural evolution model of the Zhu Ⅰ Depression (Figures 13, 14). The seismic interpretation was performed using Geo-frame software; data statistics and sandbox model reconstruction were performed using Petrel software. All statistical graphics were acquired through Shuanghu software.
The study area comprised four fault sets with different strikes, including NNE, NE-NEE, EW, and NWW directions. Most of these faults were syn-rift faults during the Paleogene, and some post-rift faults formed during the Neogene. Based on the control exerted by the faults on the internal structural units of the depression, the Paleogene syn-rift faults in the Zhu I Depression could be divided into the main controlling boundary faults and the accommodation faults within the depression. The main controlling boundary faults controlled the formation and development of the depression, and had an important influence on the deposition process in the Paleogene. Approximately twenty such faults could be identified in the Zhu I Depression, including two faults (F1-F2) in the Enping Sag, three faults (F3-F5) in the Xijiang Sag, ten faults (F6-F15) in the Huizhou Sag, and five faults (F16-F20) in the Lufeng Sag. These faults were mainly distributed in the northern and southern parts of the depression zone and in the margins of low uplifts inside the depression, and they mostly cut into the basement, with a large fault throw (more than 1,000 m in Tg reflection layer), long extension distance (more than 30 km), and strong sedimentation controlling effects (sedimentation thickness of Wenchang and Enping Formations is more than 500 m). Most of the fault surfaces were listric, and a few of them had planar and ramp-flat surfaces. In terms of the dip angle of the faults, the western boundary faults of the depression (Enping Sag and Xijiang Sag) were mainly low-angle normal faults with dips ranging from 17° to 36°, while the eastern boundary faults of the depression (Huizhou Sag and Lufeng Sag) were mainly high-angle normal faults, except for the fault F6. The dip angles of the faults were generally greater than 40°. Accommodation faults were mainly formed by displacement adjustment during the activity of the main controlling boundary faults and had a controlling effect on the development of sub-sags, secondary structural belts, and local structures. They were characterized by a short extension (less than 20 km), small fault throw, and steep dip angles (above 45°) during the early deformation stage. On dip-oriented profiles, these faults cut into the basement and ceased in the Neogene, being overlain by nearly horizontal strata.
During the rift stage, most faults were active until the early Oligocene (Below the T70 unconformity interface), and some of the faults continued to be active until the Quaternary. Based on the period during which the faults were active, the rifting structural layers could be divided into the RP1 and RP2 fault structural layers by the T80 unconformity interface. Most newly generated faults during the RP1 cut downward to the basement and upward to the Enping Formation, some faults cut downward to the basement and ceased in the Wenchang Formation, and a few faults only developed within the Wenchang Formation. Most of the faults in the RP2 were inherited faults from the RP1, some newly generated faults in the RP2 cut the Wenchang and Enping formations, some faults cut into the basement, and a few faults only developed within the Enping Formation.
The large number of normal faults developed during the early rifting stage formed the pre-existing weak surface for the development of the late faults, which had an important influence on the development of the late faults. Under the same stress state, it is much easier for pre-existing faults to re-activate along the weak zone than for the new faults with the same attitude to be generated (Morley et al., 2004; Tong et al., 2014). Whether the early normal faults inherit activity in the late rifting stage depends on many factors, such as the tectonic strength, the extensional direction, and the magnitude of the intersection angle between the stress direction and the strike of the pre-existing faults during the late rifting stage. New faults with direct expression of the stress field in the geological body were not influenced by earlier pre-existing faults, and their characteristics best reflect the tectonic dynamics (Morley et al., 2004). Therefore, to study the kinetic characteristics of the RP1 and the RP2, it is necessary to separately investigate the inheritance and neogenesis of faults during the two rifting phases. Based on the development of inherited faults, the active faults in the two rifting stages are divided into three types: Type Ⅰa faults are those that fault began to develop during the RP1. Type Ⅰb faults are inherited Type Ⅰa faults that continued to develop during the RP2; Type Ⅱ faults are those that began to develop during the RP2 (Figures 2, 3).
The characteristics of fault activity and the spreading of syn-sedimentary faults in different periods can fully reflect the evolutionary characteristics of the fault system. The fault activity could be characterized quantitatively by the throw between the hanging wall and footwall and the fault activity rate (Xu et al., 2010). Analysis of the activity of the main boundary faults (F1-F20) in the study area revealed obvious differences in the activity of different strike faults in each period in the study area. The NE-NEE-trending faults exhibited strongest activity during the RP1, and the intensity of activity along other faults followed the order NNE > NE-NEE > NWW > EW. The maximum fault activity rate of F1, F3, and F4 exceeded 250 m/Ma. A series of depocenters was formed along the strikes of these faults, controlling the development of sedimentary strata. The fault activity rates of the Huizhou and Lufeng Sags were relatively low, ranging from 50 to 200 m/Ma (Figure 4D). There were multiple groups of fault strikes, which jointly controlled the development of the sags, forming a deposition unit with a wide area. The fault activity decreased significantly but was still strong. A large number of EW-trending and NW-trending faults developed within the depression in the RP2. The intensity of fault activity was EW > NWW > NE-NEE > NNE. At this time, strong fault activity was mainly concentrated in the eastern part of the northern margin of the depression, where the fault activity rate of the F11 and F13 exceeded 250 m/Ma, while that of other faults mainly ranged from 100 to 200 m/Ma (Figure 4D). NE-NNE-trending faults stopped developing in the late RP2 and were replaced by new faults in the later period. During this period, the depositional range of the Zhu I Depression was expanded, but the depocenter was reduced to one. As a result, the thickness of the Enping Formation was thinner compared to that of the Wenchang Formation (Figures 3C,D).
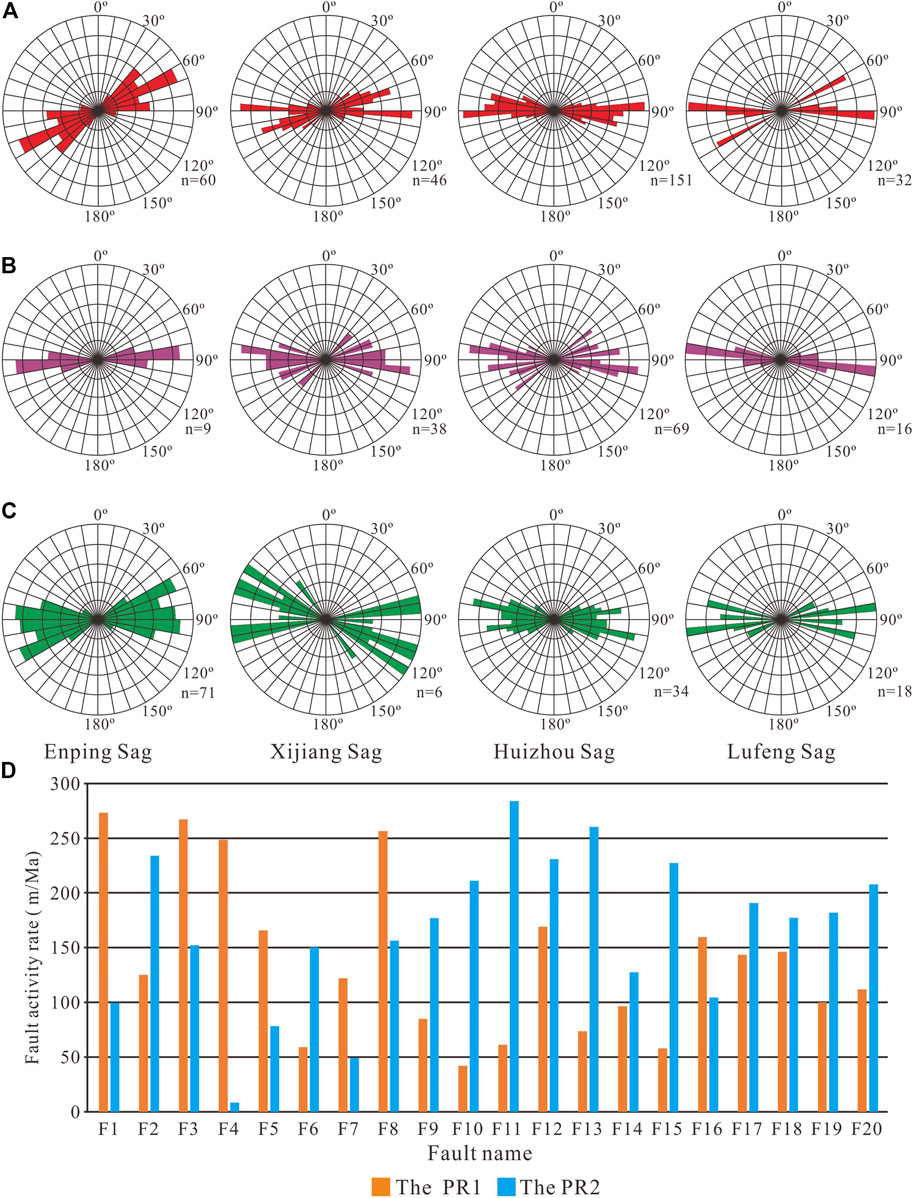
FIGURE 4. (A) The strike rose diagram of type Ⅰa faults; (B) The strike rose diagram of type Ⅰb faults; (C) The strike rose diagram of type Ⅱ faults; (D) The fault activity rate of main faults during the RP1 and the RP2.
The fault strike statistics provided valuable information for analyzing the stress field during fault formation. The dominant strike average azimuths of type Ⅰa, type Ⅰb, and type Ⅱ faults were 75°, 85°, and 90° (Figures 4A–C), which revealed that the minimum principal stress (σ3) directions in the RP1 and RP2 of the Zhu Ⅰ Depression changed from the SSE (∼165°) to near-EW (∼180°). Moreover, the direction of the minimum principal stress in different sags from west to east within the Zhu Ⅰ Depression changed to a certain extent (Zhou et al., 1995), possibly due to the existence of structural weak surfaces, which resulted in the formation of regional stresses that acted on different local structural deformation zones and led to stress re-orientation (Corti et al., 2013; Philippon et al., 2015). The change in the direction of minimum principal stress could also have been related to clockwise rotation during the dragging of the ancient SCS plate (Liu et al., 2018).
The five sub-sags of Panyu 4 Sag exhibited some differences. Northern Sub-sag consisted of a full-graben with faults dipping to the east and west (Figures 1C, 5). Owing to changes in the intensity of activity of the main controlling faults on the eastern and western sides, the structural characteristics of Northern Sub-sag demonstrated variations during different periods. During the deposition of Member 6, Fp1 (F4) on the eastern side was more active than Fp2 on the western side (Figure 6A), resulting in thicker sedimentary strata on the eastern side and thinner sedimentary strata on the western side. During the deposition of Members 5 and, Fp1 and Fp2 exhibited the same intensity of activity (Figures 6B,C), forming a graben and a series of secondary half-graben assemblages, which developed in the footwall of Fp2. During the deposition of Member 3 to 1, the high intensity of activity of Fp2 resulted in thinner sedimentary strata on the eastern side and thicker sedimentary strata on the western side (Figures 6D–F).
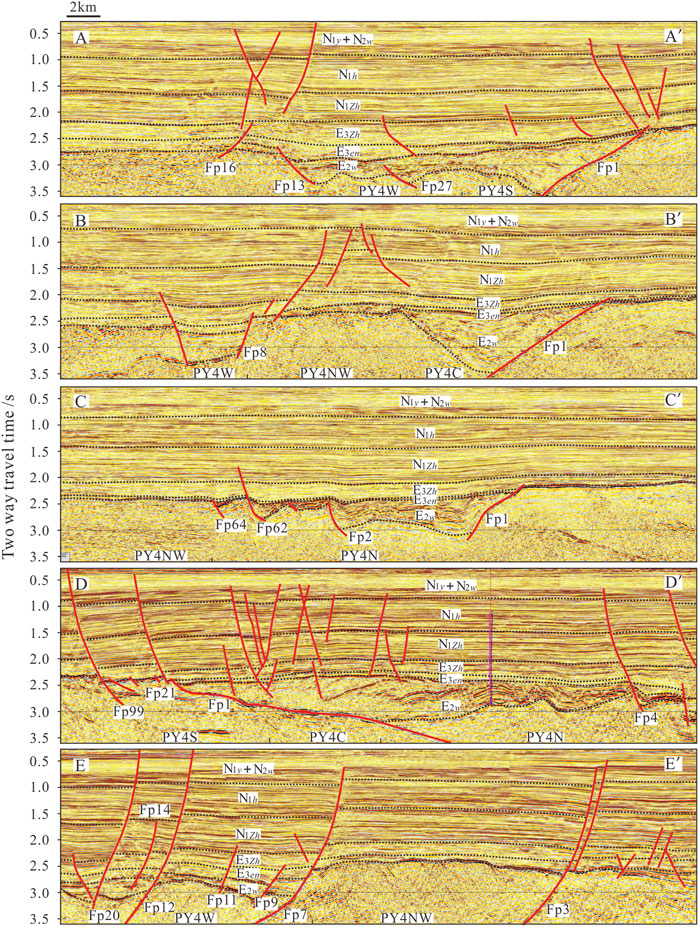
FIGURE 5. Seismic profiles of the Panyu 4 Sag (for section locations, see Figure 1C). AA', BB', CC', DD', EE' - Seismic line; PY4S - Southern sub-sag; PY4N - Northern sub-sag; PY4C - Central sub-sag; PY4W - Western sub-sag; PY4NW - Northwestern sub-sag; E2w - Wenchang Formation of Eocene; E3en - Enping Formation of later Eocene and early Oligocene; E3Zh - Zhuhai Formation of Oligocene; N1Zh, N1h, N1y, respectively, denote the Zhujiang, Hanjiang, Yuehai Formations of Miocene; N2w - Wanshan Formation of Pliocene.
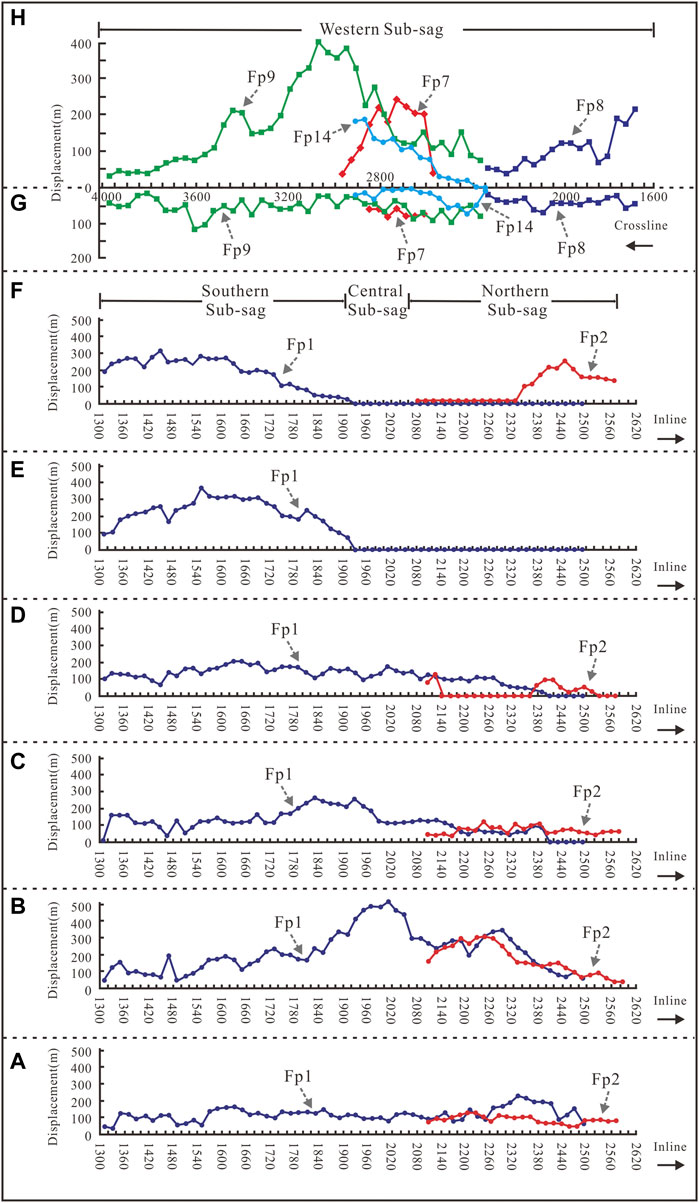
FIGURE 6. The Displacement-distance curves of main controlling faults (Fp1, Fp2, Fp7, Fp8, Fp9, Fp14) in the Panyu 4 Sag. The Displacement-distance curves of Fp1 and Fp2 during the RP1 (A–E) and RP2 (F); The Displacement-distance curves of Fp7, Fp8, Fp9 and Fp14 during the RP1 (G) and RP2 (H).
The sedimentation of Central Sub-sag, which was continuously controlled by Fp1 on the eastern side, formed the central part of the main sag with features of a half-graben. The eastern side was bounded by a fault. On the western side, the sequence was terminated by the overlying interface (Figures 1C, 5).
NW-SE-trending extension during the deposition of Members 6 to 2 caused the formation of Southern Sub-sag, which featured a half-graben with a boundary fault on the east side (Figures 1C, 5). The portion of the eastern steeply sloping area with the maximum sedimentary thickness was located close to the hanging wall of Fp1. Owing to the near-S-N-oriented extension during the deposition of Member 1, Fp1 inherited the original active condition under the oblique extension, forming an inherited half-graben. The near-E-W-trending faults cut the Wenchang and Enping Formations on the seismic profile, but these faults had no obvious controlling effect on deposition.
Before the deposition of Member 1, Western sub-sag was a sloping landform. Most of the strata from Members 6 to 2 were thinning or missing (Figures 1C, 5). However, it formed a half-graben with a boundary on the northern side during the deposition of Member 1.
Northwestern Sub-sag was derived from the eastern extension of the Xijiang Middle-Low Uplift (Figures 1C, 5). The Wenchang Formation was missing from the profile. A few faults began to develop during the deposition of the Enping Formation.
The fault systems could be divided into early and late extensional fault systems based on the principle of combination and matching of fault phases in the Panyu 4 Sag. The early fault system referred to faults that developed during the deposition of Members 6 to 2, whereas the late fault system mainly referred to faults that formed during the deposition of Member 1.
The early fault system was dominated by NE-trending faults (40–60°), followed by a few near-EW-trending and NEE-trending faults (Figure 7). The NE-trending faults were cut by the near-EW-trending faults, which were transverse accommodation faults, and the NEE-trending faults developed and aligned diagonally during the deposition of Members 3 and 2 (Figures 7B,C). The fault system in this period was mainly a combination of normal faults formed under the action of NW-SE-oriented extensional stress. The NEE-trending normal faults formed during the deposition of Member 2 (Figure 7B), possibly during the period when the stress field began to shift from the NW-SE direction to the NNW-SSE direction. They developed in the near-S-N-trending crossline and exhibited steep dip angles, short extents, and features indicating that they were newly developed. The near-EW-trending transverse accommodation faults (Fp4, Fp5, Fp6, and Fp10) had a controlling effect on the deposition of Members 6 to 4 (Figures 7D–F).
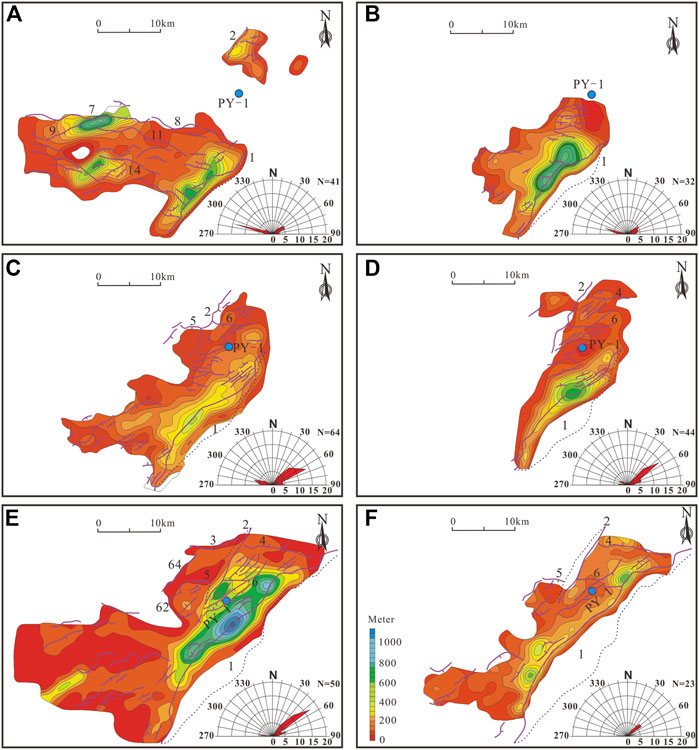
FIGURE 7. The comparison of syn-sedimentary faults, strike rose diagram of faults and sedimentary thickness distribution from Member 1 to Member 6 [from (A–F)] of Wenchang Formation.
The late fault system was dominated by NWW-trending faults (280–290°) that developed from the deposition of Member 1 of the Wenchang Formation to the Enping Formation (Figure 7A), with a few NE-trending faults (50–70°). The NWW-trending faults were arranged in parallel belts, and the faults in the same belt were distributed in a segmented pattern, while the NE-trending faults were arranged in an arc-shaped series and were cut by the NWW-trending faults. This phase of the fault system was a combination of tensor faults formed under near-S-N-oriented extensional stresses. The NWW-trending faults were formed in the direction of vertical tension and exhibited steeply dipping slab-like surfaces; they continued to be active after the deposition of the Wenchang Formation. The NE-trending faults were inherited faults with tensional and torsional features that were based on pre-existing faults. The NE-trending main boundary faults, such as Fp1 and Fp2, exhibited large extents. The NWW-trending sag-controlled faults, such as Fp7, Fp8, Fp9, Fp11, and Fp14, had large extents (Figures 6G,H), whereas the curved NE-trending faults had small extents.
Six members of the Wenchang Formation could be identified in the Panyu 4 Sag, (Zhu et al., 2014; Ge et al., 2019), and the following features of each member were noted (Figure 7).
Member 6 had a relatively small distribution area, which was narrow along the NE direction with a maximum thickness of 450 m; it was confined to the main sag (Northern, Central, and Southern Sub-sags). There was a small amount of sediment on the slope on the southeastern side (Figure 7F). The distribution area of Member 5 was the largest in Wenchang Formation, with the overall strike oriented in the NE-SW direction. In addition to the main sag, it was found on the slope, with a maximum thickness of 1,100 m (Figure 7E). The distribution area of Member 4 was smaller than that of Members 6 and 5. It exhibited a NE orientation and was confined to the northeastern part of the main sag; the maximum thickness of Member 4 was 500 m (Figure 7D). A gradual reduction in the distribution area was observed from Member 4 to Member 2, reflecting the gradual shrinkage of the basin; the maximum thicknesses of Members 3 and 2 were 400 m and 650 m, respectively (Figures 7B,C). The distribution area of Member 1 was larger than those of Members 3 and 2; it covered the entire western slope area, and the strike of the thickness contour exhibited a shift to a near-EW orientation, which reflected the characteristics of basin regeneration. The maximum thickness was 700 m (Figure 7A).
There were three relatively independent depocenters in Member 6. The thickness and distribution area of the depocenters in the north were slightly larger than those in the south. From Members 5 to 2, three independent depocenters gradually evolved into a unified depocenter and migrated from north to south. The axis of the depocenter was oriented NE, parallel to the main controlling boundary fault on the eastern side, indicating that the intensity of activity of the controlling boundary fault gradually increased from north to south. The depocenter on the southwest slope was oriented NEE, whereas that in the main sag on the eastern side was oriented NE, which reflected the coexistence of inheritance and regeneration.
The eroded thickness contours of Member 1 were distributed throughout the region, but the scale of the erosion and the strike of the contours varied. In Western Sub-sag, the eroded thickness was less than 100 m, and the contour line was oriented EW. The erosion of the T80 interface on Member 1 could not be observed clearly. Furthermore, the structural trend extrapolation method was not very reliable for the calculation of the eroded thickness, and only a small amount of estimation was possible, so the actual eroded thickness was of little significance. The NE-trending eroded thickness contours in Northern, Central, and Southern Sub-sags showed an anticlinal structure in the seismic profile, so the eroded thickness was relatively reliable, and the maximum value was approximately 260 m, which was equivalent to the thickness of the core of the anticline (Figure 8B). The eroded thickness contours of the Member 2 were only distributed on the southern side of Northern Sub-sag and southwestern side of Southern Sub-sag. The area with the greatest eroded thickness was the same as that of Member 1, and the maximum eroded thickness was 200 m (Figure 8C). The eroded thickness contours of Member 3 were only distributed in Northern Sub-sag, and the eroded area of E2w3 was smaller than that of Member 2. The area with the largest amount of erosion was the same as that of Member 2, and the maximum amount of erosion was 120 m (Figure 8D). The part of the northeast side that extended slightly northward was the result of the erosion of the T81 unconformity. The eroded thickness of Members 3 to 1, whose maximum eroded thickness was located at the same position with the total thickness being less than 600 m, was mainly caused by the T80 unconformity. The eroded thickness contours of Member 4 were distributed in narrow strips in Northern, Central, and Southern Sub-sags, but the causes of erosion varied (Figure 8E). The T83 unconformity was the main cause of the eroded thickness of Member 4 in Southern and Central Sub-sags. The erosion was pronounced at the zone of transition between the slope and depression; the maximum thickness was close to 200 m, and the contour trend was oriented NE. In Northern Sub-sag, the eroded thickness contours were oriented EW. The maximum erosion was 180 m and the point thereof was close to the main boundary fault on the eastern side; it formed due to the erosion of the T80 unconformity. In contrast, the eroded thickness was significantly reduced (less than 100 m) on the western side and was caused by the erosion of the T81 unconformity, indicating that the intensity of erosion of T80 was greater than that of T81. The distribution of eroded thickness contours for Member 5 was limited, and only a small amount of erosion was distributed in Southern and Northern Sub-sags (Figure 8F). The maximum amount of erosion in Northern Sub-sag was approximately 180 m, and the location of the area of maximum erosion was the same as that for Member 4; it was caused by erosion of the T80 unconformity. The maximum eroded thickness of Member 4 was the same as that of Member 5, and both were caused by erosion of the T80 unconformity; the total eroded thickness was approximately 360 m. The eroded thickness at this position of Member 1 was 140 m, so the total eroded thickness of the Wenchang Formation at the same position from Members 5 to 1 was 500 m. The area with a large amount of erosion was located in the developed part of the anticline, which was a rolling anticline formed in the hanging wall of Fp1 during the period of strong extension. During the formation of the T80 unconformity, the fold amplitude increased due to the tectonic uplift of the Zhuqiong event, so it suffered the strongest erosion.
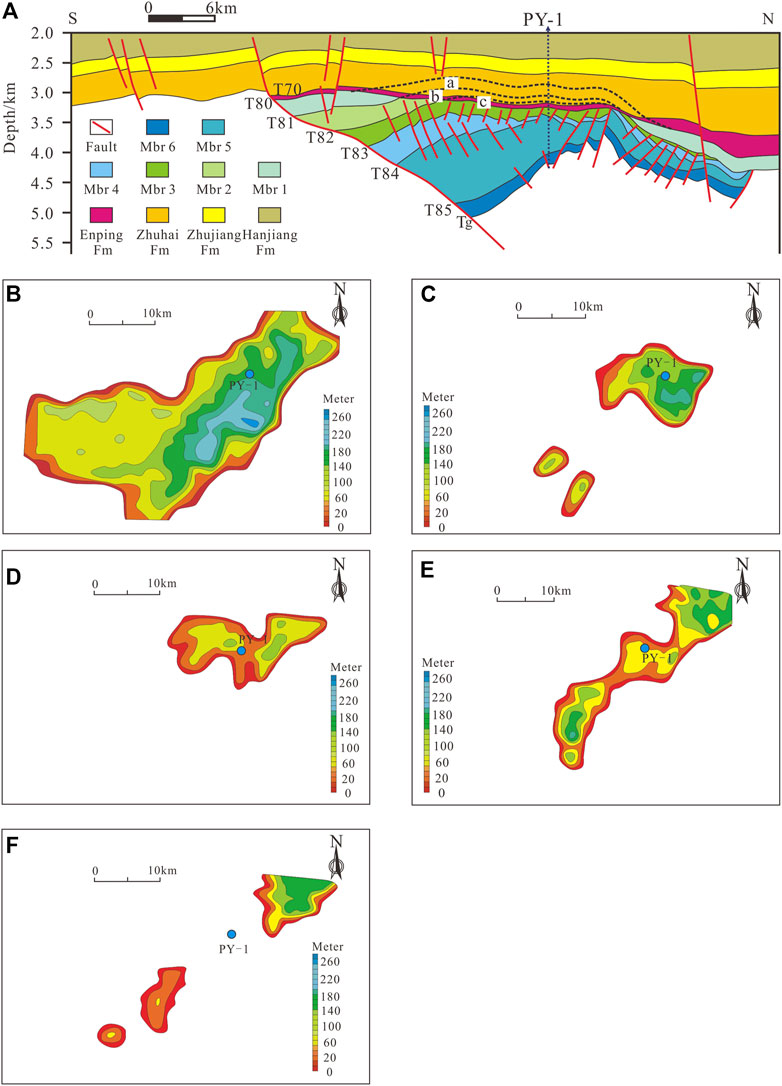
FIGURE 8. (A) The principle of structural trend extrapolation to restore erosion amount. (A) Eroded thickness of Member 1; (B) Eroded thickness of Member 2; (C) Eroded thickness of Member 3; Mbr - Member, Fm - Formation. The eroded thickness recovery from Member 1 to Member 5 [from (B–F)] in Panyu 4 Sag.
The structural evolution of the Panyu 4 Sag in the Cenozoic could be divided into three periods (six stages), namely, the early rift period, late rift period, and thermal subsidence period (Li, 1989; Zhu et al., 2008; Chen and Zhang, 1991; Zhang et al., 2003; Figures 9, 10). The evolution of the Panyu 4 Sag could be divided into three stages from the deposition of Members 6 to 2, which were the initial faulting stage (IFS), the strong faulting stage (SFS), and the weak faulting stage (WFS, Figure 9).
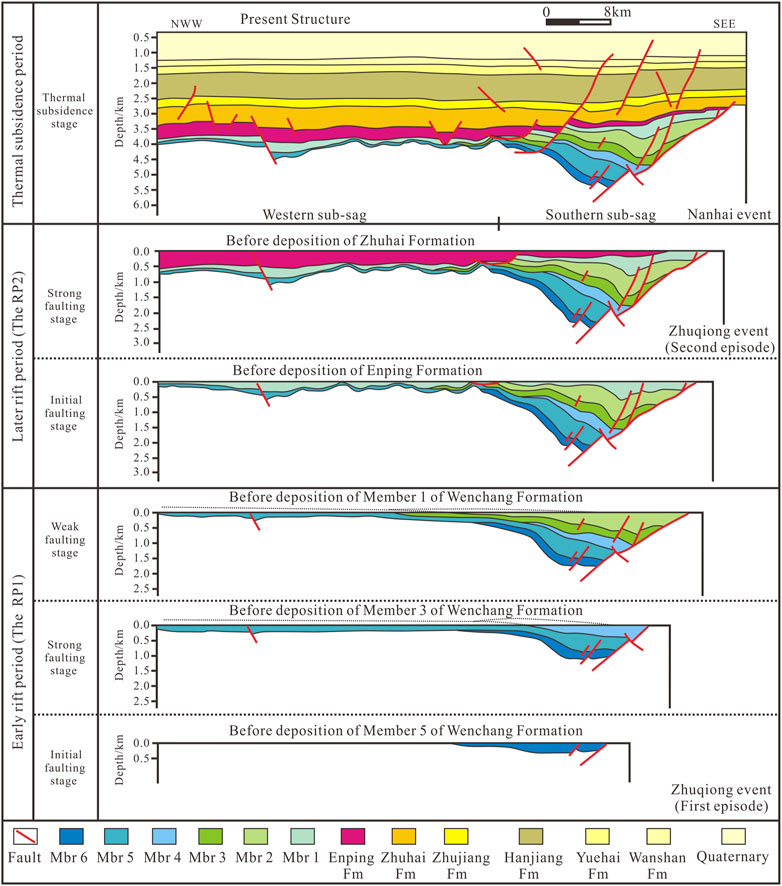
FIGURE 9. Structural evolution profile of Panyu 4 Sag. Mbr - Member, Fm - Formation.
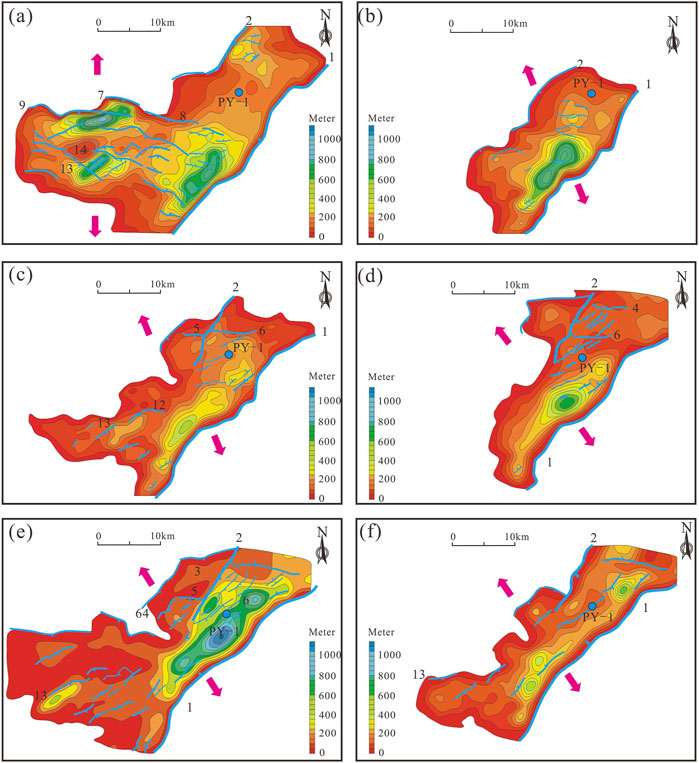
FIGURE 10. The superimposition of original sediment thickness and syn-sedimentary faults from Member 1 to Member 6 [from (A–F)] in Panyu 4 Sag.
The IFS referred to the deposition of Member 6. It was equivalent to the beginning of the first episode of the Zhuqiong event, which caused the PRMB to enter a strong rifting phase (the middle Eocene, Figures 9, 10F). The sedimentary filling was mainly composed of coarse clastic rocks formed in rivers, alluvial fans, fan deltas, and similar environments (Jiang et al., 2015). The faults controlling deposition were mainly the NE-trending faults, which developed under an NW-SE tensile stress regime, along with a small number of accommodation faults. Fp1 and small-scale transfer normal faults mainly developed in Southern and Central Sub-sags. In addition, Southern and Central Sub-sags were controlled by faults along the east-west boundary. There were also EW-trending lateral accommodation faults and a few NEE-trending transfer faults in Northern Sub-sag. The intensity of activity of the sag-controlling faults was high in the east and low in the west; it was high in the north and south and low in the central region.
During the process of structural evolution, the boundary of Northern Sub-sag was controlled by Fp1 in the east and Fp2 in the west. Because the intensity of activity of Fp1 was greater than that of Fp2, the sedimentary thickness was thick in the east and thin in the west. The depocenter was close to Fp1 on the east side, with a maximum thickness of 450 m. The boundary of Central Sub-sag was controlled by Fp1 on the eastern side, and by two small faults developed on the western side, forming a horst-graben interphase structure. Due to the low intensity of fault activity, the deposited strata were distributed in a plate-shaped area with a thickness of less than 200 m. The Southern Sub-sag was bounded by Fp1 on the east side, forming a half-graben. The distribution area was limited to the main sag, with no deposition on the western gentle slope. Three small depocenters, resembling a string of beads, were located near the main boundary fault on the east side; the maximum thicknesses were 250 m, 400 m, and 330 m. Northwestern Sub-sag was a sub-uplift during this period; it originated from the eastern extension of the Xijiang Middle-Low Uplift. It gradually transitioned from Central Sub-sag and was separated from Northern Sub-sag by faults. Western Sub-sag was a secondary structural unit that gradually transferred from Southern Sub-sag. During this period, it was a gently sloping landform and was in a state of erosion, and no residual strata were present.
The SFS referred to the deposition of Members 5 and 4 (Figures 9, 10d-e). It was equivalent to a period of intense activity during the first episode of the Zhuqiong event. The area of the sag distribution increased significantly. Faults were mainly planar, listric, and ramp-flat faults, with various combinations of step and domino styles. EW-trending and NEE-trending accommodation faults were widely developed; the structural trend was mainly oriented NE.
Northern Sub-sag exhibited a graben structure with double faults in the east and west. With the increase in the intensity of activity of Fp2, many domino accommodation faults developed on its hanging wall, and two new faults (Fp3 and Fp64) developed on the footwall, forming a half-graben. The distribution area of Members 5 and 4 was significantly larger than that of Member 6, and a new depocenter was developed near Fp2, with a maximum thickness of approximately 500 m. The Central Sub-sag was a half-graben controlled by Fp1 on the east side. The increase in intense activity of Fp1 on the eastern side gave rise to multiple stepped accommodation faults on the hanging wall and caused the development of small listric normal faults on the slope, forming a half-graben. Compared to Member 6, the thickness of Member 5 increased; it was thick in the east and thin in the west, with a maximum thickness of approximately 1,100 m. The thickness of Member 4 was reduced to approximately 300 m, indicating that the intensity of activity of the sag-controlling faults reduced. Southern Sub-sag appeared as a single half-graben, and the intensity of fault activity at the eastern boundary as well as the thickness of deposits increased significantly. In Southern Sub-sag, the eastern side was bounded by a fault. On the western side, the sequence was terminated by the overlying interface. The distribution area of Members 5 and 4 extended across the entire western slope and was significantly larger than that of Member 6. The depocenter was close to the main boundary fault on the eastern side, with a maximum thickness of 700 m. Northwestern Sub-sag did not receive sediment input. Western sub-sag, which gradually transferred to Southern Sub-sag, was a gentle slope with a small amount of deposition.
The WFS referred to the deposition of Members 3 and 2 (Figures 9, 10b-c). Because structural activity diminished, the subsidence of the basin slowed down, the area of deposition decreased, and the thickness of sediments reduced. In addition to the continuous activity of the sag-controlling boundary faults, a series of small-scale NEE-trending en echelon normal faults developed in the southern part of Northern Sub-sag, which appeared as a stepped combination in the section. The fault activity in Northern Sub-sag weakened, and the deposition area reduced and was limited to the hanging wall of Fp2. The thickness of deposition was significantly reduced, with a maximum thickness of less than 350 m. The intensity of fault activity in Central Sub-sag reduced, but there were some stepped faults trending opposite to the main fault trend. The deposition area reduced, and the thickness of the deposition was approximately 300 m. The intensity of fault activity in Southern Sub-sag reduced, and the deposition area decreased and disappeared on the western gentle slope; the maximum thickness of deposition was close to 400 m. The upper part of Member 4 in the transitional part of the slope and sag was eroded. Northwestern Sub-sag did not receive sediment input, and Western Sub-sag was in the form of a gentle slope with no stratigraphic deposition.
The late rift period started from the deposition of Member 1 in the Panyu 4 Sag and continued until the end of the deposition of the Enping Formation (the late Eocene to the early Oligocene). Based on the deformation style and the distribution characteristics of the local unconformity, it was divided into two stages, namely, an IFS and an SFS (Figure 9).
The IFS referred to the deposition of Member 1 (Figures 9, 10A). It was equivalent to the period of sediment deposition between the two reflection interfaces (T80 and T81) on the seismic profiles. The area of deposition increased significantly. Except for Northwestern Sub-sag, the sediments of Member 1 were distributed in other secondary structural units. The seismic reflection was characterized by continuous weak reflection, and the sediments were mainly fluvial deposits. Except for the inherited activities of the NE-trending main controlling boundary faults, the newly developed sag-controlling faults and their associated faults in Western Sub-sag were NWW-trending, forming a half-graben controlled by faults on the north side or a combination of stepped faults. The direction of the fault strike in this period changed from its NE orientation during the early rifting period to the NWW orientation, and the regional stress field changed from NW-SE-trending extension to near-SN-trending extension. This was a significant period of structural transformation in the Panyu 4 Sag with the orientation of the T81 unconformity coinciding with that of T80. Moreover, there was no obvious erosion between T81 and T80 in the sag, and Member 1 exhibited a large residual thickness. Therefore, it was believed that the T81 unconformity in the Panyu 4 Sag might be the product of the beginning of the second episode of the Zhuqiong event, which led to the second rifting of the PRMB and the formation of near-E-W-trending faults.
During the structural evolution, the pre-existing NE-trending boundary faults within the Panyu 4 Sag underwent tensional and torsional activity, and they controlled the deposition of Member 1. In Northern Sub-sag, a small amount of Member 1 sediment was deposited in the upper part of Fp1 and Fp2. At this time, the activity of Fp2 was slightly more intense than that of Fp1, which formed an asymmetrical graben combination that was thicker in the west and thinner in the east, with the thickest part (approximately 300 m) located in the upper part of Fp2. In Central Sub-sag, a small amount of Member 1 was deposited, with a thickness of less than 200 m. The top of Member 2 in Southern Sub-sag suffered a small amount of erosion, and multiple independent depocenters developed in the sag and on the slope, with a maximum thickness of 600 m within the Panyu 4 Sag. Northwestern Sub-sag did not receive sediment input. Western Sub-sag was transformed into a near-SN-oriented extension during this period due to the tectonic stress field, forming a half graben-type assemblage that could be characterized as a “northern fault beside southern stratigraphic overlap”, with faults Fp7, Fp8, Fp9, and Fp14 controlling the boundaries of the half-graben. Furthermore, the early NE-trending faults Fp12 and Fp13 inherited the late activity trends, spreading in a NEE-oriented arc; they were cut by Fp14 and controlled the deposition of Members 6 and 5. Two depocenters, 800 m and 550 m thick, developed in the footwall of Fp7 and Fp14, respectively.
The SFS referred to the deposition of the Enping Formation, which corresponded to the period of stratigraphic deposition between the two reflection layers T80 and T70 on the seismic profile (Figure 9). The depositional area extended across the entire region, and the sediments changed to fine clastic sediments formed in a lacustrine marsh environment. The depositional thickness was mainly controlled by the near-EW-trending faults; the depositional thickness was thick in the west and thin in the east, and thick in the south, and thin in the north. Compared with Member 1, the distribution area and depositional thickness increased significantly, the intensity of the activity of the sag-controlling fault increased, and erosion associated with the T80 angular unconformity peaked. Thus, this stage belonged to the stage of strong fault subsidence, which was equivalent to the period of strong activity during the second episode of the Zhuqiong event.
The intensity of activity of the near-EW-trending fault Fp3 in Northern Sub-sag increased during this period, forming a boundary fault that controlled the deposition of the Enping Formation. The east was bounded by a fault. On the west side, the sequence was terminated by the overlying interface. Member 2 and Member 1 in Central Sub-sag suffered erosion. The T80 interface in Southern Sub-sag had obvious truncation and erosion. The near-EW-trending faults Fp11 and Fp67 had a controlling effect on sedimentation, whereas the intensity of activity of Fp1 on the eastern side was low and it had little control over sedimentation. This was manifested as a structural pattern of thick deposits in the west and thin deposits in the east on the EW-trending section. Northwestern Sub-sag received sediment input during this period and the deposits accumulated on the pre-Cenozoic basement, forming an angular unconformity. Due to the lack of pre-existing basement faults, new faults did not develop, neither under the effects of late extension nor those of strike-slip.
The thermal subsidence period was equivalent to the deposition period of the Zhuhai Formation to Hanjiang Formation (the late Oligocene to the middle Miocene), which consisted of fine sandstones, siltstones, mudstones, and other fine clastic rocks of coastal-neritic facies; the depositional thickness was evenly distributed. As a result of the Nanhai event, which was a strong tectonic activity associated with the expansion of the SCS with a long duration, the PRMB entered the stage of passive continental margin subsidence (Figure 9). The intensity of tectonic activity was low, and the faults were mainly high-angle near-EW-trending strike-slip faults, which had no obvious controlling effect on sedimentation, but had a reforming effect on the pre-existing faults during the early and late rift periods.
The model presented here was scaled to the Panyu 4 Sag geometrically, kinematically, and dynamically. The geometric similarity was fulfilled using a thickness ratio of approximately 1.0 × 10⁻⁵, where 1 cm of loose quartz sand in the model simulated 1.0 km of sediments in nature. Dry quartz sand has an average angle of internal friction of 36°, a cohesive strength (1.05 kPa), and deforms according to Navier-Coulomb failure, making it a favorable material for simulating the brittle deformation of sediments in the upper crust (McClay, 1990). The grain shape of quartz sand is well-rounded and grain size is about 0.2 mm (see sand properties in Table 1b).
The kinematic similarity was approached by simulating a sequence of events in the model that closely followed the interpreted evolution history of Panyu 4 Sag. Therefore, based on our interpretation of the seismic data, along with the tectonostratigraphic relations of different sedimentary formations, a five-stage evolution was proposed and mimicked in the model.
The dynamic similarly was fulfilled by simulating the physical properties of the sedimentary units of Panyu 4 Sag with appropriate modelling materials. In this regard, the intrinsic material properties, such as the cohesion (τ0) and coefficient of internal friction μ), in the models and nature need to be approximated (Koyi and Kenneth, 1993; Koyi, 1997). The angle of the internal friction of rocks in the upper crust (<10 km) was averaged as 40° (Brace and Kohlstedt, 1980), thereby resulting in a coefficient of internal friction μ) of 0.84. The angle of internal friction of the uncompacted loose sand used in the model was 36°, resulting in a coefficient of internal friction of 0.73 (Koyi and Vendeville, 2003; Yu and Koyi, 2016; 2017), which is considerably close to that of the rocks in the upper crust. Meanwhile, cohesion (τ0) was scaled by the equality between the non-dimensional shear strength in the models and in nature.
where ρ is the density, l is the length, g is the acceleration due to gravity, and subscripts m and n, respectively, denote the model and nature. The non-dimensionalised ratio was calculated for the model and for the nature by using the shear strength of sedimentary rocks ranging from 1 to 10 MPa (Hoshino, 1972). For clastic sediments, the shear strength and density were 10 MPa and 2,550 kg m−3, respectively (Yu and Koyi, 2016). The cohesion of the loose sand was approximately 100–140 Pa (Yu and Koyi, 2016) and its density was 1,550 kg m−3 (Table 1b). These characteristics resulted in non-dimensional shear strengths (Eq. 1) of 11–15 for the model and 25 for the nature. These two ratios, which are within the same order of magnitude, suggest that our models approximated the dynamic similarity with their prototypes.
Following the scaling procedure (Ramberg, 1981; Weijermas and Harro, 1986), the scaling stress (σ*) is given by the following equation:
The calculated σ* equals to ∼0.54× 10⁻⁶, and all the scaling parameters used in our models are reported in Table 1b.
During the initial phase of first extension deformation in the model, after 1.5 cm of total extension, NE-trending normal faults (f1, f2, f3, and f4) first developed in the area near the edges of plastic plates 1 and 2, forming two grabens (Figure 11ca). When the total extension amount increased to 12 cm, two new secondary faults f5 and f6 respectively formed in front of faults f1 and f2 (Figures 11Cb–d). With the total extension amount increasing to 15 cm, several new secondary normal faults, such as f7 and f8 formed in front of f1 and f6, respectively. f6 and f7 formed a narrow graben. Meanwhile, f5, along with other secondary normal faults (f6, f7, and f8) developed in the hanging wall of major fault f1 (Figures 11Ce–f). In the second extension stage, the extension direction shifted clockwise from NW-SE to near N-S. During the first phase of this stage, after 1 cm of total extension, two new E-W trending normal faults (f9 and f10)were generated, forming an asymmetrical graben (Figure 11Cg). When the total extension amount increased to 2 cm, several new normal faults (f11, f12, and f13) developed, forming a duplex graben that was separated from previous asymmetrical graben by a horst (Figure 11Ch).
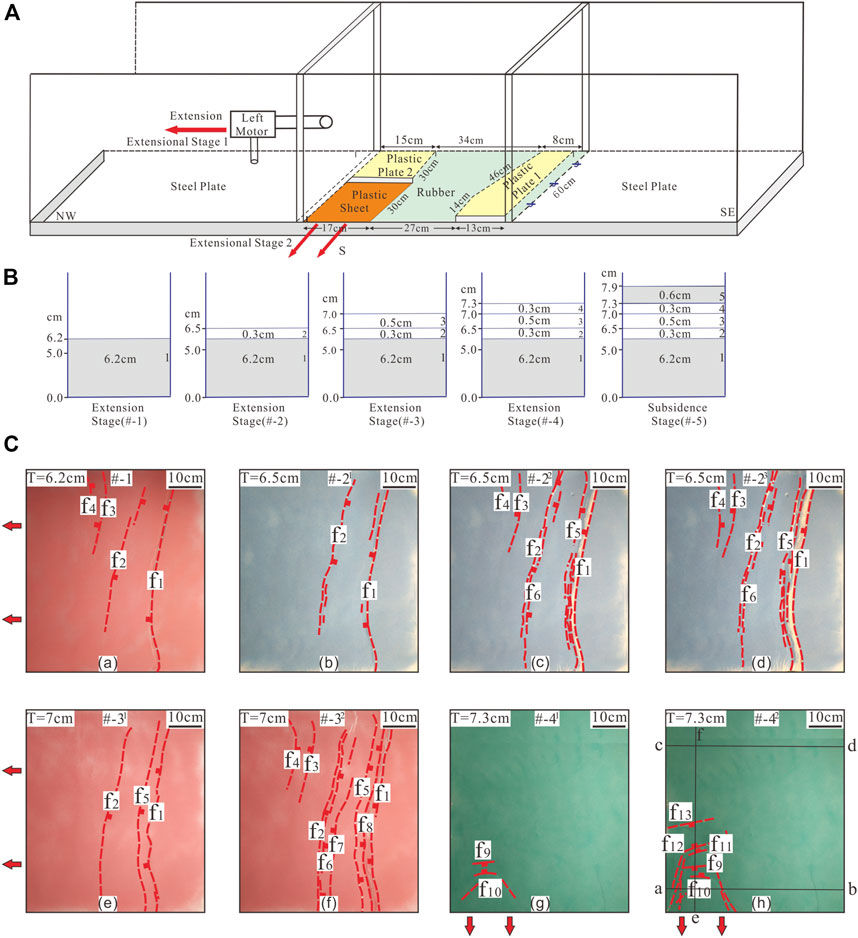
FIGURE 11. (A) Model setup showing a 3D view of the deformation rig and its components for modeling the evolution of the Panyu 4 Sag from the middle Eocene to the Oligocene; (B) The sketch to shows the filling process of the model at different stages. The red solid arrows represent the stress direction in the extension stages; (C) Top view (photographs and line drawings) of different stages of the model showing the evolution of the Panyu 4 Sag from the extension stage 1 (a-f) to the extension stage 2 (g-h). T denotes the total thickness of the sand layers; # denotes the deformation phase of the simulation process; the fault label numbers represent the order of the faults developed in the experiment.
The main boundary normal fault f1 was preserved in the right part of the cross section in the model and broke through the white sand layers 2 and 3. It developed along the boundary of the pre-existing plastic block in the basement and was sealed by white sand layer 4 (Figure 12). Another boundary normal fault f2 generated during the extension and was preserved in the middle part of the cross section, sealed by gray sand layer 5. Boundary faults f1 and f2 formed a graben where several synthetic and antithetic secondary normal faults (such as f5, f6, f7, and f8) developed. These faults broke through white sand layers 2, 3, and 4, and were sealed by gray sand layer 5. These boundary and secondary faults formed some secondary narrow grabens. In the left part of the cross section, two additional boundary faults f3 and f4 comprised a graben. The EW-trending normal faults (f9, f10, f11, f12, and f13) were preserved in the left bottom part of the cross section in the model and broke through gray sand layer 5. These faults formed two grabens and one horst. Several secondary normal faults generated between the boundary faults f11 and f13.
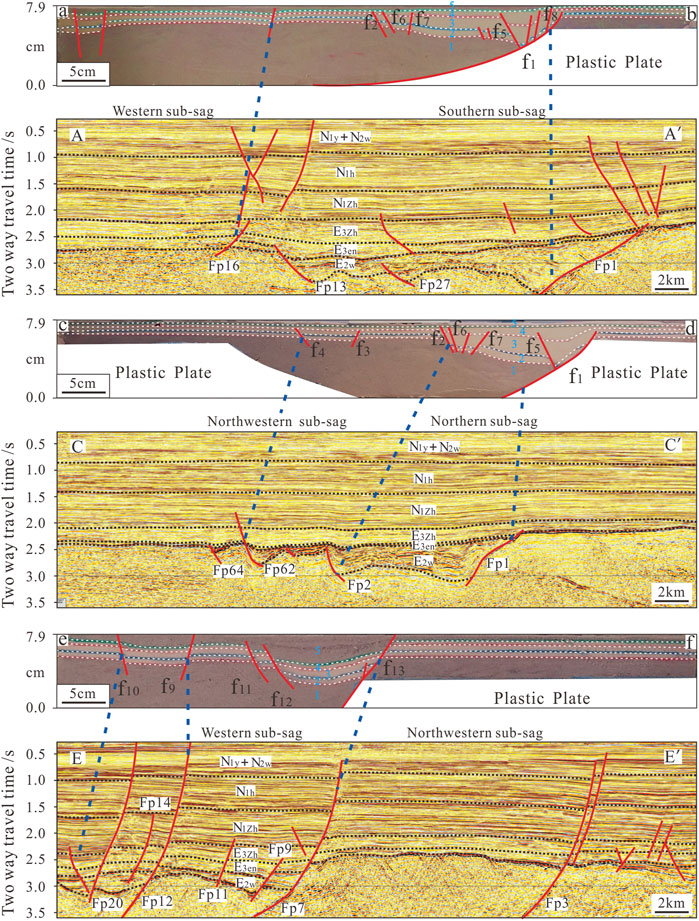
FIGURE 12. Comparison between modeling results and interpretation of seismic sections across the Panyu 4 Sag. Photograph and line drawing of a cross section in Model (for the location, see Figure 11Ch); interpreted seismic sections across the Panyu 4 Sag (for the location, see Figure 1C).
The model exhibited a structural evolution similar to that of Panyu 4 Sag. During the early extension stage, faults f1, and f2 controlled the deformation in the model (Figures 11Ca–b). The depocenter was in strip shape, corresponding to the beaded shape of the Northern, Central, and Southern sub-sags in Panyu 4 Sag (Figure 1C; Figure 10F). With increasing extension amount, the scale of the major faults continued to increase, and numerous accommodation faults developed simultaneously. However, the overall structural evolution was mainly controlled by several major faults (Figure 10B-e; Figures 11Cc–f). In the late extension stage, as the stress field transformed and the strike of the faults also changed accordingly. The model generated multiple nearly parallel sub-sag-controlling faults (such as f9 and f10), which formed a half-graben sub-sag (Figures 11Cg–h). This development was similar to that of the Western Sub-sag in the Panyu 4 Sag (Figure 1C; Figure Fig10A). At this point, the overall structure of the sag had formed, and it entered the thermal subsidence stage, which had little influence on the structure of the Panyu 4 Sag. The modelling results of the second extension stage were then compared with the structural map based on the bottom reflections of the Eocene in Panyu 4 Sag. The map view of model results showed similarities in the distribution and configuration of the second-order structure units to those developed on the bottom reflection of the Paleogene in Panyu 4 Sag (Figure 12). The boundary faults Fp1, Fp2, and Fp64 of Northern, Central and Southern Sub-sags exhibited similar trends and dips to faults f1, f2, and f4 developed in the experiment conducted at 15 cm extension during the first extension phase. The boundary faults Fp7 and Fp8 of Western Sub-sag were comparable to fault f13 observed in the experiment conducted at the 2 cm extension during the second extension phase.
The structural evolution of the Panyu 4 Sag in the Zhu Ⅰ Depression since the Paleogene was mainly affected by the combined action of the NNW- or NW-trending subduction in the western Pacific tectonic domain, the northward subduction and collision in the western part of the Tethys tectonic domain (India), and the NNW-trending subduction and collision in the eastern domain (Australia) (Lee and Hwang, 1993; Northrup et al., 1995; Ge et al., 2017; Liu et al., 2019; Ma et al., 2020; Guo et al., 2022). During the deposition of Members 6 to 2 in the early Eocene, the Indian plate drifted northward at a high speed, and the northern Pacific oceanic crust subducted under Eurasia. The Australian plate slowly drifted northward, away from the Eurasian plate (Northrup et al., 1995). The rate of convergence of the Pacific and Eurasian plates gradually decreased, and the western Pacific subduction zone retreated seaward. The East Asian continental margin underwent a considerable transformation from the left-handed compression system to the right-lateral extension system (Zhou et al., 2006; Shu et al., 2006; Dong et al., 2008; Zhang et al., 2009; Li et al., 2017; Zhou et al., 2022; Figure 13D). The main dynamic factors were the compression caused by the NE-oriented subduction of the Indian plate and the tension caused by the subduction and roll-back of the Pacific Plate. Under the action of NE-SW-oriented compressive stress (σ2) and NW-SE-oriented tensile stress (σ3) (Figure 13B), the Panyu 4 Sag in the Zhu Ⅰ Depression began to enter the RP1.
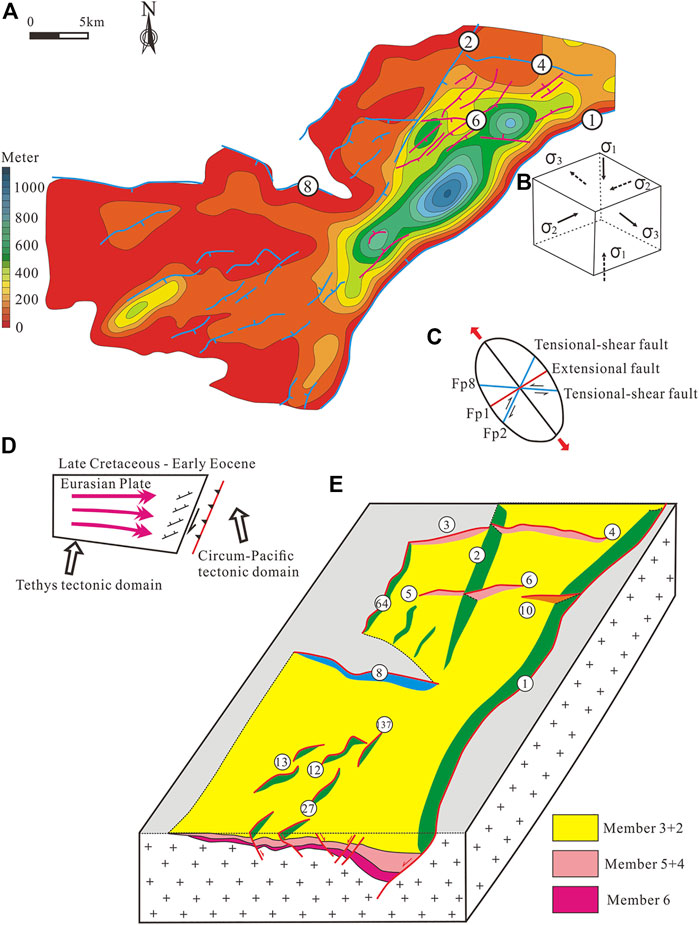
FIGURE 13. (A) The prototype basin of Member 5 in Wenchang Formation; (B) Three-dimensional stress state of principal stress in the middle Eocene of Paleogene; (C) Strain ellipse under the direction of NW-SN; (D) Movement status of Eurasian Plate, Tethys tectonic domain and Circum-Pacific tectonic domain; (E) Formation model stereogram.
For the Zhu Ⅰ Depression, the NW-SE extensional stress field acted on the thickened crust with the weak lithosphere. This stress field showed homogeneous extension and a wide deformation range, and exhibited a wide rift extension pattern (Buck, 1991; Liu et al., 2018; Zhou et al., 2022), forming a group of fault basins with half grabens or narrow grabens as structural units. Each half graben was isolated from others and strongly divided (Figures 3A,C), and internal block rotation was obvious (Figure 2). In addition to the northern rift zone of the PRMB, the northern SCS and the South China Continent also developed the same period of late Cretaceous to early and middle Eocene rift basin groups such as the Beibu Gulf Basin, Nanxiong Basin, and Sanshui Basin (Hu, 2019).
The RP1 was the weakest period of Pacific Plate subduction (Engebretson et al., 1985; Pang et al., 2007). It was controlled by the NW-SE regional extensional dynamic background and was dominated by NE-, NEE-, and near-EW-trending basin-controlling faults. Moreover, NWW-trending faults were developed. The intensity of fault activity was the strongest in the NE-trending faults, followed in decreasing order by the NEE-trending faults, the near EW-trending faults, and the NWW-trending faults. The developmental characteristics of basin-controlling faults in the four sags were distinctly different (Figures 1B, 3A, 4a-c). The Enping Sag was mainly controlled by NE- and near-EW-trending faults with high activity rates, such as F1 with an activity rate of up to 270 m/Ma (Figure 4D); The Xijiang Sag was dominated by NE- and NEE-trending faults with an activity rate of approximately 260 m/Ma (Figure 4D), while NWW- and near-EW-trending faults were mainly accommodation faults with relatively low activity rates. However, the Huizhou and Lufeng Sags were dominated by near-EW- and NWW-trending faults with an en echelon distribution in the plane and a tension-torsional feature. Compared to the Enping and Xijiang Sags, the intensity of fault activity was relatively lower, with most of the fault activity rates being less than 150 m/Ma (Figure 4D).
With regard to the developmental characteristics of faults in the study area during the RP1, there were obvious differences in the local extensional directions from west to east. The basin-controlling faults in the western Enping and Xijiang Sags were predominantly NE- and NEE-trending, reflecting a NW-SE direction of local extension, which was consistent with the direction of the regional stress field. However, the eastern Huizhou and Lufeng Sags were dominated by near-EW boundary faults, with a near-N-S direction of local extension (Figures 3, 4). The west-to-east extensional direction was observed to be deflected clockwise, which may have been related to the southeastward flow of the mantle during this period. The Indian plate rapidly moved northwestward and entered into a period of “soft collision” with the Eurasian plate (Zhang, 2012). This collision resulted in the southeastward flow of mantle in eastern Asia, and the direction of mantle flow changed due to the blockage of the eastern Pacific plate. As a result, the extension direction shifted clockwise from west to east.
Under the same stress state, the strike and scale of the pre-existing structural line of the basement had a controlling effect on the sedimentary axis of the caprock in the basin (Figure 13A). Strong extensional activity occurred when the strike of the pre-existing large-scale structure was nearly perpendicular to the direction of tensile stress (nearly parallel to the direction of compressive stress). Such activity resulted in the genesis of boundary faults that controlled the depression, such as fault Fp1. When the strike of the pre-existing large-scale structure and the tensile stress field intersected at a large angle, tensile and torsional activity would occur. Such activity also exerted a certain degree of control over the sag via faults, such as faults Fp2 and Fp8 (Figure 13C).
During the deposition of Members 6 to 2, the Panyu 4 Sag in the Zhu Ⅰ Depression was formed mainly under the action of controlling factors such as NW-SE-oriented tensile stress (σ3) and NE-trending pre-existing structures. Under the influence of NW-SE oriented extension, the activity of the pre-existing faults (such as Fp1) was initiated; this activity was relatively strong, and these pre-existing faults formed boundary faults on the southeast and northwest sides of the depression. The pre-existing fault Fp2 exhibited right-lateral tension and torsional activity, and it controlled deposition. However, the intensity of activity of Fp2 was lower than that of Fp1. Fp8 exhibited left-lateral strike-slip activity, which also weakly controlled deposition. While the main fault was active, a tensile fault was formed that was nearly perpendicular to the tensile stress direction; this tensile fault was parallel to or intersected the main fault at a slight angle. Simultaneously, near-EW-trending accommodation faults developed, such as faults Fp4 and Fp6 (Figure 13E).
During the late Eocene to the early Oligocene (the deposition period of Member 1 to Enping Formation), the Indian Plate collided with and squeezed the Eurasian Plate, resulting in large-scale slippage between the intraplate blocks (Tapponnier et al., 1982; 1986; Ding et al., 2020; Zhang et al., 2021; Guo et al., 2022; Li et al., 2022). The orientation of subduction of the Pacific Plate changed from NNW to NWW, and its convergence with the Eurasian Plate increased (Li and Li, 2007; Shi and Li, 2012; Yao et al., 2011; Hall, 2012; Morley, 2012; Ye et al., 2020; Wang et al., 2021; Li et al., 2022; Figure 14D). This type of dynamical background formed a near-EW-trending compression and a near-SN-trending tension stress system of the Panyu 4 Sag in the Zhu Ⅰ Depression, resulting in a transition of the tectonic framework from a NE orientation to a near EW orientation, thereby entering the RP2.
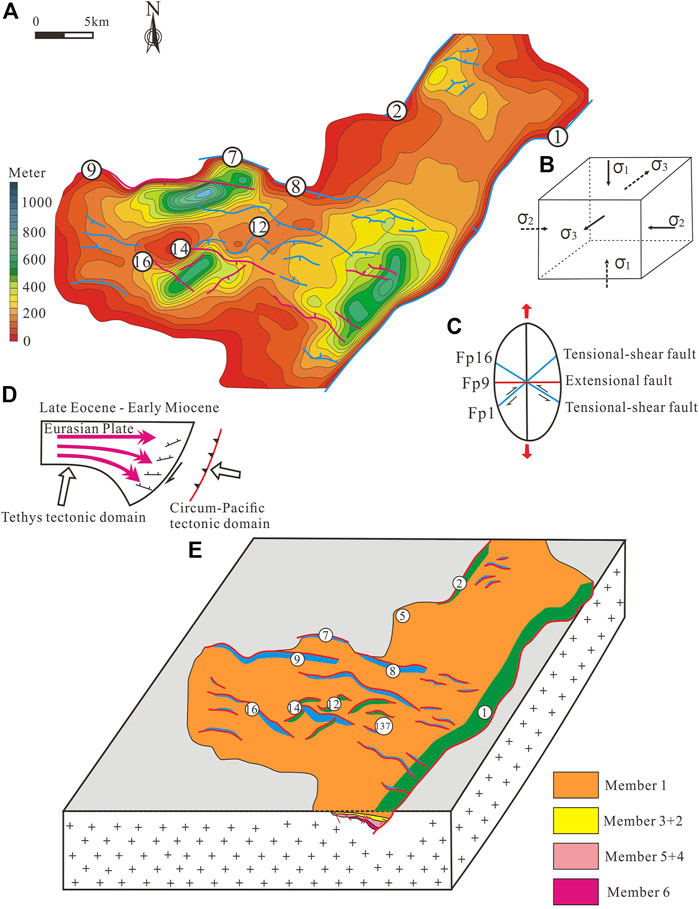
FIGURE 14. (A) The prototype basin of Member 1 in Wenchang Formation; (B) Three-dimensional stress state of principal stress in the late Eocene of Paleogene; (C) Strain ellipse under the direction of N-S; (D) Movement status of Eurasian Plate, Tethys tectonic domain and Circum-Pacific tectonic domain; (E) Formation model stereogram.
The lithospheric structure of the northern rift zone during the RP2 showed a normal, continental margin lithospheric structure that thinned from land (north) to sea (south) (Zhong et al., 2014). Accompanied by crustal thinning and thickening of the lithospheric mantle (Wu et al., 2001), the strength of the lithosphere increased, and extension shifted from a wide rift to a narrow rift pattern under the near N-S tensile stress field (Buck, 1991). Furthermore, the extensional deformation changed from homogeneous to concentrated and migrated southward (crustal thinning site), and the rifting was concentrated in the present-day northern continental margin of the SCS. The northern rift zone exhibited a thinning crustal structure, and the rifting was concentrated. The lithospheric extensional kinematics showed a necking pattern, which led to a weak block rotation during extension (Figure 2). Moreover, the early independent and highly segmented half grabens or narrow grabens were interconnected and underwent expansion, and the basin range was significantly increased (Figure 3D). At the same time, under the action of the near N-S tensional stress field, the Zhu Ⅰ Depression was located at the northern boundary of the stretching action, and the inherited development and strong activity of the earlier margin basin-controlling faults at the northern margin was attributed to the fact that they were pre-existing weak zones with more concentrated stress. As a whole, the fault activity expanded northward and the depocenter migrated northward.
Against the background of near-N-S extension, the fault system underwent transformation. The dominant extension direction was no longer oriented NW-SE, and the activity of the NE- and NEE-trending basin-controlling faults was weakened. The NWW- and near-EW-trending faults, which were previously less active, matched better with the near-N-S extension direction; their activity was enhanced, and they became the main controlling faults. Differences in the prior main basin-controlling faults led to different fault transformation processes in different regions (Figures 3, 4). The activity of the NE-trending F1 in the early stage of the Enping Sag was weakened, and the northeast section died out, whereas the southwest section was inherited and developed, but the activity rate decreased to below 100 m/Ma. The activity of the near-EW-trending F2 increased significantly, reaching about 230 m/Ma, and F2 became the main controlling fault (Figures 3B, 4D). The faults of the Xijiang Sag were primarily inherited, but the activity of the NE-trending F4 and the NEE-trending F3 and F5 tended to weaken during the early development phase, and the rate of fault activity decreased to 10 m/Ma, 150 m/Ma, and 70 m/Ma, respectively, with F3 on the northern boundary being more active than F4 and F5 on the southern boundary. In addition, a series of new near EW-trending faults were emerging in the northern uplift belt (Figures 3B, 4D). The Huizhou and the Lufeng Sags, which were preceded by near EW-trending faults, matched better with the N-S extensional direction, and the intensity of activity was significantly enhanced. The strike of the main basin-controlling faults did not change significantly, but the intensity of fault activity changed alternately. For example, in the western part of Huizhou Sag, the activity rate of the north-south boundary faults changed significantly in an alternate fashion, and the basin morphology showed a reverse wedge superposition. The activity rate of F7 and F8 at the southern boundary, which was more active in the early stage, was significantly lower than 160 m/Ma, whereas the activity rate of F11 at the northern boundary was significantly enhanced and reached 280 m/Ma (Figures 3B, 4D).
Pre-existing structural factors had inherited control effects on deposition. The near-EW-trending pre-existing faults became active and controlled the deposition. Under the action of near-SN-oriented tensile stress, the pre-existing NE-trending faults (such as Fp1 and Fp2) exhibited tensile and torsional activities with increased strengths. Furthermore, the thickness of the depocenter increased (Figures 14A,C).
During deposition of the RP2, the Panyu 4 Sag in the Zhu Ⅰ Depression was formed mainly under the action of controlling factors such as S-N-oriented tensile stress (σ3) and pre-existing structures (Figure 14B). Under the action of S-N-oriented extensional stress, the near-EW- and NE-trending pre-existing faults had inherited activities, forming boundary faults that controlled the depression. The centers of depression were independent of each other and were separated by uplifts. In addition to the main boundary faults, there were near-EW-trending small normal faults, and NE- and NW-trending tension-torsion faults. Some areas (such as Northwestern Sub-sag) exhibited a lack of pre-existing basement faults, so there were only a few inherited faults in the caprock, and only a few small-scale new-generation faults were formed (Figure 14E).
Henstra and Whipp et al. (Whipp et al., 2014; Henstra et al., 2015) proposed that the boundary faults formed during the early rift period (RP1) were likely to reactivate and evolve into basin-controlling faults during the later rift period (RP2), even when there was a slight change in the direction of the stress field. In this paper, we proposed a multi-phase rift structural evolution model based on a study of the Panyu 4 Sag in the Zhu Ⅰ Depression, which suggested the existence of multi-phase rift basins where the direction of extensional stress was deflected; the small faults during the early rift period gradually grew and became connected and finally evolved into a mature boundary fault system, while the boundary faults during the RP2 grew and were resurrected rapidly. These resurrected boundary faults were often large pre-existing faults with near-perpendicular new stress field directions. It could be inferred that these boundary faults were not part of the stress concentration zone during the RP1, although they might have formed the weak zone of the pre-existing basement. They began to rupture under the NW-SE directional extensional stress during the RP1 and were preferentially selected for resurrection during the N-S directional extension and the displacement rapidly reached the maximum. The evolutionary history of the two-phase rift in the study area indicated that fault activity dominated the systematic variability in basin structure and stratigraphic thickness. Firstly, in the IFS of the RP2, EW-trending faults (such as F11, F19, and F20) joined and rapidly expanded into coherent basin-controlling faults, and each fault controlled a unified and large depocenter, exhibiting a “large lake and deep basin” environment (Figure 3D). Secondly, in the IFS of the RP2, the NE-trending basin-controlling faults (such as F1, F3, F4, and F16) were not dominant. Thus, the fault activity was weak, and the depocenters were not obvious, showing gentle topography and exhibiting the characteristics of a “large lake and shallow basin” environment (Figure 3D).
In summary, the structural-sedimentary characteristics of the RP2 formed a sharp contrast with those of the RP1: 1) the faults in the IFS of the RP1 were segmentally active with relatively small displacements, and the lake basin was characterized as a “shallow basin”. However, the large faults in the IFS of the RP2 were rapidly growing and penetrating, with large displacements and strong activities, and the lake basin was rapidly becoming a “deep basin”. 2) the depocenters of the IFS of the RP1 were small and scattered, whereas the depocenters of the IFS of the RP2 were large and uniform. In the multi-phase rift basin with deflection of the extensional stress direction (Figures 3C, 7), the RP2 was often characterized by rapid growth and resurrection of specific boundary faults. The pre-existing faults, which were approximately perpendicular to the direction of the new stress field, were preferentially active, and the displacement reached the maximum rapidly (Figures 3C, 7). The tectonic subsidence was weak in the areas controlled by inactive faults. The above understanding had important theoretical value for the evolution analysis of the PRMB and other multi-phase rift basins.
Based on our interpretation of the seismic data and the results of scaled analogue models, the following conclusions were drawn regarding the evolution and mechanism of the Panyu 4 Sag in the Zhu Ⅰ Depression, PRMB.
(1) The Zhu Ⅰ Depression comprised four fault sets with different strikes, including NNE, NE-NEE, EW, and NWW directions. Most of these faults were syn-rift faults that formed during the Paleogene, whereas others were post-rift faults that formed during the Neogene. The average azimuths of the dominant strike for type Ⅰa, type Ⅰb, and type Ⅱ faults were 75°, 85°, and 90°, respectively. These indicated that the minimum principal stress (σ3) directions in the Zhu Ⅰ Depression during the RP1 and RP2 were SSE (∼165°) and near-EW (∼180°), respectively.
(2) The Panyu 4 Sag in the Zhu Ⅰ Depression undergone three cycles of structural evolution—an early rift period (during the middle Eocene), a late rift period (from the late Eocene to the early Oligocene), and a thermal subsidence period (from the late Oligocene to the middle Miocene).
(3) During the IFS of the RP1, three small and isolated depocenters developed controlled by Fp1 and Fp2. A uniform depocenter formed and migrated from north to south along Fp1 during the SFS and the WFS of the RP1. During the PR2, controlled by Fp7, Fp8, Fp9, and Fp14, several new EW-tending depocenters formed. Analogue modelling of the two phases of anisotropic extension revealed a high degree of correspondence with the natural geological conditions, revealing the evolution process of the Panyu 4 Sag. The structural-sedimentary evolution and analogue modelling results indicated that the Panyu 4 Sag in the Zhu Ⅰ Depression was formed as a superimposed basin under multi-phase anisotropic extension.
(4) The structural evolution of the Panyu 4 Sag in the Zhu Ⅰ Depression since the Paleogene was mainly controlled by the combined effect of the Pacific, Eurasian, and Indian Plates. Since the orientation of subduction of the Pacific Plate changed from NNW to NWW, the stress field mainly shifted from NW-SE-trending tension to S-N-trending tension, which caused the superposition of the late near-E-W-oriented structural pattern on the early NE-oriented structural pattern.
The original contributions presented in the study are included in the article, further inquiries can be directed to the corresponding author.
BG, FY, and HL contributed to conception and design of the study. HL organized the database. BG performed the statistical analysis. BG and FY design and conducted experiments. BG wrote the first draft of the manuscript. FY and HL wrote sections of the manuscript. All authors contributed to manuscript revision, read, and approved the submitted version.
This study was supported by the research project of CNOOC (Shenzhen) (No. SCKY-2020-SZ-21).
We gratefully acknowledge the Shenzhen Branch of the China National Offshore Oil Corporation for providing data used in this study and permission to publish the results.
The authors declare that the research was conducted in the absence of any commercial or financial relationships that could be construed as a potential conflict of interest.
The reviewer JZ declared a shared affiliation with the author(s) to the handling editor at the time of review.
All claims expressed in this article are solely those of the authors and do not necessarily represent those of their affiliated organizations, or those of the publisher, the editors and the reviewers. Any product that may be evaluated in this article, or claim that may be made by its manufacturer, is not guaranteed or endorsed by the publisher.
Brace, W. F., and Kohlstedt, D. L. (1980). Limits on lithospheric stress imposed by laboratory experiments. J. Geophys. Res. Solid Earth 85 (B11), 6248–6252. doi:10.1029/jb085ib11p06248
Buck, W. R. (1991). Modes of continental lithospheric extension. J. Geophys. Res. 96 (B12), 20161–20178. doi:10.1029/91jb01485
Chen, C. M. (2003). Formation condition of tertiary oil/gas reservoirs in Pearl River Mouth basin (east). Beijing: Science Press.
Chen, C. M. (2000). Petroleum geology and conditions for hydrocarbon accumulation in the eastern Pearl River Mouth basin. China Offshore Oil Gas 14, 73–82. (in Chinese with English abstract).
Chen, S., and Pei, C. (1993). Geology and geochemistry of source rocks of the eastern Pearl River Mouth basin, south China sea. J. Southeast Asian Earth Sci. 8, 393–406. doi:10.1016/0743-9547(93)90041-m
Chen, S., Zhang, M., and Zhang, J. (1991). Study on oil and gas generation and exploration in eastern Pearl River Mouth Basin. Oil Gas Geol. 12, 95–106. (in Chinese with English Abstract).
Cheng, S. X., Li, S. Z., Suo, Y. H., Liu, X., Yu, S., Dai, L. M., et al. (2012). Cenozoic tectonics and dynamics of basin groups of the northern South China Sea. Mar. Geol. Quat. Geol. 32, 79–93. (in Chinese with English abstract). doi:10.3724/sp.j.1140.2012.06079
Corti, G., Philippon, M., Sani, F., Keir, D., and Kidane, T. (2013). Re-Orientation of the extension direction and pure extensional faulting at oblique rift margins: Comparison between the main Ethiopian rift and laboratory experiments. Terra nova. 25 (5), 396–404. doi:10.1111/ter.12049
Deng, C., Fossen, H., Gawthorpe, R. L., Rotevatn, A., and Fazlikhani, H. (2017). Influence of fault reactivation during multiphase rifting: The oseberg area, northern North Sea rift. Mar. Petroleum Geol. 86, 1252–1272. doi:10.1016/j.marpetgeo.2017.07.025
Ding, L., Guo, G., Hao, J., Wang, S., Zhu, W., and Liao, Z. (2015). Characteristics of Paleogene source rocks of Wenchang Formation and hydrocarbon potential in Xijiang sag, Zhu I depression. China Offshore Oil Gas 27, 21–26. (in Chinese with English abstract).
Ding, W. W., Sun, Z., Mohn, G., Nirrengarten, M., Tugend, J., Manatschal, G., et al. (2020). Lateral evolution of the rift-to-drift transition in the South China Sea: Evidence from multi-channel seismic data and IODP Expeditions 367&368 drilling results. Earth Planet. Sci. Lett. 531, 115932–116014. doi:10.1016/j.epsl.2019.115932
Dong, S. W., Zhang, Y. Q., Chen, X. H., Long, C. X., Wang, T., Yang, Z. Y., et al. (2008). The formation and deformational characteristics of East Asia multi-direction convergent tectonic system in Late Jurassic. Acta Geosci. Sin. 29 (3), 306–317. (in Chinese with English abstract).
Engebretson, D. C., Cox, A., and Gordon, R. G. (1985). Relative motions between oceanic and continental plates in the pacific basin. Geol. Soc. Am. Special Pap. 206 (9), 1–60.
Franke, D., Savva, D., Pubellier, M., Steuer, S., Mouly, B., Auxietre, J., et al. (2014). The final rifting evolution in the South China Sea. Mar. Petroleum Geol. 58, 704–720. doi:10.1016/j.marpetgeo.2013.11.020
Frankowicz, E., and McClay, K. (2010). Extensional fault segmentation and linkages, Bonaparte Basin, outer North west shelf, Australia. AAPG Bull. 94, 977–1010. doi:10.1306/01051009120
Ge, J. W., Zhu, X. M., Yu, F. S., Brian, G. J., and Wang, T. (2019). Controls of faulting on synrift infill patterns in the Eocene PY4 sag, Pearl River Mouth basin, south China sea. Aust. J. Earth Sci. 66 (1), 111–132. doi:10.1080/08120099.2018.1512524
Ge, J. W., Zhu, X. M., Zhang, X. T., Jones, B. G., Yu, F. S., Niu, Z. C., et al. (2017). Tectono-stratigraphic evolution and hydrocarbon exploration in the Eocene southern Lufeng depression, Pearl River Mouth basin, south China sea. Aust. J. Earth Sci. 64, 931–956. doi:10.1080/08120099.2017.1370613
Guo, B. W., Yu, F. S., Li, H. B., Li, H., Yu, S., and Wu, Z. (2022). Semi-quantitative analysis on reservoir-controlling structural elements of lower Wenchang Formation in southwestern Huizhou sag, Pearl River Mouth basin. China Offshore Oil Gas 34 (6), 34–43.
Guo, B. W., Yu, F. S., Wang, Y. F., Li, H., Li, H. B., and Wu, Z. (2022). Quantitative prediction of palaeo-uplift reservoir control and favorable reservoir formation zones in Lufeng Depression. Adv. Geo-Energy Res. 6 (5), 426–437. doi:10.46690/ager.2022.05.07
Hall, R., 2012. Late jurassic–cenozoic reconstructions of the Indonesian region and the Indian ocean. Tectonophysics 570, 1–41. doi:10.1016/j.tecto.2012.04.021
Henstra, G. A., Rotevatn, A., Gawthorpe, R. L., and Ravnås, R. (2015). Evolution of a major segmented normal fault during multiphase rifting: The origin of plan-view zigzag geometry. J. Struct. Geol. 74, 45–63. doi:10.1016/j.jsg.2015.02.005
Hoshino, K. (1972). Mechanical properties of Japanese tertiary sedimentary rocks under high confining pressures. Geol. Servey Jpn. Rep.
Hu, Y. (2019). basin structure and genetic evolution of the Zhu depression, during the cenozoic, Pearl River Mouth Basin, south China. Geol. J. China Univ. 25 (01), 81–92. (in Chinese with English Abstract).
Huang, C. J., and Hinnov, L. (2014). Evolution of an eocene–oligocene saline lake depositional system and its controlling factors, Jianghan Basin, China. J. Earth Sci. 25 (06), 959–976. doi:10.1007/s12583-014-0499-2
Jiang, H., Pang, X., Shi, H., Liu, L., Bai, J., and Zou, S. (2015). Effects of fault activities on hydrocarbon migration and accumulation in the Zhu I depression, Pearl River Mouth basin, south China sea. Aust. J. Earth Sci. 62, 775–788.
Jiao, Y. Q., Li, S. T., Xie, X. N., and Ren, J. Y. (1997). Manifestation of multistage episodic rifting — take western Pearl River Mouth basin and its peripheral area as an example. Petroleum Geol. Exp. (03), 222–227. (in Chinese with English Abstract).
Korme, T., Acocella, V., and Abebe, B. (2004). The role of pre-existing structures in the origin, propagation and architecture of faults in the Main Ethiopian Rift. Gondwana Res. 7, 467–479. doi:10.1016/s1342-937x(05)70798-x
Koyi, H. A., and Vendeville, B. C. (2003). The effect of décollement dip on geometry and kinematics of model accretionary wedges. J. Struct. Geol. 25 (9), 1445–1450. doi:10.1016/s0191-8141(02)00202-x
Koyi, H. (1997). Analogue modelling: From a qualitative to a quantitative technique—A historical outline. J. Petroleum Geol. 20 (2), 223–238. doi:10.1111/j.1747-5457.1997.tb00774.x
Koyi, H., and Kenneth, P. (1993). Influence of basement faults on the development of salt structures in the Danish basin. Mar. Petroleum Geol. 10 (2), 82–94. doi:10.1016/0264-8172(93)90015-k
Lee, M. J., and Hwang, Y. J. (1993). Tectonic evolution and structural styles of the East shetland basin. London, United Kingdom: Geological Society of London, 1137–1149.
Leyla, B., Ren, J., Zhang, J., and Lei, C. (2015). En echelon faults and basin structure in Huizhou sag, south China sea: Implications for the tectonics of the SE Asia. J. Earth Sci. 26 (5), 690–699. doi:10.1007/s12583-015-0588-x
Li, G., Mei, L. F., Pang, X., Zheng, J. Y., Ye, Q., and Hao, S. H. (2022). Magmatism within the northern margin of the South China Sea during the post-rift stage: An overview, and new insights into the geodynamics. Earth-Science Rev. 225, 103917–103925. doi:10.1016/j.earscirev.2022.103917
Li, H., Yu, F. S., Wang, M., Wang, Y. F., and Liu, Y. L. (2022). Quantitative prediction of structural fractures in the Paleocene lower Wenchang formation reservoir of the Lufeng Depression. Adv. Geo-Energy Res. 6 (5), 375–387. doi:10.46690/ager.2022.05.03
Li, P. L. (1993). Cenozoic tectonic movement in the Pearl River Mouth basin. China Offshore Oil Gas Geol. 7 (6), 11–17. (in Chinese with English abstract).
Li, P. L. (1989). Tectonic structures and evolution of the Pearl River Mouth basin. China Offshore Oil Gas. Geol. 3, 11–18. (in Chinese with English abstract).
Li, P. (1994). Structural features and oil-gas accumulation in Pearl River Mouth basin. Guangdong Geol. 9 (4), 21–28. (in Chinese with English Abstract).
Li, S. Z., Zang, Y. B., Wang, P. C., Suo, Y. H., Li, X. Y., Liu, X., et al. (2017). Mesozoic tectonic transition in South China and initiation of Palaeo-Pacific subduction. Earth Sci. Front. 24 (4), 213–225. (in Chinese with English abstract).
Li, Z. H., and Li, X. H. (2007). Formation of the 1300-km-wide intracontinental orogen and postorogenic magmatic province in mesozoic south China: A flat-slab subduction model. Geology 35 (2), 179–182. doi:10.1130/g23193a.1
Liu, H. L., Mei, L. F., Shi, H. S., Shu, Y., Tian, W., and Ye, Q. (2018). Rift style controlled by basement attribute and regional stress in Zhu I depression. Pearl River Mouth Basin Ear. Sci., 117. (in Chinese with English abstract).
Liu, Y. Q., Wu, Z. P., and Cheng, Y. J. (2019). Spatial and temporal difference of Paleogene rift structure and its controlling factors in the northern south China sea: A case study of Pearl River Mouth basin. J. China Univ. Min. Technol. 48 (2), 367–376. (in Chinese with English Abstract).
Lv, B. F., Yin, Z. X., Cai, Z. X., and Wan, Z. F. (2012). Cenozoic tectonic evolution sequence in northern south China sea and its oil/gas singificance. Acta Geol. Sin. 86 (08), 1249–1261. (in Chinese with English Abstract).
Ma, B. S., Qi, J. F., Chen, W. C., and Zhao, M. (2020). Fault interaction and evolution during two-phase rifting in the Xijiang sag, Pearl River Mouth basin, northern south China sea. Geol. J. 55 (2), 1128–1147. doi:10.1002/gj.3474
Ma, K., Wen, L., Zhang, B. J., Li, Y., Zhong, J. Y., Wang, Y. L., et al. (2022). Segmented evolution of Deyang-Anyue erosion rift trough in Sichuan Basin and its significance for oil and gas exploration, SW China. Petroleum Explor. Dev. 49 (02), 313–326. doi:10.1016/s1876-3804(22)60026-0
McClay, K. R. (1990). Deformation mechanics in analogue models of extensional fault systems. Geol. Soc. Lond. Spec. Publ. 54 (1), 445–453. doi:10.1144/gsl.sp.1990.054.01.40
McKenzie, D. (1978). Some remarks on the development of sedimentary basins. Earth Planet. Sci. Lett. 40 (1), 25–32. doi:10.1016/0012-821x(78)90071-7
Morley, C. K., Haranya, C., Phoosongsee, W., Pongwapee, S., Kornsawan, A., and Wonganan, N. (2004). Activation of rift oblique and Rift parallel pre-existing fabrics during extension and their effect on deformation style: Examples from the rifts of Thailand. J. Struct. Geol. 26, 1803–1829. doi:10.1016/j.jsg.2004.02.014
Morley, C. K. (2012). Late cretaceous–early palaeogene tectonic development of SE Asia. Earth-Science Rev. 115 (1-2), 37–75. doi:10.1016/j.earscirev.2012.08.002
Neng, Y., Wu, J. F., Qi, J. F., Zhang, G. C., He, Y., and Chen, W. C. (2013). Three structural layers and its evolution of cenozoic basins in deep water area of northern margin south China sea. Acta Geol. Sin. 87 (03), 403–414+13. (in Chinese with English Abstract).
Northrup, C. J., Royden, L. H., and Burchfiel, B. C. (1995). Motion of the Pacific plate relative to Eurasia and its potential relation to Cenozoic extension along the eastern margin of Eurasia. Geology 23 (8), 719–722. doi:10.1130/0091-7613(1995)023<0719:motppr>2.3.co;2
Pang, X., Chen, C. M., and Peng, D. J. (2007). The peral river deep-water fan system & Petroleum in south China sea. Beijing: Science Press, 49–50.
Philippon, M., Willingshofer, E., Sokoutis, D., Corti, G., Sani, F., Bonini, M., et al. (2015). Slip re-orientation in oblique rifts. Geology 43 (2), 147–150. doi:10.1130/g36208.1
Pigott, J. D., and Ru, K. (1994). Basin superposition on the northern margin of the South China Sea. Tectonophysics 235, 27–50. doi:10.1016/0040-1951(94)90015-9
Ravnas, R., and Steel, R. J. (1998). Architecture of marine rift basin successions. AAPG Bull. 82, 110–146.
Robinson, C., Elrodl, W., and Bissadak, K. (1998). Petroleum generation, migration, and entrapment in the Zhu 1 depression, Pearl River Mouth basin, south China sea. Int. J. Coal Geol. 37, 155–178. doi:10.1016/s0166-5162(98)00023-8
Shi, H. S., and Li, C. F. (2012). Mesozoic and early Cenozoic tectonic convergence-to-rifting transition prior to opening of the South China Sea. Int. Geol. Rev. 54 (15), 1801–1828. doi:10.1080/00206814.2012.677136
Shi, H. S. (2013). On heterogeneous distribution and differential enrichment by zones of hydrocarbon resources: A case in Zhu I depression. Pearl River Mouth basin. China Offshore Oil Gas 25, 1–576. (in Chinese with English Abstract).
Shu, L. S., Zhou, X. M., Deng, P., and Yu, X. Q. (2006). Principal geological features of Nanling tectonic belt, South China. Geol. Rev. 52 (2), 251–265. (in Chinese with English Abstract).
Sun, Z., Zhou, D., Sun, L., Chen, C., Pang, X., Jiang, J., et al. (2010). Dynamic analysis on rifting stage of Pearl River Mouth basin through analogue modeling. J. Earth Sci. 21 (4), 439–454. doi:10.1007/s12583-010-0106-0
Suo, Y., Li, S., Yu, S., Somerville, I. D., Liu, X., Zhao, S., et al. (2014). Cenozoic tectonic jumping and implications for hydrocarbon accumulation in basins in the East Asia Continental Margin. J. Asian Earth Sci. 88, 28–40. doi:10.1016/j.jseaes.2014.02.019
Tapponnier, P., Peltzer, G., and Armijo, R. (1986). On the mechanics of the collision between India and Asia. Geol. Soc. Lond. Special Publ. 19 (1), 113–157. doi:10.1144/gsl.sp.1986.019.01.07
Tapponnier, P., Peltzer, G., Le dain, A. Y., Armim, R., and Cobbold, P. (1982). Propagating extrusion tectonics in Asia: New insights from simple experiments with plasticine. Geology 10, 611–616. doi:10.1130/0091-7613(1982)10<611:petian>2.0.co;2
Tong, H. M., Koyi, H., Huang, S., and Zhao, H. T. (2014). The effect of multiple pre-existing weaknesses on formation and evolution of faults in extended sandbox models. Tectonophysics 626, 197–212. doi:10.1016/j.tecto.2014.04.046
Wang, P. C., Li, S. Z., Suo, Y. H., Guo, L. L., Santosh, M., Li, X. Y., et al. (2021). Structural and kinematic analysis of cenozoic rift basins in south China sea: A synthesis. Earth-Science Rev. 216, 103522–103529. doi:10.1016/j.earscirev.2021.103522
Weijermars, R., and Harro, S. (1986). Scaling of Newtonian and non-Newtonian fluid dynamics without inertia for quantitative modelling of rock flow due to gravity (including the concept of rheological similarity). Phys. Earth Planet. Interiors 43 (4), 316–330. doi:10.1016/0031-9201(86)90021-x
Whipp, P. S., Jackson, A. L., Gawthorpe, R. L., Dreyer, T., and Quinn, D. (2014). Normal fault array evolution above a reactivated rift fabric: A subsurface example from the northern horda platform, Norwegian North Sea. Basin Res. 26 (4), 523–549. doi:10.1111/bre.12050
Wu, S., Zhou, D., and Qiu, X. (2001). Tectonic setting of the northern margin of south China sea. Geol. J. China Univ. 7 (4), 419–427. (in Chinese with English Abstract).
Wu, X. J., P, X., He, M., Shen, J., and Yan, C. Z. (2014). Structural style and dynamical mechanism during rifting in the passive-continental-margin basins, the northern South China Sea. China Offshore Oil Gas 26 (03), 43–50. (in Chinese with English Abstract).
Xie, H., Zhou, D., Li, Y., Pang, X., Li, P., Chen, G., et al. (2014). Cenozoic tectonic subsidence in deep-water sags in the Pearl River Mouth basin, northern south China sea. Tectonophysics 615-616, 182–198. doi:10.1016/j.tecto.2014.01.010
Xu, M. C., Gao, J. H., Rong, L. X., Wang, G. K., and Wang, X. J. (2010). Seismic analysis of the active character of the Taihang Mountain piedmont fault. Appl. Geophys 7, 392–398. doi:10.1007/s11770-010-0265-x
Yao, B. C., Ling, W., and Wu, N. Y. (2005). Cenozoic tectonic evolution and the 3D structure of the lithosphere of the South China sea. Geol. Bull. China 24 (1), 1–8. (in Chinese with English Abstract).
Yao, B. C., Zhang, L., Wei, Z. Q., Yi, H., Lin, Z., Wan, L., et al. (2011). The Mesozoic tectonic characteristics and sedimentary basins in the eastern margin of South China. Mar. Geol. Quat. Geol. 31 (3), 47–60. (in Chinese with English Abstract). doi:10.3724/sp.j.1140.2011.03047
Ye, Q., Mei, L. F., Shi, H. S., Du, J. Y., Deng, P., Shu, Y., et al. (2020). The influence of pre-existing basement faults on the Cenozoic structure and evolution of the proximal domain, northern south China sea rifted margin. Tect. 39 (3), 1–18. doi:10.1029/2019tc005845
Yu, F. S., and Koyi, Hemin. (2016). Cenozoic tectonic model of the Bohai Bay Basin in China. Geol. Mag. 153 (5-6), 866–886. doi:10.1017/s0016756816000492
Yu, F. S., and Koyi, Hemin. (2017). Theoretical and experimental estimation of geometric relationship of non-parallel conjugate normal faults. Tectonophysics 703, 85–97. doi:10.1016/j.tecto.2017.03.009
Yu, H. (1990). The Pearl River Mouth basin: a rift basin and its geodynamic relationship with the southeastern eurasian margin. Tectonophysics 183, 177–186. doi:10.1016/0040-1951(90)90415-5
Zhang, C., Li, S., Yang, J., Yang, S., and Wang, J. (2004). Petroleum migration and mixing in the Pearl River Mouth basin, south China sea. Mar. Petroleum Geol. 21, 215–224. doi:10.1016/j.marpetgeo.2003.11.010
Zhang, C. M., Sun, Z., Manatschal, G., Pang, X., Li, S. Z., Sauter, D., et al. (2021). Ocean-continent transition architecture and breakup mechanism at the mid-northern South China Sea. Earth-Science Rev. 217, 103620–103718. doi:10.1016/j.earscirev.2021.103620
Zhang, L. (2012). Tectonic evolution of the South China sea and a numerical modeling. Beijing, China: University of Chinese Academy of Sciences (Institute of Oceanology, 15–20.
Zhang, S., Liang, D., Gong, Z., Wu, K., Lie, M., Song, F., et al. (2003). Geochemistry of petroleum systems in the eastern Pearl River Mouth basin: Evidence for mixed oils. Org. Geo-chemistry 34, 971–991. doi:10.1016/s0146-6380(03)00034-2
Zhang, X. B., Xu, X. B., Dong, J., and Shu, L. S. (2009). Deformation record of the change from Indosinian collision related tectonic system to Yanshanian subduction related tectonic system in South China during the Early Mesozoic. Earth Sci. Front. 16 (1), 234–247. (in Chinese with English Abstract).
Zhong, Z. H., Shi, H. S., Zhu, M., Pang, X., He, M., and Zhao, Z. X. (2014). A discussion on the tectonic-stratigraphic framework and its origin mechanism in Pearl River Mouth basin. China Offshore Oil Gas 26 (5), 20–29. (in Chinese with English Abstract).
Zhou, D., Ru, K., and Chen, H. (1995). Kinematics of cenozoic extension on the South China sea continental margin and its implications for the tectonic evolution of the region. Tectonophysics 251 (1), 161–177. doi:10.1016/0040-1951(95)00018-6
Zhou, J., Li, S. Z., Suo, Y. H., Zhang, L., Du, X. D., Cao, X. Z., et al. 2022. NE-Trending transtensional faulting in the Pearl River Mouth basin of the northern south China sea margin. Gondwana Res., 1–16. doi:10.1016/j.gr.2022.02.016
Zhou, X. M., Sun, T., Shen, W. Z., Shu, L., and Niu, Y. (2006). Petrogenesis of mesozoic granitoids and volcanic rocks in south China: A response to tectonic evolution. Episodes 29 (1), 26–33. doi:10.18814/epiiugs/2006/v29i1/004
Zhu, H. T., Yang, X. H., Liu, K. Y., and Zhou, X. (2014). Seismic-based sediment provenance analysis in continental lacustrine rift basins: An example from the Bohai Bay Basin, China. AAPG Bull. 98 (10), 1995–2018. doi:10.1306/05081412159
Zhu, W., Zhang, G., and Gao, L. (2008). Geological characteristics and exploration objectives of hydrocarbons in the northern continental margin basin of South China Sea. Acta Pet. Sin. 29 (1), 1–9. (in Chinese with English Abstract).
Zhu, X. M., Huang, H. D., Dai, Y. D., Zhu, S. F., Tao, W. F., and Liu, C. G. (2014). Study on depositional system and sequence framework of Wenchang Formation in Panyu 4 depression of the Pearl River Mouth basin. Lithol. Reserv. 26, 1–8. (in Chinese with English Abstract).
Keywords: structural evolution, analogue modelling, multi-phase rift basins, Panyu 4 Sag, Zhu Ⅰ Depression, Pearl River Mouth Basin
Citation: Guo B, Yu F and Li H (2023) Structural evolution and mechanism of multi-phase rift basins: A case study of the Panyu 4 Sag in the Zhu Ⅰ Depression, Pearl River Mouth Basin, South China Sea. Front. Earth Sci. 11:1103827. doi: 10.3389/feart.2023.1103827
Received: 21 November 2022; Accepted: 09 March 2023;
Published: 20 March 2023.
Edited by:
Yuan Neng, China University of Petroleum Beijing, ChinaReviewed by:
Jinning Zhang, China University of Petroleum Beijing, ChinaCopyright © 2023 Guo, Yu and Li. This is an open-access article distributed under the terms of the Creative Commons Attribution License (CC BY). The use, distribution or reproduction in other forums is permitted, provided the original author(s) and the copyright owner(s) are credited and that the original publication in this journal is cited, in accordance with accepted academic practice. No use, distribution or reproduction is permitted which does not comply with these terms.
*Correspondence: Fusheng Yu, ZnVzaGVuZ3l1QGN1cC5lZHUuY24=
Disclaimer: All claims expressed in this article are solely those of the authors and do not necessarily represent those of their affiliated organizations, or those of the publisher, the editors and the reviewers. Any product that may be evaluated in this article or claim that may be made by its manufacturer is not guaranteed or endorsed by the publisher.
Research integrity at Frontiers
Learn more about the work of our research integrity team to safeguard the quality of each article we publish.