 Anandh Thankaswamy
 Tao Xian
 Lian-Ping Wang1,2,3*
- 1Southern Marine Science and Engineering Guangdong Laboratory, Guangzhou, China
- 2Guangdong Provincial Key Laboratory of Turbulence Research and Applications, Center for Complex Flows and Soft Matter Research and Department of Mechanics and Aerospace Engineering, Southern University of Science and Technology, Shenzhen, Guangdong, China
- 3Guangdong-Hong Kong-Macao Joint Laboratory for Data-Driven Fluid Mechanics and Engineering Applications, Southern University of Science and Technology, Shenzhen, China
The formation and intensification of typhoons is a complex process where energy and mass exchanges happen between the ocean and the atmosphere. In most typhoon numerical studies, a static ocean and a dynamic atmosphere are used to reduce the complexity of modeling. Using the COAWST model, we studied the air-sea interactions of Typhoon Mujigae in 2015, Typhoon Merbok in 2017, and Typhoon Hato in 2017 over the South China Sea. With different translation speeds, track shapes, and intensities between these cyclones, they act as an excellent case study to analyze the air-sea coupling in the models. The inclusion of coupling between the ocean and atmosphere is found to improve the typhoon track simulation significantly. The bias in the cyclone tracks is reduced by 10%–40% in the coupled model. The upper ocean response to the typhoon was also analyzed using the coupled model output. The coupled simulations show that the major energy extraction occurs to the right of the track, which is consistent with satellite observation and latent heat release analysis. The coupling process shows the air-sea interactions and exchanges in the upper ocean along with the energy released during the passage of typhoons. The heat budget analysis shows that the cooling of the upper ocean is mainly attributed to the advection associated with the typhoon forcing. This study shows that it is necessary to include ocean feedback while analyzing a typhoon, and the application of coupled models can improve our understanding as well as the forecasting capability of typhoons.
1 Introduction
The South China Sea (SCS) is extremely vulnerable to tropical cyclones. Typhoons that pass over SCS have their origins in the northern tropical Pacific Ocean and SCS itself. In the past 70 years of records, typhoons have seen to form throughout the year over the SCS but high intense storms form in the late summer and fall seasons (Zhang et al., 2019; Le Mau et al., 2021). Due to global warming, typhoons over the SCS are expected to decrease in number but the frequency of strong typhoons is expected to increase (Emanuel, 2013; Tsuboki et al., 2015; Tsou et al., 2016; Yao et al., 2021). About 10 typhoons pass over the northwest Pacific making landfall over southern China, Vietnam, and the Philippines every year (Wang et al., 2007; Ma et al., 2021). Generally, tropical cyclones form near the lower latitudes, where the sea surface temperature (SST) is above 26°C (Fisher, 1958). As the waters of SCS remain more than this temperature throughout the year, the sea is always exposed to the formation of tropical cyclones (Herbeck et al., 2011). The strong evaporation over this region results in the formation of stratification layers in the upper ocean (Price, 1981), which impact the energy exchanges and thereby the transfer of heat to the atmosphere (Brister and Emanual, 1998).
Typhoons are one of the most destructive events in nature, which may cause heavy loss of human lives and the economy through strong wind, torrential rain, and storm surges (Adriano et al., 2014; Gettelman et al., 2018). Because of the long coastline and dense population, China is one of the severely affected countries by typhoons (Xiao and Xiao, 2010; Meng et al., 2021; Wang et al., 2021). Analyzing and understanding the development and track of typhoons is a priority so that we can be vigilant when typhoons occur in the future. Improvement of typhoon track forecasting (with a precision of <100 km) has been achieved by increasing the grid resolution, assimilating high-quality observation datasets (Davis et al., 2008), and improving the initial conditions (Done et al., 2004; Wang and Wu, 2004; Gopalakrishnan et al., 2012). However, the development of typhoon intensity forecasting has been rather slow, which is partly attributed to the complex interactions between the upper ocean and atmosphere for typhoon intensification. The upper ocean supplies heat energy and moisture content to the typhoons for their intensification (Emanuel, 1999, 2003). Emanual. (1986) proposed the theory for typhoon intensity estimation based on the surface heat exchange. Modelling and observational studies have showed that the typhoon intensification is accompanied by increases in the sea-to-air latent heat flux (e.g., Bell et al., 2008; Lin et al., 2014; Jaimes et al., 2015; Gao et al., 2017). Numerical models employ various parameterizations to understand the physical processes involved in the sub-grid scale events (Kueh, 2012; Islam et al., 2015; Di et al., 2019; Shen et al., 2019). In most of the numerical analyses of typhoons, the bottom boundary condition (i.e., the status of the upper ocean) is kept static and disconnected from the numerical analysis in the models. This static ocean condition can result in misrepresenting the oceanic thermodynamical forcings acting on a typhoon. The above drawbacks can be overcome by coupling an atmosphere model with a dynamic ocean model.
Coupling atmosphere models with ocean models to improve the numerical simulation of tropical cyclones has been attempted by many scholars. Inaccurate representation of ocean layers can undermine the heat exchange occurring between ocean and atmosphere which can be lessened in a coupled model. Ocean mixed layers are found to influence the intensification of tropical cyclones (Wada et al., 2013) which should be properly included in the numerical modelling. Further, the subsurface oceanic conditions also affect the sea surface temperature (SST) variation under a typhoon condition (Shay et al., 2010; Wada et al., 2014), which can only be analyzed by a coupled ocean-atmosphere model. Using a coupled ocean-atmosphere model improves the understanding of the interactions between oceanic eddies and typhoons (Ma et al., 2013; Anandh et al., 2020). These eddies can also contribute to the intensifications or dissipations of the typhoons depending on their dynamic features.
Using a coupled ocean-atmosphere model, we analyze the impact of sea-air interaction for the accuracy of track and intensity of typhoons for three SCS typhoons with different intensities and translate speeds. With the coupled model, the ocean thermodynamical responses to the typhoon forcing are also investigated through the analysis of latent heat flux as well as the upper 300 m layer during the passage of typhoons.
2 Datasets, models and methodology
2.1 Typhoon description
To analyze the impact of coupling in ocean-atmosphere model for typhoons over the SCS, we have simulated three typhoons with different translation speeds, shapes of track and intensities. The variations in the cyclones are chosen to check the capabilities of the coupled model in simulating typhoons. A brief description of these typhoons is given as follows.
Typhoon Mujigae formed at 12:00 UTC on 30th September 2015 as a tropical depression in the southeast Philippines. It became a tropical cyclone at 12:00 UTC on 1st October and made its first landfall over the Philippines at roughly 20:00 UTC on 2nd October. It further intensified over the SCS as it approached mainland China. The typhoon made landfall in Guangdong province of China at 06:10 UTC on 4th October 2015. During its strongest phase, it had a sustained 10-min wind speed over 160 kmph making it one of the strongest typhoons (category 4; with a wind speed of 17.5–24.5 m/s and a minimum central pressure of 937 hPa) of the year 2015.
Typhoon Merbok formed at 15:00 UTC on 10th June 2017 as a large-scale tropical depression west of Manila, Philippines. It slowly intensified over the SCS, reaching its peak at 12:00 UTC on June 12th with a 10-min sustained wind speed over 100 kmph and a minimum central pressure of 985 hPa. Merbok translated at a speed of 6 m/s, becoming one of the fastest-moving typhoons over the SCS. It made landfall over Shenzhen at 14:00 UTC on 12th June 2017.
Typhoon Hato formed northeast of the Philippines by 03:00 UTC on 20th August 2017. It is one of the strongest and fastest-moving (a translation speed of ∼8 m/s) typhoons over the SCS. It intensified rapidly over the SCS and made landfall near Jinwan, China at 04:50 UTC on 23rd August. At its peak, it had a 10-min sustained wind speed over 160 kmph (a minimum central pressure of 948 hPa) and was classified as a category 3 typhoon.
2.2 Datasets
As for the initial and boundary conditions for the simulations, the atmospheric data are obtained from the European Centre for Medium-Range Weather Forecasts Re-Analysis project (ERA-Interim). The ERA-Interim data has a temporal resolution of 6 h and spatial resolution of 0.75°, which provides necessary parameters (i.e., potential temperature, pressure, wind components, heat fluxes, mixing ratios of water, rain, ice and snow, and surface skin temperature) for initializing and running the WRF model. The oceanic data are obtained from the Estimating the Circulation and Climate of the Ocean version 2 (ECCO2) dataset (Menemenlis et al., 2005, 2008). The ECCO2 data has a temporal resolution of 3 days and spatial resolution of 0.5°. It provides oceanic temperature, salinity, ocean currents, and sea level for the initial and lateral boundary conditions. The bottom boundary of the ocean grid is taken from the Etopo2 bathymetry data.
As for the simulation validation, the Joint Typhoon Warning Center (JTWC) data has been used for the information on the track and intensity of typhoons. The Group for High Resolution Sea Surface temperature (GHRSST) satellite products (Martin et al., 2012) have been used for validation of simulated SST.
2.3 Model configuration
The coupled ocean-atmosphere-wave-sediment transport (COAWST) model (Warner et al., 2010) includes Regional Ocean Modelling System (ROMS) and Weather Research and Forecasting (WRF) modelling system to simulate the ocean and atmosphere status simultaneously. ROMS is a high-resolution stretched terrain-following hydrostatic model (Haidvogel et al., 2000; Shchepetkin and McWilliams, 2005), which solves the momentum and other primitive equations using split-explicit time-stepping schemes over the ocean. Along the horizontal, the model solves the primitive equations on a staggered Arakawa C-grid. A sea/land mask is used to describe the coastal boundaries in the finite discretized grid. WRF is a fully compressible non–hydrostatic model (Skamarock et al., 2019) that solves the primitive equations over a terrain following hydrostatic pressure coordinates and also uses the staggered Arakawa C-grid. For the simulation of atmospheric variables, it also employs various time integration and advection schemes.
The outermost domain of the study is shown in Figure 1 and it ranges from 90°E to 135°E and 2°N to 35°N. The WRF model has an outermost domain with a 36-km horizontal resolution, a middle domain (d02) with a 12-km horizontal resolution, and the innermost domain (d03) with a 4-km horizontal resolution. All domains have 40 vertical levels with the top setting at the 50 hPa pressure level. WRF model utilizes the Rapid and Accurate Radiative Transfer (RRTM) (Mlawer et al., 1997) scheme for the Longwave Radiation estimation and Dudhia Scheme (Dudhia, 1989) for the shortwave radiation calculation. MYNN scheme (Nakanishi and Niino, 2006) is used for the calculations of the planetary boundary layer as recommended by previous studies in wind field simulation. NOAH land surface physics model and Kain-Fritsch cumulus convections scheme (Kain, 2004) are used for the simulations. Morrison 2-moment scheme (Morrison et al., 2009) is employed for estimating cloud microphysics. The ROMS model is configured with a single domain (12 km horizontal resolution and 32 sigma (vertical) levels) which is slightly larger than the outermost domain of WRF. The horizontal and vertical mixing schemes of the model are selected as K-Profile Parameterisation and Large-Maxwell-Doney scheme (Large et al., 1994). The model initialization as well as the lateral boundaries are provided from ERA-Interim and ECCO2 data, that is, interpolated to the model grid resolution. The model bathymetry is provided from the Etopo2 bathymetry data.
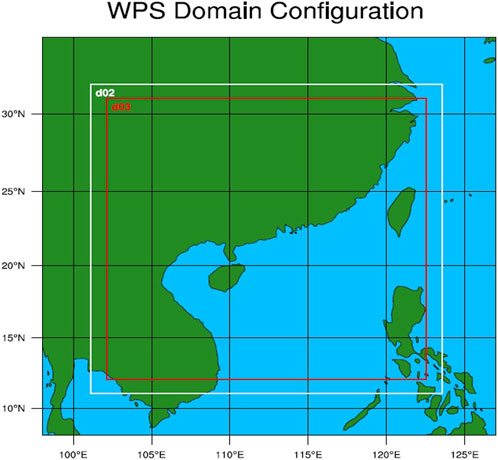
FIGURE 1. WRF domain configuration, showing the two-way nested and the inner most domains.
During the coupling process, the WRF model provides the zonal and meridional wind stress components, radiation, evaporation, and precipitation field to the ROMS model. The ROMS model receives the atmospheric model input every 20 min and computes the surface fluxes of momentum, sensible heat, and latent heat using the COARE (Coupled Ocean-Atmosphere Response Experiment) algorithm (Fairall et al., 2003). The ROMS model provides the sea surface temperature (SST) to the atmosphere model for typhoon simulations. Since both models have different horizontal resolutions, a weighted average intermediary grid is created over each grid to interpolate and transfer the data correctly. Both the coupled model and the standalone WRF model are initiated 1 day in advance of the cyclogenesis and run for 7 days.
2.4 Methodology
Since the eye of typhoon is not a direct output from the model, the typhoon track can be estimated as the movement of the lowest surface pressure between each time steps of simulations. The simulated cyclone tracks are compared with the observation from JTWC, and the deviations from the observation will be analyzed in Section 3.1. The track bias is the distance between the simulated typhoon center (
3 Results and discussions
3.1 Simulated tracks and intensity of typhoons
The simulated typhoon track, wind speed, and central pressure for the selected typhoons from both the coupled ocean-atmosphere model and the standalone WRF model, along with JTWC data, are provided in Figure 2, Figure 3, Figure 4.
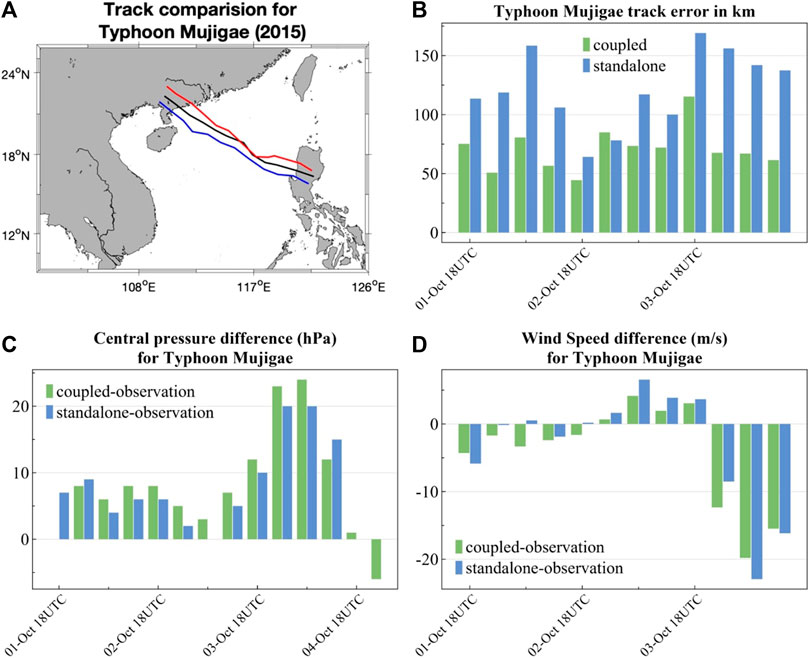
FIGURE 2. (A) The track of Typhoon Mujigae from JTWC observation (blue), the standalone WRF model (red), and the coupled model (black). Time series of (B) the simulated track bias, (C) the central pressure bias, and (D) the wind speed bias.
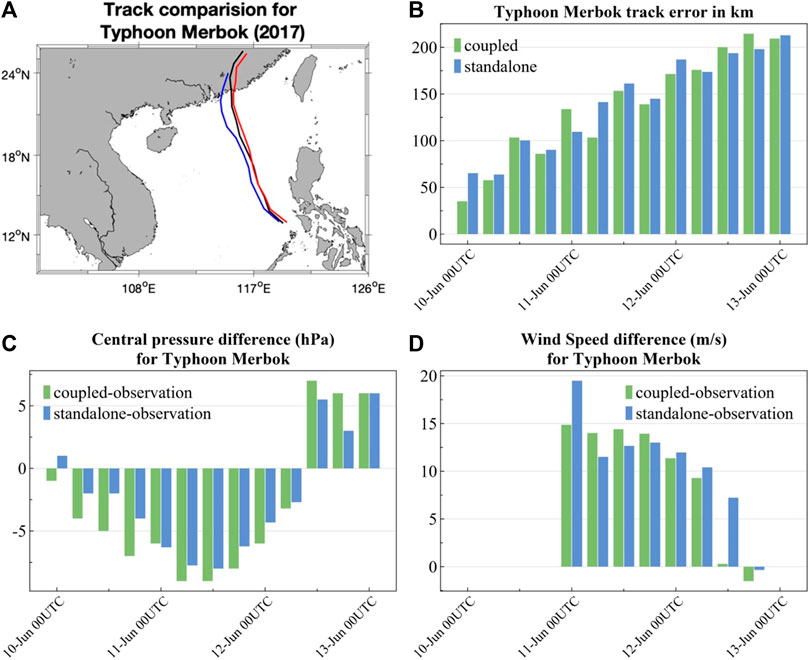
FIGURE 3. Similar to Figure 2 but for typhoon merbok.
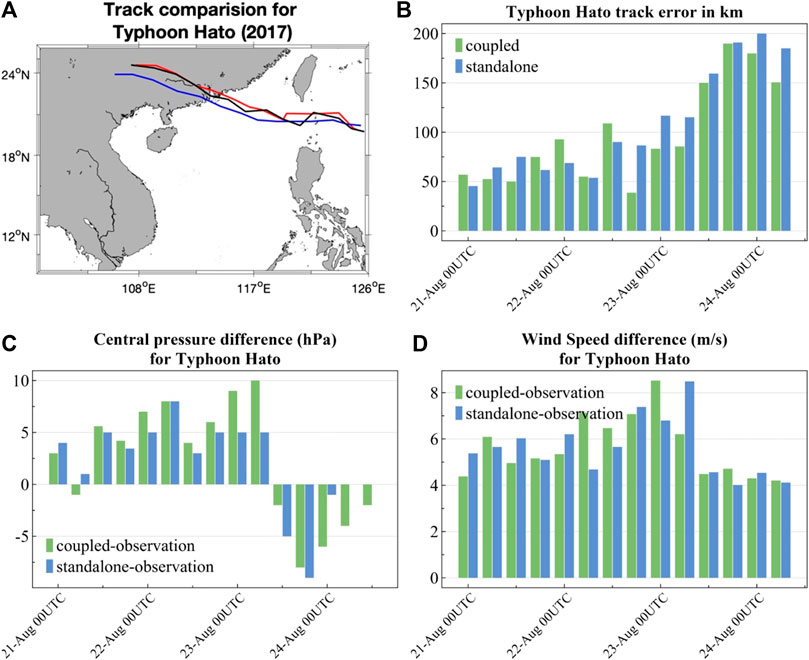
FIGURE 4. Similar to Figure 2 but for typhoon hato.
The depression phase of Typhoon Mujigae started in the Pacific Ocean and it attained the cyclonic form over the Philippines islands. Therefore, the simulated typhoon was initialized over the islands as shown in Figure 2. Compared to the JTWC reported track, the standalone WRF model has an initial bias of 120 km, while the coupled model has a smaller one of 70 km (Figure 2B). Initial bias of the typhoon location can greatly affect the simulated track, which can even cause a significant intensity bias if there is any large thermodynamical pattern (e.g., ocean mesoscale eddies) on the simulated track. In both uncoupled and coupled simulations, the typhoon intensified over the SCS and moved northwestward, with the tracks lying to the north of the observational one. The average track biases are about 120 km for the standalone model and 70 km for the coupled model throughout the simulations which is almost same as the initialization bias. The simulation of tracks has improved up to 40% in the coupled model. The simulations produce a weaker typhoon, with the positive biases in central pressure and the negative biases in maximum wind speed. After 3rd October 2015 (Figures 2C, D), the biases of the simulated central pressure and wind speed increased. These biases can be attributed to the earlier landfall in the simulation, which makes the typhoon lose its intensity earlier than the observation.
Figure 3 shows the atmospheric parameters for Typhoon Merbok. The typhoon originated west of the Philippines and traversed northwards making landfall over mainland China. A typhoon with a translation speed above 20 km/h or 5.6 m/s is considered to be moving fast (e.g., Kim et al., 2020). Merbok was one of the fastest moving typhoons (∼6 m/s) recorded in the SCS and yet the simulated Merbok traversed even faster (∼7 m/s) than observation. The simulated and observational tracks are close to each other in the open sea (Figure 3A), with the initial bias of less than 50 km. The improvement in the track is significant up to 10% in the coupled model. The track biases become larger when the typhoon moved close to the land and made a slight curve at 19°N. The faster and more straight simulated tracks result in an earlier (18–22 h) landfall than the observation, with a 100 km location bias. The higher translational speed of the simulated typhoons resulted in making landfall earlier than the observation and the bias increased rapidly since then. The initial 50-km bias in the track increase to a 200-km bias as the typhoon weakened after landfall in the simulations (Figure 3B). The models produce a stronger typhoon, with a negative central pressure bias and a positive wind speed bias. The bias in the central pressure and wind speed reduced as the simulated typhoon over land lost its intensity (Figures 3C, D). Also, it is noticed that cyclones with a fast translational speed generally cannot get intensified into a strong typhoon as it spends less time over the warmer oceans and gains less energy from the sea-air interaction (Mei et al., 2012).
The validation of atmospheric parameters for Typhoon Hato is shown in Figure 4. Typhoon Hato had its genesis in the Pacific Ocean and moved westwards, and finally made landfall over China. Both the coupled and standalone models are able to capture the genesis spot and reproduce the track. The track biases stay lower than 50 km before landfall on 23rd August 2017 (Figure 4B). The bias of landfall location is less than 25 km in the coupled model but higher (75 km) in the standalone model. After landfall, the simulated typhoons followed a track with a bias of about 150 km from the observed track. Overall, the track error has reduced by 10% in the coupled model when compared to the standalone model. The central pressure biases are within 10 hPa throughout the simulation. The central pressure derived from the coupled model is higher than the standalone model as upper ocean cooling feedback in the coupled model is higher. The coupled model has a better performance in simulating the maximum wind speed, with a slightly lower bias of about 4–6 m/s.
We must confess that the improvement of the intensity simulation is not significant, or even worse. In general, the simulated typhoons have a weaker intensity. This is largely because the sea surface cooling caused by the typhoon will prevent the typhoon from further intensifying, which will be more significant in the coupled model. On the other hand, the validation of simulated intensity is more complicated than that of track simulation, for the development of typhoons in the simulation may be more or less different from the real one due to the model parameterization of subgrid physical processes.
3.2 Sea surface temperature
Previous studies have found that the coupling between ocean and atmosphere induces a substantial sea surface cooling and results in weaker simulated typhoons due to less heat enthalpy in the upper ocean (Zambon et al., 2014; Prakash and Pant, 2017; Guo et al., 2020). The main advantage of using a coupled model in the typhoon analysis is that we can understand the complex energy exchanges between the ocean and atmosphere and how the typhoon reacts to it. The analysis in Section 3.1 shows the coupled model performs better in simulating typhoon activity, so the following analysis will be based on the output from the coupled model.
The simulated SST for the different typhoons from the coupled model is compared with GHRSST satellite observation as shown in Figure 5, Figure 6, Figure 7. Two dates are selected for comparison for each typhoon, with one at which the typhoon genesis and the other of landfall. As the typhoon extracts the energy from the ocean for its intensification, the surface temperature of the ocean decreases. This decrease in SST can be used as a proxy for the energy absorbed by the typhoon.
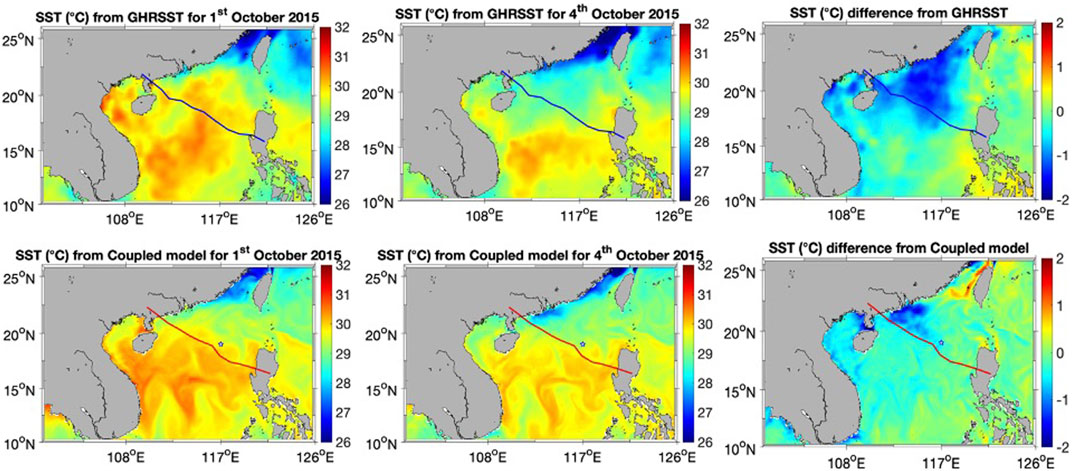
FIGURE 5. The SST change associated with Typhoon Mujigae. SST distribution on the day of (Left) typhoon genesis, and (middle) landfall. (Right) The SST difference between these two dates. (Top) GHRSST satellite data and (bottom) the coupled model output. The star symbols indicate the region of intensification in the coupled model which will be further investigated in Section 3.4.
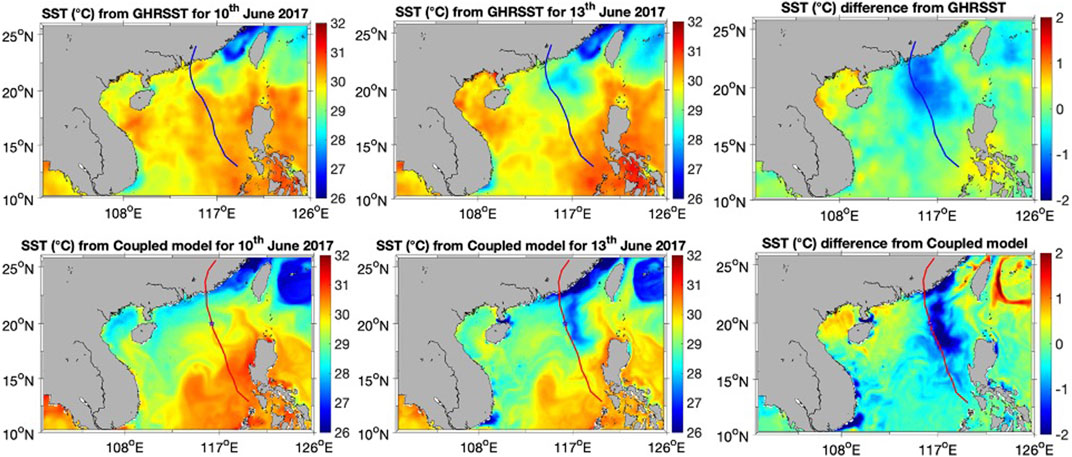
FIGURE 6. Similar to Figure 5 but for typhoon merbok.
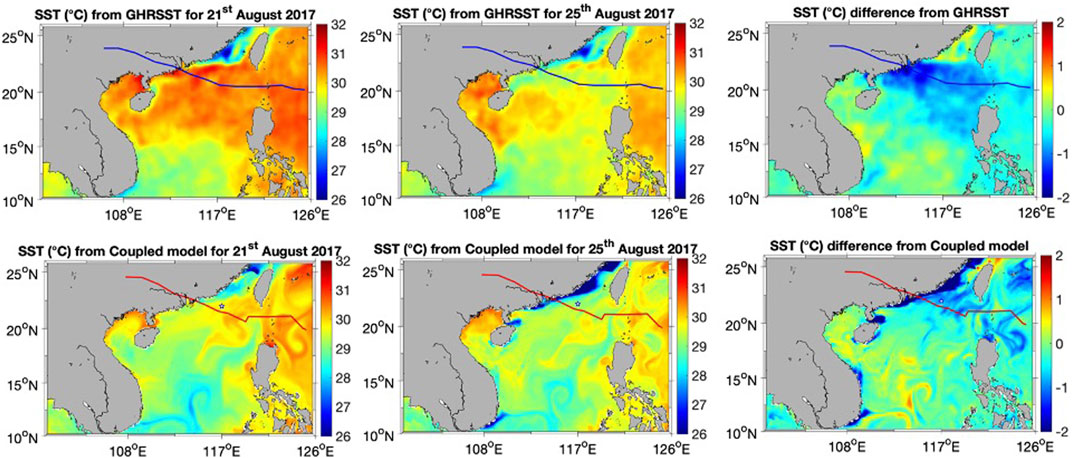
FIGURE 7. Similar to Figure 5 but for typhoon hato.
The SSTs for Typhoon Mujigae derived from the satellite observation and the coupled model are shown in Figure 5. The typhoon started intensifying on 1st October and made landfall on 4th October. In the simulation, there is an initial bias of about 0.25°C on the genesis day over the coastal South China yet the reduction in SST during landfall is captured well. The observed cooling is substantial along the coastal China where the typhoon absorbed heat energy from the ocean before making landfall. This energy transfer has been well captured by the coupled model but to a lesser extent. Observation shows SST cooling up to 2°C, while the coupled model shows up to 1.75°C. The reduction of SST has occurred along the right side of the typhoon track due to the increased Ekman pumping (e.g., Huang and Oey, 2015; Wei et al., 2018).
The SST variations for Typhoon Merbok from observation and simulation are shown in Figure 6. The genesis of Typhoon Merbok occurred on 10th June 2017 and it made landfall on the late night of 12th June 2017. The typhoon dissipated over land on 13th June. The observation shows that the passage of the typhoon over the SCS has reduced the SST up to 1.5°C. The simulated SST cooling is stronger than the observation, with a cooling up to 2°C. The stronger cooling in the simulated SST indicates that the simulated typhoon has absorbed more energy from the ocean surface. In addition, the typhoon moved much faster and made landfall earlier in the simulation.
Figure 7 shows the SST variations of Typhoon Hato from observation and simulations. The satellite observation shows that the SST is higher than 31°C covering the northern SCS, which provides a favorable condition for a typhoon genesis. The temperature difference shows that the SST cooling is above 1°C along the entire track, with the strongest cooling (2°C) near the coast. The coupled model can reproduce the SST cooling along the track and in the coastal region, with a stronger cooling by about 0.25°C (Figure 7).
It is well known that the strongest SST cooling caused by the typhoon, which coincides with the maximum energy extraction, has occurred on the right side of the track due to the strong Ekman pumping rather than on the track due to the strong wind stress (Schade and Emanuel, 1999; Jacob et al., 2000). The substantial cooling in the coupled model can reduce the typhoon intensification due to lower surface energy available for further intensifications.
3.3 Latent heat releasing from ocean surface
The typhoon intensity largely depends on the surface heat exchange (Emanual, 1986; Byran and Rotunno, 2009). Modelling and observational studies have showed that the typhoon intensification is accompanied by increases in the sea-to-air latent heat flux (e.g., Bell et al., 2008; Lin et al., 2014; Jaimes et al., 2015; Gao et al., 2017). Latent heat release in the atmosphere is the main source of energy keeping typhoons active. Latent heat supplies energy to the immense convections that occur in the eyewall and rain bands of the typhoon (Bister and Emanuel, 1998). Initially, a large-scale convection sets over the ocean under the warm upper ocean conditions. As the convection intensifies, it drags on more volume of moisture rich air from the surrounding region. This air rises and cools, thereby condensing the moisture and releasing the latent heat, which further expands the air at the center. This expansion of air creates a low-pressure region and more convergence occurs at the lower levels. This positive feedback intensifies the depression into a cyclone (Craig and Gray, 1996). As long as there is latent heat release and convergence occurs at the lower levels, the cyclone keeps on intensifying. Meanwhile, the heat releases from the upper ocean to the atmosphere, which results a cooling in the ocean surface and a warming the atmosphere boundary layer (Emanuel, 1986; Emanuel et al., 1994; Bister and Emanuel, 1998). Although the vertical mixing and Ekman pumping (Walker et al., 2005; Wada et al., 2009) are important mechanisms of SST cooling under a typhoon, the typhoon-induced heat fluxes can dominate the SST cooling in the near-coastal shallow ocean regions (Shen and Ginis, 2003). By knowing the amount of latent heat released, we can gain a better understanding of typhoon intensity changes and sea surface cooling. The simulated maximum amount of latent heat released from the ocean for all three typhoons ranges from 600 to 700 Wm−2, occurring on the right side of the tracks (Figure 8). This is consistent with the substantial cooling found on the right of the tracks. The extent of higher latent heat release (>300 Wm−2) spreads wider for Mujigae and Hato but was more concentrated for Merbok. The wider spread of latent heat release is the main reason for intensifying these two storms into category 4 and 3 typhoons, respectively.
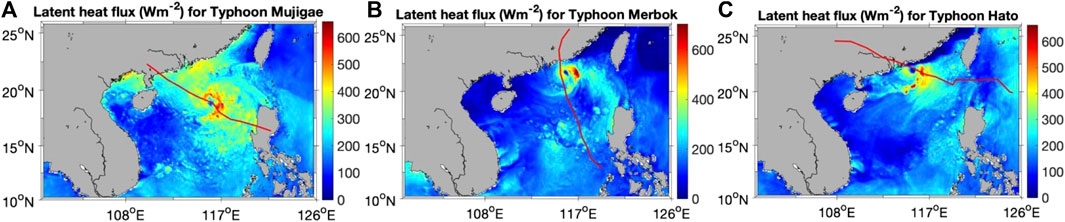
FIGURE 8. Maximum simulated latent heat release from ocean to atmosphere along with the simulated track during the passage of typhoons over the SCS. (A) Typhoon Mujigae, (B) Typhoon Merbok, and (C) Typhoon Hato.
3.4 Ocean mixed layer
The typhoon intensity largely depends on the ocean thermodynamics. The ocean must contain enough energy in the upper layers for typhoon intensification (Prasad and Hogan, 2007; Prakash and Pant, 2017; Zhang, 2022). Besides the high SST, the mixed layer (i.e., isothermal layer) needs to be warm and thick enough to substantially supply energy to the typhoon (Wu et al., 2007; Lin et al., 2008; Anandh et al., 2020) and retain itself under the destruction from typhoon impact (e.g., Lee and Chen, 2014). The simulated upper ocean thermodynamical characteristics (i.e., the temperature, the horizontal and vertical ocean currents) in the region where the typhoons intensified (as shown by star symbols in Figures 5–7) are provided in Figure 9, Figure 10, Figure 11.
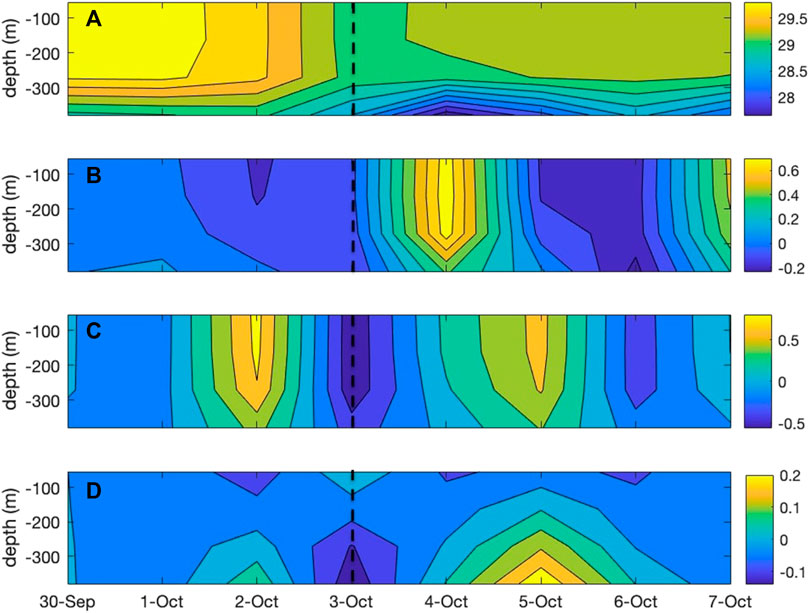
FIGURE 9. Time series of the vertical structure of the upper ocean in the region with maximum latent heat release for typhoon Mujigae. (A) Temperature in °C, (B) zonal velocity in m/s, (C) meridional velocity in m/s, and (D) the scaled vertical velocity in cm/s. Dotted line indicates the intensification date.
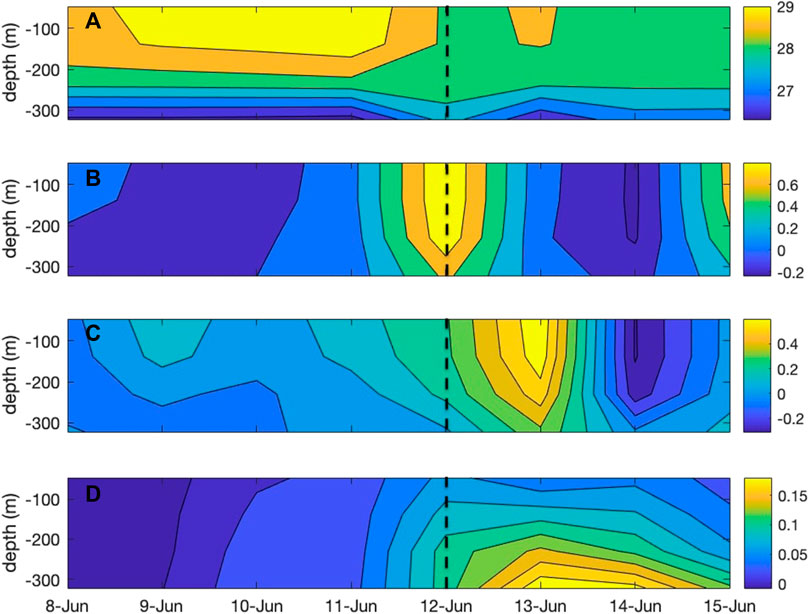
FIGURE 10. Similar to Figure 9 but for typhoon merbok.
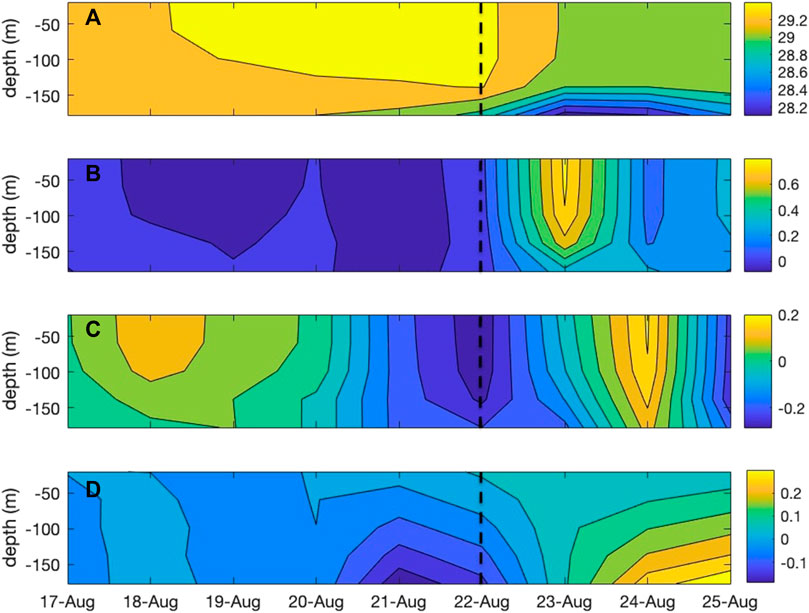
FIGURE 11. Similar to Figure 9 but for typhoon hato.
The upper ocean state during the passage of Typhoon Mujigae is shown in Figure 9. The region of intensification is near 19°N and 117°E. The temperature within the upper 250 m stays above 29°C before typhoon. The typhoon passed over the region on 3rd October (black dashed lines in Figure 9), and its impact can be seen in the substantial variations of the sea surface as well as the layer beneath 300 m. The temperature has reduced up to 1.5°C compared to the previous days. The zonal and meridional surface velocities are shown in Figures 9B,C. The meridional velocity has changed direction in the previous 2 days of the typhoon approach. As the typhoon approached from the south, northward movement of waters is expected. The reversion of the surface current is expected as the typhoon go through the region. The injection of cool waters from the deeper ocean can be seen as the typhoon passed (Figure 9A), which agrees well with the upwelling (Figure 9D). This upwelling is associated with the Ekman pumping caused by the strong typhoon wind stress.
Figure 10 shows the upper ocean state variation for Typhoon Merbok. The region of intensification is near 20°N and 116.25°E. The ocean surface during Typhoon Merbok (black dashed lines in Figure 10) was not as warm as that for Typhoon Mujigae, nor the mixed layer (50–75 m) was deeper. The typhoon came across the region on 12th June 2017, and caused a significant surface cooling up to 1°C (Figure 10A). The upwelling of the cold deeper ocean water was not significant in the temperature variation but can be seen in the vertical velocity field (Figure 10D). The horizontal velocity fields also captured the sudden surge in ocean waters when the typhoon entered this region.
The vertical thermal and dynamical structures of the upper ocean for Typhoon Hato are given in Figure 11 (black dashed lines in Figure 11). The region of intensification is near 22°N and 117°E. The mixed layer was deep (up to 140 m) when the typhoon approached. The typhoon passed over the region on 22nd August 2017 before landfall. The upwelling can be found in both temperature and vertical velocity fields. The temperature has reduced by 1°C as the typhoon passed.
As suggested by Zambon et al. (2014), the local change in temperature can be given by the heat budget equation as follows
where
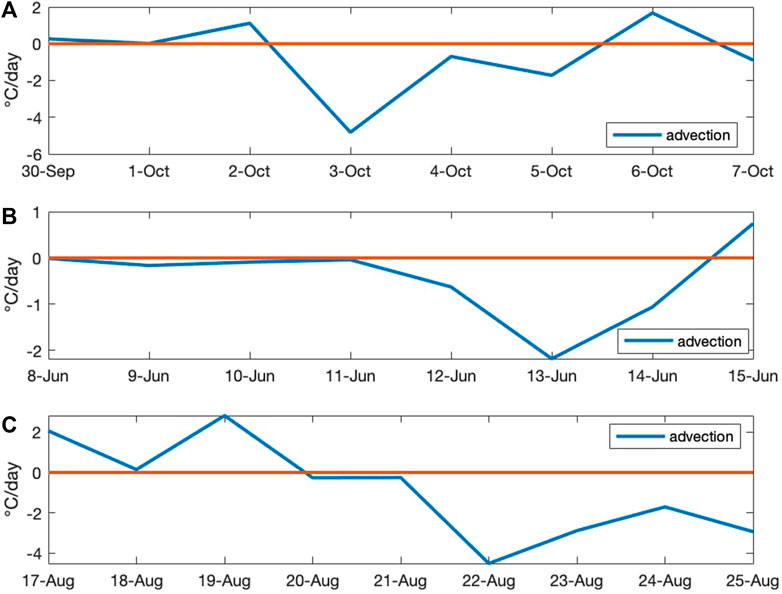
FIGURE 12. Contribution of advection terms to the heat budget averaged over the mixed layer in °C/day for (A) Typhoon Mujigae, (B) Typhoon Merbok, and (C) Typhoon Hato.
4 Discussion and conclusion
South China Sea has a high SST above 26°C throughout the year, which provides a favorable condition for typhoon formation and intensification. Previous numerical studies of typhoons have concentrated on atmospheric dynamics which cannot give a full picture of typhoon development. Here, the results show that the simulated track from the coupled model has improved from the standalone simulations. For Typhoon Mujigae, the track error has reduced up to 40% while for the other two typhoons, the track error has reduced by 10%. Note that the track errors increased during the typhoon’s lifetime, related mainly to the different translation speeds from the simulations and the observations. The coupled simulations produced more accurate translational speeds than the standalone simulations (e.g., Mooney et al., 2019). The coupling between the ocean and atmosphere provides a more physically realistic representation of the interaction between the typhoon and ocean and, consequently, the accuracy of typhoon tracks.
The coupled model can also reproduce the upper ocean response to typhoons, with an SST cooling comparable to the satellite observation. The strongest cooling occurs on the right of the typhoon track. The maximum latent heat release reaching above 600 −Wm−2 can also be found on the right of the track, with a more intense latent heat release found in the stronger typhoon cases. The analysis of the latent heat suggests that the latent heat releasing from the ocean cools the sea surface and intensifies the typhoons. The intense latent heat release region is found to be larger for a slow-moving typhoon and concentrated for a fast-moving typhoon. Although wind-driven vertical mixing is the primary cause of SST cooling under a typhoon (Wada et al., 2009), the typhoon-induced heat fluxes dominate the SST cooling in the near-coastal shallow ocean regions (Shen and Ginis, 2003). The mixed layer analysis of output from the coupled model reveals the upwelling caused by the typhoon passage and the oscillations in zonal and meridional velocities. The well mixing of the ocean as well as the upper ocean cooling is noted in the vertical velocity. The heat budget analysis shows that the cooling of the upper ocean is mainly attributed to the advection associated with the typhoon forcing.
However, the simulation of typhoon intensity has not been improved (or even worse) by the coupled model. This worse performance in the simulation of intensity as well as the SST variation is closely related with the upper ocean thermodynamics. A thick and warm mixed layer can prevent the SST cooling too severe and provide more enthalpy for typhoon intensification. Hereafter, this intensified typhoon triggers a strong advection in the upper ocean, which in return destroys the original mixed layer. Perhaps the advection responses too fast in the strong typhoon cases, which impedes the mixed layer to provide enough energy for the typhoon intensification. Further improvements are needed for upper ocean simulation in order to better simulating the typhoon intensity.
These analyses show that the ocean response is an inevitable part of the numerical analysis of typhoons. The oceanic feedback to the atmosphere can be used to understand how the energy exchanges happen and how the oceanic waters support typhoon development. The coupled ocean-atmosphere models can be a useful tool for typhoon forecasting and analysis.
Data availability statement
The original contributions presented in the study are included in the article/Supplementary Material, further inquiries can be directed to the corresponding authors.
Author contributions
AT: conceptualization, methodology, formal analysis, writing—original draft; TX: resources, writing—original draft, supervision; L-PW: conceptualization, supervision, project administration, funding acquisition. All authors contributed to the article and approved the submitted version.
Funding
This work has been supported by the National Natural Science Foundation of China (42075071, 11988102), Guangdong Provincial Key Laboratory of Turbulence Research and Applications (2019B21203001), Guangdong-Hong Kong-Macao Joint Laboratory for Data-Driven Fluid Mechanics and Engineering Applications (2020B1212030001), and Shenzhen Science and Technology Program (JCYJ20220530113005012, KQTD20180411143441009).
Acknowledgments
Computing resources are provided by the Center for Computational Science and Engineering of Southern University of Science and Technology.
Conflict of interest
The authors declare that the research was conducted in the absence of any commercial or financial relationships that could be construed as a potential conflict of interest.
Publisher’s note
All claims expressed in this article are solely those of the authors and do not necessarily represent those of their affiliated organizations, or those of the publisher, the editors and the reviewers. Any product that may be evaluated in this article, or claim that may be made by its manufacturer, is not guaranteed or endorsed by the publisher.
References
Adriano, B., Gokon, H., Mas, E., Koshimura, S., Liu, W., and Matsuoka, M. (2014). “Extraction of damaged areas due to the 2013 Haiyan typhoon using ASTER data,” in 2014 IEEE Geoscience and Remote Sensing Symposium, Quebec City, QC, Canada, 13-18 July 2014 (IEEE), 2154–2157. doi:10.1109/IGARSS.2014.6946893
Anandh, T. S., Das, B. K., Kuttippurath, J., and Chakraborty, A. (2020). A coupled model analyses on the interaction between oceanic eddies and tropical cyclones over the Bay of Bengal. Ocean. Dyn. 70 (3), 327–337. doi:10.1007/s10236-019-01330-x
Bell, M. M., and Montgomery, M. T. (2008). Observed structure, evolution, and potential intensity of category 5 Hurricane Isabel (2003) from 12 to 14 September. Mon. Weather Rev. 136, 2023–2046. doi:10.1175/2007mwr1858.1
Bister, M., and Emanuel, K. A. (1998). Dissipative heating and hurricane intensity. Meteorology Atmos. Phys. 65 (3), 233–240. doi:10.1007/bf01030791
Bryan, G. H., and Rotunno, R. (2009). Evaluation of an analytical model for the maximum intensity of tropical cyclones. J. Atmos. Sci. 66, 3042–3060. doi:10.1175/2009jas3038.1
Craig, C. G., and Gray, S. L. (1996). CISK or WISHE as the mechanism for tropical cyclone intensification. J. Atmos. Sci. 53, 3528–3540. doi:10.1175/1520-0469(1996)053<3528:COWATM>2.0.CO;2
Davis, C., Wang, W., Chen, S. S., Chen, Y., Corbosiero, K., DeMaria, M., et al. (2008). Prediction of landfalling hurricanes with the advanced hurricane WRF model. Mon. weather Rev. 136 (6), 1990–2005. doi:10.1175/2007MWR2085.1
Di, Z., Gong, W., Gan, Y., Shen, C., and Duan, Q. (2019). Combinatorial optimization for WRF physical parameterization schemes: A case study of three-day typhoon simulations over the northwest Pacific ocean. Atmosphere 10 (5), 233. doi:10.3390/atmos10050233
Done, J., Davis, C. A., and Weisman, M. (2004). The next generation of NWP: Explicit forecasts of convection using the Weather Research and Forecasting (WRF) model. Atmos. Sci. Lett. 5 (6), 110–117. doi:10.1002/asl.72
Dudhia, J. (1989). Numerical study of convection observed during the winter monsoon experiment using a mesoscale two-dimensional model. J. Atmos. Sci. 46 (20), 3077–3107. doi:10.1175/1520-0469(1989)046<3077:nsocod>2.0.co;2
Emanuel, K. A. (1986). An air-sea interaction theory for tropical cyclones. Part I: Steady state maintenance. J. Atmos. Sci. 43, 585–605. doi:10.1175/1520-0469(1986)043<0585:aasitf>2.0.co;2
Emanuel, K. A. (2013). Downscaling CMIP5 climate models shows increased tropical cyclone activity over the 21st century. Proc. Natl. Acad. Sci. 110 (30), 12219–12224. doi:10.1073/pnas.1301293110
Emanuel, K. A., Neelin, J. D., and Bretherton, C. S. (1994). On large-scale circulations in convecting atmospheres. Quart. J. Roy. Meteor Soc. 120, 1111–1143. doi:10.1002/qj.49712051902
Emanuel, K. A. (1999). Thermodynamic control of hurricane intensity. Nature 401 (6754), 665–669. doi:10.1038/44326
Emanuel, K. (2003). Tropical cyclones. Annu. Rev. earth Planet. Sci. 31 (1), 75–104. doi:10.1146/annurev.earth.31.100901.141259
Fairall, C. W., Bradley, E. F., Hare, J. E., Grachev, A. A., and Edson, J. B. (2003). Bulk parameterization of air–sea fluxes: Updates and verification for the COARE algorithm. J. Clim. 16 (4), 571–591. doi:10.1175/1520-0442(2003)016<0571:bpoasf>2.0.co;2
Fisher, E. L. (1958). Hurricanes and the sea-surface temperature field. J. Atmos. Sci. 15 (3), 328–333. doi:10.1175/1520-0469(1958)015<0328:hatsst>2.0.co;2
Gao, S., Zhai, S., Chen, B., and Li, T. (2017). Water budget and intensity change of tropical cyclones over the Western North Pacific. Mon. Weather Rev. 145, 3009–3023. doi:10.1175/mwr-d-17-0033.1
Gettelman, A., Bresch, D. N., Chen, C. C., Truesdale, J. E., and Bacmeister, J. T. (2018). Projections of future tropical cyclone damage with a high-resolution global climate model. Clim. Change 146 (3), 575–585. doi:10.1007/s10584-017-1902-7
Gopalakrishnan, S. G., Goldenberg, S., Quirino, T., Zhang, X., Marks, F., Yeh, K. S., et al. (2012). Toward improving high-resolution numerical hurricane forecasting: Influence of model horizontal grid resolution, initialization, and physics. Weather Forecast. 27 (3), 647–666. doi:10.1175/WAF-D-11-00055.1
Guo, T., Sun, Y., Liu, L., and Zhong, Z. (2020). The impact of storm-induced SST cooling on storm size and destructiveness: Results from atmosphere-ocean coupled simulations. J. Meteorological Res. 34 (5), 1068–1081. doi:10.1007/s13351-020-0001-2
Haidvogel, D. B., Arango, H. G., Hedstrom, K., Beckmann, A., Malanotte-Rizzoli, P., and Shchepetkin, A. F. (2000). Model evaluation experiments in the north atlantic basin: Simulations in nonlinear terrain-following coordinates. Dyn. Atmos. oceans 32 (3-4), 239–281. doi:10.1016/S0377-0265(00)00049-X
Herbeck, L. S., Unger, D., Krumme, U., Liu, S. M., and Jennerjahn, T. C. (2011). Typhoon-induced precipitation impact on nutrient and suspended matter dynamics of a tropical estuary affected by human activities in Hainan, China. Coast. Shelf Sci. 93 (4), 375–388. doi:10.1016/j.ecss.2011.05.004
Huang, S. M., and Oey, L. Y. (2015). Right-side cooling and phytoplankton bloom in the wake of a tropical cyclone. J. Geophys. Res. Oceans 120 (8), 5735–5748. doi:10.1002/2015JC010896
Hsu, J., Lien, R., D’Asaro, E. A., and Sanford, T. B. (2017). Estimates of surface wind stress and drag coefficients in typhoon megi. J. Phys. Oceanogr. 47, 545–565. doi:10.1175/JPO-D-16-0069.1
Islam, T., Srivastava, P. K., Rico-Ramirez, M. A., Dai, Q., Gupta, M., and Singh, S. K. (2015). Tracking a tropical cyclone through WRF–ARW simulation and sensitivity of model physics. Nat. Hazards 76 (3), 1473–1495. doi:10.1007/s11069-014-1494-8
Jacob, S. D., Shay, L. K., Mariano, A. J., and Black, P. G. (2000). The 3D oceanic mixed layer response to Hurricane Gilbert. J. Phys. Oceanogr. 30 (6), 1407–1429. doi:10.1175/1520-0485(2000)030%3C1407:TOMLRT%3E2.0.CO;2
Jaimes, B., Shay, L. K., and Uhlhorn, E. W. (2015). Enthalpy and momentum fluxes during Hurricane Earl relative to underlying ocean features. Mon. Weather Rev. 143, 111–131. doi:10.1175/mwr-d-13-00277.1
Kain, J. S. (2004). The kain–fritsch convective parameterization: An update. J. Appl. meteorology 43 (1), 170–181. doi:10.1175/1520-0450(2004)043<0170:tkcpau>2.0.co;2
Kim, S. H., Moon, I. J., and Chu, P. S. (2020). An increase in global trends of tropical cyclone translation speed since 1982 and its physical causes. Environ. Res. Lett. 15 (9), 094084. doi:10.1088/1748-9326/ab9e1f
Kueh, M. T. (2012). Multiformity of the tropical cyclone wind–pressure relationship in the Western North Pacific: Discrepancies among four best-track archives. Environ. Res. Lett. 7 (2), 024015. doi:10.1088/1748-9326/7/2/024015
Large, W. G., McWilliams, J. C., and Doney, S. C. (1994). Oceanic vertical mixing: A review and a model with a nonlocal boundary layer parameterization. Rev. Geophys 32, 363–403. doi:10.1029/94rg01872
Le Mau, D., Vlasova, G., and Nguyen, D. T. T. (2021). Distribution features of the typhoons in the South China sea. Russ. J. Earth Sci. 21 (1), 1001–1008. doi:10.2205/2020ES000746
Lee, C. Y., and Chen, S. S. (2014). Stable boundary layer and its impact on tropical cyclone structure in a coupled atmosphere–ocean model. Mon. Weather Rev. 142 (5), 1927–1944. doi:10.1175/MWR-D-13-00122.1
Lin, I. I., Pun, I. F., and Lien, C. C. (2014). Category-6 supertyphoon Haiyan in global warming hiatus: Contribution from subsurface ocean warming. Geophys. Res. Lett. 41, 8547–8553. doi:10.1002/2014gl061281
Lin, I. I., Wu, C. C., Pun, I. F., and Ko, D. S. (2008). Upper-ocean thermal structure and the Western North Pacific category 5 typhoons. Part I: Ocean features and the category 5 typhoons’ intensification. Mon. Weather Rev. 136 (9), 3288–3306. doi:10.1175/2008MWR2277.1
Ma, Z., Fei, J., Liu, L., Huang, X., and Cheng, X. (2013). Effects of the cold core eddy on tropical cyclone intensity and structure under idealized air–sea interaction conditions. Mon. weather Rev. 141 (4), 1285–1303. doi:10.1175/MWR-D-12-00123.1
Ma, Z., Zhang, Y., Wu, R., and Na, R. (2021). Statistical characteristics of the response of Sea Surface temperatures to westward typhoons in the South China sea. Remote Sens. 13 (5), 916. doi:10.3390/rs13050916
Martin, M., Dash, P., Ignatov, A., Banzon, V., Beggs, H., Brasnett, B., et al. (2012). Group for high resolution Sea Surface temperature (GHRSST) analysis fields inter-comparisons. Part 1: A GHRSST multi-product ensemble (gmpe). Deep Sea Res. Part II Top. Stud. Oceanogr. 77, 21–30. doi:10.1016/j.dsr2.2012.04.013
Mei, W., Pasquero, C., and Primeau, F. (2012). The effect of translation speed upon the intensity of tropical cyclones over the tropical ocean. Geophys. Res. Lett. 39 (7). doi:10.1029/2011GL050765
Menemenlis, D., Campin, J. M., Heimbach, P., Hill, C., Lee, T., Nguyen, A., et al. (2008). ECCO2: High resolution global ocean and sea ice data synthesis. Mercat. Ocean. Q. Newsl. 31, 13–21.
Menemenlis, D., Fukumori, I., and Lee, T. (2005). Using Green's functions to calibrate an ocean general circulation model. Mon. weather Rev. 133 (5), 1224–1240. doi:10.1175/MWR2912.1
Meng, C., Xu, W., Qiao, Y., Liao, X., and Qin, L. (2021). Quantitative risk assessment of population affected by tropical cyclones through Joint consideration of extreme precipitation and strong wind—a case study of hainan province. Earth's Future 9 (12), 2365. doi:10.1029/2021EF002365
Mlawer, E. J., Taubman, S. J., Brown, P. D., Iacono, M. J., and Clough, S. A. (1997). Radiative transfer for inhomogeneous atmospheres: RRTM, a validated correlated-k model for the longwave. J. Geophys. Res. Atmos. 102 (14), 16663–16682. doi:10.1029/97JD00237
Mooney, P. A., Mulligan, F. J., Bruyère, C. L., Parker, C. L., and Gill, D. O. (2019). Investigating the performance of coupled WRF-ROMS simulations of Hurricane Irene (2011) in a regional climate modeling framework. Atmos. Res. 215, 57–74. doi:10.1016/j.atmosres.2018.08.017
Morrison, H., Thompson, G., and Tatarskii, V. (2009). Impact of cloud microphysics on the development of trailing stratiform precipitation in a simulated squall line: Comparison of one-and two-moment schemes. Mon. weather Rev. 137 (3), 991–1007. doi:10.1175/2008MWR2556.1
Nakanishi, M., and Niino, H. (2006). An improved Mellor–Yamada level-3 model: Its numerical stability and application to a regional prediction of advection fog. Boundary-Layer Meteorol. 119 (2), 397–407. doi:10.1007/s10546-005-9030-8
Prakash, K. R., and Pant, V. (2017). Upper oceanic response to tropical cyclone Phailin in the Bay of Bengal using a coupled atmosphere-ocean model. Ocean. Dyn. 67 (1), 51–64. doi:10.1007/s10236-016-1020-5
Prasad, T. G., and Hogan, P. J. (2007). Upper-ocean response to hurricane ivan in a 1/25 nested gulf of Mexico HYCOM. J. Geophys. Res. Oceans 112 (C4), 04013. doi:10.1029/2006JC003695
Price, J. F. (1981). Upper ocean response to a hurricane. J. Phys. Oceanogr. 11 (2), 153–175. doi:10.1175/1520-0485(1981)011<0153:uortah>2.0.co;2
Schade, L. R., and Emanuel, K. A. (1999). The ocean’s effect on the intensity of tropical cyclones: Results from a simple coupled atmosphere–ocean model. J. Atmos. Sci. 56 (4), 642–651. doi:10.1175/1520-0469(1999)056<0642:toseot>2.0.co;2
Shay, L. K., Ali, M. M., Barbary, D., D’Asaro, E. A., Halliwell, G., Doyle, J., et al. (2010). “Air–sea interface and oceanic influences,” in 7th WMO international workshop on tropical cyclones (IWTC-VII) (St. Gilles Les Bains, La Réunion, France: World Meteor Org). Avaliable At: http://www.wmo.int/pages/prog/arep/wwrp/tmr/otherfileformats/documents/1_3.pdf (Accessed August 20, 2021).
Shchepetkin, A. F., and McWilliams, J. C. (2005). The regional oceanic modeling system (ROMS): A split-explicit, free-surface, topography-following-coordinate oceanic model. Ocean. Model. 9 (4), 347–404. doi:10.1016/j.ocemod.2004.08.002
Shen, W., and Ginis, I. (2003). Effects of surface heat flux-induced sea surface temperature changes on tropical cyclone intensity. Geophys Res. Lett. 30 (18), 1933. doi:10.1029/2003GL017878
Shen, W., Song, J., Liu, G., Zhuang, Y., Wang, Y., and Tang, J. (2019). The effect of convection scheme on tropical cyclones simulations over the CORDEX East Asia domain. Clim. Dyn. 52 (7), 4695–4713. doi:10.1007/s00382-018-4405-y
Skamarock, W. C., Klemp, J. B., Dudhia, J., Gill, D. O., Liu, Z., Berner, J., et al. (2019). A description of the advanced research WRF model version 4. Boulder, CO, USA: National Center for Atmospheric Research, 145. doi:10.5065/1dfh-6p97
Tsou, C. H., Pei-Yu, H., Tu, C. Y., Cheng-Ta, C., Tzeng, T. P., and Cheng, C. T. (2016). Present simulation and future typhoon activity projection over Western north pacific and taiwan/east coast of China in 20-km HiRAM climate model. TAO: Terrestrial. Atmos. Ocean. Sci. 27 (5), 6. doi:10.3319/TAO.2016.06.13.04
Tsuboki, K., Yoshioka, M. K., Shinoda, T., Kato, M., Kanada, S., and Kitoh, A. (2015). Future increase of supertyphoon intensity associated with climate change. Geophys. Res. Lett. 42 (2), 646–652. doi:10.1002/2014GL061793
Wada, A., Cronin, M. F., Sutton, A. J., Kawai, Y., and Ishii, M. (2013). Numerical simulations of oceanic pCO2 variations and interactions between Typhoon Choiwan (0914) and the ocean. J. Geophys. Res. Oceans 118 (5), 2667–2684. doi:10.1002/jgrc.20203
Wada, A., Niino, H., and Nakano, H. (2009). Roles of vertical turbulent mixing in the ocean response to Typhoon Rex (1998). J. Oceanogr. 65, 373–396. doi:10.1007/s10872-009-0034-8
Wada, A., Uehara, T., and Ishizaki, S. (2014). Typhoon-induced Sea surface cooling during the 2011 and 2012 typhoon seasons: Observational evidence and numerical investigations of the sea surface cooling effect using typhoon simulations. Prog. Earth Planet. Sci. 1 (1), 11–25. doi:10.1186/2197-4284-1-11
Walker, N. D., Leben, R. R., and Balasubramanian, S. (2005). Hurricane-forced upwelling and chlorophyll a enhancement within cold-core cyclones in the Gulf of Mexico. Geophys Res. Lett. 32, 23716. doi:10.1029/2005GL023716
Wang, G., Su, J., Ding, Y., and Chen, D. (2007). Tropical cyclone Genesis over the South China sea. J. Mar. Syst. 68, 318–326. doi:10.1016/j.jmarsys.2006.12.002
Wang, K., Yang, Y., Reniers, G., and Huang, Q. (2021). A study into the spatiotemporal distribution of typhoon storm surge disasters in China. Nat. Hazards 108 (1), 1237–1256. doi:10.1007/s11069-021-04730-9
Wang, Y. Q., and Wu, C. C. (2004). Current understanding of tropical cyclone structure and intensity changes–a review. Meteorology Atmos. Phys. 87 (4), 257–278. doi:10.1007/s00703-003-0055-6
Warner, J. C., Armstrong, B., He, R., and Zambon, J. B. (2010). Development of a coupled ocean–atmosphere–wave–sediment transport (COAWST) modeling system. Ocean. Model. 35 (3), 230–244. doi:10.1016/j.ocemod.2010.07.010
Wei, J., Liu, X., and Jiang, G. (2018). Parameterizing sea surface temperature cooling induced by tropical cyclones using a multivariate linear regression model. Acta Oceanol. Sin. 37 (1), 1–10. doi:10.1007/s13131-018-1153-0
Wu, C. C., Lee, C. Y., and Lin, I. I. (2007). The effect of the ocean eddy on tropical cyclone intensity. J. Atmos. Sci. 64 (10), 3562–3578. doi:10.1175/JAS4051.1
Xiao, F., and Xiao, Z. (2010). Characteristics of tropical cyclones in China and their impacts analysis. Nat. Hazards 54 (3), 827–837. doi:10.1007/s11069-010-9508-7
Yao, C., Xiao, Z., Yang, S., and Luo, X. (2021). Increased severe landfall typhoons in China since 2004. Int. J. Climatol. 41, E1018–E1027. doi:10.1002/joc.6746
Zambon, J. B., He, R., and Warner, J. C. (2014). Investigation of hurricane Ivan using the coupled ocean–atmosphere–wave–sediment transport (COAWST) model. Ocean. Dyn. 64 (11), 1535–1554. doi:10.1007/s10236-014-0777-7
Zhang, C., Hu, C., Huang, G., Yao, C., Zheng, Z., Wang, T., et al. (2019). Perspective on landfalling frequency and Genesis location variations of southern China typhoon during peak summer. Geophys. Res. Lett. 46 (12), 6830–6838. doi:10.1029/2019GL083420
Keywords: typhoons, coupled modelling, South China Sea, air-sea interactions, latent heat
Citation: Thankaswamy A, Xian T and Wang L-P (2023) Typhoons and their upper ocean response over South China Sea using COAWST model. Front. Earth Sci. 11:1102957. doi: 10.3389/feart.2023.1102957
Received: 19 November 2022; Accepted: 09 June 2023;
Published: 19 June 2023.
Edited by:
Lynn Donelson Wright, William & Mary’s Virginia Institute of Marine Science, United StatesCopyright © 2023 Thankaswamy, Xian and Wang. This is an open-access article distributed under the terms of the Creative Commons Attribution License (CC BY). The use, distribution or reproduction in other forums is permitted, provided the original author(s) and the copyright owner(s) are credited and that the original publication in this journal is cited, in accordance with accepted academic practice. No use, distribution or reproduction is permitted which does not comply with these terms.
*Correspondence: Tao Xian, eGlhbnRAc3VzdGVjaC5lZHUuY24=; Lian-Ping Wang, d2FuZ2xwQHN1c3RlY2guZWR1LmNu