
95% of researchers rate our articles as excellent or good
Learn more about the work of our research integrity team to safeguard the quality of each article we publish.
Find out more
ORIGINAL RESEARCH article
Front. Earth Sci. , 25 January 2023
Sec. Environmental Informatics and Remote Sensing
Volume 11 - 2023 | https://doi.org/10.3389/feart.2023.1101848
This article is part of the Research Topic Evaluation, Projection, and Prevention of Dynamic Geological Disasters: Advances and Applications of Geophysical Methods and Numerical Modeling View all 6 articles
 Rehan Khan1,2
 Yanmei Zhong3,4
 Huan Li1*Yousef A. Al-Masnay5Ihtisham ul Haq5
 Musa Khan1
 Haris Faheem1
 Rashid Ali6
Land surface deformation can severely damage socioeconomic living conditions around the world. This study aimed to identify the Shaziba landslide and further assess deformation activities in Enshi city. For this purpose, the sentinel-1 C-bands data acquired in ascending directions were processed with Sentinel Application Platform and Stanford Method for Persistent Scatterers (StaMPS) software packages. Our results revealed the location of a landslide that occurred on 21 July 2020 in the Shaziba area, Enshi Prefecture. More interesting deformation results were found in Enshi city for the first time with a deformation range from −51.6 to 54.2 mm/year. We conducted a thorough observation of different urban infrastructures such as commercial and residential buildings, roads, bridges, and airports in Enshi city and along the Qingjiang River to evaluate land surface deformation. Observations revealed that there are a number of influencing factors contributing to disturbing the natural environment and resources in Enshi Prefecture. Of these influencing factors, intensive rainfall is a major cause as are the infiltration of rainfall into the subsurface Silurian strata together with the load of infrastructure in the study area. If this issue is not addressed it could lead to devastating geo-hazard disasters in the future. Scientific approaches to determine various causes of frequent geo-hazards in this region are of great significance for developing early warning systems for disasters and ensuring the safety of residents’ lives and property.
Globally, land surface deformation is a serious issue in major urban areas including Mexico, Beijing, Shanghai, Tianjin, and Wuhan, etc. It can severely influence the socioeconomic conditions of the people living there (Erkens & Sutanudjaja, 2015). Major influencing factors causing land surface deformation include certain natural (intensive rainfall, geological setting, hydrogeology, earthquake, etc.) and anthropogenic activities (urban growth, excessive extraction of groundwater (Carnec & Fabriol, 1999), as well as underground construction and mining (Roque et al., 2014; Xu et al., 2016). All these factors directly or indirectly disturb the natural environment and natural resources of an area, which has a devastating impact on people’s lives. The landslides triggered by intensive rainfall over an area or precipitation infiltration to subsurface geology and the integration of rainfall data with deformation data for predicting landslides are thus hot topics for the scientific community (Casagli et al., 2017; Zhao & Lu, 2018; Salcedo-Sanz et al., 2020).
It has been reported that the western and central regions of China experienced more precipitation from May to July 2020 than had annually occurred previously, which triggered a number of geo-hazards (Shaziba, Mazhe Village, Enshi City, Hubei Province on 21 July) in these regions (Wei et al., 2020). A landslide occurred on the bank of the Qinjiang River ∼6 km northwest of Enshi City (Xue et al., 2022). The debris from the landslide blocked the Qingjiang River and formed a large landslide dam, which posed a serious risk to the safety of communities living along the Qingjiang River and Enshi city downstream. A prompt early warning response from local emergency services helped to evacuate people safely from areas where there was a risk and avoid casualties at the event place (Wei et al., 2020).
In the past, remote sensing has played a crucial role in providing information related to geo-hazards (Shi et al., 2016; W; Yang et al., 2020; Zhong et al., 2020). When using remote sensing methods, the Synthetic Aperture Radar (SAR) has advantages over other traditional methods due to its short revisiting time and the fact that it is not interrupted by climatic conditions (Khan et al., 2021; Xue et al., 2022). Thus, it is extensively used in monitoring and analyzing and monitoring land surface deformation, landslides, and glaciers globally (Khan et al., 2021; Q; Yang et al., 2018; W; Yang et al., 2020). The measurement of surface deformation based on the InSAR methods can provide information about the ground surface with centimeter- and at times, millimeter-level precision and accuracy (Argnani et al., 2016; Bianchini et al., 2018; Lee et al., 2019; Ali et al., 2020) (Argnani et al., 2016; Bianchini et al., 2018; Lee et al., 2019; Ali et al., 2020). A number of previous studies have used the Differential SAR Interferometry (DInSAR) method, which was significantly applied to measure land surface deformation (Goldstein et al., 1988; Mestre-Quereda et al., 2018; Poreh & Pirasteh, 2020; Saralioglu, 2022). However, the conventional DInSAR technique has some shortcomings, including orbital errors, atmospheric errors, and temporal and spatial correlation distortion. To overcome the limitations of the DInSAR technique, the persistent Scatterers InSAR (PS-InSAR) method was proposed (Ferretti et al., 2001; Prati et al., 2010). To modify the measurement accuracy of surface deformation in conventional InSAR, the PS-InSAR practices certain features of anomalies were initiated due to the atmospheric delay and backscattering of some Persistent Scatterers (PS) on the land surface (Hang et al., 2017; Khan et al., 2021; Makabayi et al., 2021). The PS-InSAR can be used in regional and large-scale area research and this method provides measurements of surface deformation with accuracy up to millimeter precision (Kim et al., 2007; Wasowski et al., 2008; Prati et al., 2010; Ali and Pan 2021; Wang et al., 2018) (Kim et al., 2007; Wasowski et al., 2008; Prati et al., 2010; Ali and Pan 2021; Wang et al., 2018). Hooper (2010) took initiative by using the PS-InSAR method and developed the StaMPS (Stanford Method for Persistent Scatterers) technique (Hooper et al., 2004). The principle of this method is to determine more stable PS points based on phase and amplitude, in which the PS points provide information about the Earth’s surface in the StaMPS method without any disturbance caused by climate, atmospheric errors, and minor fluctuations in the satellite’s angle. Additionally, the PS-InSAR method provides more PS points in urban areas with more infrastructures developed, such as residential or commercial buildings, bridges, metallic objects, and roads, etc., and also some other land cover types such as bare land or landslide, etc (Khan et al., 2021; Saralioglu, 2022).
Although landslide analysis of the Shaziba area has previously been undertaken earlier using the remote sensing method (Xue et al., 2022), less attention has been paid to assessing the deformation activities in Enshi city and its surrounding areas. Thus, this study primarily intends to identify the Shaizba landslide location by employing the DInSAR method and extending our study to assess the land surface deformation in Enshi city and along the Qinjiang River by using the PS-InSAR method. For this purpose, sentinel-1 open source data were processed with Sentinel Application Platform (SNAP) and Stanford Method for Persistent Scatterers (StaMPS) were used for the first time to assess land surface deformation in Enshi city and its surrounding regions. Here we also intend to integrate DInSAR and PS-InSAR approaches to identify a landslide that occurred on 21 July 2020 in the Shaziba area and further analyze the deformation activities around Enshi city from 2 November 2019 to 21 September 2020. Finally, a dedicated assessment was performed to highlight deformation in various locations within the study area, such as residential and commercial buildings, bridges and roads, etc.
The study area is located at longitude 109°20′0″E, and latitude north 30°23′0"(Figure 1), southwest, Hubei, China. Enshi city has a humid subtropical monsoon climatic condition; usually, the rate of precipitation in winter is less than in summer. It has been reported that in June 2020 this area experienced the Plum Rainy Season, including unusual continuous intensive precipitation. The recorded cumulative and daily rainfall data from 2010 to 2020 was obtained from the Meteorological station of Enshi city (Shen et al., 2021). Historical rainfall records showed that from June to July 2020 the rainfall reached 979 mm, which is 2.3 times more than in 2010–2020 (423.4 mm) during the same period. On other hand, on 7 July 2020, the daily precipitation reached 191.6 mm, highlighting the highest precipitation record since 1961 (Xue et al., 2022). Thus, significantly influencing the deformation and landslide events in the mountainous region in western Hubei. According to statistics from the Department of Land and Resources, the surrounding Sichuan Province (including Chongqing Municipality), Hunan Province, and the Shenlongjia forest area, there was a high incidence of landslide disasters. This indicates that the Enshi Prefecture area, which is located between these areas, is prone to more landslide disasters (Shen et al., 2021).
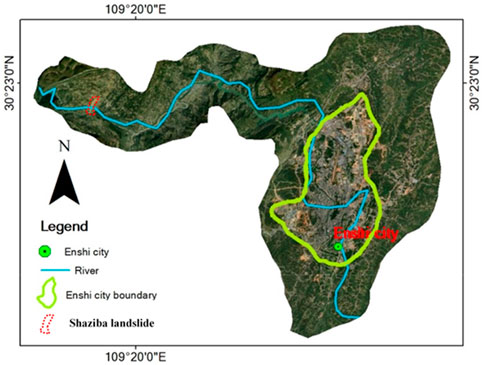
FIGURE 1. Geographic map of the study area.
The study area is largely covered by the Silurian strata and the Badong strata. The former strata contain quartz sandstone with interbedded shales while the latter strata mostly contain silty mudstone (Shen et al., 2021). The major part of the Shaziba landslide bedrock is composed of quartz sandstone interbedded shale from Silurian strata, which is considered to be easily erodible. The debris from the Shaziba landslide largely contains Quaternary silty clay and a few boulders (Shen et al., 2021; Song et al., 2021). The quaternary deposits are extensively distributed over the study area. The lower stratum is Silurian quartz sandstone interbedded shale, with a clay mineral content of up to 40% (Zeng et al., 2013). The landslide was mainly developed in loose deposits of Quaternary overburden. Such geological and topographical features provide rich materials and conditions for frequent geological disasters in this area (Jie et al., 2010; 2010; Eldin et al., 2013; Miao et al., 2019).
Since the landslide occurred on 21 July 2020 in the Shaziba region, our study used the DInSAR method, examining deformation phenomena along this region including the Qiniang River and Enshi City, Hubei, China. For this purpose 25 C-band Single Look Complex (SLC) sentinel-1 products were acquired in Interferometric Wide (IW) acquisition mode from 2 November 2019 to 21 September 2020 (Table 1). All these images were acquired in ascending direction with VV polarization. The SNAP software was used for DInSAR analysis and the StaMPS software package was used for PS-InSAR (Hooper et al., 2004; Cian et al., 2019; Saralioglu, 2022).

TABLE 1. Dataset information about the study area.
Our data processing involved two methods (DInSAR and PS-InSAR) (Figure 2), with each step for preprocessing our SAR data are described in detail here.
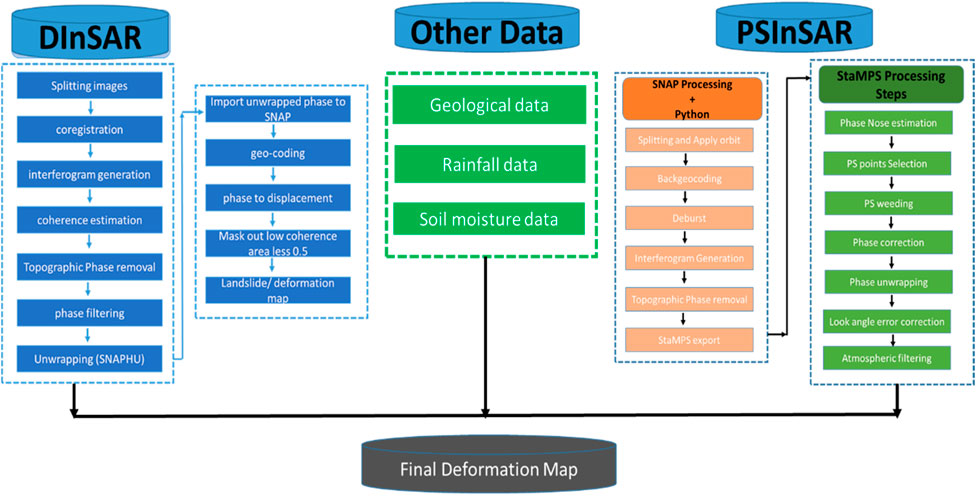
FIGURE 2. Simple processing steps flowchart.
The main steps in DInSAR processing involve: splitting images, coregistration, interferogram generation, coherence estimation, debursting, topographic phase removal, phase filtering, exporting the phase filtered result for unwrapping in Measurable Cost, using the Network-Flow Algorithm for Phase Unwrapping (SNAPHU) software, importing unwrapped phase to SNAP, geo-coding, phase to displacement, and masking out low coherence areas of less .5 (Thomas, 2021). The principle of SAR interferometry is to consider one image as a master image while the other image is a slave image (Thomas, 2021). In our case, we have used the first image as a master image and the second image as a slave image to keep the short temporal baseline.
In PS-InSAR processing, the python scripts were initially used to undertake preprocessing including:
1) Sorting slave images, corresponding to their acquisition time.
2) Slave splitting and updating the orbits (precise).
3) Coregistration and interferogram generation per slave and subswath (IW2 in our case).
4) Finally, each pair of coregistered stack and interferogram were exported to StaMPS.
The main steps involved in processing StaMPS in Matlab are:
At first, the ingestion of SNAP exports into StaMPS using a specific script, called mt_prep_snap, available in the distribution (Foumelis et al., 2018; Blasco et al., 2019; Mancini et al., 2021; Saralioglu, 2022). The StaMPS PSI processing chain from step one to seven are described below (Mancini et al., 2021). The script is launched over the dataset to extract sensor and acquisition parameters, detect initial PS candidates, and extract data (phase, height, etc.) over those points. Because SNAP outputs both SLCs and differential interferograms as binary raster files, the StaMPS handle them right during ingestion. The pixels selected have an amplitude dispersion of .25, where amplitude dispersion represents the ratio of amplitude standard deviation to mean amplitude. To make it faster, we divided the area in the interferogram into overlapping patches, with each patch processed independently for the first one to five steps.
1) Phase noise estimation: Temporal coherence was calculated by subtracting the spatially correlated phase. We then estimated the spatially uncorrelated DEM error and subtracted it from the remaining phase. Eventually, the residual phase was used to estimate temporal coherence. During this step, we estimated the phase noise for each candidate pixel in the interferogram iteratively.
2) PS selection: Noise characteristics were taken into account when selecting pixels. In addition, this step estimates the amount of random (non-PS) pixels in a scene, so we achieve the density per km2.
3) PS weeding: The pixels selected in the previous step were weeded, and examples with signal contributions from neighboring ground resolution elements were dropped, as they are too noisy. The pixels selected were saved in new workspaces.
4) Phase correction: A spatially-uncorrelated look angle (DEM) error was corrected for the wrapped phase of the selected pixels. The patches were merged at the end of this step.
5) Phase unwrapping: There was a (2±π) discontinuity in the extracted phase when its extreme value (−π/+π) was reached. It is important to note that the phase jumps to the other end of the interval even though, physically, the optical phase is continuous and rises or falls softly.
The unwrapping method described in Equation 1 gives you the unwrapped phase:
Where
6) Error estimation for spatially correlated look angles: In Step 3, we calculated the spatially-uncorrelated look angle (SULA), and in Step 5, we removed it. Step 7 calculates the spatially-correlated look angle (SCLA) error, which is almost exclusively due to spatially-correlated DEM errors (this includes errors in the DEM itself, and incorrect mapping of the DEM into radar coordinates). The master atmosphere and orbit error (AOE) phases were estimated simultaneously.
7) Atmospheric filtering: In our case, we additionally applied the integrated TRAIN, using the linear tropospheric correction approach, to mitigate the topography-correlated atmospheric phase (Blasco et al., 2019; Mancini et al., 2021). For the estimation of the tropospheric phase contribution, we used the linear phase-based model included in the TRAIN, (Mancini et al., 2021):
Where
The coherence of the landslide area was analyzed before and after the landslide to identify the landslide location. The coherence results shown in Figure 3 reveal the landslide location before and after the landslide. The brighter white pixels represent the landslide (21 July 2020), probably enhanced due to vegetation loss in the study area (Song et al., 2021; Xue et al., 2022). The materials from this landslide have blocked the Qingjiang River channel, as a large lake formed (Xue et al., 2022).
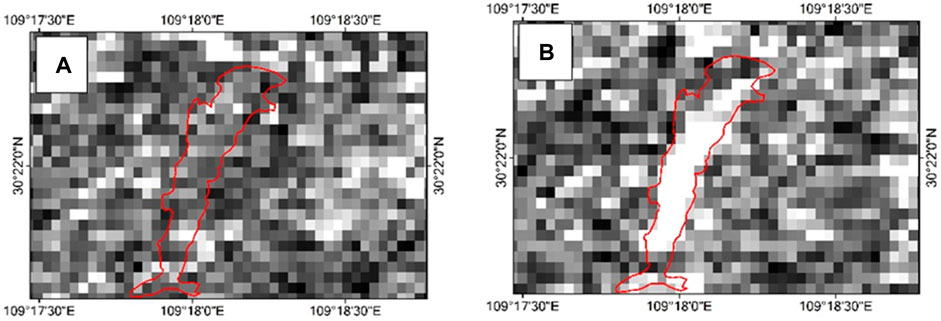
FIGURE 3. Geocoded coherence maps of the shaziba landslide. (A) Before the landslide on 21 July 2020, (B) After the landslide on 21 July 2020.
Our results analysis from DInSAR revealed deformation at various locations in the study area by using sentinel-1 images from 2019 to 2020. Even though the surrounding area of the Shaziba landslide is mostly covered by vegetation and only a small number of interference points were observed, the Shaziba landslide was successfully detected and identified with the DInSAR approach (Figure 4). Here Figures 4A,B highlight the landslide location of the Shaziba landslide. Primarily, our results reveal that initially, the lower part (figure (a)) of the landslide slid down before the main landslide occurred on 21 July 2020. Here, more interesting deformation results, highlighted in red, are obvious along the Qingjiang River and Enshi city.
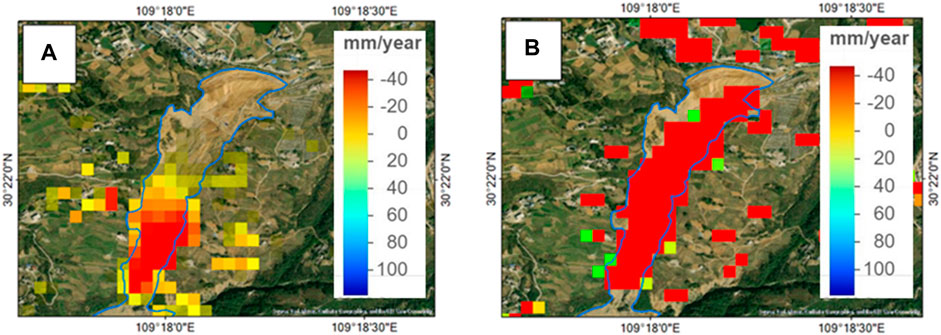
FIGURE 4. DInSAR results to identify landslide location occurred 21 July 2020, (A) Features view before Shaziba landslide, (B) After Shaziba landslide occurred.
To analyze the deformation along the area of interest (AOI) various elements are separately visualized such as city buildings, roads, and railway track networks and along the river. Significant deformation results can be observed along urban infrastructures in Enshi city, especially where residential and commercial buildings have been developed, as shown in Figure 5.
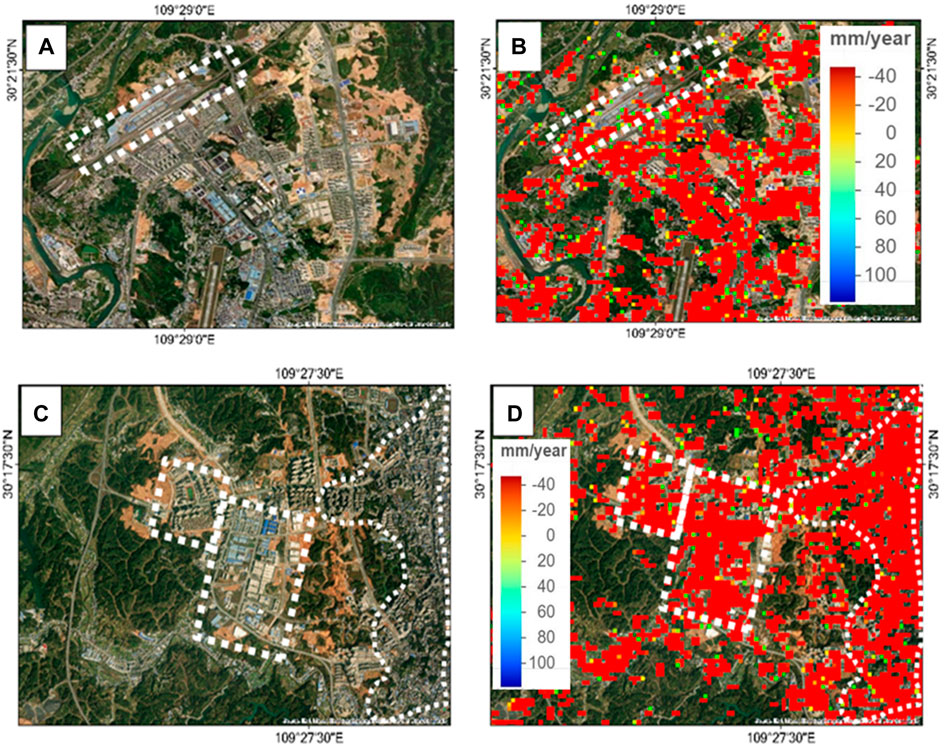
FIGURE 5. (A) Google view of residential buildings Enshi city, (B) corresponding deformation, (C) google view of commercial buildings Enshi city, and (D) deformation along the corresponding area.
In order to understand the deformation over Enshi city the runway of the Enshi airport was analyzed with minimum or less deformation during the study period. The buildings surrounding the airport show a significant rate of deformation (Figure 6). Here, the DInSAR map, generated in the color red, displays a maximum deformation of −40 mm, mostly over the infrastructures. The deformation surrounding the airport thus presents a serious potential risk to airport infrastructure.
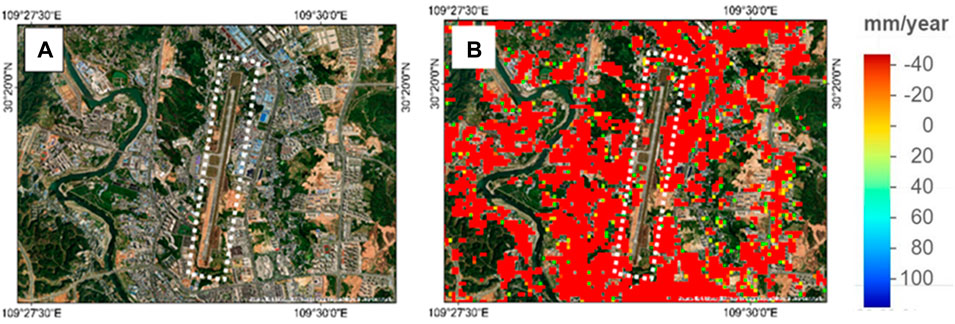
FIGURE 6. (A) Shows the Google maps view of the airport in Enshi city, (B) illustrates the deformation at the airport in Enshi city.
The spatial distribution of deformation along the roads and bridges within AOI are revealed by our analysis. Figure 7 highlights the deformation along the bridge and road bordered by a white polygon. While Figure 8 shows deformation within the area with residential buildings along the road passing through the narrow valley. This suggest that study area along the narrow valley have large number of unstable slopes with addition of frequent extreme rainfall can significantly destabilizes the study area area (Jie et al., 2010; Shen et al., 2021; Song et al., 2021; Xue et al., 2022).
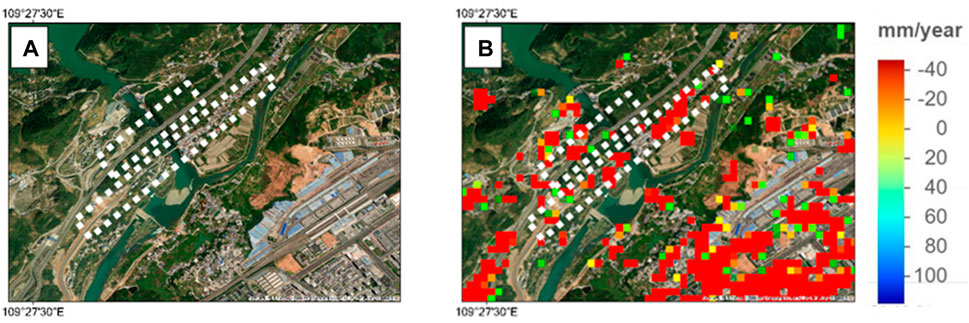
FIGURE 7. (A) Google maps view of road and bridge, (B) deformation along the road and bridge within AOI.
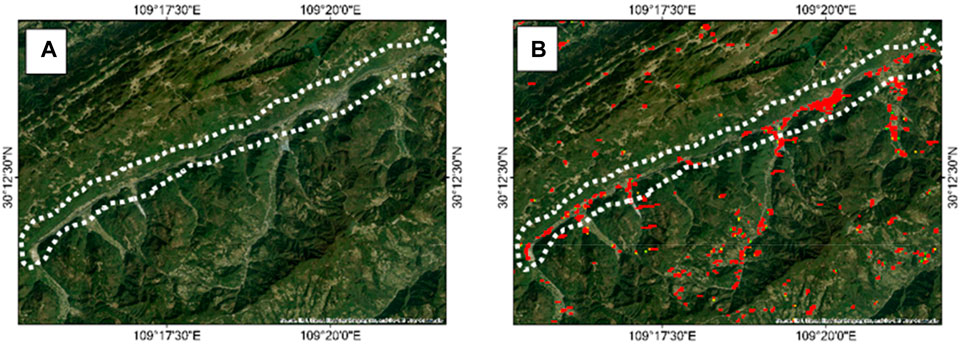
FIGURE 8. (A) Google maps view of a narrow valley, (B) deformation along the road within AOI.
To better understand the deformation history in the study area the PS-InSAR method was implemented by using sentinel-1 data from 02 to 11-2019 to 21-09-2020. Despite the study area being largely covered by vegetation, we found a compatible number of PS points at the ascending track. Our results show significant deformation within the study region, ranging up to −51.6 mm/year at Enshi city and along the Qingjiang River (Figure 9A), with corresponding Figure 9B displaying a deformation trending graph within the study period. While the rest of the study area shows relatively none and or less deformation (0, 10, and 20 mm) in LOS of the satellite. The uplift in LOS of the satellite is 54.4 mm/yr, highlighted as a dark blue color (Figure 9A). Our analysis observed that the density of PS points was higher in Enshi city road and railway tracks, and other built-up areas along the Qingjiang River. The large number of PS points targeted within the study area significantly supports an applied approach to identify ongoing deformation phenomena. The final deformation’s velocity map of the study area is illustrated in Figure 9. The dotted polygon in Figure 9A shows where maximum deformation occurred in Enshi city.

FIGURE 9. (A) PS point over study area illustrating the deformation velocity (v) in ascending track, (B) the graphic representation of deformation in LOS (mm) year 2020.
There were eight PS points selected from different locations in the study area to determine their subsidence behavior during the study period. Our study revealed that during the study period, the subsidence varied with more subsidence occurring in July 2020. This common high subsidence behavior of PS points during July 2020 suggests a strong correlation with rainfall during the study duration. Eight PS points within the study area with their corresponding subsidence trending profiles are illustrated here in Figures 10A–H. The subsidence observations at P1, P2, P3, P4, P5, P6, P7, and P8 are −39.6, −41.3, −74.4, −60.3, −59.4, −57.7, −8.97, and −7.43 mm during the study period.
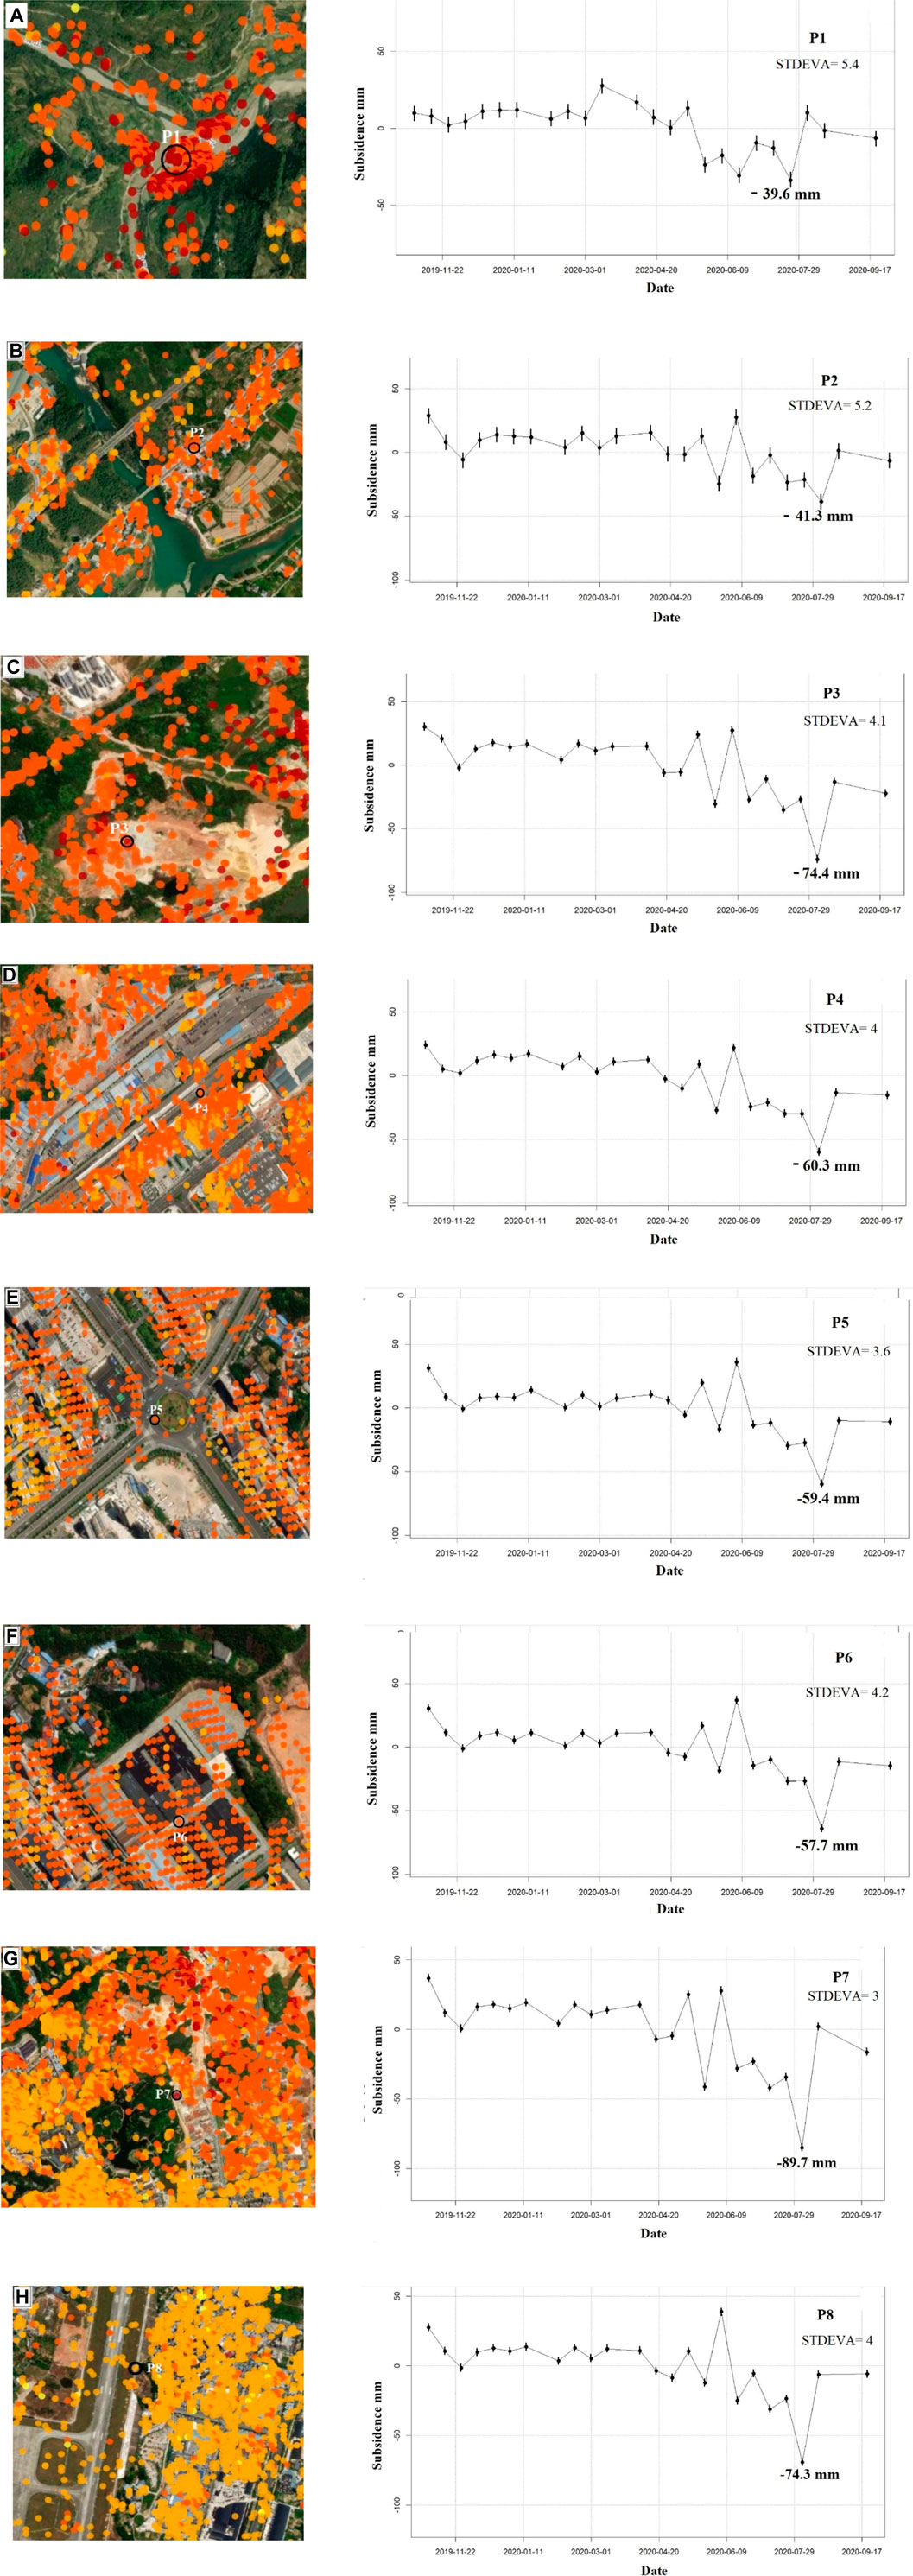
FIGURE 10. Various PS points (P1–P8) were selected in the study area (A–H), with corresponding subsidence trending profiles.
We examined various influencing factors as discussed in the literature and, based on knowledge of the study area, found that various factors can contribute to and strongly influence the stability of the study area. These influencing factors and their effects are explained in detail below.
There are three main aqueous rock groups distributed in Enshi Prefecture, namely carbonate-type fissure karst aqueous rock formation, loose rock-like pore aquifer rock group, and clastic rock-type pore fracture aqueous rock group (Duan et al., 2011; Song et al., 2021). Among them, the largest proportion is the carbonate-like fractured karst water-bearing rock group, which is mainly composed of carbonate-like water-bearing rock groups with strong water-richness, and some carbonate-like rock groups with strong water-richness are interspersed Clastic water-bearing rock formations. The second proportion is clastic rock-like pore-fissure water-bearing rock group, which is mainly composed of clastic rock-like water-bearing rock groups with weak water-rich strength, and contains a small part of clastic rock-like intercarbonates with strong water-rich degree rock group. The third proportion is the water-bearing rock groups of clastic rocks with moderate water richness and the porous water-bearing rock groups of unconsolidated rocks with strong water richness. The territory of Enshi Prefecture is dominantly covered by carbonate rocks with a large proportion of rock groups capable of containing more water content, while the rock groups with relatively weak water content belong to the clastic rock group with pore fracture, aqueous rocks erode relatively easily and often fall (Xue et al., 2022). In case of a large-scale project or other long-term anthropogenic activity, the kinetic water pressure and pore water pressure in the rock layer will fluctuate significantly, and the rock formation structure can easily be damaged. Thus, the probability of inducing landslide or deformation in the study area is higher (Jie et al., 2010; Zeng et al., 2013; Shen et al., 2021).
Rainfall is another important factor inducing geo-hazards. Studying rainfall in the Enshi Prefecture could help to understand the causal relationship between frequent landslide disasters and rainfall in the region. According to the data released by the state’s Land and Resources Bureau, the distribution of drought and floods during the flood season from May to September is uneven, and the heavy rainfall is mainly concentrated in late May, late June to early late June, mid-to-late July, and late July to early August (Shen et al., 2021). Due to the heavy and long duration of rainfall, it is the period when landslide disasters occur most frequently in Enshi Prefecture. The intensity of landslide disasters depends on the scope and intensity of rainfall, and disaster-prone areas and rainfall-superimposed areas are the key areas for disasters (Duan et al., 2011; Shen et al., 2021; Xue et al., 2022). The average annual rainfall in Honshu is 1,573 mm, which is much higher than the national average annual rainfall of 630 mm and the average annual rainfall in Asia of 740 mm, and also higher than the world land average of 834 mm. According to rainfall data from the Longfeng Dam Sediment Observatory in Enshi City from 1997 to 2006, in the Enshi City area alone, a rainstorm with rainfall greater than or equal to 50 mm occurred 52 times, with an average of 5.2 occurrences per year. The relationship between rainfall during July 2020 and deformation were determined and correlated (Figure 11). The correlative plot shows that rainfall reached a peak between 14 and 19 July 2020, and thus caused deformation during the study period.
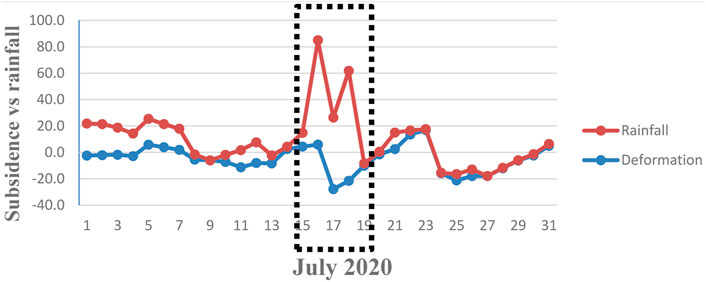
FIGURE 11. Illustrate the Subsidence variation and rainfall intensity in July 2020.
There were countless landslides caused by rainfall in the state on 7 July 2011, due to continuous torrential rain, 27 km from Baifeng Provincial Road in Sun River Township, Enshi City (Duan et al., 2011; Shen et al., 2021). Two landslides occurred in succession, with a landslide earthwork volume of about 200,000 m3, resulting in the Sun River gas station, two houses, two vehicles, and four people being buried, two people missing, traffic blockages, and a total of 687 people from 197 households on both sides of the disaster being transferred (Duan et al., 2011; Song et al., 2021; Xue et al., 2022). On 10 May 2007, a landslide occurred in Muzhuping Village, Qingtaiping Town, Badong County, with a slide area of about 1.3 million m2 and a volume of about 26 million m3 (Shen et al., 2021; Xue et al., 2022), the Bridge River, a first-class tributary of the Qingjiang River, was blocked. The Taofukou Ferry Terminal was completely destroyed and interrupted, 16 buildings with a total of 84 houses collapsed, and the county and township roads such as Qingtaiping-Jinguoping were destroyed for 5 km, with economic losses of nearly 100 million yuan (Duan et al., 2011; Shen et al., 2021; Song et al., 2021).
In Enshi city, mostly carbonate rock cover dominates, here the proportion of rock groups with more ability to absorb water content is higher (Shen et al., 2021; Xue et al., 2022). Therefore, the intensity of rainfall for long durations and the infiltration of more water into the underlying geology could potentially influence the stability of this area. Soil moisture data from the study area were downloaded and extracted using Sentinel-1 SAR (https://nsidc.org/data/spl2smap_s/versions/3). It has a temporal resolution of 30 s and the spatial resolution is 3 km * 3 km. These data were processed in ArcGIS 10.1 to interpret the soil moisture in the study area. The analysis of soil moisture data suggests variations in soil moisture during the study periods. Results indicate that soil moisture was higher in Enshi city and at the Shaziba landslide location, as highlighted in red (Figure 12).
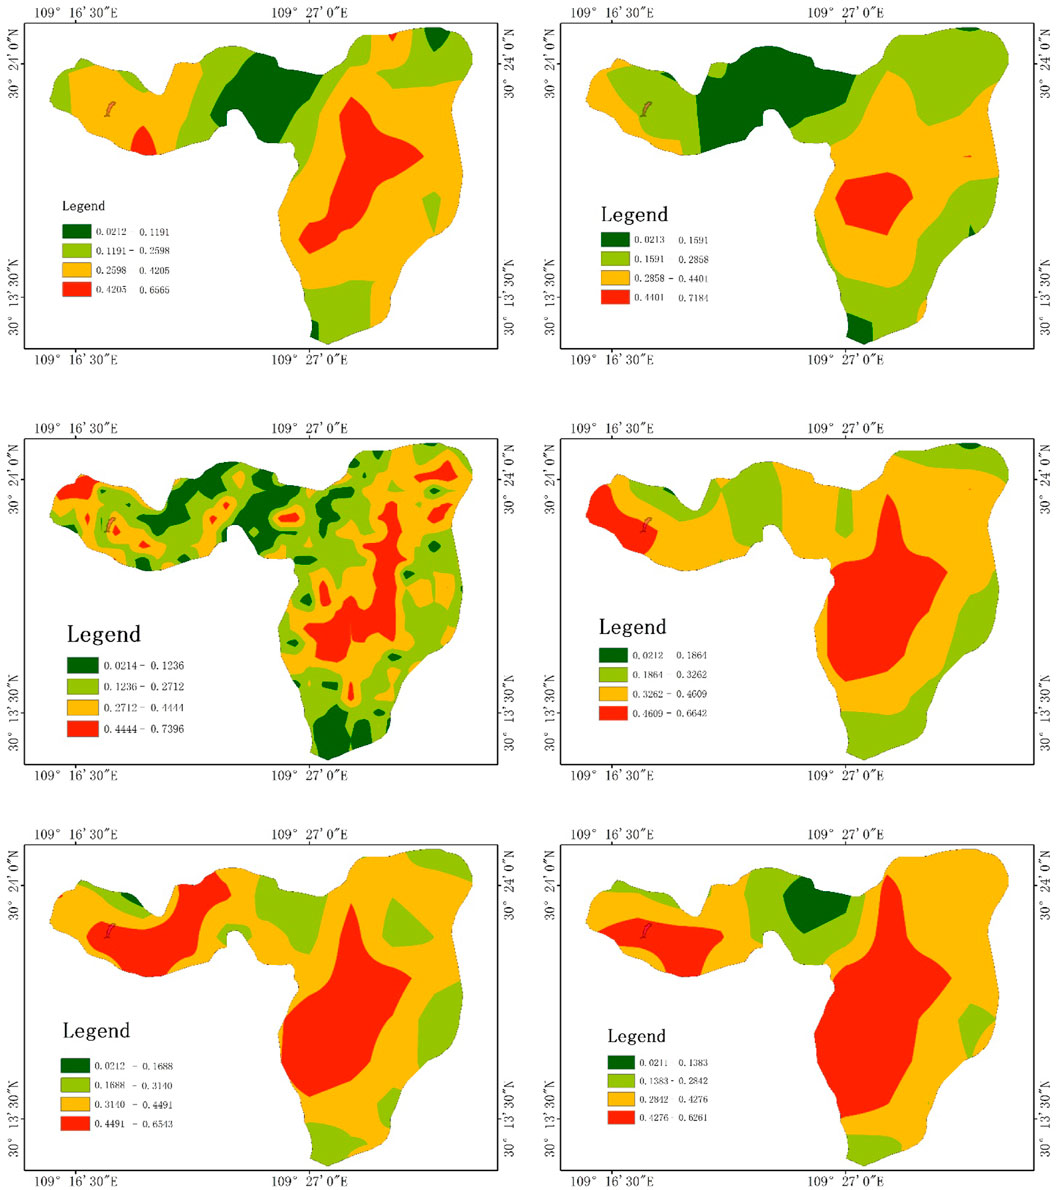
FIGURE 12. Soil moisture analysis map from 2019 to 2020.
In addition to the process of urbanization, Enshi Prefecture has also promoted investment in tourism due to its natural scenery, mineral resources, and Tujia cuisine. The construction of public facilities such as tunnels, railways, highways, houses, entertainment venues, mining, and various large and small engineering projects have been undertaken everywhere, which has caused the natural environment of Enshi Prefecture to suffer a heavy blow (Duan et al., 2011). The integrity of the mountain structure is destroyed, the original mechanical balance relationship is broken, resulting in structural loosening and sharp changes in the groundwater level, and when extreme weather or engineering vibrations with large amounts of engineering and a long construction period are encountered, landslide disasters are likely to occur (Eldin et al., 2013; Zeng et al., 2013).
Secondly, construction has made local environmental pollution worse year by year, and the weather conditions have continued to deteriorate, often accompanied by acid rain (Jie et al., 2010; Eldin et al., 2013; Xue et al., 2022). According to statistics, the average annual pH value of rainfall in Enshi City in 2009 was close to 5.60, and among the 17 cities in Hubei Province, the frequency of occurrence ranked sixth, at approximately 21.8%. Acid rain has a dissolution effect on carbonate surface rock layers in the territory. It also has a physical and chemical effect on the soil, changing the content of clay minerals in the soil, the concentration of ion components in the pore water, the stability of the soil colloid, the quantity and properties of the soil cementitious substance, thus affecting the stability and water stability of the soil aggregate. Acid rain causes acidification of soil, reduces the saturation of soil salt base, cation exchange, and the activity of microorganisms in the soil, and promotes the precipitation of activated aluminum, thereby reducing the soil strength (Shen et al., 2021; Song et al., 2021; Xue et al., 2022). Some coniferous vegetation such as fir, luohan pine, masson pine, and other coniferous forest vegetation, which are more sensitive to acid deposition are likely to wither and die, reducing the stability of soil quality and acid-base repair capacity, providing a possible further impetus for geological disasters (Eldin et al., 2013).
Another reason for there being frequent deformation disasters in the study area stems from the living conditions and behaviors of residents. The population of the state mainly lives in the narrow basin at the foot of the mountain or the edge of the river, whether it is residential housing or public facilities, these structures are mostly built on the mountain (Jie et al., 2010; Eldin et al., 2013; Shen et al., 2021; Xue et al., 2022). From the situation in Enshi city and suburbs, the mountains around the building construction and the foundation of the building are mostly red quartz sandstone and red clay, and some of the mountain surfaces have long-term flowing water seeping out and are very slippery (Xue et al., 2022). There are no or very few preventive protection measures around the buildings and public facilities, meaning these structures are a safety hazard once a landslide occurs, and it will inevitably have a very large impact, causing damage to transportation and property safety for residents.
This study has examined the application of DInSAR and PS-InSAR to identify the location of a landslide that occurred in the Shaziba area and analyzed the deformation phenomena of Enshi city and the surrounding area. For this purpose, sentinel-1 data were processed using SNAP and StaMPS from 2 November 2019 to 21 September 2020. Our results revealed the location of a landslide in Shaziba on 21 July 2020 and identified deformation activities in Enshi city ranging from 54.2 to −51.6 mm/year. Various factors potentially affect the stability of Enshi city and the surrounding area. Firstly, the geographical territory of Enshi Prefecture is mountainous, with landforms dominated by plateau mountains composed of carbonate rocks, low mountain canyons, and dissolution red basins within narrow valleys. Such geographical features provide innate conditions for frequent geo-hazard disasters in the region. Second, during the flood season from May to September, rainfall is abundant, intense, and long-lasting. Thus, rainfall is another braking point for geo-hazard disasters in the region, causing the majority of landslides during this period. Furthermore, Industrial development, large-scale civil engineering projects, tourism prosperity, population growth, transportation promotion, and rainwater acidification among other factors have caused serious damage and disturbed the natural environment, providing a driving force for the occurrence of geo-hazard disasters. Although the PS-InSAR method is very useful in identifying deformation in urban areas, its integration with other influencing factors and in situ data is better for understanding the major causes of deformation.
The original contributions presented in the study are included in the article/supplementary material, further inquiries can be directed to the corresponding author.
All the authors have equally contributed in this article: conceptualization and initial data processing and draft writing preparation, RK and YZ; supervised: HL; methodology and software, RK and YZ; editing, YAM, validation and visualization: RK, IH, MK, and HF. All the authors agree and confirm to submit this article in the present form.
The authors are thankful for the free datasets available at ASF Data Search (alaska.edu) and acknowledge the guidance provided on STEP Forum (esa.int) about SNAP to STaMPS.
The authors declare that the research was conducted in the absence of any commercial or financial relationships that could be construed as a potential conflict of interest.
All claims expressed in this article are solely those of the authors and do not necessarily represent those of their affiliated organizations, or those of the publisher, the editors and the reviewers. Any product that may be evaluated in this article, or claim that may be made by its manufacturer, is not guaranteed or endorsed by the publisher.
Argnani, A., Carannante, S., Massa, M., Lovati, S., and D’Alema, E. (2016). Reply to the “Comment on ‘The May 1 20 (MW 6.1) and 29 (MW 6.0), 2012, Emilia (Po Plain, northern Italy) earthquakes: New seismotectonic implications from subsurface geology and high-quality hypocenter location’ by Carannante. Tectonophysics 693, 157–162. doi:10.1016/j.tecto.2016.10.006
Bianchini, S., Raspini, F., Solari, L., del Soldato, M., Ciampalini, A., Rosi, A., et al. (2018). From picture to movie: Twenty years of ground deformation recording over tuscany region (Italy) with satellite InSAR. Front. Earth Sci. 6. doi:10.3389/feart.2018.00177
Blasco, J. M. D., Foumelis, M., Stewart, C., and Hooper, A. (2019). Measuring urban subsidence in the rome metropolitan area (Italy) with sentinel-1 SNAP-StaMPS persistent scatterer interferometry. Remote Sens. 11 (2), 129. doi:10.3390/rs11020129
Carnec, C., and Fabriol, H. (1999). Monitoring and modeling land subsidence at the Cerro Prieto geothermal field, Baja California, Mexico, using SAR interferometry. Geophys. Res. Lett. 26 (9), 1211–1214. doi:10.1029/1999GL900062
Casagli, N., Tofani, V., Morelli, S., Frodella, W., Ciampalini, A., Raspini, F., et al. (2017). “Remote sensing techniques in landslide mapping and monitoring, keynote lecture,” in Advancing culture of living with landslides. Editors M. Mikoš, Ž. Arbanas, Y. Yin, and K. Sassa (Midtown Manhattan, New York City: Springer International Publishing), 1–19.
Cian, F., Blasco, J. M. D., and Carrera, L. (2019). Sentinel-1 for monitoring land subsidence of coastal cities in africa using PSInSAR: A methodology based on the integration of snap and staMPS. Geosci. Switz. 9 (3), 124. doi:10.3390/geosciences9030124
Duan, M., Gao, Q., Wan, Y., Li, Y., Guo, Y., Ganzhu, Z., et al. (2011). Assessing vulnerability and adaptation responses to rain-fallrelated landslides in China, a case study of Enshi Prefecture in Hubei province. Procedia Environ. Sci. 11, 1379–1385. PART C. doi:10.1016/j.proenv.2011.12.207
Eldin, M. A. M. E., Tang, H., Xu, Y., Li, C., Xiong, C., and Wang, L. (2013). Geological and geoengineering properties of the 1997 yangjia Shan landslide, Enshi, China. Int. J. Geosciences 04 (04), 803–815. doi:10.4236/ijg.2013.44075
Erkens, G., and Sutanudjaja, E. H. (2015). Towards a global land subsidence map. Proc. Int. Assoc. Hydrological Sci. 372, 83–87. doi:10.5194/PIAHS-372-83-2015
Ferretti, A., Prati, C., and Rocca, F. (2001). Permanent scatterers in SAR interferometry. IEEE Trans. Geoscience Remote Sens. 39 (1), 8–20. doi:10.1109/36.898661
Foumelis, M., Blasco, J. M. D., Desnos, Y. L., Engdahl, M., Fernández, D., Veci, L., et al. (2018). Esa snap - stamps integrated processing for Sentinel-1 persistent scatterer interferometry. Proceedings of the International Geoscience and Remote Sensing Symposium (IGARSS), Valencia, Spain, 2018-July. doi:10.1109/IGARSS.2018.8519545
Goldstein, R. M., Zebker, H. A., and Werner, C. L. (1988). Satellite radar interferometry: Two-dimensional phase unwrapping. Radio Sci. 23 (4), 713–720. doi:10.1029/RS023i004p00713
Hang, L. M., Truong, V. van, Duong, N. D., and Tuan, T. A. (2017). Mapping land cover using multi-temporal sentinel-1a data: A case study in hanoi. VIETNAM J. EARTH Sci. 39 (4). doi:10.15625/0866-7187/39/4/10730
Hooper, A., Zebker, H., Segall, P., and Kampes, B. (2004). A new method for measuring deformation on volcanoes and other natural terrains using InSAR persistent scatterers. Geophys. Res. Lett. 31 (23). doi:10.1029/2004GL021737
Jie, Y., Yu, B., Chen, J., Huang, J., and Jing, G. (2010). IEEE Computer Society, 454–457. doi:10.1109/ESIAT.2010.5567365Notice of Retraction: Analysis of landslides susceptibility to different land use patterns in EnshiProceedings of the 2010 2nd Conference on Environmental Science and Information Application Technology ESIATWuhanJuly 2010
Khan, R., Li, H., Afzal, Z., Basir, M., Arif, M., and Hassan, W. (2021). Monitoring subsidence in urban area by PSInSAR: A case study of abbottabad city, northern Pakistan. Remote Sens. 13 (9), 1651. doi:10.3390/RS13091651
Kim, J., Kim, D.-J., Kim, S.-W., Won, J.-S., and Moon, W. M. (2007). Monitoring of urban land surface subsidence using PSInSAR. Geosciences J. 11 (1), 59–73. doi:10.1007/bf02910381
Lee, C. F., Huang, W. K., Lin, S. Y., Chiu, C. L., and Chi, C. C. (2019). National-wide deep-seated landslide mapping and susceptibility update via airborne laser scanning raster data and InSAR analysis in Taiwan. Proceedings of the ECSMGE 2019-17th European Conference on Soil Mechanics and Geotechnical Engineering, 2019-September. Midtown Manhattan, New York City. doi:10.32075/17ECSMGE-2019-0116
Makabayi, B., Musinguzi, M., and Otukei, J. R. (2021). Estimation of ground vertical displacement in landslide prone areas using PS-InSAR. A case study of bududa, Uganda. Int. J. Geosciences 12 (04), 347–380. doi:10.4236/ijg.2021.124019
Mancini, F., Grassi, F., and Cenni, N. (2021). A workflow based on SNAP–StaMPS open-source tools and GNSS data for PSI-based ground deformation using dual-orbit sentinel-1 data: Accuracy assessment with error propagation analysis. Remote Sens. 13 (4), 753. doi:10.3390/rs13040753
Mestre-Quereda, A., Lopez-Sanchez, J. M., Selva, J., and Gonzalez, P. J. (2018). An improved phase filter for differential SAR interferometry based on an iterative method. IEEE Trans. Geoscience Remote Sens. 56 (8), 4477–4491. doi:10.1109/TGRS.2018.2820725
Miao, F., Wu, Y., Li, L., Liao, K., and Zhang, L. (2019). Risk assessment of snowmelt-induced landslides based on GIS and an effective snowmelt model. Nat. Hazards 97 (3), 1151–1173. doi:10.1007/s11069-019-03693-2
Poreh, D., and Pirasteh, S. (2020). InSAR observations and analysis of the medicina geodetic observatory and CosmoSkyMed images. Nat. Hazards 103 (3), 3145–3161. doi:10.1007/s11069-020-04123-4
Prati, C., Ferretti, A., and Perissin, D. (2010). Recent advances on surface ground deformation measurement by means of repeated space-borne SAR observations. J. Geodyn. 49 (3–4), 161–170. doi:10.1016/j.jog.2009.10.011
Roque, D., Fonseca, A. M., Henriques, M. J., and Falcão, A. P. (2014). A first approach for displacement analysis in lisbon downtown using PS-InSAR. Procedia Technol. 16, 288–293. doi:10.1016/j.protcy.2014.10.094
Shi, X., Liao, M., Zhang, L., and Balz, T. (2016). Landslide stability evaluation using high-resolution satellite SAR data in the Three Gorges area. Q. J. Eng. Geol. Hydrogeology 49 (3), 203–211. doi:10.1144/qjegh2015-029
Salcedo-Sanz, S., Ghamisi, P., Piles, M., Werner, M., Cuadra, L., Moreno-Martínez, A., et al. (2020). Machine learning information fusion in earth observation: A comprehensive review of methods, applications and data sources. Inf. Fusion 63, 256–272. doi:10.1016/j.inffus.2020.07.004
Saralioglu, E. (2022). Mapping surface deformation using SNAP-StaMPS after Seferhisar-Izmir earthquake. Nat. Hazards 111 (1), 687–708. doi:10.1007/s11069-021-05073-1
Shen, D., Shi, Z., Peng, M., Zhang, L., and Zhu, Y. (2021). Preliminary analysis of a rainfall-induced landslide hazard chain in Enshi city, Hubei province, China in july 2020. Landslides 18 (1), 509–512. doi:10.1007/s10346-020-01553-w
Song, K., Wang, F., Zuo, Q., Huang, B., Mao, W., and Zheng, H. (2021). Successful disaster management of the july 2020 Shaziba landslide triggered by heavy rainfall in Mazhe village, Enshi city, Hubei province, China. Landslides 18 (10), 3503–3507. doi:10.1007/s10346-020-01565-6
Thomas, A. (2021). Mapping of surface deformation associated with the 5.2 magnitude Stilfontein earthquake of 3 April 2017 using radar interferometry. Egypt. J. Remote Sens. Space Sci. 24 (1), 85–108. doi:10.1016/j.ejrs.2020.01.005
Wang, B. H., Zhao, C. Y., and Liu, Y. Y. (2018). An improved SAR interferogram denoising method based on principal component analysis and the Goldstein filter. Remote Sens. Lett. 9 (1), 81–90. doi:10.1080/2150704X.2017.1392633
Wasowski, J., Bovenga, F., Florlo, N., and Gigante, G. (2008). PSInSAR for the investigating of unstable slopes and landslides. Tokyo, Japan: The First World Landslide Forum.
Wei, K., Ouyang, C., Duan, H., Li, Y., Chen, M., Ma, J., et al. (2020). Reflections on the catastrophic 2020 yangtze river basin flooding in southern China. Innovation 1 (2), 100038. doi:10.1016/j.xinn.2020.100038
Xu, Y. S., Shen, S. L., Ren, D. J., and Wu, H. N. (2016). Analysis of factors in land subsidence in Shanghai: A view based on a strategic environmental assessment. Sustain. Switz. 8 (6), 573. doi:10.3390/su8060573
Xue, C., Chen, K., Tang, H., and Liu, P. (2022). Heavy rainfall drives slow-moving landslide in Mazhe Village, Enshi to a catastrophic collapse on 21 July 2020. Landslides 19 (1), 177–186. doi:10.1007/s10346-021-01782-7
Yang, Q., Ke, Y., Zhang, D., Chen, B., Gong, H., Lv, M., et al. (2018). Multi-scale analysis of the relationship between land subsidence and buildings: A case study in an eastern beijing urban area using the PS-InSAR technique. Remote Sens. 10 (7), 1006. doi:10.3390/rs10071006
Yang, W., Wang, Y., Wang, Y., Ma, C., and Ma, Y. (2020). Retrospective deformation of the Baige landslide using optical remote sensing images. Landslides 17 (3), 659–668. doi:10.1007/s10346-019-01311-7
Zeng, B., Xiang, W., Joachim, R., and Dominik, E. (2013). Intelligent prediction of slope-disaster in Enshi Silurian stratum region. J. Nat. Disasters 22 (6).
Zhao, C., and Lu, Z. (2018). Remote sensing of landslides-A review. Remote Sens. 10 (2), 279. doi:10.3390/rs10020279
Keywords: geo-hazards, PS-insar, deformation, enshi city, StaMPS
Citation: Khan R, Zhong Y, Li H, Al-Masnay YA, Haq Iu, Khan M, Faheem H and Ali R (2023) Integration of differential interferometric synthetic aperture radar and persistent scatterer interferometric approaches to assess deformation in enshi city, hubei, China. Front. Earth Sci. 11:1101848. doi: 10.3389/feart.2023.1101848
Received: 18 November 2022; Accepted: 02 January 2023;
Published: 25 January 2023.
Edited by:
Munawar Shah, Institute of Space Technology, PakistanReviewed by:
Umair Khan, University of Chinese Academy of Sciences, ChinaCopyright © 2023 Khan, Zhong, Li, Al-Masnay, Haq, Khan, Faheem and Ali. This is an open-access article distributed under the terms of the Creative Commons Attribution License (CC BY). The use, distribution or reproduction in other forums is permitted, provided the original author(s) and the copyright owner(s) are credited and that the original publication in this journal is cited, in accordance with accepted academic practice. No use, distribution or reproduction is permitted which does not comply with these terms.
*Correspondence: Huan Li, bGlodWFuQGNzdS5lZHUuY24=
Disclaimer: All claims expressed in this article are solely those of the authors and do not necessarily represent those of their affiliated organizations, or those of the publisher, the editors and the reviewers. Any product that may be evaluated in this article or claim that may be made by its manufacturer is not guaranteed or endorsed by the publisher.
Research integrity at Frontiers
Learn more about the work of our research integrity team to safeguard the quality of each article we publish.