 Haris Faheem
 Zeeshan Khattak2
 Fakhrul Islam
 Rashid Ali
 Rehan Khan
- 1Key Laboratory of Metallogenic Prediction of Nonferrous Metals and Geological Environment Monitoring, Ministry of Education, School of Geosciences and Info-Physics, Central South University, Changsha, China
- 2Department of Geology, Khushal Khan Khattak University, Karak, Khyber Pakhtunkhwa, Pakistan
- 3School of Mathematics and Statistics, Central South University, Changsha, Hunan, China
- 4Institute of Geology, University of Azad Jammu and Kashmir, Muzaffarabad, Azad Jammu and Kashmir, Pakistan
- 5Department of Mathematics, College of Science Al-Zulfi, Majmaah University, Al-Majmaah, Saudi Arabia
- 6Faculty of Engineering and Technology, Future University in Egypt, New Cairo, Egypt
Groundwater is a vital component of life; without its identification, it is impossible to live. Therefore, identifying groundwater potential zones (GWPZs) is critical. For this purpose, the study area of the Kohat District was selected to identify GWPZs using the multi-influencing factors (MIF) approach. The Kohat area has a semi-arid to sub-humid subtropical climate and is classified as a sub-tropical, triple-season, semi-arid, sub-mountainous area. The geology, land use, soil, rainfall, lineament density, and drainage density are important parameters of ground water potential identification. The GWPZs were classified into five types: very poor, poor, good, high, and very high. We determined that 37.72% of the study area had high GWPZs, which were predominately in or near the northwest region of the study area, whereas 4.62% of the study area, in the southeast region, had very poor GWPZs. The water table data from the study varied due to different parameters used to identify the GWPZs. Our MIF results revealed that a large area of the Kohat District has good water potential. Still, due to topographic elevation changes, the groundwater potential has been limited in hilly areas. Our final results were compared with water level field data collected from different sources across the Kohat District.
1 Introduction
Groundwater is an important abundant natural resource and is a very basic and constant source of water supply in all climatic regions worldwide (Konikow and Kendy, 2005). Overall, the planet has a stock of approximately 1.4 billion cubic kilometers of water, the vast majority of which (nearly 97%) is salt water in the oceans. Freshwater stocks are estimated to be around 35 million cubic kilometers in more limited areas. Groundwater is the most abundant source of irrigation in South Asia and North China (Shah, 2007). Pakistan is an agriculture-based country where groundwater is one of its dominant irrigation sources. The changing climate scenario is slowly reducing river water flow, which has made groundwater a fundamental component of irrigation systems to certify food safety and commercial support (Khair et al., 2012). The demand for freshwater resources has increased significantly in recent years, due to rapid population growth, uneven spatiotemporal distribution of water resources, economic development, and changing climate, resulting in water scarcity in many parts of the world (Selvam et al., 2015). Groundwater resources are becoming increasingly important in a densely populated country (Bhuiyan et al., 2009). Groundwater is an important component of the hydrological system in subsurface geological formations (Ifediegwu, 2022). Groundwater occurrence and availability are determined by the recharge process, which is influenced by factors such as physiography, lithological composition, drainage patterns, land use/land cover, drainage density, lineaments, soils, rainfall, and geology (Chatterjee and Dutta, 2022). In Pakistan, groundwater is the primary irrigation source that, at approximately 62 billion m3, makes up 40% yield water fulfillment (Hussain et al., 2011). Pakistan is a country loaded with glacial masses, waterways, streams, and trenches, yet is confronted with shortage of water. For example, at the hour of autonomy (i.e., in 1947), 5000 m3 of water was accessible for every Pakistani, which has now decreased to 1,000 m³, due to uncontrolled rapid population growth (Hussain et al., 2011).
In contrast to traditional methods, remote sensing and GIS make groundwater resource assessment time and cost-effective, rapid, and less labor-intensive (Thapa et al., 2017). Several researchers have applied GIS-based approaches to delineate groundwater potential lineament, and hydro geomorphology, as well as groundwater level decline and its impact on regional subsidence, karst hazards, and groundwater pollution vulnerability (Thapa et al., 2017). Various factors play roles in delineating GWPZs (NARAYANAN and VENUGOPAL, 2021), including amounts of rainfall, lithology, soil texture, slope, elevation, and distribution of water table depth (Magesh et al., 2012), slope, elevation (Magesh et al., 2011), drainage systems (Thapa et al., 2017), and groundwater table distribution (Arkoprovo et al., 2012).
Recently, various methods have been used to protect groundwater (Magesh et al., 2011) and reservoirs, including geospatial, seismic, geological, hydrogeological, and geophysical methods (Magesh et al., 2012). Use of a combination of remote sensing (RS), GIS, and the multi-influencing factors (MIF) technique is one of the most common, dependable, and cost-effective approaches for groundwater identification and assessment of recharge and storage (Moodley et al., 2022). Several studies have used GIS and RS with multi-criteria decision-making analysis (MCDMA) to detect GWPZs (Taloor et al., 2020). Researchers have used various techniques, such as frequency (Razandi et al., 2015), multi-criteria decision evaluation (MCDE) (Thapa et al., 2017), artificial neural networks (ANN) (Lee et al., 2012), random forest modeling (Zabihi et al., 2016), logistic regression modeling (Pourtaghi and Pourghasemi, 2014), and the analytic hierarchy process (AHP) (Rahmati et al., 2015). The major drawbacks of bivariate and multivariate statistical methods are that assumptions are made before investigation, and they are sensitive to outliers (Thapa et al., 2017). For delineating GWPZs in this context, MIF was a simple, reliable, and effective method (Selvam et al., 2016).
Thus, we aimed to use the MIF method to identify and assess GWPZs in the Kohat District, Pakistan. Here, the integration of GIS and RS data plays an important role in characterization of high and low GWPZs in the study area. The main objectives of this study were: 1) to evaluate the capacity of the MIF method in potential groundwater assessment, 2) to assess several parameters influencing the groundwater potential of the study area, and 3) to cross-validate the derived groundwater potential site results with tube well/borehole data.
1.1 Overview of study area
Our research study was conducted in the Kohat District (Figure 1), a medium-sized city located in the southern part of Khyber Pakhtunkhwa, Pakistan. The district’s population is more than 562,644, according to the Khyber Pakhtunkhwa survey report. The Kohat Plateau consists of a heavily deformed and structurally elevated thrust sheet. The Kohat District spans from the latitude of 33° 35′0.24″ N and a longitude of 71.25′59.59″ E or 33.58° and 71.43°, respectively. The altitude of the study area is about 1,607 feet, and the water table in the area ranges from 40 to 50 m in depth. Kohat coordinates with the Afghanistan borders: 128.4 km SE of Jalalabad Nangarhar, Afghanistan. It is a mountainous area located east of the Indus River and has a few spread patches of plains. There are three major water reservoirs in the area: Tanda Dam, Gandiali Dam, and Kandar Dam. The study area is divided into three geological domains; the Peshawar Basin in the north, the Kotal ranges in the center, and the Kohat sub-basin south of the Main Boundary Thrust (MBT). Kohat Province of the upper Indus Basin constitutes the western part of the Himalayan fold and thrust belt, resulting from the ongoing collision between the Indian and Asian plates. The upper Indus Basin is divided into two areas: the Potwar Plateau to the east of the Indus River and the Kohat Plateau west of the Indus River. Several outcrops of Lockhart and Kohat Limestone in the Kohat District are found along the Indus Highway, the Kohat Pindi Road, and Kohat–Hangu Road. All these limestones belong to the Kohat Formation, representing the top of the Eocene sequence within the Kohat Plateau.
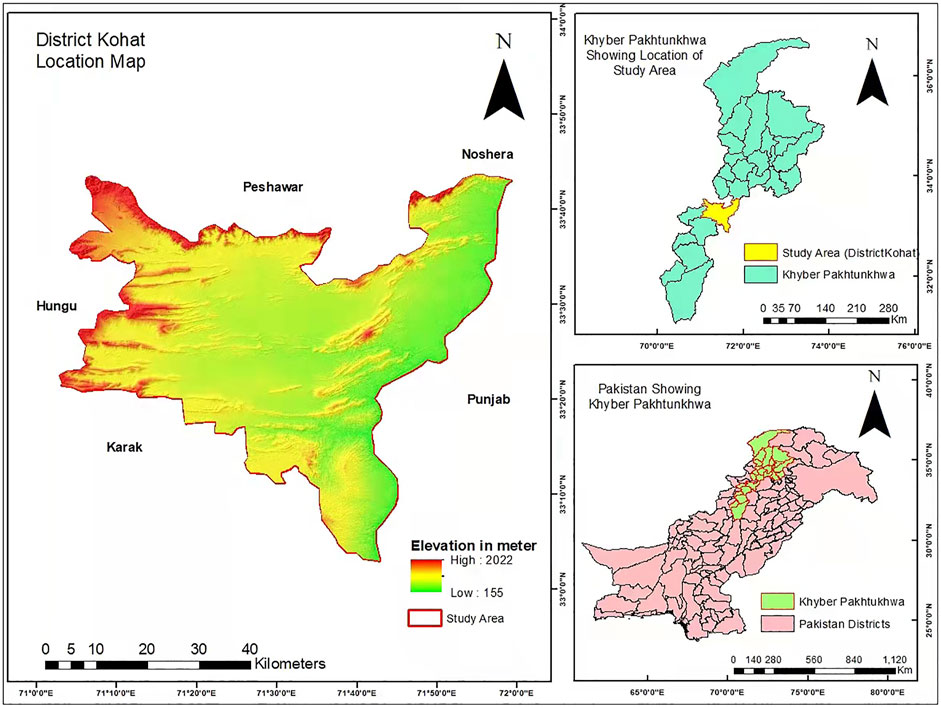
FIGURE 1. Kohat District area map.
2 Materials and methods
2.1 Data collection
GWPZ assessment requires vast spatial data, which was collected from different sources. First, the digital elevation model (ASTER 30 m), with basic data required for calculating slope and drainage density, was downloaded from earthexplorer.usgs.gov. Landsat 8 OLI imagery was also downloaded from EarthExplorer to calculate lineament density. The soil data were requested from the Directorate of Soil and Water Conservation and the Directorate of Soil Survey of Khyber Pakhtunkhwa. The data were provided in a raster format, which was then georeferenced and digitized in ArcMap 10.5. The rainfall data were collected from the Pakistan Meteorological Department, Peshawar Region, Khyber Pakhtunkhwa. As the Karak District does not have meteorological observatories, the data available for all provinces were interpolated using inverse distance weighting (IDW). Land use/land cover data from 2018 were requested from the Forest Management Center Peshawar. The geology data were requested from the National Centre of Excellence in Geology, University of Peshawar. All data were then converted from raster to vector format by digitization. The details of all the processes are discussed in the following Methodology section. Dataset details are provided in Table 1.
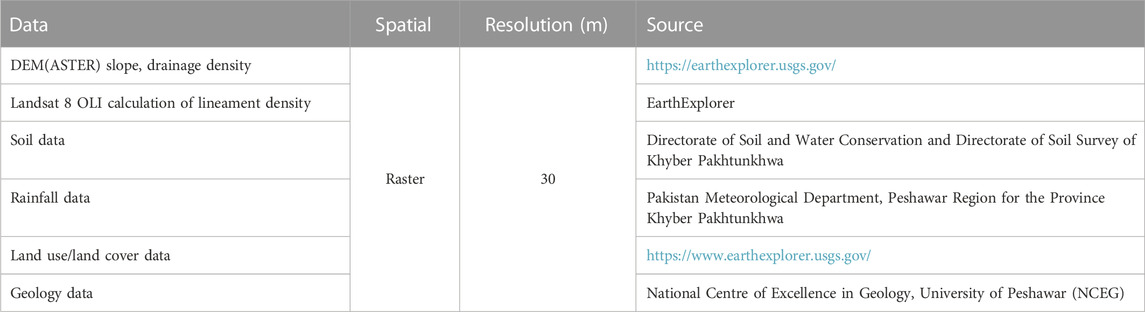
TABLE 1. Dataset source and resolution.
2.2 Methodology
In this study, various types of data were used to delineate GWPZs. A digital elevation model (DEM) with 30 m resolution was obtained using Shuttle Radar Topography Mission (SRTM) data combined with ArcGIS and RS to prepare the thematic layers. With the help of MIF modeling, ground water potential was calculated. GWPZs were determined using MIF models, which also explain relevant factors. The methodology involved four main steps. The first step was a literature search to identify parameters that impact groundwater potential. The probability of locating groundwater in a specific region varies depending on parameters that influence the revival of groundwater aquifers. Some of the factors currently utilized in the assessment of groundwater potential include land use/land cover, precipitation, slope, drainage density, geology, lineament density, and soil condition of the catchment (Nasir et al., 2018).
All these parameters were used to study the groundwater potential in the Kohat District. In the second step, we assigned a score and weight for each parameter to generate subclasses within each parameter affecting the GWPZ. The subclasses with major effects on groundwater recharge (A) had a score of 2, and the subclasses with minor effects (B) had a score of 1. The subclasses with no effect on groundwater recharge had a score of zero. The total of both the major and minor (A + B) effect scores was calculated to determine the relative effect (Table 2). This relative effect was then used to calculate the weight of each influencing parameter (Deepa et al., 2016) [(A+B)/∑ (A+B)] * 100). Using this formula, we calculated the weight of each parameter. A is the major subclass effect and B is the minor subclass effect within the seven influencing parameters. The weight designated for each influencing parameter was distributed equally, which allowed ranking of each subclass, as shown in Table 2.
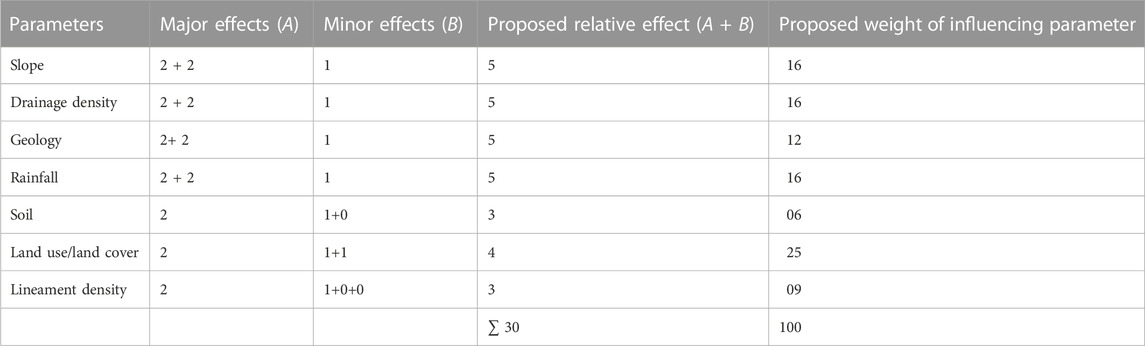
TABLE 2. Values of major, minor, and relative effects and proposed weights of influencing parameters.
In the third step, we prepared maps of all seven parameters and reclassified them in ArcMap 10.5. Each map shows its effect in influencing parameters of groundwater, expressed in numerical values. In step four, we integrated all seven parameters using weighted overlay analysis and categories in five classes: very high, high, good, poor, and very poor GWPZ. The AHP is the most commonly used and well-known GIS-based method for delineating GWPZs. This method helps integrate all thematic layers. The probability of the presence of groundwater in a specific region fluctuates depending on different parameters that impact the revival of groundwater aquifers. Some of the factors currently utilized in the assessment of groundwater potential include land use/land cover, geology, slope, drainage density, lineament density, soil, and rainfall. For each parameter, thematic maps were prepared to examine the study area’s groundwater potential, and all of these parameters were used to study the groundwater potential in the Kohat District. These thematic layers were combined, and a groundwater potential map was prepared in ArcGIS software. The thematic layers are defined briefly below. To validate the final map of weighted overlay analysis, we conducted a field survey to collect ground truth water well data to identify the groundwater levels of the study area. We collected 150 well data measurements from different regions of the study area with different water levels at each point. We categorized these data into five classes: 43 wells had water level up to 35 m, which is near the Earth’s surface and considered as having very high groundwater potential, 39 wells had groundwater level up to 69 m, which indicated high potential zones, 50 wells had water level up to 105 m, which showed good groundwater potential, 12 wells had groundwater level up to 132 m, which indicated poor GWPZs, and five wells contained groundwater level up to 210 m, which indicates a very poor water table and therefore was considered to have very poor groundwater potential. A diagram of the full study methodology is shown in Figure 2. We overlaid all of these well data points in the final weighted overlay analysis, which validated the final results map.
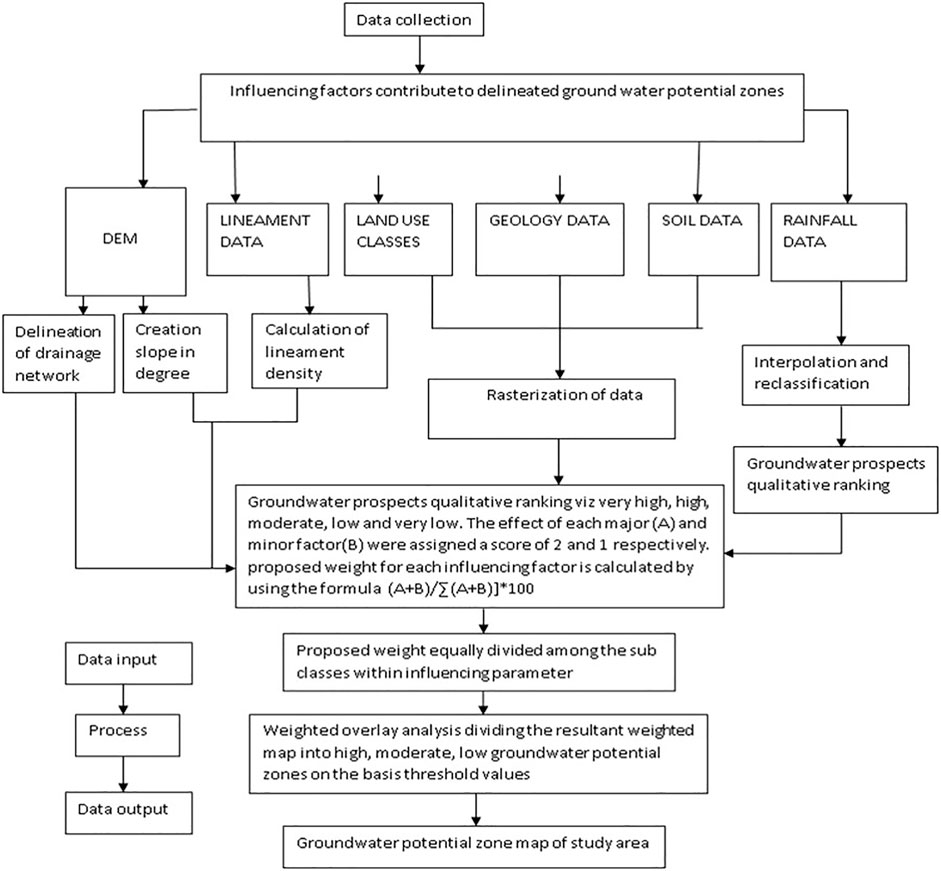
FIGURE 2. Study methodology.
3 Results and discussion
There are several parameters that influence groundwater potential in an area. Therefore, various thematic layers of different parameters were generated to evaluate the study area for GWPZs (Table 3). The details of different parameters are provided below.
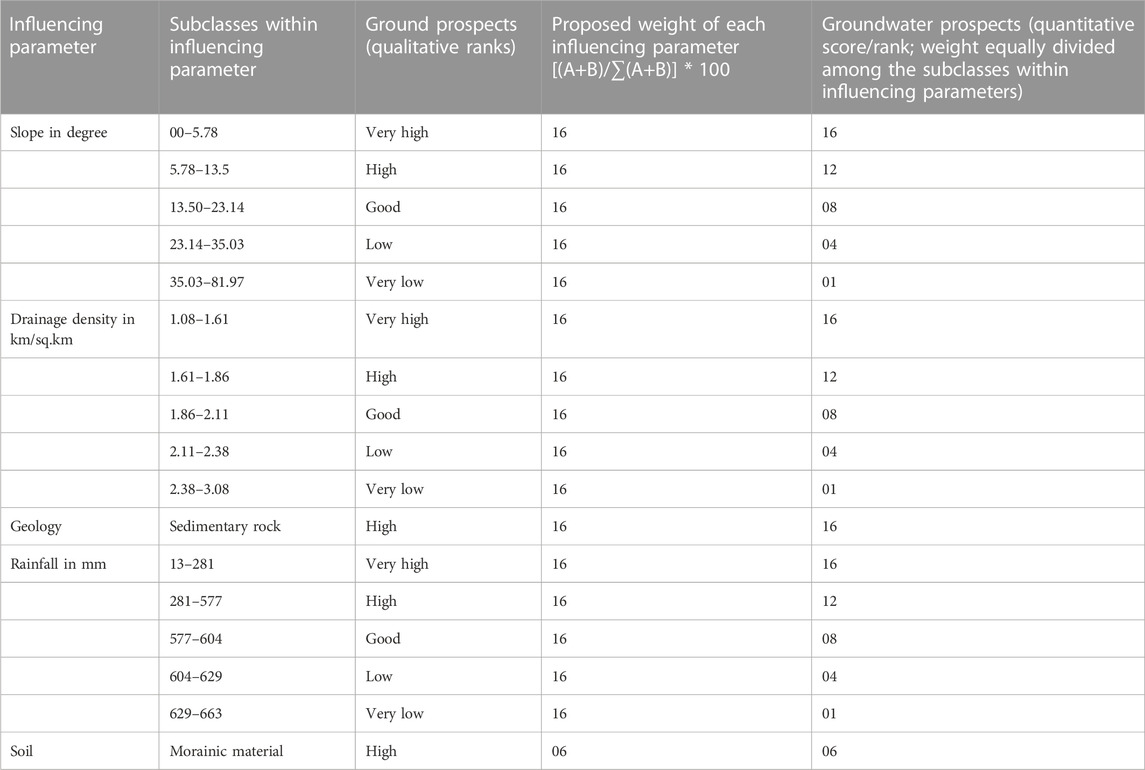
TABLE 3. Details of parameters that influence groundwater potential.
3.1 Rainfall
Rainfall is an important parameter in delineating groundwater potential and is a major hydrological source of stored groundwater (Andualem and Demeke, 2019). The higher the rainfall intensity, the higher the groundwater recharge, and vice versa (Das and Mukhopadhyay, 2020). With the help of rainfall, we can regulate the instability of groundwater (Agarwal et al., 2013). The GWPZ perceptively alters the infiltration rate, which is controlled by precipitation dispersal and slope gradient (Selvam et al., 2016). From the surrounding relief, dunes, and waves in the rainy season, more than 10% of the 420 mm/year average annual rain fall recharge is predictable (Zghibi et al., 2016). High-intensity, short-duration rain leads to less infiltration and more surface runoff; low intensity, long-duration rain leads to high infiltration and less surface runoff (Ibrahim-Bathis and Ahmed, 2016). For high groundwater potential, high intensity rainfall is favorable and has high priority. Due to climatic variation, the amount of rainfall is not constant in the region (Adiat et al., 2012). Figure 3 shows rainfall data. The rainfall map indicates five main classes, ranging from 9 to 267 mm. In the first class, the values range from 9 to 40 mm, showing minimum rainfall in the region, and indicating areas that are very poor GWPZs. Similarly, the second class shows poor GWPZs, the third class shows good GWPZs, the fourth class shows high GWPZs, and the fifth class shows very high GWPZs.
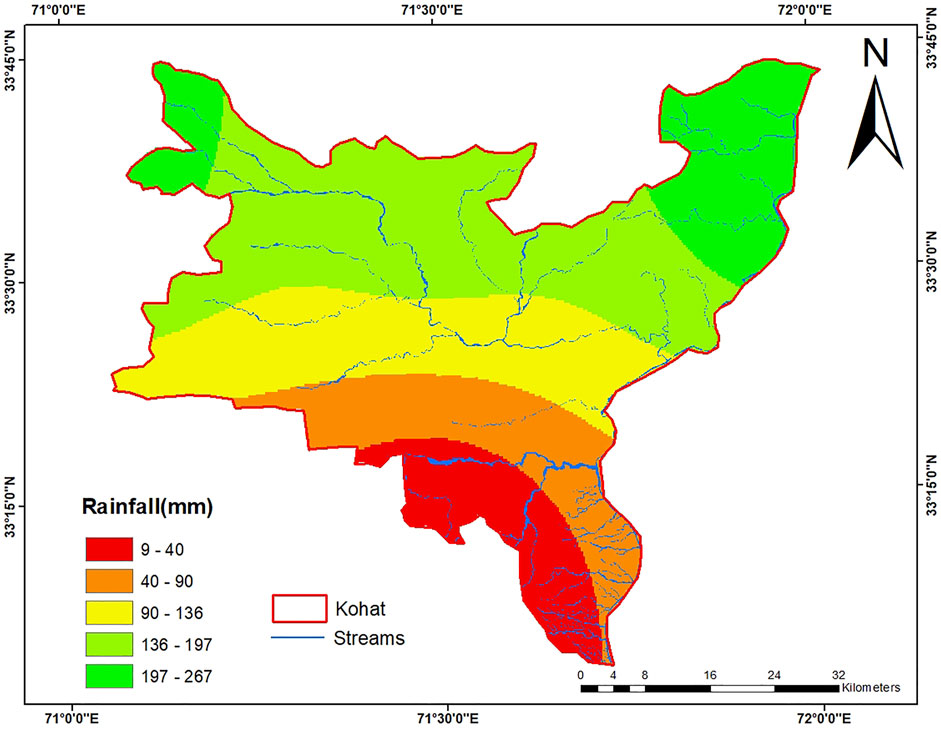
FIGURE 3. Rainfall map of the study area.
3.2 Slope
Slope plays an important role in water infiltration and runoff (Tweed et al., 2007). It is a characteristic of local and regional relief, which is an important factor that influences water retention, the intensity of infiltration, aquifer recharge, and groundwater movement (Cai and Ofterdinger, 2016). The infiltration rate will be lower when the slope of the ground is high, due to a large amount of runoff in the area (Rajasekhar et al., 2019). The slope is directly proportional to surface runoff and inversely proportional to the purification and infiltration rate of surface water (Das and Pal, 2019). The rate of infiltration and surface runoff is highly influenced by the slope of the surface (Singh et al., 2013). Figure 4 shows slope data. Slope data were organized into five classes ranging from 0–78°. In the first class, the value ranges from 0–5.8, which shows a gentle slope in that region, indicating a very suitable zone for ground water potential; for classes with increased slope, the greater the slope, the lower the ground water potential.
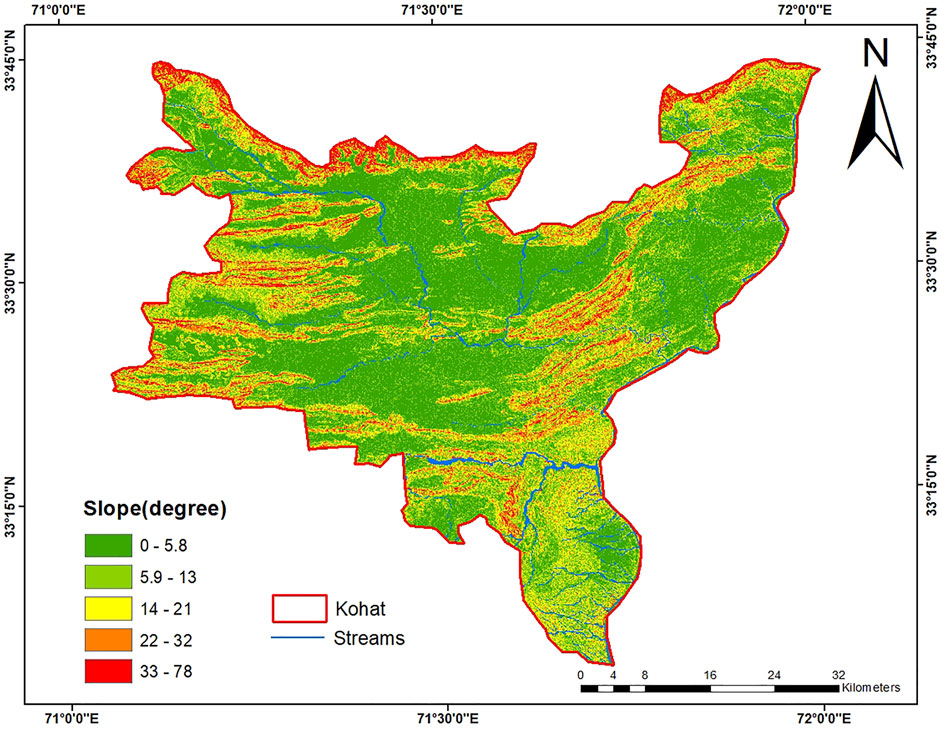
FIGURE 4. Slope map of the study area.
3.3 Drainage density
A key indicator of the hydrological landscape is drainage density, which determines the infiltration and underlying lithology (Murmu et al., 2019). Drainage density is the ratio of the length of all the streams and the aggregate area of the drainage basin (Avtar et al., 2011). Due to the high probability of groundwater recharge, areas with lower drainage density generally have higher groundwater potential (Andualem and Demeke, 2019). Areas with high drainage density generally have low potential for groundwater recharge due to high runoff rate (Thomas et al., 2017). Drainage density is an important parameter in evaluating the distribution of the groundwater potential of an area (Harinarayana et al., 2000). Drainage density plays an important role in groundwater accessibility and contamination (Ganapuram et al., 2009). Drainage density is inversely related to permeability (Chowdhury et al., 2009). Figure 5 shows drainage density data. The drainage density data were organized into five classes, with values ranging from 0 to 1.3. In the first class, the values range from 0–0.32, indicating high drainage density and low ground water potential. In classes with increased values, indicating lower drainage density, the lower the drainage density, the higher the ground water potential.
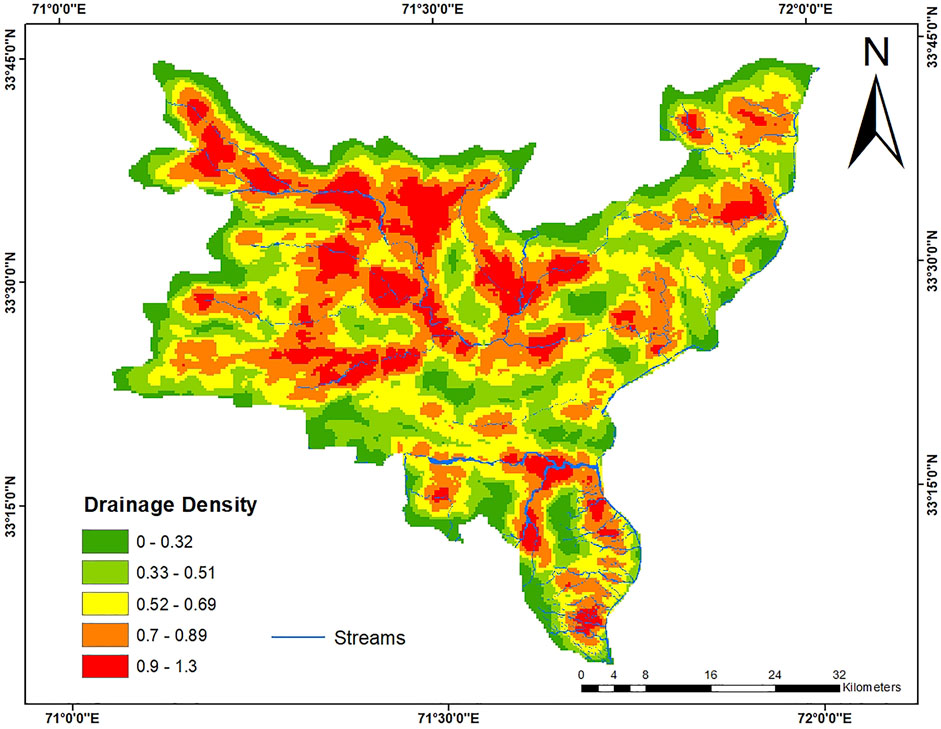
FIGURE 5. Drainage density map of the study area.
3.4 Lineament density
Lineaments are linear or wavy features and can be recognized from satellite images due to their linear positioning (Nampak et al., 2014). Lineaments and their connections play an important role in crystalline rock in terms of incidence and movement of groundwater resources (Prasad et al., 2008). The occurrence of fractures, cracks, and lineaments controls the rate of flow and movement of groundwater in the solid rock by secondary porosity (Murmu et al., 2019). High lineament density areas favor GWPZs due to high infiltration rate (Srivastava et al., 2012). Lineaments are the “lines in the landscape” visible at the Earth’s surface as important features (Kumar et al., 2014). Figure 6 shows lineament density data. We organized lineament density into five classes, with values ranging from 0 to 1. In the first class, the values range from 0 to 0.8, which indicate high lineament density and suggest very suitable zones with high ground water potential. In classes with increased values, indicating lower lineament density, the lower the lineament density, the lower the ground water potential.
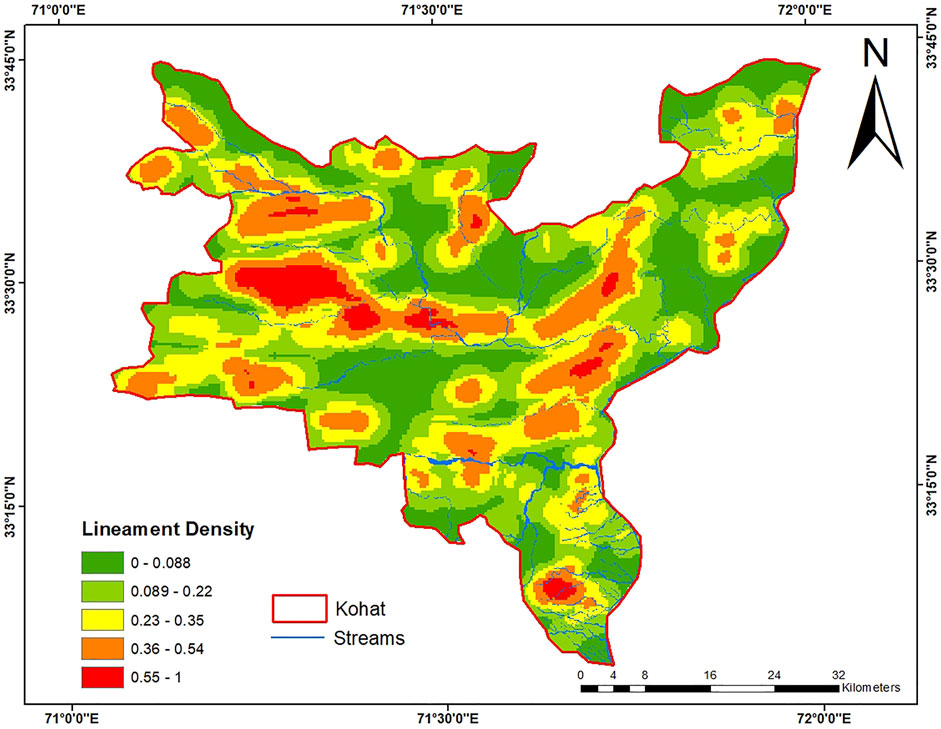
FIGURE 6. Lineament map of the study area.
3.5 Geology
Geological structures play a significant role in controlling the quantity and quality of groundwater (Aneesh and Deka, 2015). Geological settings play an important role in the existence and circulation of groundwater in any landscape (Yeh et al., 2016). Unconsolidated sedimentary and fractured crystalline rock is more favorable for groundwater movement and storage related to massive rock types (Murmu, 2023). Geological structure plays a significant role in prediction of GWPZs (Biswas et al., 2020). Geological factors affect the porosity and permeability of subsurface rocks (Rahmati et al., 2015). Higher porosity and permeability lead to greater groundwater storage and yields. Almost all the rocks exposed in our research area were sedimentary rocks; we weighted them highly, indicating and inferring high ground water potential, as shown in Figure 7.
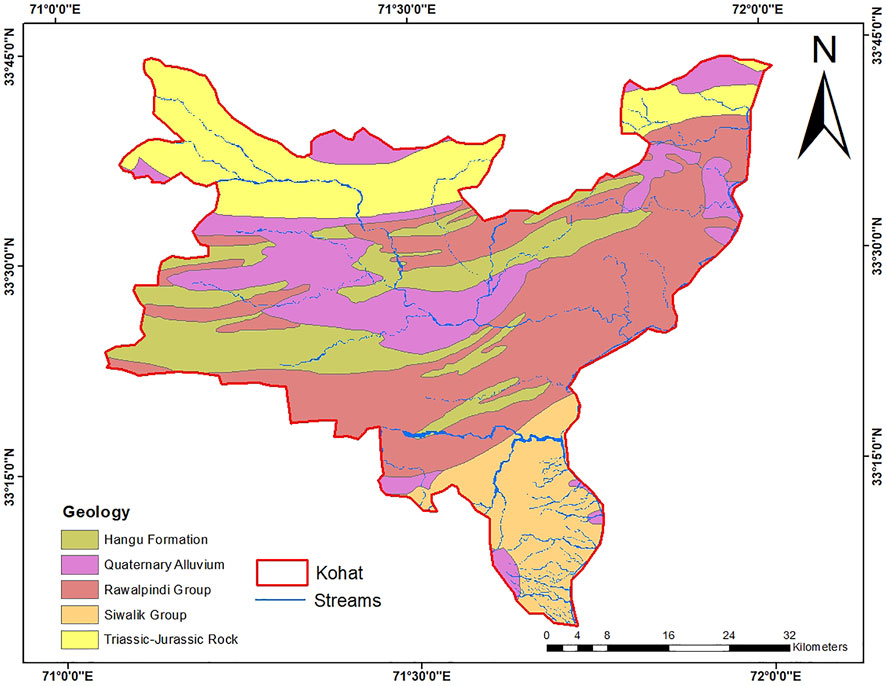
FIGURE 7. Geological map of the study area.
3.6 Land use/land cover
Land use/land cover is an important aspect in recognizing GWPZs (Abrar et al., 2021). Built-up areas inhibit the subsurface infiltration of groundwater. Thus, areas with vegetation cover have higher groundwater potential (Adewumi and Anifowose, 2017). Land use/land cover gives information about groundwater, infiltration, surface water, and soil moisture and shows groundwater conditions (Rajaveni et al., 2017). Land use/land cover is disturbing groundwater recharge, existence, and availability (Selvam et al., 2016). Land use/land cover is divided into four major classes: class 1 indicates urban areas, which are associated with poor ground water potential; class 2 indicates vegetation, which is associated with good ground water potential; class 3 indicates water bodies, which are associated with very high ground water potential; and class 4 indicates barren lands, which are associated with high ground water potential (Figure 8).
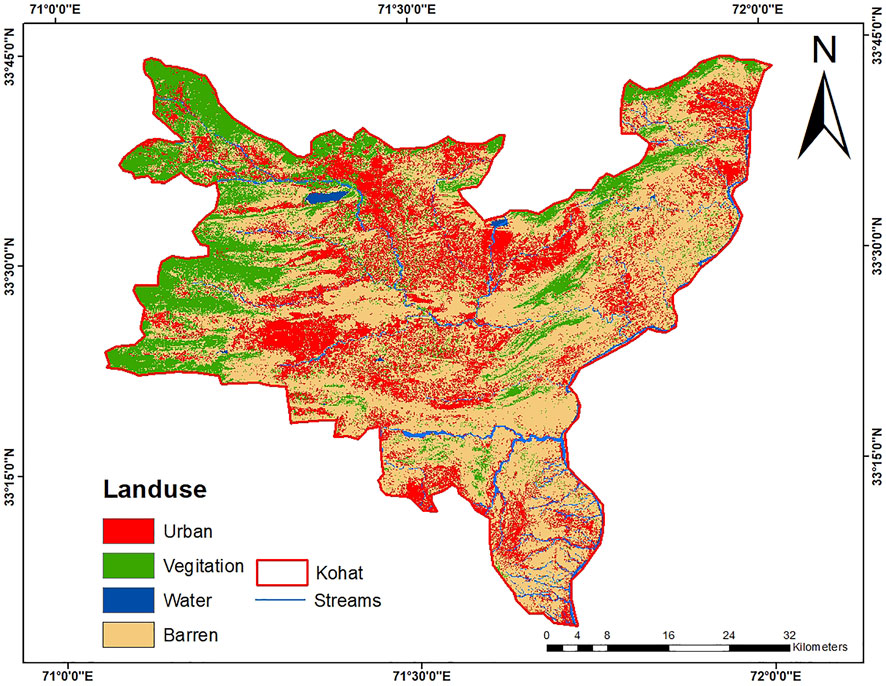
FIGURE 8. Land use map of the study area.
3.7 Soil
Soil plays a key role in the spatial distinction of groundwater recharge (Mehra et al., 2016). The groundwater table is primarily recharged by infiltration, several drainage systems, and adjacent water channels (Mokadem et al., 2018). The study of soil is an important factor in delineating groundwater recharge potential. Groundwater recharge depends upon factors such as water holding capacity, soil thickness, porosity, and runoff (Doke et al., 2021). Soil plays an important role in groundwater recharge, as recharge is dependent upon the water penetrating the ground (Nag et al., 2022). Soil texture has a great impact on the availability of groundwater in an area. Figure 9 shows soil data, which indicate three types of soil: gravel soils contain gravel and have high permeability, which contributes to high ground water potential; shallow, loamy soil has good ground water potential; and pure loamy soil has very poor ground water potential.
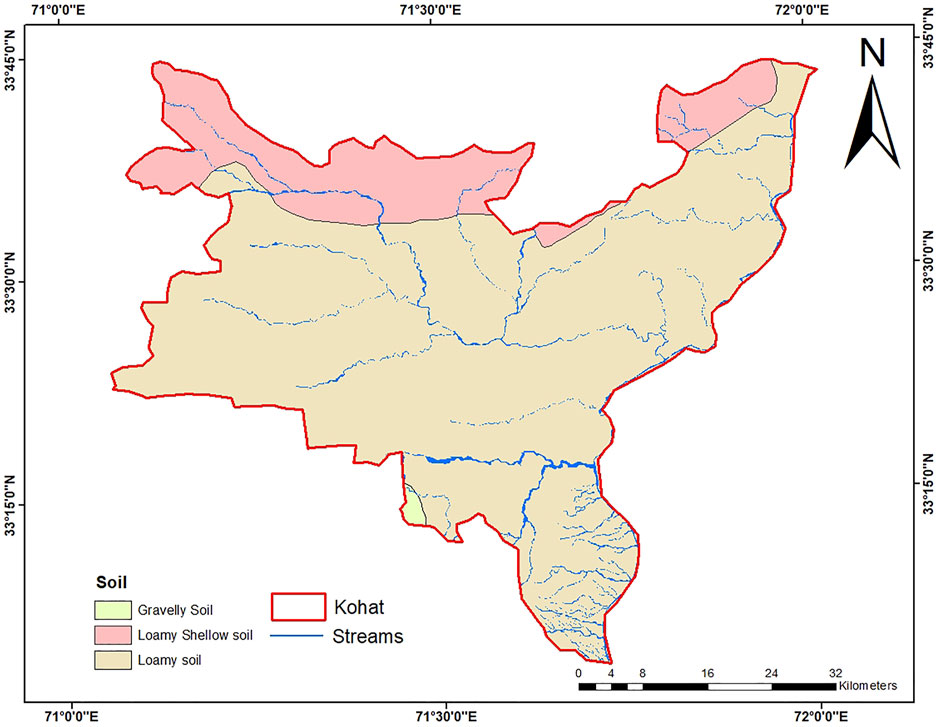
FIGURE 9. Soil map of the study area.
3.8 Groundwater potential zones by MIF
The systematic analysis of weighted parameters using MIF techniques produced a suitable GWPZ map in raster format, using the raster calculator module in the ArcGIS 10.5 environment, by integrating all the maps (Figure 10). The map sequence adopted in this study was 1) lineament density, 2) rainfall, 3) lithology, 4) slope degree, and 5) drainage density.
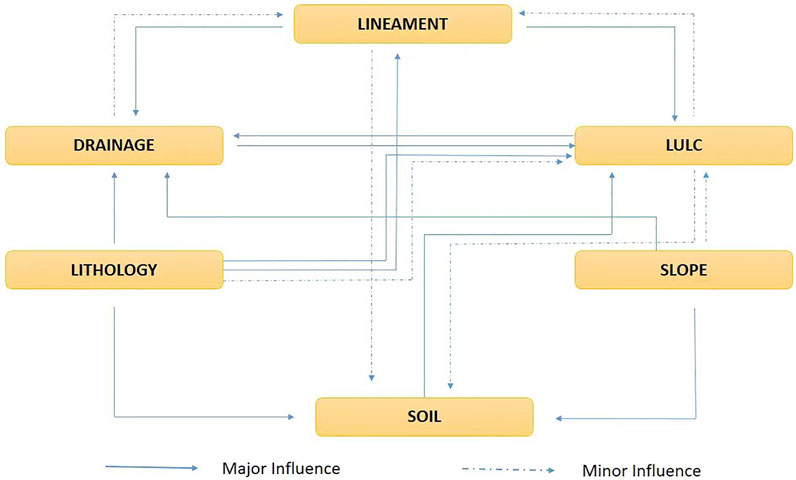
FIGURE 10. Schematic workflow showing integration of various parameters for GWPZ determination.
According to the quintile method, the MIF values were classified into five GWPZ groups: very high, high, good, poor, and very poor (Figure 11). Our analysis demonstrated that only 21% (122 km/sq.km) of the study area exhibited poor ground water potential, with nearly all located in the northern half of the study area. Most of the regions under investigation (326 km/sq.km) showed good to excellent groundwater potential (southern-central regions and a small part of the northern half). About 24% (141 km/sq.km) of the area was classified as having good groundwater potential (most regions of the northern half and some regions of the southern half). The presence of excellent to good ground water potential resulting from groundwater potential mapping in the aforementioned regions may pertain to the presence of high lineament density, high rainfall, limestone as the dominant lithology, slope degree of lower than 30°, and low drainage density in these regions. The presence of these features in the study area increase the chance of infiltration and storage of groundwater. Due to the occurrence of significant rainfall, this effect will be greater. In contrast, good to poor GWPZs are characterized by good to low lineament density, low rainfall, shale and marl and shale and limestone lithology, slope degree of more than 30°, and high drainage density. Therefore, there is less capacity for groundwater infiltration, and more rainfall is expected to flow through surface runoff. The GWPZ mapping can be useful for hydrologists in detecting new zones of potential groundwater (Shekhar and Pandey, 2015).

FIGURE 11. Map representing GWP zones.
Overall, the study area included up to 2,952.40 km/sq.km, with the spatial extent of the GWPZs distributed in five classes. Therefore, we determined the area covered by each zone class and demonstrated that very high GWPZs covered 398.96 km/sq.km, high GWPZs covered 1,113.791 km/sq.km, good GWPZs covered 370.97 km/sq.km, poor GWPZs covered 932.2 km/sq.km, and very poor GWPZs covered 136.48 km/sq.km.
3.9 Validation of results
In the absence of a validation process, models do not have scientific significance (Remondo et al., 2003). The location and existence of springs and their catchment areas, along with sinkholes in the study area, were used to validate groundwater potential (Figure 10). To verify the study results, water depth/water table data from 150 wells were collected along with their global positioning system (GPS) location. The results from MIF were then validated by conducting a field survey of the groundwater table. During the survey, field samples were collected by using a groundwater table indicator and a handheld GPS device for geotagging. The results were compiled on a detailed questionnaire designed for the field investigation. The GPS coordinates were recorded on the questionnaire and via the GPS receiver. The coordinates from the receiver were transferred in GPX format using EasyGPS software. The Data Interoperability tool in ArcGIS was used to convert the GPX format data into a shape file. The groundwater table data were spatially joined to the shape file using the Join and Relate tool.
The groundwater potential results determined using MIF modeling were then overlaid with the collected field data to validate the results (Table 4). The water table in the study area ranged from 35 to 210 m. The wells were divided into five groups. The delineated GWPZ data were overlaid with the good data from the field study. The overlay analysis revealed that most wells with high and medium groundwater depths were well within the very high and high GWPZs.
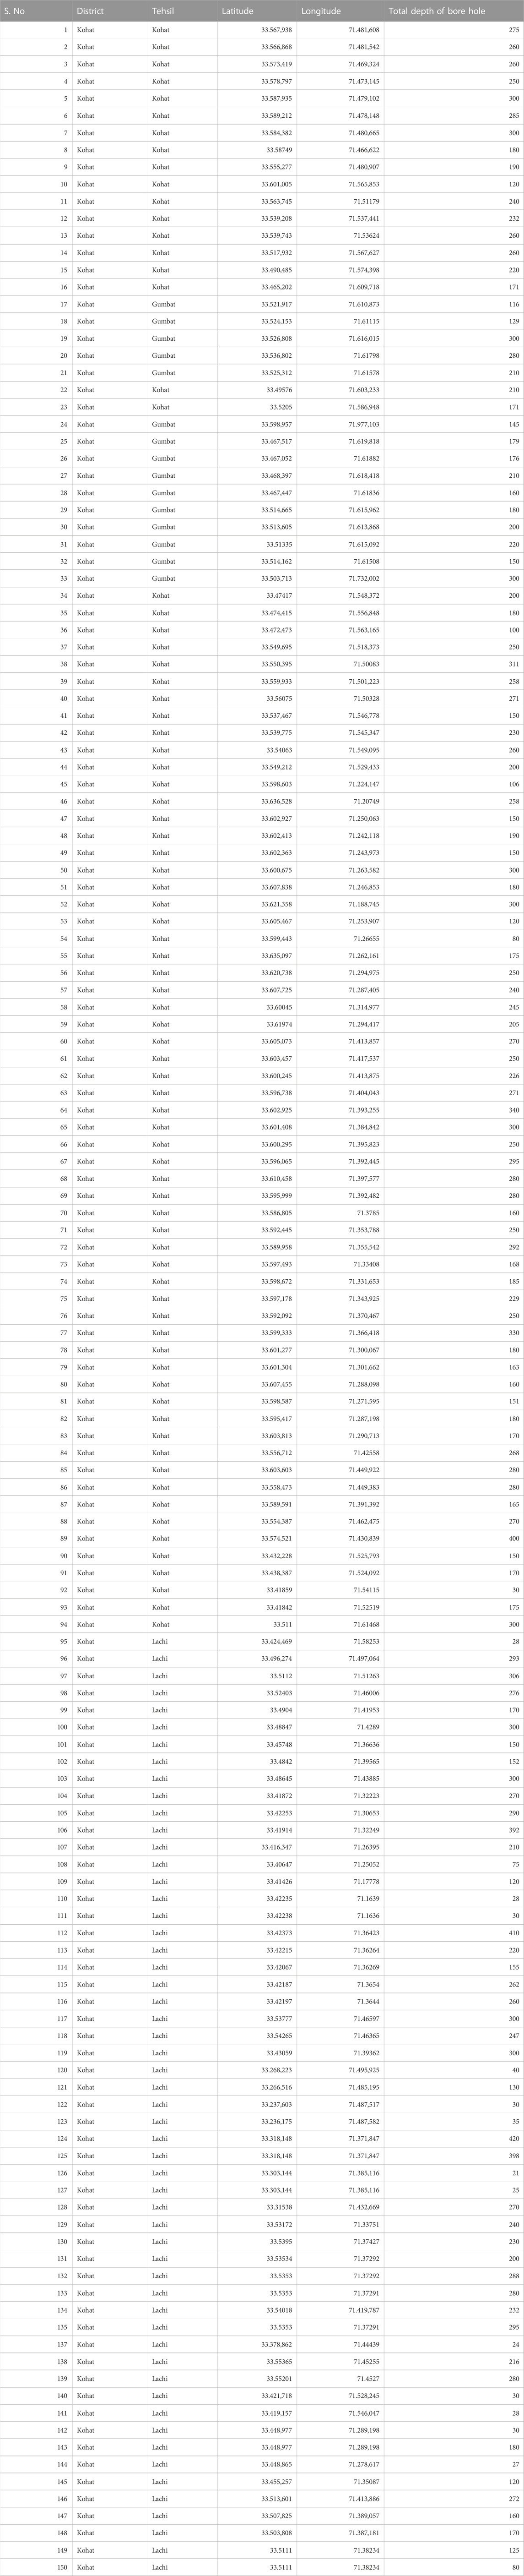
TABLE 4. Water table depth at various locations in the study area.
3.10 Accuracy assessment by using confusing matrix
After obtaining the land use/land cover classification results, accuracy assessments were carried out. For that purpose, the user, producer, and overall accuracy matrix were run to assess accuracy. User accuracy was obtained by dividing all correctly classified cells by total reference points. For this study, reference points were taken from Google Earth. Producer accuracy was also obtained by dividing the total cells with correct land use/land cover classification by total ground truth pixels; to obtain overall accuracy, correctly classified cells were divided by all pixels (Table 5).
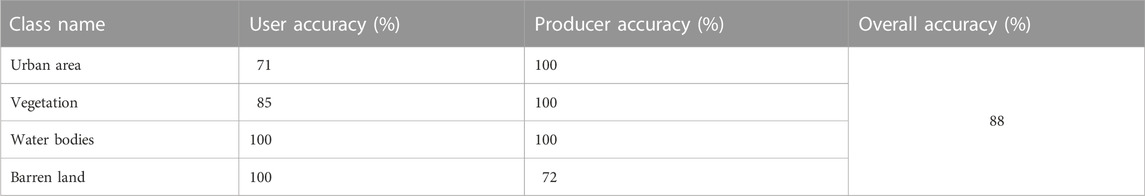
TABLE 5. Accuracy assessment of land use map.
4 Conclusion
We used the MIF method to investigate GWPZs in the Kohat District, Pakistan. For this purpose, various datasets were collected from different sources and processed using the ArcMap 10.5 spatial analysis tool. Several influencing parameters were then selected from the study area, such as land use/land cover, rainfall, slope, drainage density, geology, lineament density, and soil. These parameters were weighted based on their importance in evaluating GWPZs in the study area. The GWPZs were classified as very poor, poor, good, high, and very high. Our results revealed that out of an area of 2,952.40 km/sq.km area, 4.62% of the area were very poor GWPZs, 31.57% were poor GWPZs, 12.57% were good GWPZs, 37.72% were high GWPZs, and 13.51% were very high GWPZs. Data from a total of 150 wells with GPS-specified locations were collected to verify the study results. In the study area, the water table ranged from 35 to 210 m, and the GWPZ data overlaid with well data revealed that most wells with high and medium groundwater depths were well within the very high and high GWPZs.
In this study, the MIF method was useful in evaluating potential groundwater zones in the study area by utilizing the RS dataset. However, due to the limited availability of the dataset for suitable parameter selection, there were limitations affecting our results. Therefore, future study with selection of more parameters and their integration with machine learning prediction models will help further delineate GWPZs in the study area. The findings of this investigation may be helpful in development of compelling strategies for manageable groundwater asset advancement.
Data availability statement
The original contributions presented in the study are included in the article/supplementary material, and further inquiries can be directed to the corresponding author.
Author contributions
Conceptualization, HF and ZK; methodology, ZK; software, FI; validation, HF, RK, and ZK; formal analysis, IK and RA; investigation, HF and ET; resources, FI; data curation, HF; writing—original draft preparation, HF; writing—review and editing, ZK, HF, and RH; visualization, FI; supervision, ZK; project administration, RK, IK, and ET; funding acquisition, HF. All authors have read and agreed to the published version of the manuscript.
Acknowledgments
The authors truly appreciate Muhammad Ishfaq for his supervision throughout this research.
Conflict of interest
The authors declare that the research was conducted in the absence of any commercial or financial relationships that could be construed as a potential conflict of interest.
Publisher’s note
All claims expressed in this article are solely those of the authors and do not necessarily represent those of their affiliated organizations, or those of the publisher, the editors and the reviewers. Any product that may be evaluated in this article, or claim that may be made by its manufacturer, is not guaranteed or endorsed by the publisher.
References
Abrar, H., Legesse Kura, A., Esayas Dube, E., and Likisa Beyene, D. (2021). AHP based analysis of groundwater potential in the Western escarpment of the Ethiopian rift valley. Geol. Ecol. Landscapes, 1–14. doi:10.1080/24749508.2021.1952761
Adewumi, A. J., and Anifowose, Y. B. (2017). Hydrogeologic characterization of Owo and its environs using remote sensing and GIS. Appl. Water Sci. 7 (6), 2987–3000. doi:10.1007/s13201-017-0611-8
Adiat, K., Nawawi, M., and Abdullah, K. (2012). Assessing the accuracy of GIS-based elementary multi criteria decision analysis as a spatial prediction tool–a case of predicting potential zones of sustainable groundwater resources. J. Hydrology 440, 75–89. doi:10.1016/j.jhydrol.2012.03.028
Agarwal, R., Garg, P. K., and Garg, R. D. (2013). Remote sensing and GIS based approach for identification of artificial recharge sites. Water Resour. Manag. 27 (7), 2671–2689. doi:10.1007/s11269-013-0310-7
Andualem, T. G., and Demeke, G. G. (2019). Groundwater potential assessment using GIS and remote sensing: A case study of guna tana landscape, upper blue nile basin, Ethiopia. J. Hydrology Regional Stud. 24, 100610. doi:10.1016/j.ejrh.2019.100610
Aneesh, R., and Deka, P. C. (2015). Groundwater potential recharge zonation of Bengaluru urban district—A GIS based analytic hierarchy process (AHP) technique approach. Int. Adv. Res. J. Sci. Eng. Technol. 2 (6), 129–136. doi:10.1007/s40808-020-00744-7
Arkoprovo, B. (2012). Delineation of groundwater potential zones using satellite remote sensing and geographic information system techniques: A case study from ganjam district, Orissa, India. Res. J. Recent Sci. 1, 59–66.
Avtar, R., Singh, C. K., Singh, G., Verma, R. L., Mukherjee, S., and Sawada, H. (2011). Landslide susceptibility zonation study using remote sensing and GIS technology in the Ken-Betwa River Link area, India. Bull. Eng. Geol. Environ. 70 (4), 595–606. doi:10.1007/s10064-011-0368-5
Bhuiyan, C., Singh, R. P., and Flugel, W. A. (2009). Modelling of ground water recharge-potential in the hard-rock aravalli terrain, India: A GIS approach. Environ. Earth Sci. 59 (4), 929–938. doi:10.1007/s12665-009-0087-4
Biswas, S., Mukhopadhyay, B. P., and Bera, A. (2020). Delineating groundwater potential zones of agriculture dominated landscapes using GIS based AHP techniques: A case study from uttar dinajpur district, West Bengal. Environ. Earth Sci. 79 (12), 302–325. doi:10.1007/s12665-020-09053-9
Cai, Z., and Ofterdinger, U. (2016). Analysis of groundwater-level response to rainfall and estimation of annual recharge in fractured hard rock aquifers, NW Ireland. J. Hydrology 535, 71–84. doi:10.1016/j.jhydrol.2016.01.066
Chatterjee, S., and Dutta, S. (2022). Assessment of groundwater potential zone for sustainable water resource management in south-Western part of Birbhum District, West Bengal. Appl. Water Sci. 12 (3), 40–16. doi:10.1007/s13201-021-01549-4
Chowdhury, A., Jha, M. K., Chowdary, V. M., and Mal, B. C. (2009). Integrated remote sensing and GIS-based approach for assessing groundwater potential in West Medinipur district, West Bengal, India. Int. J. Remote Sens. 30 (1), 231–250. doi:10.1080/01431160802270131
Das, B., and Pal, S. C. (2019). Combination of GIS and fuzzy-AHP for delineating groundwater recharge potential zones in the critical Goghat-II block of West Bengal, India. HydroResearch 2, 21–30. doi:10.1016/j.hydres.2019.10.001
Das, N., and Mukhopadhyay, S. (2020). Application of multi-criteria decision making technique for the assessment of groundwater potential zones: A study on birbhum district, West Bengal, India. Environ. Dev. Sustain. 22 (2), 931–955. doi:10.1007/s10668-018-0227-7
Deepa, S., Venkateswaran, S., Ayyandurai, R., Kannan, R., and Vijay Prabhu, M. (2016). Groundwater recharge potential zones mapping in upper Manimuktha Sub basin Vellar river Tamil Nadu India using GIS and remote sensing techniques. Model. Earth Syst. Environ. 2 (3), 137–139. doi:10.1007/s40808-016-0192-9
Doke, A. B., Zolekar, R. B., Patel, H., and Das, S. (2021). Geospatial mapping of groundwater potential zones using multi-criteria decision-making AHP approach in a hardrock basaltic terrain in India. Ecol. Indic. 127, 107685. doi:10.1016/j.ecolind.2021.107685
Ganapuram, S., Kumar, G. V., Krishna, I. M., Kahya, E., and Demirel, M. C. (2009). Mapping of groundwater potential zones in the Musi basin using remote sensing data and GIS. Adv. Eng. Softw. 40 (7), 506–518. doi:10.1016/j.advengsoft.2008.10.001
Harinarayana, P. (2000). Remote sensing data for groundwater development and management in Keralapura watersheds of Cauvery basin, Karnataka, India. Indian Mineral. 34 (2), 11–17.
Hussain, I., Zakir, S., Maqbool, A., and Waqar, F. M. (2011). Water balance, supply and demand and irrigation efficiency of Indus Basin. Pak. Econ. Soc. Rev. 49, 13–38.
Ibrahim-Bathis, K., and Ahmed, S. (2016). Geospatial technology for delineating groundwater potential zones in Doddahalla watershed of Chitradurga district, India. Egypt. J. Remote Sens. Space Sci. 19 (2), 223–234. doi:10.1016/j.ejrs.2016.06.002
Ifediegwu, S. I. (2022). Assessment of groundwater potential zones using GIS and AHP techniques: A case study of the lafia district, nasarawa state, Nigeria. Appl. Water Sci. 12 (1), 10–17. doi:10.1007/s13201-021-01556-5
Khair, S. M., Mushtaq, S., Culas, R. J., and Hafeez, M. (2012). Groundwater markets under the water scarcity and declining watertable conditions: The upland Balochistan Region of Pakistan. Agric. Syst. 107, 21–32. doi:10.1016/j.agsy.2011.11.007
Konikow, L. F., and Kendy, E. (2005). Groundwater depletion: A global problem. Hydrogeology J. 13 (1), 317–320. doi:10.1007/s10040-004-0411-8
Kumar, T., and Gautam, A. K. (2014). Appraising the accuracy of GIS-based multi-criteria decision making technique for delineation of groundwater potential zones. Water Resour. Manag. 28 (13), 4449–4466. doi:10.1007/s11269-014-0663-6
Lee, S., Song, K. Y., Kim, Y., and Park, I. (2012). Regional groundwater productivity potential mapping using a geographic information system (GIS) based artificial neural network model. Hydrogeology J. 20 (8), 1511–1527. doi:10.1007/s10040-012-0894-7
Magesh, N. S., Chandrasekar, N., and Soundranayagam, J. P. (2012). Delineation of groundwater potential zones in Theni district, Tamil Nadu, using remote sensing, GIS and MIF techniques. Geosci. Front. 3 (2), 189–196. doi:10.1016/j.gsf.2011.10.007
Magesh, N. S., Chandrasekar, N., and Soundranayagam, J. P. (2011). Morphometric evaluation of papanasam and manimuthar watersheds, parts of western ghats, tirunelveli district, Tamil nadu, India: A GIS approach. Environ. Earth Sci. 64 (2), 373–381. doi:10.1007/s12665-010-0860-4
Mehra, M., Oinam, B., and Singh, C. K. (2016). Integrated assessment of groundwater for agricultural use in Mewat district of Haryana, India using geographical information system (GIS). J. Indian Soc. Remote Sens. 44 (5), 747–758. doi:10.1007/s12524-015-0541-6
Mokadem, N., Redhaounia, B., Besser, H., Ayadi, Y., Khelifi, F., Hamad, A., et al. (2018). Impact of climate change on groundwater and the extinction of ancient “foggara” and springs systems in arid lands in north africa: A case study in gafsa basin (central of Tunisia). Euro-Mediterranean J. Environ. Integration 3 (1), 28–14. doi:10.1007/s41207-018-0070-0
Moodley, T., Seyam, M., Abunama, T., and Bux, F. (2022). Delineation of groundwater potential zones in KwaZulu-Natal, South Africa using remote sensing, GIS and AHP. J. Afr. Earth Sci. 193, 104571. doi:10.1016/j.jafrearsci.2022.104571
Murmu, P., Mukesh, K., Deepak, L., Irjesh, S., and Sudhir Kumar, S. (2019). Delineation of groundwater potential zones using geospatial techniques and analytical hierarchy process in Dumka district, Jharkhand, India. Groundw. Sustain. Dev. 9, 100239. doi:10.1016/j.gsd.2019.100239
Nag, S., Roy, M. B., and Roy, P. K. (2022). Study on the functionality of land use land cover over the evaluation of groundwater potential zone: A fuzzy AHP based approach. J. Earth Syst. Sci. 131 (3), 1–25. doi:10.1007/s12040-022-01872-7
Nampak, H., Pradhan, B., and Manap, M. A. (2014). Application of GIS based data driven evidential belief function model to predict groundwater potential zonation. J. Hydrology 513, 283–300. doi:10.1016/j.jhydrol.2014.02.053
Narayanan, M., and Venugopal, T. (2021). Identification of groundwater potential zones using geospatial techniques in palar river basin, Tamil nadu, India. Sociol. Res. 6 (4). doi:10.21203/rs.3.rs-625147/v1
Nasir, M. J., Khan, S., Zahid, H., and Khan, A. (2018). Delineation of groundwater potential zones using GIS and multi influence factor (MIF) techniques: A study of district swat, khyber Pakhtunkhwa, Pakistan. Environ. Earth Sci. 77 (10), 1–11. doi:10.1007/s12665-018-7522-3
Pourtaghi, Z. S., and Pourghasemi, H. R. (2014). GIS-based groundwater spring potential assessment and mapping in the Birjand Township, southern Khorasan Province, Iran. Hydrogeology J. 22 (3), 643–662. doi:10.1007/s10040-013-1089-6
Prasad, R., Mondal, N. C., Banerjee, P., Nandakumar, M. V., and Singh, V. S. (2008). Deciphering potential groundwater zone in hard rock through the application of GIS. Environ. Geol. 55 (3), 467–475. doi:10.1007/s00254-007-0992-3
Rahmati, O., Nazari Samani, A., Mahdavi, M., Pourghasemi, H. R., and Zeinivand, H. (2015). Groundwater potential mapping at Kurdistan region of Iran using analytic hierarchy process and GIS. Arabian J. Geosciences 8 (9), 7059–7071. doi:10.1007/s12517-014-1668-4
Rajasekhar, M., Sudarsana Raju, G., Sreenivasulu, Y., and Siddi Raju, R. (2019). Delineation of groundwater potential zones in semi-arid region of Jilledubanderu river basin, Anantapur District, Andhra Pradesh, India using fuzzy logic, AHP and integrated fuzzy-AHP approaches. HydroResearch 2, 97–108. doi:10.1016/j.hydres.2019.11.006
Rajaveni, S., Brindha, K., and Elango, L. (2017). Geological and geomorphological controls on groundwater occurrence in a hard rock region. Appl. Water Sci. 7 (3), 1377–1389. doi:10.1007/s13201-015-0327-6
Razandi, Y., Pourghasemi, H. R., Neisani, N. S., and Rahmati, O. (2015). Application of analytical hierarchy process, frequency ratio, and certainty factor models for groundwater potential mapping using GIS. Earth Sci. Inf. 8 (4), 867–883. doi:10.1007/s12145-015-0220-8
Remondo, J., Gonzalez, A., De Teran, J. R. D., Cendrero, A., Fabbri, A., and Chung, C. J. F. (2003). Validation of landslide susceptibility maps; examples and applications from a case study in Northern Spain. Nat. Hazards 30 (3), 437–449. doi:10.1023/b:nhaz.0000007201.80743.fc
Selvam, S., Dar, F. A., Magesh, N. S., Singaraja, C., Venkatramanan, S., and Chung, S. Y. (2016). Application of remote sensing and GIS for delineating groundwater recharge potential zones of Kovilpatti Municipality, Tamil Nadu using IF technique. Earth Sci. Inf. 9 (2), 137–150. doi:10.1007/s12145-015-0242-2
Selvam, S., Magesh, N. S., Chidambaram, S., Rajamanickam, M., and Sashikkumar, M. C. (2015). A GIS based identification of groundwater recharge potential zones using RS and IF technique: A case study in ottapidaram taluk, tuticorin district, Tamil nadu. Environ. Earth Sci. 73 (7), 3785–3799. doi:10.1007/s12665-014-3664-0
Shah, T. (2007). “The groundwater economy of south Asia: An assessment of size, significance and socio-ecological impacts,” in The agricultural groundwater revolution: Opportunities and threats to development (Wallingford, UK: CAB International), 7–36. doi:10.1079/9781845931728.0007
Shekhar, S., and Pandey, A. C. (2015). Delineation of groundwater potential zone in hard rock terrain of India using remote sensing, geographical information system (GIS) and analytic hierarchy process (AHP) techniques. Geocarto Int. 30 (4), 402–421. doi:10.1080/10106049.2014.894584
Singh, P., Thakur, J. K., and Kumar, S. (2013). Delineating groundwater potential zones in a hard-rock terrain using geospatial tool. Hydrological Sci. J. 58 (1), 213–223. doi:10.1080/02626667.2012.745644
Srivastava, P. K., Gupta, M., and Mukherjee, S. (2012). Mapping spatial distribution of pollutants in groundwater of a tropical area of India using remote sensing and GIS. Appl. Geomatics 4 (1), 21–32. doi:10.1007/s12518-011-0072-y
Taloor, A. K., Pir, R. A., Adimalla, N., Ali, S., Manhas, D. S., Roy, S., et al. (2020). Spring water quality and discharge assessment in the Basantar watershed of Jammu Himalaya using geographic information system (GIS) and water quality Index (WQI). Groundw. Sustain. Dev. 10, 100364. doi:10.1016/j.gsd.2020.100364
Thapa, R., Gupta, S., Guin, S., and Kaur, H. (2017). Assessment of groundwater potential zones using multi-influencing factor (MIF) and GIS: A case study from birbhum district, West Bengal. Appl. Water Sci. 7 (7), 4117–4131. doi:10.1007/s13201-017-0571-z
Thomas, R., and Vijayasekaran, D. (2017). Vulnerability to groundwater drought in semi-arid areas of western Ahmednagar District, India. Delhi, India: ASSAR.
Tweed, S. O., Leblanc, M., Webb, J. A., and Lubczynski, M. W. (2007). Remote sensing and GIS for mapping groundwater recharge and discharge areas in salinity prone catchments, southeastern Australia. Hydrogeology J. 15 (1), 75–96. doi:10.1007/s10040-006-0129-x
Yeh, H.-F., Cheng, Y. S., Lin, H. I., and Lee, C. H. (2016). Mapping groundwater recharge potential zone using a GIS approach in Hualian River, Taiwan. Sustain. Environ. Res. 26 (1), 33–43. doi:10.1016/j.serj.2015.09.005
Zabihi, M., Pourghasemi, H. R., Pourtaghi, Z. S., and Behzadfar, M. (2016). GIS-based multivariate adaptive regression spline and random forest models for groundwater potential mapping in Iran. Environ. Earth Sci. 75 (8), 1–19. doi:10.1007/s12665-016-5424-9
Keywords: GIS, land use, multi-influencing factors, weighted overlay, geology, groundwater potential
Citation: Faheem H, Khattak Z, Islam F, Ali R, Khan R, Khan I and Tag Eldin E (2023) Groundwater potential zone mapping using geographic information systems and multi-influencing factors: A case study of the Kohat District, Khyber Pakhtunkhwa. Front. Earth Sci. 11:1097484. doi: 10.3389/feart.2023.1097484
Received: 14 November 2022; Accepted: 11 January 2023;
Published: 26 January 2023.
Edited by:
Saumitra Mukherjee, Jawaharlal Nehru University, IndiaReviewed by:
Harshita Asthana, Jawaharlal Nehru University, IndiaPolina Lemenkova, Université libre de Bruxelles, Belgium
Sarita Gajbhiye Meshram, Rani Durgavati University, India
Copyright © 2023 Faheem, Khattak, Islam, Ali, Khan, Khan and Tag Eldin. This is an open-access article distributed under the terms of the Creative Commons Attribution License (CC BY). The use, distribution or reproduction in other forums is permitted, provided the original author(s) and the copyright owner(s) are credited and that the original publication in this journal is cited, in accordance with accepted academic practice. No use, distribution or reproduction is permitted which does not comply with these terms.
*Correspondence: Rehan Khan, cmVoYW5raGFuQGNzdS5lZHUuY24=