- 1School of Resources and Geosciences, China University of Mining and Technology, Xuzhou, China
- 2State Key Laboratory for Geomechanics and Deep Underground Engineering, China University of Mining and Technology, Xuzhou, China
- 3School of Mechanics and Civil Engineering, China University of Mining and Technology, Xuzhou, China
A fault is a main cause for water inrush in coal mines. The detection of faults plays an important role in the prevention and governance of water inrush in coal mines. It is hard to determine the direction of seismic wave propagation under the condition of full space of mines, leading to difficulty in accurate fault detection. This paper compares and analyzes the polarization information extraction capability of time-domain polarization analysis, frequency-domain polarization analysis, and time-frequency (TF)-domain polarization analysis, and proposes a TF-domain polarization analysis-based method for locating faults in coal mines. Firstly, the polarization analysis of signals mixed in the time domain was carried out. The results of three kinds of polarization analysis show that the TF-domain polarization analysis can accurately determine the polarization direction of multi-type signals in the case of aliasing. Secondly, a time-space-domain high-order three-dimensional three-component numerical simulation experiment was conducted. The TF-domain polarization analysis was adopted to extract the polarization information of each geophone and locate the fault. The error of the predicted fault strike was 0.16°, and the distance deviation was about 2.03%. Finally, in-situ three-component seismic signals of coal mine were used to predict the location and strike of fault. The data from on-site actual drilling verified the effectiveness of the mine fault location method based on the TF-domain polarization analysis. The predicted fault strike is consistent with the drilling data, and the distance deviation is about 5.5%.
Introduction
Water inrush is the main accident in mines. Fracture structure is a main cause for water inrush in coal mines, and a fault is the most typical one. According to statistics, 80% of water inrush accidents are related to faults (Wu et al., 2020). Therefore, the detection of hidden faults is very significant for the safety production of coal mines. However, it is difficult to detect faults accurately in underground coal mines at present. We propose a fault location method based on polarization analysis.
Polarization analysis is a mathematical algorithm proposed by Flinn in 1965 (Flinn, 1965). Polarization information such as propagation direction and polarizability of seismic wave can be obtained by polarization analysis of three-component seismic data. The earliest polarization analysis was carried out in the time domain in terms of signals. The time-domain polarization analysis can produce polarization information of the measured seismic wave signals at different times. Park proposed the frequency-domain polarization analysis (Park et al., 1987) in 1987, which could generate polarization information of the measured seismic wave signals at different frequencies. In 2001, Reading et al. created the prototype of time-frequency (TF)-domain polarization analysis by applying Fourier transform to each period of three-component data and calculating eigenvalues and eigenvectors to establish filters (Reading et al., 2001). The TF-domain polarization analysis can help obtain the polarization information of seismic wave signals at different times and frequencies.
Currently, in seismic exploration, polarization analysis is mainly used for detection under the half-space conditions in seismic exploration of the ground or sea surface. Kong et al. used TF-domain polarization analysis to conduct surface wave filtering of ground seismic data collected from Sichuan Basin in 2018 (Kong et al., 2018). Kakhki et al. performed Rayleigh wave separation from seismic records measured by PEMO stations in Canada in 2020 by adopting the TF-domain polarization analysis (Kakhki et al., 2020). In terms of offshore seismic exploration, Du et al. conducted TF-domain polarization analysis on the data of offshore seismic exploration for wave filtering in 2016 and improved the signal-to-noise ratio of the data (Du et al., 2016). However, there are few studies on polarization analysis for full-space conditions in seismic exploration of underground (Seismic waves can travel not only from below to the geophone, but also from above). Feng et al. identified the polarization degree of seismic waves by using polarization analysis and further extracted Rayleigh channel waves in 2016 (Feng et al., 2016). In 2018, Ji et al. proposed a channel wave polarization migration technique. This technique has directional selectivity and filters out other interfering waves during the migration process, eliminates the artificial mirror phenomenon, and provides a higher imaging accuracy than other methods (Ji et al., 2018). In 2019, Liu et al. defined the polarization direction of seismic waves by conducting the TF-domain polarization analysis of seismic records in mines, separated and filtered seismic waves based on the polarization direction of seismic waves, and used different types of seismic waves for imaging (Liu et al., 2019). The above scholars and most of the current scholars adopted polarization analysis in mine seismic exploration for wave filtering and wave field separation. But there is no research on fault location by using TF-domain polarization information directly under the full-space conditions of mines.
This paper raises a method for identifying the location and strike of a fault by using the TF-domain polarization information of three-component seismic signals. Firstly, in order to accurately extract the polarization information of seismic waves under complex conditions, it compared the time-domain polarization analysis, frequency-domain polarization analysis and TF-domain polarization analysis by using synthetic data, and studied the capability of each polarization analysis method to extract the polarization information of weak energy seismic waves in the presence of strong energy seismic waves. Then, a time-space-domain high-order three-dimensional three-component numerical simulation experiment was conducted to verify the feasibility of the fault location method. Finally, field experiments were carried out to demonstrate the effectiveness of the fault prediction method.
Principle of polarization analysis
The time-domain polarization analysis, frequency domain polarization analysis and time-frequency domain polarization analysis used in this paper all need to construct covariance matrix. The polarization information of seismic signals is further obtained by calculating the eigenvalues and eigenvectors of the covariance matrix.
Formation of covariance matrix in time-domain polarization analysis
After Hilbert transform of the three-component data ui(t) (i=x,y,z), uih(t) is obtained, and an analytic signal ci(t) is constructed (Diallo et al., 2005):
After obtaining the analytic signal ci(t) by Hilbert transform of ui(t), the ui (t+τ) (approximate value of u1 near t) can be obtained by using the analytic signal ci(t), which is stated as follows:
Where instantaneous frequency
Construct the covariance matrix:
Where k,m=(x,y,z); μkm is average value; Tkm(t) refers to the time window at time t. The expressions are stated as follows respectively:
Where ℜ is the real part of a complex number;
Where N is used to describe different polarization properties (generally equivalent to 1 or 2). When N is larger, it can describe 3D complex polarization properties (Liu et al., 2019).
Formation of covariance matrix in frequency-domain polarization analysis
By introducing the multi-taper spectral analysis method (MTM) into the frequency-domain polarization analysis, the spectral density matrix can be constructed with very small spectral leakage and very smooth (Chen et al., 2007).
Multi-taper spectral analysis is added to the fast Fourier transform of the three-component data ui(t) (i=x,y,z):
Where ωt(k)(N,W) is the k-order window function (k=0,1,…,K-1), and 2W refers to the width of the selected frequency band.
Build the spectral density matrix:
Where (·)* is a complex conjugate
Formation of covariance matrix in TF-domain polarization analysis
After transforming the signal ui(t) (i=x,y,z) into the TF domain using time-frequency transform, the analytic signal can be constructed as STi(t,f) (Feng et al., 2016). When the signal is converted to time-frequency domain by zeroing negative frequency and double positive frequency, the analytic signal can be obtained in TF domain. At time t in the time-frequency domain, the complex covariance matrix MS(t,f) at frequency f can be described as follows (Ma, 2012):
Each element in the matrix is defined as follows:
Where |SCk(t,f)| and |SCm(t,f)| refer to the instantaneous amplitudes of two groups of analytical signals; Ωk and Ωm are instantaneous frequencies; arg represents instantaneous phase; μkm(t,f) is mean value, which is defined as follows:
Where the function sinc(t) is defined as follows:
Tkm(t,f) is the adaptive time window length, which is defined as follows:
Where N is a positive integer, usually taken as 1 or 2.
Calculation of polarization parameters by using covariance matrix
The characteristics of the seismic wave vector can be described by polarization parameters which can be obtained by calculating the largest eigenvalue λ1 of the complex covariance matrix and its corresponding normalized eigenvectors (Vx,Vy,Vz) in the time-frequency domain (Wang and Huang, 2022).
The formula for the dominant polarized azimuth is stated as follows:
When −90°≤θ(t)≤90°, the dominant polarized azimuth represents the angle between the projection of the polarization principal axis on the XOY plane and X-axis. When the polarization principal axis is biased towards the positive direction of Y-axis, θ(t)>0°. When the polarization principal axis is biased towards the negative direction of Y-axis, θ(t)<0°.
The formula for the dominant polarized dip angle is stated as follows:
When −90°≤Φ(t)≤90°, the dominant polarized dip angle represents the angle between the polarization principal axis and the XOY plane. When the polarization principal axis is biased towards the positive direction of Z-axis, Φ(t)>0°. When the polarization principal axis is biased towards the negative direction of Z-axis, Φ(t)<0°.
Principle of locating the fault by virtual source method
As shown in Figure 1A, in a common shot gather, the reflected wave from the same reflection interface can be considered as coming from a common virtual source (Yang et al., 2022). The virtual seismic source has a mirror-image relationship with the real seismic source along the reflection interface. Therefore, the position and direction of the reflection interface can be known after knowing the location of the virtual source. Draw a straight line A to connect the virtual source and the actual source. Paint a line B perpendicular to the straight line A at the midpoint of line A. This perpendicular line B indicates the direction and spatial location of the reflection interface.

FIGURE 1. Schematic diagram of LFVS method. (A) The reverse extension lines of each geophone along the direction of seismic wave propagation intersect at the virtual source. (B) The polarization azimuth range of each detector is overlapped, and the area of the virtual source is located.
In actual exploration, the polarization direction of seismic wave can be obtained by polarization analysis, and then the propagation direction of seismic wave can be obtained. Draw a line from the geophone in the opposite direction of the propagation direction, which will pass through the virtual source. Do the above operation on all geophones, and the lines of all geophones will intersect at the virtual source.
Due to the complex wave field in practical seismic exploration, various types of waves are mixed, and the polarization information about target seismic waves will be adversely affected to a certain extent (Wang et al., 2020). Two azimuth limits are set according to the numerical values and the value variation amplitude of the polarization information in the time-frequency domain of channel waves, and the polarized azimuth of real seismic waves is within the range between the two azimuth limits. The range of polarized azimuth of each geophone is overlapped with each other, and the area overlapped most frequently is taken as the location of virtual seismic source, as shown in Figure 1B.
Numerical simulation
The process of locating the fault by virtual seismic source consists of two steps: extraction of polarization information and fault location. The first part of numerical simulation is aimed to verify the effect of polarization analysis. Artificial signals are synthesized by using the sine wave damping attenuation method to verify the extraction effect of each polarization analysis method. The second part of numerical simulation is to verify the effect of LFVS method. The three-dimensional time-space high-order finite difference method is adopted for numerical simulation to further verify the effect of polarization analysis and the accuracy of the fault location method.
Synthesized data calculation
Locating the virtual seismic source requires the most accurate polarization information about seismic waves. In coal seams, there exist Love waves with strong energy, which may influence the extraction of polarization information about effective waves. In order to accurately extract the polarization information about effective waves, it is necessary to study the capability of each polarization analysis method to extract the polarization information about effective waves in the presence of interference waves.
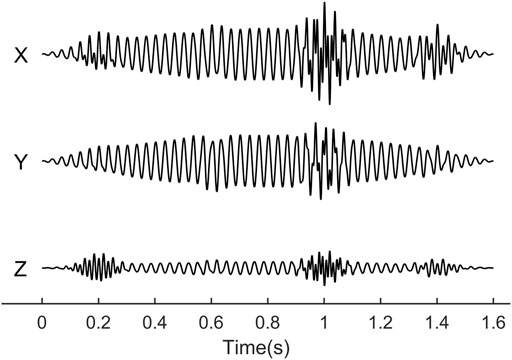
A synthetic signal is created according to the damping attenuation of sine wave (Diallo et al., 2005). The synthetic signal is composed of five segments of linear polarization signals with different polarization information, frequencies and durations: A, B, C, D and E, among which signal A is an interference signal with strong energy and long duration. Specific parameters are shown in Table 1, and the waveform of synthesized signal is shown in Figure 2.
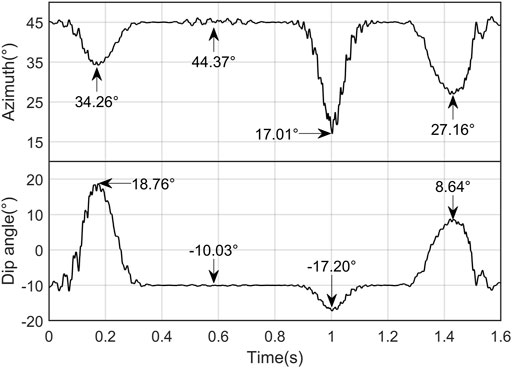
After the time-domain polarization analysis of the synthesized signal, the time-domain polarization information is obtained, as shown in Figure 3. According to Figure 3, the polarization information presented at the junction of signals B, C, D and E (0.4, 0.8, 1.2 s) is consistent with the theoretical polarization information about the background signal A. The polarized azimuths and dip angles change greatly within the periods of signals B, D and E. Due to the mixing with the strong-energy signal A in time domain, there is a large deviation between the polarization information within such periods and the theoretical polarization information about signals B, D and E. There is little change in the polarization information within the period of signal C with weak energy, and its polarization information is almost completely suppressed by signal A. Therefore, when there are two signals with different frequencies, energy scales and polarization characteristics within the same period, the polarization information about weak-energy signals obtained from the time-domain polarization analysis will be suppressed, leading to errors in the polarization information obtained from the analysis. The degree of suppression depends on the difference in energy between the two signals.
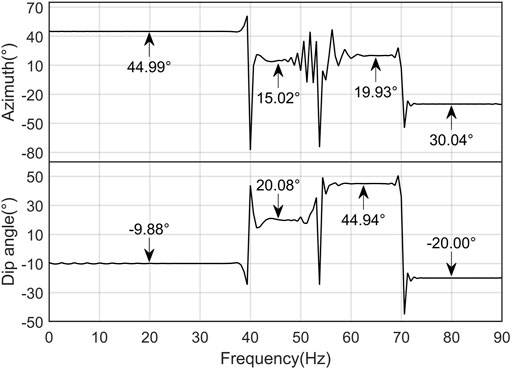
After the frequency-domain polarization analysis of the synthesized signal, the frequency-domain polarization information is obtained, as shown in Figure 4. According to Figure 4, the polarization information obtained from the analysis at the frequencies of signals A, B, D and E is consistent with the theoretical polarization information, but there is a large deviation at the 55 Hz frequency of signal C. In Table 1, the frequencies of signal B and signal E are 60 Hz and 50 Hz respectively, which are very close to the frequency of signal C, and the length of the main polarization axis of these two segments of signals is not less than twice that of signal C. Therefore, signal C with weaker energy is suppressed by signals B and E with similar frequencies and stronger energy, resulting in a large difference between the polarization information obtained from the analysis of signal C and the theoretical value. Therefore, when there are signals with different periods, energy scales and polarization characteristics within the same frequency range, the polarization information about weak-energy signals obtained from the frequency-domain polarization analysis will be suppressed, leading to errors in the polarization information obtained from the analysis.
After the TF-domain polarization analysis of the synthesized signal, the TF-domain polarization information is obtained, as shown in Figure 5. At the same time, such as 0.6 s, the polarization information obtained from the TF-domain polarization analysis varies at different frequencies. In the same frequency band, such as 60–70 Hz, the polarization information obtained by TF-domain polarization analysis varies at different times. The polarization information obtained by the TF-domain polarization analysis has different values at different time-frequency point and is consistent with the theoretical value of the signal. The TF-domain polarization analysis can distinguish the polarization information of signals in the two dimensions of time and frequency simultaneously, and the polarization information about weak-energy signals will not be suppressed by other signals in the same time or frequency band.
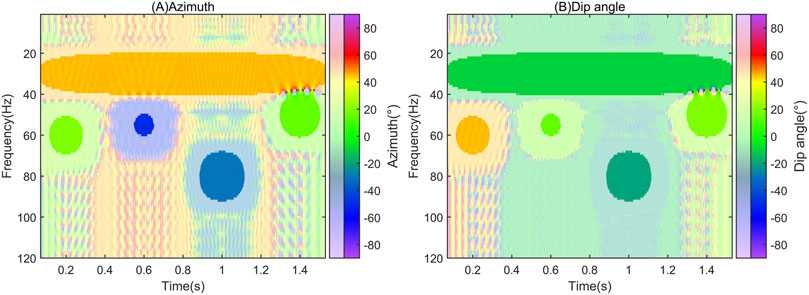
FIGURE 5. TF-domain polarization analysis of the synthesized signal. (A) The polarization azimuth information of different time-frequency points is different. (B) The polarization dip angle information of different time-frequency points is different.
Three-dimensional three-component seismic numerical simulation
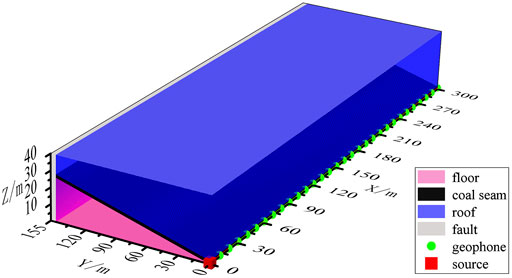
In order to verify the effect of the LFVS method and further study the capability of various polarization analysis methods to extract polarization information under coal mine conditions, a three-dimensional numerical model is established, as shown in Figure 6. It is a “rock—coal—rock” layered model. The thickness of the middle coal seam is 2 m. The velocity of longitudinal waves in the middle coal seam is 2,200 m/s, and the velocity of shear waves is 1,270 m/s. The lithology of the roof and floor is the same, where the velocities of longitudinal waves and shear waves are 3,400 m/s and 1,962 m/s, respectively. The coal seam has a dip angle of 10°, and its inclination is the negative direction of Y-axis. A fault with a thickness of 5 m is inserted at the location of 150–155 m of the Y-axis. The velocities of longitudinal waves and shear waves in the fault are 1,500 m/s and 900 m/s, respectively. A concentrated force source in the Z direction was used in the simulation and placed at (0,0,0) in the model, and its dominant frequency was 125 Hz. 31 geophones with a sampling frequency of 2.5 kHz were placed along the positive direction of X-axis from (0,0,0). The spacing of geophones is 10m, and the length of the measuring line is 300 m. PML absorbing boundary was added to the model, and the 3D time-space-domain high-order finite difference method was used for numerical simulation (Fang et al., 2022).
In the data from the 14th geophone, there is overlap between reflected shear waves and other waves in both time domain and frequency domain. Thus, the data from the 14th geophone was selected as typical data, for which the polarization analysis in time domain, frequency domain, and TF domain was carried out respectively.
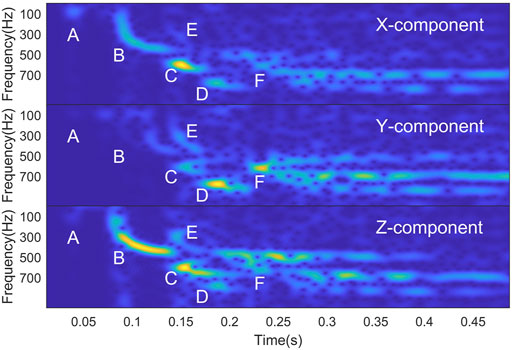
Determine the type of wave through time-frequency spectrum (Figure 7). By calculating the wave velocity, energy A is the refracted longitudinal wave from the roof and floor (A). Because the X component and Z component of energy B are obvious, combined with its wave velocity, it is judged that B is SV-type shear wave(B).The energy intensity of C and D is higher, which is judged to be channel wave. The C energy is more obvious in the X component, and the D energy is more obvious in the Y direction. Combining the velocity and frequency characteristics of Rayleigh trough wave and Love trough wave (Feng et al., 2018), it is judged that C and D are Rayleigh channel wave (C) and Love channel wave (D), respectively.The arrival time of energy E and F does not change rapidly with the offset, so it is most likely a reflected wave. Combined with its frequency, it is judged that energy E is the reflected SV-type shear wave (E), and energy F is the reflected Rayleigh-type channel wave (F). The reflected SV-type shear wave (E) overlaps with the direct Rayleigh channel wave (C) in time domain and with the direct SV-type shear wave (B) in the frequency domain.
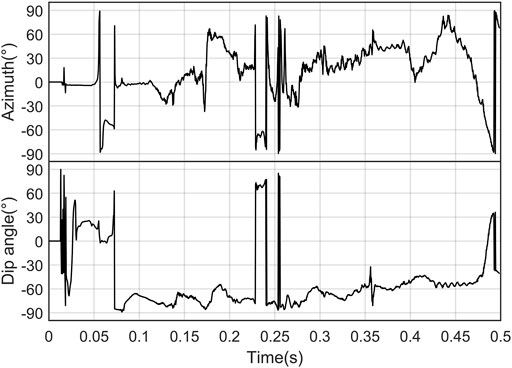
Three kinds of polarization analysis were carried out for the simulated data to extract the polarization information about the reflected SV-type shear wave with weak energy. The results of time-domain polarization analysis are shown in Figure 8. The azimuth and dip angle of the reflected SV-type shear wave (E) at 0.14 s are about −30° and −70°, respectively. The azimuth in the polarization information is quite different from the theoretical azimuth (−66°) of the reflected SV-type shear wave (E). The azimuth-related polarization information of the reflected SV-type shear wave (E) is suppressed by the direct Rayleigh channel wave (C), leading to the failure to produce accurate polarization information.
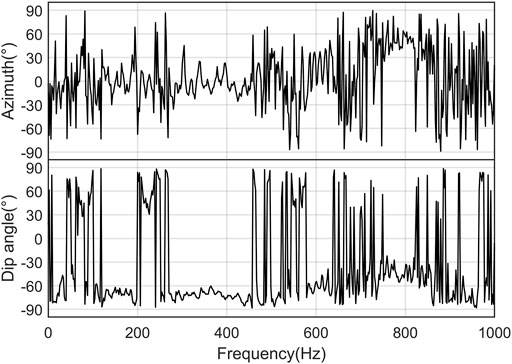
The results of frequency-domain polarization analysis are shown in Figure 9. The azimuth value of the reflected SV-type shear wave (E) at 280–450 Hz fluctuates around 0°, and the dip angle is about −70−-80°. The polarization information is consistent with that of the direct SV-type shear wave (B). The polarization information about the weak-energy reflected SV-type shear wave (E) is suppressed by the strong-energy direct SV-type shear wave (B).
The results of TF-domain polarization analysis are shown in Figure 10. The polarized azimuth and dip angle of the reflected SV-type shear wave (E) are about −65° and 70°, which are consistent with the theoretical polarization information. The polarization information of the reflected SV-type shear wave (E) is not suppressed by the direct Rayleigh channel wave (C) or the direct SV-type shear wave (B). At the same time, the azimuths and dip angles of the direct Rayleigh channel wave (C) and direct SV-type shear wave (B) are consistent with their theoretical values.
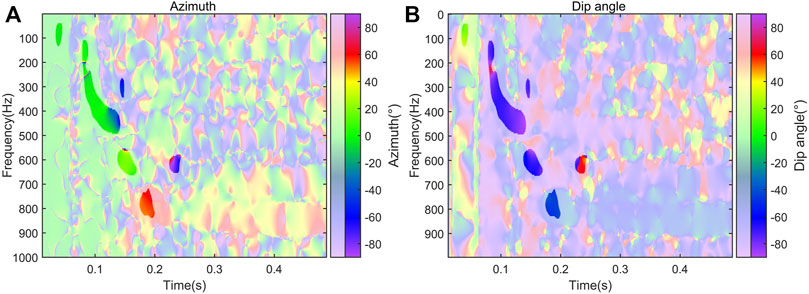
FIGURE 10. TF-domain polarization analysis of the data based on 3D numerical simulation. (A) polarization azimuth information of each type of seismic wave. (B) The polarization dip angle information of each type of seismic wave.
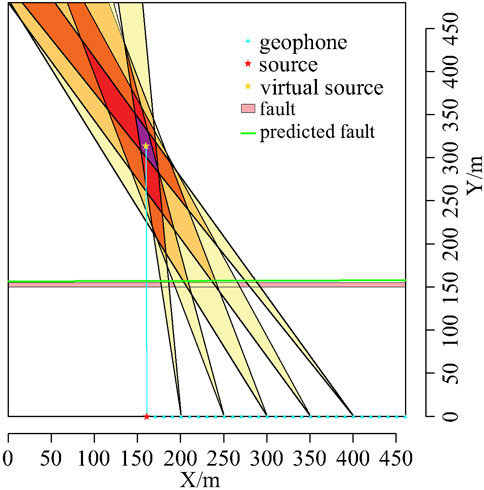
Because of the consistency between the polarized azimuth of the Rayleigh channel wave with the direction of its propagation, the polarization information about the Rayleigh channel wave is selected to locate faults. The polarization analysis of the 5th, 10th, 15th, 20th, and 25th geophones in the simulated data is conducted to extract the information about polarized azimuth of the reflected Rayleigh channel wave, and two azimuth limits are given respectively. The scopes defined by azimuth limits of different geophones are overlapped, and the area covered for the most times is regarded as the location of virtual seismic source. A perpendicular line is painted at the midpoint of the line connecting the virtual seismic source and real seismic source. This perpendicular line refers to a predicted fault. As shown in Figure 11, the angle difference between the predicted fault and the real fault is 0.16°. The difference in distance between the predicted fault and the real fault at the line connecting the virtual and real seismic sources is 3.05 m. The error within a detection distance of 150 m is about 2.03%.
Case study
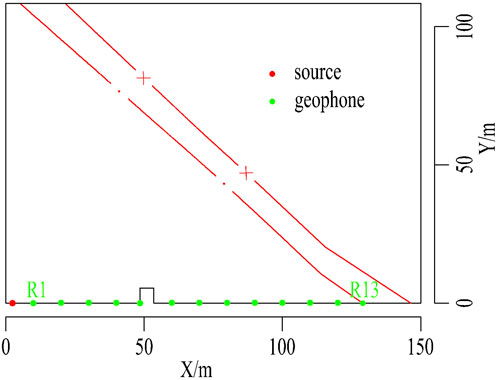
In terms of the working face of a coal mine in Anhui, China, the coal seam has a thickness range of 3.0–5.2 m and an average thickness of 3.9 m. It has a dip angle range of 5–18° and an average dip angle of 10°. The roof is grayish-white medium-grained sandstone, and the floor is siltstone. There are normal faults developed in the working face, with strike of 250–265°, dip of 340–355°, dip of 65° and drop of 0–21 m. The roadway strikes 225°, the fault intersects the roadway, and the angle difference is 25–40°. The geophone R1 is 7.5 m away from the seismic source. A total of 13 seismometers were deployed. The spacing of geophones is 10 m. The specific observation system is shown in Figure 12.
The TF-domain polarization analysis of R1∼R13 with well-developed channel waves is carried out. For example, according to the time-frequency spectrum of three-component data about R8 (Figure 13A), there is energy with a long duration at 150Hz, which complies with the frequency characteristics of Rayleigh channel waves (Pi et al., 2018). Thus, the energy is determined to be Rayleigh channel wave. According to the diagram of azimuth after TF-domain polarization analysis (Figure 13B), the polarized azimuth within the time-frequency range of reflected Rayleigh channel waves is 70–75°. The TF-domain polarization analysis was carried out for all valid geophones of R1∼R13 to extract the polarized azimuth range of reflected Rayleigh channel waves and further locate virtual seismic source. The time-frequency domain polarization information data of the valid geophone is generally very uniform and stable. On the contrary, The time-frequency domain polarization information data of the invalid geophone is very disordered, the polarization information cannot be extracted.
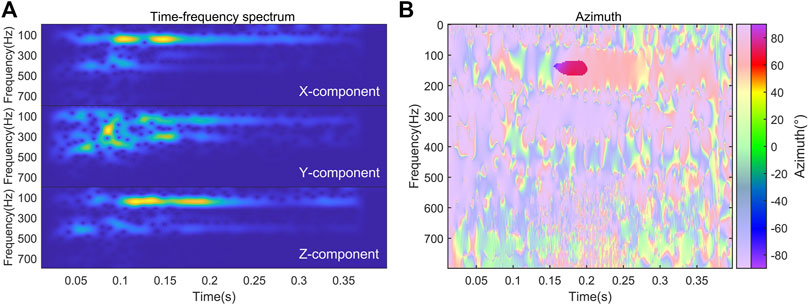
FIGURE 13. Time-frequency spectrum and time-frequency domain polarization analysis azimuth of working face data. (A) Time-frequency spectrum of seismic waves received by different components of geophone (B) Time-frequency polarization azimuth information of data.
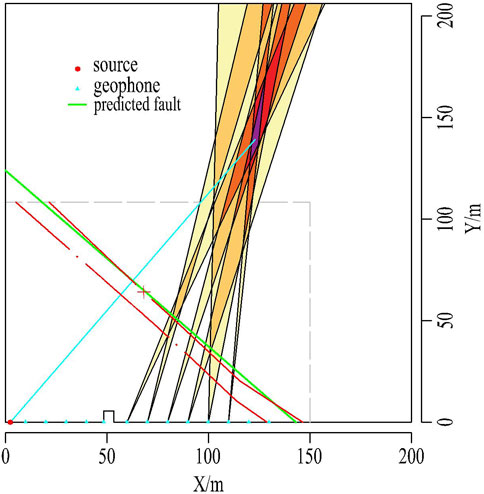
Finally, the approximate location, strike, inclination and dip angle of the fault were identified, as shown in Figure 14. The fault detection area was verified by drilling in the coal roadway. The comparison between the detection result and the actual drilling result shows that the fault position error is 3 m, and the fault strike is consistent.
Discussions
1. The effect of LFVS method is positively correlated with the quality of data. In practical applications, the azimuth information of some geophones often changes too much in the time-frequency range of the target wave (the difference between the maximum and minimum azimuth angles is more than 45°), which makes it difficult to extract polarization information. These data are invalid data. These data are invalid data. These data are invalid data. There are many reasons for invalid data, such as the three-component geophone is damaged or the target wave and the interference wave are overlapping in both time and frequency dimensions. Therefore, such geophones should be excluded when locating virtual seismic source. It is still feasible to locate virtual seismic source after excluding some geophones with significant errors.
2. Compared with traditional methods for fault detection, the LFVS method has many advantages such as faster processing and capability of identifying the strike. This paper only discusses the case of a single fault, but there may be multiple complex faults in practical situations. In the case of multiple faults, reflected signals of different faults may be initially identified according to the travel time of seismic waves, and then the polarization information can be extracted by TF-domain polarization analysis, thus helping locate the locations of different faults finally.
3. Wang et al. (2020) successfully applied a similar method to locate the broken wing of coal seam. Wang mainly uses the polarization dip angle information, while this article mainly uses the polarization azimuth information. If the two are combined, more fault information may be available.
4. The LFVS method can be combined with other methods to achieve better water inrush prevention effect. Combined with tomography method, the fault location accuracy can be further improved (Dong et al., 2022). As a typical water and gas channel (Chen et al., 2021; Tian et al., 2022), the fault can be further monitored by acoustic emission method after positioning by LFVS method (Rui et al., 2022a; Rui et al., 2022b).
Conclusion
1. The time-domain polarization analysis, frequency-domain polarization analysis and TF-domain polarization analysis were conducted for the three-component synthesized signal with overlapping in time and frequency domains. The time-domain polarization analysis fails to accurately extract the polarization information of weak energy wave signals overlapped with strong energy waves in time domain. The frequency-domain polarization analysis fails to accurately extract the polarization information of weak energy wave signals overlapped with strong energy waves in frequency domain. While the TF-domain polarization analysis can effectively extract the polarization information about the weak energy wave overlapped with strong energy waves in time or frequency domain. The capability of TF-domain polarization analysis to extract the overlapped signals in time and frequency domains is stronger than that of time-domain polarization analysis and frequency-domain polarization analysis.
2. In order to verify the effect of LFVS method, the three-dimensional time-space-domain high-order numerical simulation is adopted, and polarization analysis of the three-component signal from numerical simulation is conducted. The place of virtual seismic source is identified according to the spatial location of each geophone and its polarization information, and the location of the fault is predicted. The angle difference between the predicted fault and the real fault is 0.16°, and the difference in distance between the predicted fault and real fault at the line connecting the virtual and real seismic sources is 3.05 m.
3. The TF-domain analysis is carried out for the real data about channel waves in mines. The location, strike, inclination and dip angle of the fault are identified finally according to the spatial location of each geophone and polarization information. The data about the predicted fault is approximately consistent with the real geological information.
Data availability statement
The original contributions presented in the study are included in the article/Supplementary Material, further inquiries can be directed to the corresponding author.
Author contributions
LZ contributed to conception and methodology of the study. LZ performed the data curation and visualization. LZ wrote the first draft of the manuscript. BW reviewed and edited the manuscript. All authors contributed to manuscript revision, read, and approved the submitted version.
Funding
This paper was supported by the National Natural Science Foundation of China (No. 42174165).
Conflict of interest
The authors declare that the research was conducted in the absence of any commercial or financial relationships that could be construed as a potential conflict of interest.
Publisher’s note
All claims expressed in this article are solely those of the authors and do not necessarily represent those of their affiliated organizations, or those of the publisher, the editors and the reviewers. Any product that may be evaluated in this article, or claim that may be made by its manufacturer, is not guaranteed or endorsed by the publisher.
References
Chen, Q., Wang, Q., and Liang, Y. (2021). Permeability enhancement via acetic acid (CH3COOH) acidizing in coals containing fracture-filling calcite. Energy & Fuels 35, 17396–17409. doi:10.1021/acs.energyfuels.1c02199
Chen, Y., Gao, L., and Zhao, F. (2007). A method to enhance the signal/noise ratio of three-component seismic data based on the polarization analysis in frequency domain. Prog. Geophys., 255–261.
Diallo, M. S., Kulesh, M., Holschneider, M., and Scherbaum, F. (2005). Instantaneous polarization attributes in the time-frequency domain and wavefield separation. Geophys. Prospect. 53, 723–731. doi:10.1111/j.1365-2478.2005.00500.x
Dong, L., Pei, Z., Xie, X., Zhang, Y., and Yan, X. (2022). Engineering.Early identification of abnormal regions in rock-mass using traveltime tomography
Du, B., Zhang, W. N., and Shi, X. M.IEEE (2016). The research of polarization filtering method for increasing the signal-to-noise ratio of seismic data caused by moving ship. IEEE/OES China Ocean Acoustics COA. Jan 09-11 2016 Harbin, PEOPLES R CHINA.
Fang, J. W., Chen, H. M., Zhou, H., Zhang, Q. C., and Wang, L. D. (2022). Three-dimensional elastic full-waveform inversion using temporal fourth-order finite-difference approximation. Ieee Geoscience Remote Sens. Lett. 19, 1–5. doi:10.1109/lgrs.2021.3125310
Feng, L., Dong, Z., Zhou, M., and Yu, W. (2016). Love channel wave extracation based on polarization filter in time-frequency domain. Coal Geol. Explor. 44, 103–108.
Feng, L., Du, Y.-Y., Song-Ying, L., Yao, X.-S., and Yang, Y.-J. (2018). Wavefield analysis of typical in-seam seismic data by transmission method. Prog. Geophys. 33, 590–595.
Flinn, E. A. (1965). Signal analysis using rectilinearity and direction of particle motion. Proc. IEEE 53, 1874–1876. doi:10.1109/proc.1965.4462
Ji, G., Wei, J., Yang, S., Li, X., Bai, J., and Sui, Y. (2018). Three-component polarization migration of channel waves for prediction ahead of coal roadway. J. Appl. Geophys. 159, 475–483. doi:10.1016/j.jappgeo.2018.09.028
Kakhki, M. K., Mansur, W. J., and Peters, F. C. (2020). Rayleigh wave separation using high-resolution time-frequency polarization filter. Geophys. Prospect. 68, 2104–2118. doi:10.1111/1365-2478.12994
Kong, X.-L., Chen, H., Hu, Z.-Q., Kang, J.-X., Xu, T.-J., and Li, L.-M. (2018). Surface wave attenuation based polarization attributes in time-frequency domain for multicomponent seismic data. Appl. Geophys. 15, 99–110. doi:10.1007/s11770-018-0656-y
Liu, S., Zhang, J., Li, C., Wang, B., Jin, B., and Liu, J. (2019). Method and test of mine seismic multi-wave and multi-component. J. China Coal Soc. 44, 271–277.
Ma, J. (2012). Researches on adaptive polarization filtering for multi-component seismic data. PhD. Xi’an, China: Chang'an University.
Park, J., Vernon, F. L., and Lindberg, C. R. (1987). Frequency dependent polarization analysis of high-frequency seismograms. J. Geophys. Res. 92, 12664. doi:10.1029/jb092ib12p12664
Pi, J., Teng, J., and Liu, Y. (2018). Preliminary study on the numerica-physical simulation of seismic channel waves. Chin. J. Geophys. 61, 2481–2493.
Reading, A. M., Mao, W., and Gubbins, D. (2001). Polarization filtering for automatic picking of seismic data and improved converted phase detection. Geophys. J. Int. 147, 227–234. doi:10.1046/j.1365-246x.2001.00501.x
Rui, Y., Zhou, Z., Cai, X., and Dong, L. (2022a). A novel robust method for acoustic emission source location using DBSCAN principle. Measurement, 191.
Rui, Y., Zhou, Z., Cai, X., Lan, R., and Zhao, C. (2022b). A novel robust AE/MS source location method using optimized M-estimate consensus sample. Int. J. Min. Sci. Technol. 32, 779–791. doi:10.1016/j.ijmst.2022.06.003
Tian, J., Chen, Q., Qin, C. Z., Kang, Y. L., Jia, N., and XI, Z. Y. (2022). Pore-scale systematic study on the disconnection of bulk gas phase during water imbibition using visualized micromodels. Phys. Fluids 34, 062015. doi:10.1063/5.0094930
Wang, B., and Huang, L. (2022). A polarization migration velocity model building method for geological prediction ahead of the tunnel face. Front. Earth Sci. 10. doi:10.3389/feart.2022.857984
Wang, B., Jin, B., Huang, L., Liu, S., Sun, H., Liu, J., et al. (2020). A Hilbert polarization imaging method with breakpoint diffracted wave in front of roadway. J. Appl. Geophys. 177, 104032. doi:10.1016/j.jappgeo.2020.104032
Wu, Q., Hao, Z., Zhao, Y., and Xu, H. (2020). Prediction of concealed faults in front of a coalface using feature learning. Bull. Eng. Geol. Environ. 79, 4191–4204. doi:10.1007/s10064-020-01800-3
Keywords: fault (fracture) section, coal mine, polarization analysis, channel wave, seismic wave direction
Citation: Zeng L, Wang B, Xin G, Li Y, She Z, Shen S and Xie L (2023) A fault location method based on polarization analysis for coal mine. Front. Earth Sci. 11:1097314. doi: 10.3389/feart.2023.1097314
Received: 13 November 2022; Accepted: 17 January 2023;
Published: 03 February 2023.
Edited by:
Jie Chen, Chongqing University, ChinaCopyright © 2023 Zeng, Wang, Xin, Li, She, Shen and Xie. This is an open-access article distributed under the terms of the Creative Commons Attribution License (CC BY). The use, distribution or reproduction in other forums is permitted, provided the original author(s) and the copyright owner(s) are credited and that the original publication in this journal is cited, in accordance with accepted academic practice. No use, distribution or reproduction is permitted which does not comply with these terms.
*Correspondence: Bo Wang, d2JzeWVzQDEyNi5jb20=
 Linfeng Zeng1
 Bo Wang
