 Zhuoheng Chen*
 Chunqing Jiang
 Xiaojun Liu
94% of researchers rate our articles as excellent or good
Learn more about the work of our research integrity team to safeguard the quality of each article we publish.
Find out more
ORIGINAL RESEARCH article
Front. Earth Sci., 15 February 2023
Sec. Geochemistry
Volume 11 - 2023 | https://doi.org/10.3389/feart.2023.1094434
This article is part of the Research TopicPetroleum Generation, Migration and Storage in Shale SystemView all 10 articles
This paper discusses methods of assessing oil and gas resources and evaluating their mobility in shale reservoirs using programed pyrolysis data in conjunction with reservoir engineering parameters derived from production data. The hydrocarbon resource is calculated from the measured free hydrocarbon by programed pyrolysis with correction of evaporative loss that occurred during coring, storage and sample preparation. The correction takes account of the loss of light hydrocarbon fluids as a result of phase change during core retrieval to the surface and evaporative loss related to storage and sample preparation. Based on their response to ramping temperature during sample pyrolysis and thermal equilibrium behavior of distinct petroleum products at different thermal maturities, the estimated oil and gas resources are divided into three categories: non-movable, restricted, and movable to characterize the mobility of the petroleum fluids. The mobility classification is compared with oil compositional grouping based on evaporative kinetics of petroleum products in rock samples to examine their affinity. Pyrolysis analysis results from naturally matured samples and production data from different fluid zones in the Duvernay Shale resource play in Western Canada Sedimentary Basin (WCSB) were used to demonstrate the application of the proposed method. While the mobility of petroleum fluids increases with thermal maturation in general, the total movable resource reaches its maximum at the end of oil generation window, then declines as a result of massive loss due to hydrocarbon expulsion towards to gas window where liquids are thermally cracked to gaseous hydrocarbons. Compositional grouping based on evaporative kinetics does not show a complete accordance with mobility grouping, suggesting composition is only one of many factors affecting hydrocarbon fluid flow in shale reservoir. More studies are required to better understand the fundamentals of oil mobility in shale reservoir.
• Lowering starting temperature in programed pyrolysis can reveal oil compositions in shale.
• Evaporative loss correction of free hydrocarbons in S1 considers fluid phase and PVT behavior.
• Petroleum compositional grouping from hydrocarbon evaporative kinetics was compared with oil mobility assessment.
• Hydrocarbon compositional grouping and oil mobility assessment provide critical information to resource development decision on shale oil plays.
Shale oil and gas reservoirs are a type of self-sourced and self-retained system with mixed porous media of different origins and properties that differs significantly from conventional and tight reservoirs (Akkutlu and Fathi, 2012; Chen et al., 2017a). Petroleum fluid in shale reservoir starts from a single phase of oil in oil window (e.g., shale oil) through a transition of multiphase fluid to a single phase of gas in dry gas window (i.e., shale gas) with increasing thermal maturity. This study presents novel methods for assessing petroleum resource potential and mobility of petroleum fluid in a shale reservoir.
In shale petroleum resource appraisal, the current practice of “volume = porosity × hydrocarbon saturation” is largely based on the understanding of conventional reservoir, and the resulting estimates often yield large uncertainties in resource volume and provide no information with respect to oil mobility. Many laboratory methods designed for conventional reservoirs could be problematic for measuring porosity and water saturation in shale reservoirs (e.g., Passey et al., 2010; Bohacs et al., 2013; Hartigan, 2014). Uncertainties arise because of the presence of large amount of clay minerals (e.g., Passey et al., 2010) and multiscale porous media with different origins and physical/chemical properties in shale reservoirs (Passey et al., 2010; Akkutlu and Fathi, 2012; Bohacs et al., 2013; Hartigan, 2014; Chen et al., 2017b). For example, Passey et al., 2010 showed that there could be large discrepancies in porosity measurements from different laboratories for the same set of shale samples and discussed the possible causes for the discrepancies. Ole (2015) showed that porosity from He porosimetry is about two times of that from mercury injection porosimetry (MIP) even they were measured at the same lab. This led to a recommendation of utilizing hydrocarbon saturated porosity for resource estimation in shale resource plays by industry (e.g., Passey et al., 2010; Bahacs, et al., 2013). As a matter of fact, there are also significant shortcomings to the hydrocarbon saturation estimation approach. In addition to the evaporative loss of hydrocarbon and uncertainty in porosity measurement of the sample, the impact of phase change on hydrocarbon volume due to variation in temperature-pressure (T-P) conditions from reservoir to surface is difficult to measure. Furthermore, the properties of shale reservoir can vary from one formation to the other, and thus petrophysical porosity and saturation calculations requiring calibration from these laboratory measurements is less reliable (Sondergeld, et al., 2010). Baek and Akkutlu (2019b) showed that source rock reservoir stores oil in significantly larger volume than that obtained based on conventional oil saturated pore volume calculation due to the so-called nanopore confinement effects.
In addition to the abundance of resources and rock mechanics, movability of petroleum fluid in shale reservoir represents another key challenge for successful resource development. Shale oil production results from North America suggest that oil mobility is a key factor affecting the success of commercial production. Cander (2013) showed that high production rate in the liquid zones is related to high gas to oil ratio and optimal oil viscosity. Unlike conventional reservoirs where hydrocarbon flow shows nearly-constant composition through production, physical and chemical properties of petroleum fluids retained in shale reservoir differ from those of the produced fluids largely due to the interaction between the hydrocarbon fluids and the hosting organic-rich rock (Whitson and Sunjerga, 2012; King, 2014; Akkutlu et al., 2017; Baek and Akkutlu, 2019c), suggesting that fluid compositions play an important role in oil mobility. Furthermore, hydrocarbon molecules are more likely to be trapped in the pores that are smaller than 10 nm in size (Zhang et al., 2017). The nanopore confinement combined with oil adsorption in shale reservoir impedes the mobility of oil, thus reducing oil recovery (Akkutlu et al., 2017; Baek and Akkutlu, 2019a and c). Therefore, information on fluid compositional properties prior to production are crucial for delineation of productive sweet-spots in shale resource plays and their completion design as well as extraction optimization (Carder, 2013; King, 2014; Jarvie, 2012; Chen et al., 2022).
The state of occurrence of oil and gas in shale reservoir is primarily controlled by the thermal maturity and the type of source rock and is a good indicator of oil mobility (Chen et al., 2019a; Li et al., 2019). Bulk geochemical data from Rock-Eval analysis and other types of programed pyrolyses contain critical information related to source rock type and maturity. While the mass of petroleum fluids remains the same under reservoir and surface conditions, the phase behavior of various compositional groups can respond differently to the changes in temperature and pressure, allowing for inferences of resource potential and compositional characterization of produced fluids.
Programed pyrolysis provides a measure of free hydrocarbons (i.e., S1 peak from Rock-Eval analysis) for the amount of retained oil in the rocks, and the parameter has been used to calculate the oil filled pore volume (Jarvie, 2012; Modica and Lapierre; 2012; Li et al., 2018; Chen et al., 2019b). However, early hydrocarbon generation products contain larger amounts of high molecular weight and heteroatoms-containing components of crude oil and bitumen with properties in a transition between solid organic matter and petroleum fluids (e.g., Delveaux et al., 1990; Jarvie, 2012; Abrams, et al., 2017; Burnham, 2017), thus resulting in strong interaction between the hydrocarbon fluids and the organic-rich host rocks. The interaction is further enhanced by large specific surface area of nano-pores (Sandvik et al., 1992; Jiang et al., 2016; Chen et al., 2017a; Li et al., 2018) and lead to strong confinement effects (Akkutlu et al., 2017; Bui et al., 2018; Baek and Akkutlu, 2019a; b and c). As a result, the evaporative release of the adsorbed oil from rock sample requires higher temperature than the default 300°C of routine Rock-Eval pyrolysis, causing the so called “carry-over” phenomenon in which a large portion of oil in the adsorbed state appears within the Rock-Eval S2 peak as a front-shoulder. Thus, the S1, supposedly representing “free hydrocarbons”, contains predominantly only the light components of the total oil (Delveaux et al., 1990; Jarvie, 2012; Jiang et al., 2016; Abrams et al., 2017). Furthermore, evaporative loss of volatile components (and gas components as well) from the S1 can occur during coring, sampling, storage and sample preparation. Correction of this loss has been indicated to be challenging (e.g., Jarvie, 2012; Modica and Lapierre, 2012; Michael et al., 2013; Jiang et al., 2016; Chen et al., 2018; Li et al., 2018). Therefore, a robust estimation of shale oil resource based on Rock-Eval type programed pyrolysis requires corrections on both evaporative loss and separation of the retained oil from S2 peaks.
This paper uses the Duvernay liquid rich resource play as an example to propose an alternative approach to assess the resource potentials in different thermal maturity zones and evaluate petroleum fluid mobility and compositional grouping based on mass balance principles, phase and PVT behaviors and evaporative kinetics.
Five core samples were taken from the bituminous shale of the Upper Devonian Duvernay Formation in five wells in the Western Canada Sedimentary Basin (WCSB). The five core samples cover source rock maturity levels from early oil generation to dry gas windows (Figure 1). Table 1 presents the Rock-Eval data for the five Duvernay shale samples used in this study. As no immature sample was available in this study, the data of SAP sample from Dieckmann et al. (2004) was plotted in Figure 2B as the immature source rock for comparison.
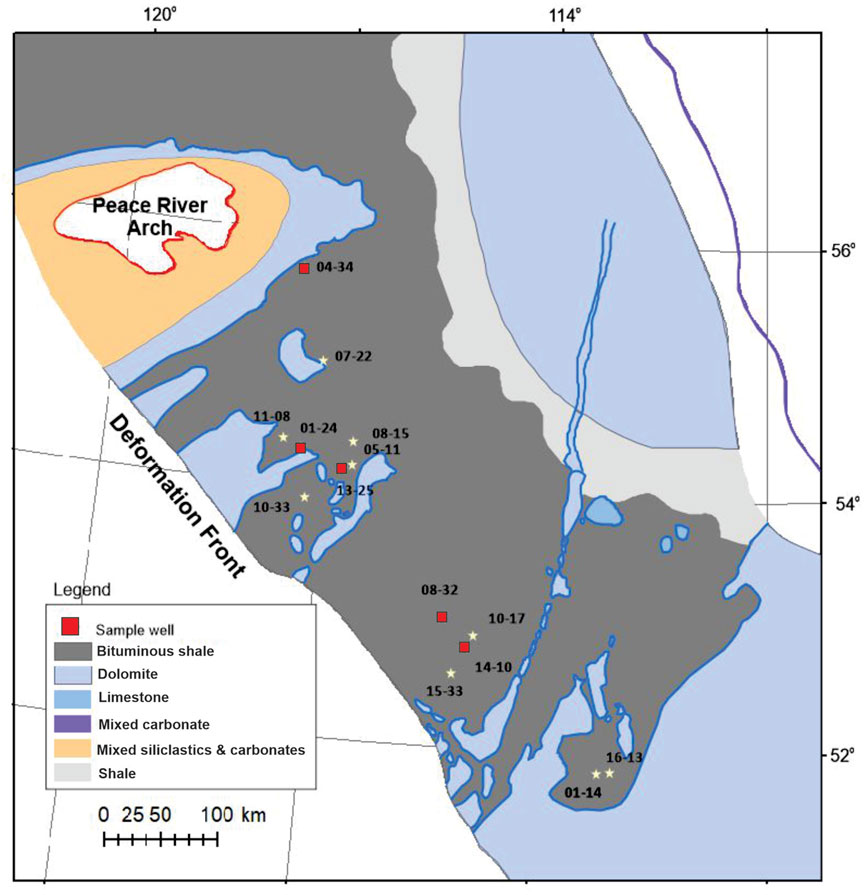
FIGURE 1. Location of the study area and core sample well locations in this study (modified from Switzer et al., 1994). Well names and major bulk geochemical features of the samples are provided in Table 1 (last column: well ID in map).
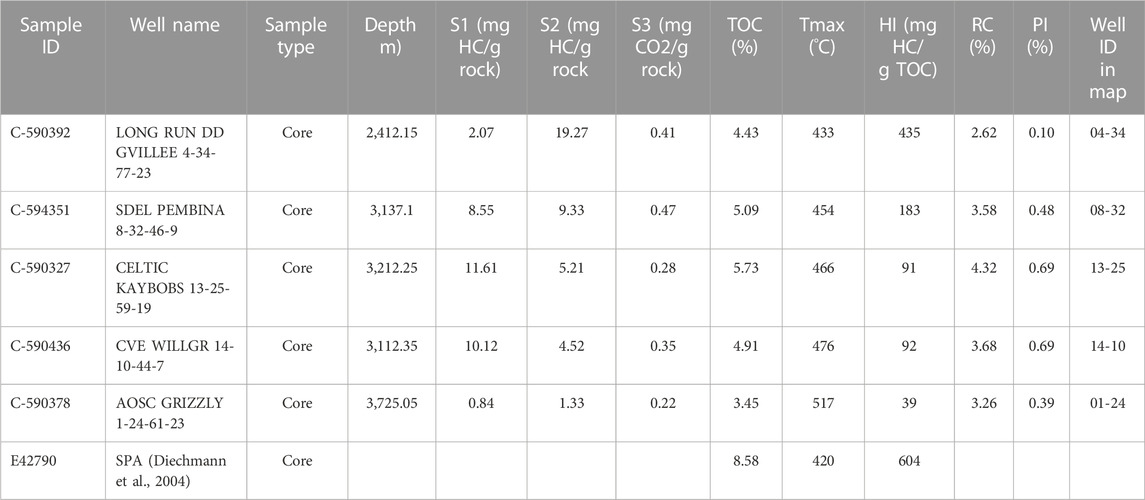
TABLE 1. Rock-Eval analysis results of the five core samples from Upper Devonian Duvernay Formation in WCSB.
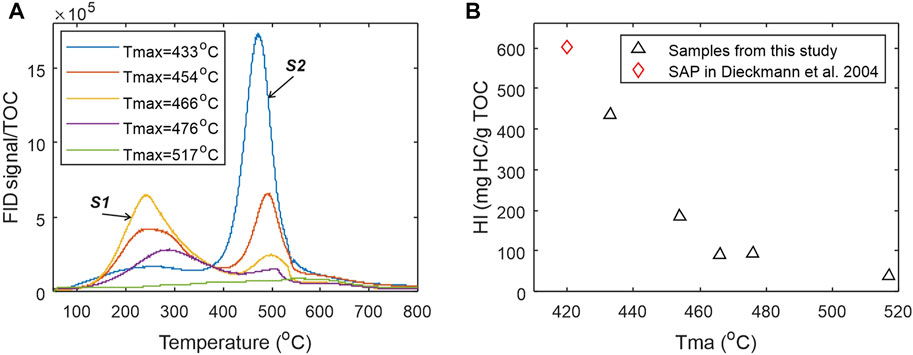
FIGURE 2. (A) Hydrocarbon pyrograms of the five shale samples from EGA pyrolyzer showing general trends of decreasing hydrocarbon generation potential represented by S2 peaks and increasing free hydrocarbon represented by S1 peaks with increasing thermal maturity represented by Tmax. Higher maturity samples do not have larger S1 peaks due to evaporative loss of gaseous and volatile hydrocarbons and the expulsion of a large part of generated hydrocarbons out of the source rocks prior to coring; (B) Cross-plot of Tmax-HI data from Rock-Eval analysis showing the trajectory of thermal decomposition for kerogen in Duvernay shales.
Sequential thermal desorption and pyrolysis of powdered (<250 um) bulk shale samples was used in this study to characterize the amount of hydrocarbons liberated from the shale samples in different temperature ranges. The thermal analysis was performed on a Frontier EGA/PY 3030D pyrolyzer system that was interfaced to an Agilent GC-MSD/FID for the detection of hydrocarbons and other volatile components. The furnace of the pyrolyzer was programed from 50°C to 850°C at a rate 25°C/min and then held for 3 min. Products released from the rock samples during either the thermal desorption (e.g., <350°C) or the pyrolysis (350–850°C) in the pyrolyzer furnace was immediately transferred through a short (i.e., 2.5 m) non-activated capillary column to the GC-MSD/FID detectors by helium carrier gas at 10 mL/min flow rate, so the abundances of the thermal products can be measured real time as hydrocarbon pyrograms or traces. The EGA FID pyrograms represent the real-time response of instant total amount of hydrocarbons released from the thermal analysis and are used in this work for studying the kinetics of hydrocarbon desorption and generation from the organic-rich shales. The pyrograms are also used for compositional grouping of the petroleum substances (Figure 2A). It should be noted that, the programed pyrolysis procedure using the Frontier EGA/PY 3030D pyrolyzer system differs from the routine Rock-Eval analysis heating program. The powdered shale samples were also subjected to conventional programed pyrolysis using a Vinci Technology’s Rock-Eval 6 device. The basic method was used for Rock-Eval analysis to produce a Rock-Eval FID hydrocarbon pyrogram where S1 was generated at 300°C for 3 min, and S2 was then produced by increasing the furnace temperature at 25°C/min to 650°C. Details of the procedure can be found in Behar et al. (2002). Figure 2B shows the cross plot of hydrogen index (HI) versus Tmax from routine Rock-Eval 6 analysis.
For the convenience of methodology description, a raw Rock-Eval hydrocarbon pyrogram is divided into three parts (Figure 3), S1a for volatile and semi-volatile petroleum components released at 300°C; S1b for high-molecular weight petroleum components with high boiling points; and S2 for kerogen thermal decomposition products. Li et al. (2018) and Chen et al. (2018) have discussed methods for separating S1b from S2 using a numerical approach based on evaporative kinetics. The present study attempts to determine the total oil yield and quantify petroleum group characteristics with respect to oil mobility and composition, and this is done by considering the various interactions between petroleum fluid and porous media including sorption, nanopore-confinement and any other factors that may impede the fluid flow in shale reservoir.
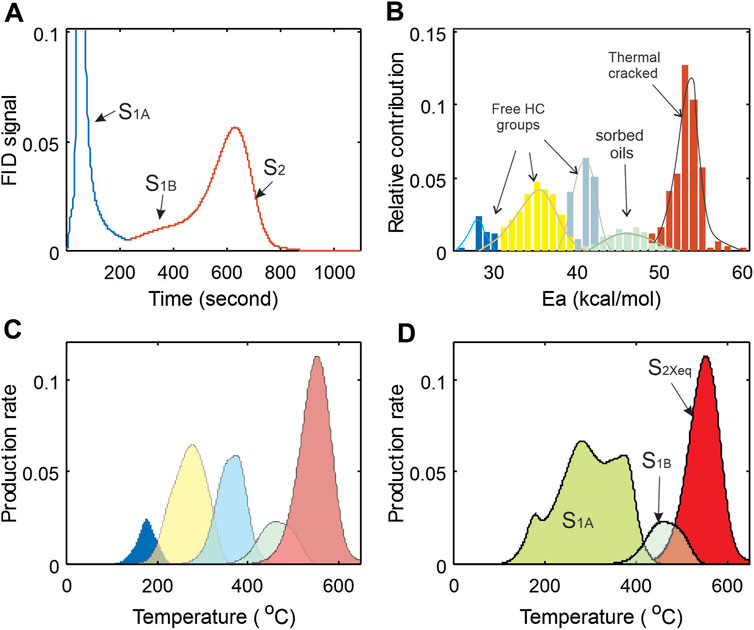
FIGURE 3. Thematic diagrams showing partition of Rock-Eval FID pyrogram and corresponding activation energy groups and thermal production make-ups. FID responses of petroleum products from pyrolysis can be plotted in different variable spaces: (A) FID response vs. time of thermal analysis (FID curve); (B) decomposed FID in activation energy space; (C) thermal products re-grouped in temperature domain that were converted from (B); and (D) three categories of products re-grouped from (C) and defined in (A) in temperature domain. (B) and (C) are mathematic projections of (A) in Ea and T variable spaces, while (D) is re-grouped (C).
This study focuses on the petroleum substance already existing prior to pyrolysis regardless of their composition and physical states (free or adsorbed) in a source rock sample. Jarvie (2012) used the term “total oil yield” to describe the amount of petroleum in rock samples. The following terms are used to describe petroleum resource components in a shale reservoir. Similar to Jarvie (2012), total oil yield (TOY) is the quantity of petroleum already present in sample prior to pyrolysis and detected by FID during thermal analysis. Free hydrocarbon is one portion of TOY and represented by the Rock-Eval S1a peak that is thermally vaporized at or below 300°C during the thermal analysis. Sorbed oil describes the other portion of TOY that is thermally vaporized at temperatures exceeding 300°C during pyrolysis shown as S1b “carry-over” in the front of S2 peak, comprised of hydrocarbons and hydrocarbon-like substance of high molecular weight oil and bitumen (Jarvie 2012; Jiang, et al., 2016; Li et al., 2018). Please note that some of petroleum substances in S1a, particularly the gaseous and volatile components are likely lost during drilling and sampling prior to the laboratory analysis, and all these need to be taken into account for advanced resource assessment.
The evaporative loss of free hydrocarbons in source rock samples is a well-known problem, and various methods have been proposed to address this issue. For example, Michael et al. (2013) proposed using the density index API of crude oil and the <C15 hydrocarbon content to estimate light hydrocarbon loss. Chen et al. (2018) used geochemical data to calculate the amount of light hydrocarbon loss in S1 on the basis of material balance. Based on the phase equilibrium and studies of pyrolysis light hydrocarbon loss under different temperature and pressure conditions, Chen et al. (2019b) proposed the use of oil formation volume factor (FVF) or solution gas oil ratio (GOR) to estimate evaporative loss from a sample during coring/drilling. The approach proposed by Chen et al. (2019b) is adopted in this study, using FVF to approximate light hydrocarbon loss during coring/drilling for samples from oil window and extend the evaporative loss into dry gas window in this study.
In this paper, S1F is defined as the free petroleum, and S1S the oils sorbed in the source rock corresponding to the S1b peak in Figure 3A. Jarvie (2012) refers to the sum of the two as total oil yield (TOY):
The units are the same as the pyrolysis data (mg HC/g rock).
Here, we are interested in the free hydrocarbons only and will discuss the sorbed oils later. The total free hydrocarbon (S1F) is the sum of the remaining free hydrocarbon (S1a) in the sample as represented in Figure 3A, and the light hydrocarbons lost during coring, storage, sampling and preparation prior to analysis (S1L):
Let S1LS denote the amount of light hydrocarbon loss during coring and S1LP the loss during storage, sampling and sample preparation prior to analysis. The total amount of light hydrocarbon loss (S1L) is defined as:
For shale reservoirs still located in the oil window, the light hydrocarbon in sample can be calculated using the formation volume factor (FVF) of the crude oil:
where S1a corresponds to the Rock-Eval S1 reading of normal pyrolysis procedure, representing the amount of remaining free hydrocarbons in the sample; ρoilS and ρoilR are the densities of crude oil under surface and reservoir conditions. If the difference of the two densities is smaller than the uncertainty of the density data itself, we can directly use (S1a+S1LP)×FVF to restore the amount of gaseous hydrocarbons lost during coring. It can be seen later that FVF is a power function of Tmax. At the end of the oil window, even a small abnormal fluctuation in Tmax value can affect the calculation of FVF. As such, a constraint based on conservation principle is introduced to avoid over-corrections. An upper-limit constraint is given in the following form:
where f (fraction) is hydrocarbon expulsion efficiency factor and HIo (mg HC/g TOC) is the initial hydrogen index that can be obtained using the empirical equations in Chen and Jiang (2016); Li et al. (2019). HI (mg HC/g TOC) and TOC (w % of rock) are measured hydrogen index and total organic carbon content from pyrolysis respectively, and their values decrease with increasing maturity.
For samples in gas window, the correction can be done on the basis of gas volume change through gas compressibility calculation. Let moilR denote the oil mass in shale reservoir, φorg (=φoilR) be the corresponding pore space storing the oil, and ρoilR be the oil density in reservoir. Let VgasR denote the volume of natural gas in reservoir, ρgasS be the density of natural gas at surface condition, and mgasS the mass of natural gas at standard surface condition. The gas formation volume factor bg, can be estimated from the following equation:
where Tr and Ts k) are temperatures at reservoir and standard surface condition, respectively; Ps and Pr are pressures (mPa) in reservoir and surface condition respectively, and z is gas compressibility factor.
The oil volume in reservoir can be estimated by
and the gas volume in surface condition
by assuming that the volume of pore space occupied by oil before being thermally cracked to gas remains approximately the same, the ratio of the pore volume in reservoir (
From Eq. 8, the gas evaporative loss can be estimated by the difference between
In contrast, the amount of light hydrocarbon loss during sample storage and sample preparation are subject to many factors, such as, the type of sample (cuttings or core), oil and gas composition, source rock maturity, abundance of organic matter, state of core (complete or broken), storage conditions after coring (immediately sealed with plastic film or cryopreservation with liquid nitrogen, etc.), and whether the sample is analyzed immediately after pulverization (Jiang, etc. 2016; Michael et al., 2013; Chen, et al., 2018). In the absence of detailed information, accurate estimation of the loss of light hydrocarbons during core storage, sampling and sample preparation seem to be difficult. As such, we apply an average value from laboratory experiments, such as those from Jiang et al. (2016). This method is a mass balanced method and does not require knowing the mechanisms of light hydrocarbon loss.
The temperature dependency of chemical reaction rate constant kj is described using the Arrhenius equation (e.g., Chen et al., 2017b):
where A is the pre-exponential or frequency factor, Ej is the activation energy of the jth compositional group, R is the gas constant, T is the absolute temperature, and aj is the abundance of the jth components.
Penner (1952) showed that the temperature dependency of rate constant in chemical reaction kinetics also holds for thermal evaporation. The rate constant for evaporation (
where B is the frequency factor of evaporation, which is a function of enthalpy and molecular weight of evaporating liquid, and free volume (per molecule) in condensate state. HVj is the enthalpy for composition group j of the evaporating liquid, and e =2.71828 is a mathematical constant that is the base of the natural logarithm.
Thermal evaporation of petroleum in an open pyrolysis system is treated as pseudo thermal decomposition as the physical evaporation and chemical reaction processes are mixed at low temperature, and the formulation in chemical reaction kinetics (Eq. 9a) is used to approximate the behavior of thermal evaporation of petroleum substances in an open pyrolysis system.
Let x denote the content of petroleum in the source rock, and f(x) a mathematical function of x describing the thermal evaporation. The petroleum evaporation of a source rock sample in a pyrolysis system can be approximated by a series of independent and parallel first order pseudo-chemical reactions with aj representing relative contribution of the jth component (Chen et al., 2018; Li et al., 2018).
Eq. 10 is re-written to reflect the fact of mixture of three types of thermal products during programed pyrolysis:
The first term on the right side in Eq. 11 describes the thermally evaporated free hydrocarbons in S1a; and the second term quantifies the thermally vaporized hydrocarbon residuals of bitumen and heavy oils (i.e., S1b), and the third one represents the true kerogen thermal decomposition of the source rock during pyrolysis, S2. In the equation, w is the number of pseudo-activation energies for the free hydrocarbons in S1a, p is the number of pseudo-activation energy groups for the residual oils in S1b, and q is the number of activation energy groups for the kerogen in S2.
By sharing the same frequency factor A and using an activation energy distribution for the mixed physical and chemical thermal processes, the cumulative amount of hydrocarbons detected by FID at time
where D(E) is the density of petroleum components with specific ranges of activation energies, and
where
Early and intermediate products of kerogen thermal degradation contain a large amount of high molecular weight bitumen and heavy crude oil components. Strong interaction between those products and the host rock makes sorption a common phenomenon for source rocks in oil window, and this oil component is often not detected and reported as free hydrocarbons with routine Rock-Eval analysis. Li et al. (2018) reported >50% of the total oil yield in sorbed sate in Eocene-Oligocene Shahejie Formation source rocks from the Jiyang Sag. Similarly, Han et al. (2015) reported 54% of the total oil being sorbed in the Barnett shale in Bend Arch-Fort Worth Basin of the United States. To tackle this issue, Jarvie (2012) suggested two separate pyrolysis analyses on the same sample, one on the whole rock sample and the other on the solvent-extracted aliquot. The adsorbed oil content (S1S) can then be estimated from the two pyrolysis results by the following relationship:
where, S2 and S2X are the hydrocarbon generation potentials from the pyrolysis data before and after solvent treatment, and S1X is the free hydrocarbon S1 after solvent treatment.
Alternatively, Li et al. (2018) proposed a numerical method for directly calculating the adsorbed oil based on hydrocarbon generation kinetics and the differences in the thermal evaporative and kerogen cracking products. By transforming the sample FID pyrogram (Figure 3A) into activation energy domain (Figure 3B), two activation energy distributions can be obtained, one for petroleum substances existing in the sample by thermal desorption and the other for kerogen cracking products. Transforming the activation energy distribution of the kerogen decomposition products back to temperature domain will result in a true S2 equivalent curve S2Xeq, the pyrogram equivalent of a solvent-treated sample (Figures 3C, D). The adsorbed oil can then be calculated using the following equation:
For details of the numerical method, readers are referred to Li et al. (2018).
The upper Devonian Duvernay Shale is a known petroleum source rock in the Devonian conventional petroleum system of south-central Alberta in WCSB (Creaney et al., 1994) and has been studied and reported in the past (e.g., Stoakes and Creaney, 1984 and, 1985) Creaney, 1989; Creaney and Allan 1990; Allan and Creaney, 1991; Switzer et al., 1994; Chow et al., 1995 and Stasiuk and Fowler, 2002 and 2004). It is also a proven liquid-rich shale gas play in North America (AER, 2016; NEB, 2017). The Duvernay Formation was deposited under basinal and marine setting with deep-water and low-energy conditions surrounded by reefs and carbonate platforms. The Duvernay source rock is organic-rich, consisting of mostly oil prone Type II kerogen, with present day TOC values of up to 15%. Duvernay-sourced oils are low in sulphur and have pristane/phytane ratios of 1.5–2.4, indicating source deposition under normal marine salinities in an oxygen-poor environment (Creaney et al., 1994). Studies suggested that the presence of anoxic conditions, combined with slow sedimentation rates, are the main reasons for preservation of organic material in this organic-rich source rock (Chow et al., 1995). Stasiuk and Fowler (2004) and 2005 show that maturity of the organic matter varies from immature in the north and east to over-mature in the southwest close to the deformation front, with a large part of the Duvernay Shale basins lying in the wet-gas generation window. Dong et al. (2019) presented a porosity model for the Duvernay shale reservoir, documenting the porosity development with increasing thermal maturity.
Five core samples from recent Duvernay Shale oil and gas pilot wells of various thermal maturities are selected for this study. They are organic rich with remaining TOC contents varying from 3.21 to 5.73% and show wide range of maturity levels from early mature (Tmax = 433°C) to over mature (Tmax = 560°C) in a depth range between 2,412 and 3725 m (Table 1). The remaining petroleum generation potential as represented by HI varies from 435 to 39 mg HC/g TOC (Table 1) and decreases with increasing thermal maturity (Figure 4A). The OSI=S1/TOCx100 (mg HC/g TOC) increase with maturity and reaches a maximum at around Tmax of 475°C (Figure 4B), then follows a decreasing trend with further thermal maturation. The samples above the OSI = 1 line in Figure 4C are those with abundant free oil. S1 versus S2 do not follow a linear correlation because of the maturity overprint (Figure 4D). When samples come from the same source rock with similar maturity in oil window, S1 and S2 show a linear relationship (e.g., Chen et al., 2018).
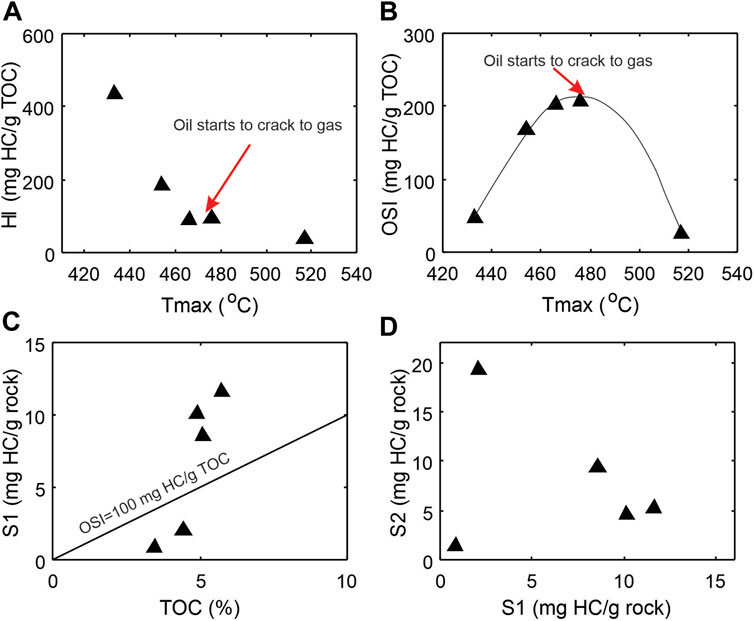
FIGURE 4. Cross-plots of Rock-Eval parameters showing general characteristics of the source rock samples and the thermal maturity overprints. (A) Hydrocarbon generating potential hydrogen index HI vs maturity parameter Tmax; (B) Oil saturation index OSI vs maturity Tmax; (C) S1 peak vs TOC; (D) S2 peak vs S1 peak. OSI=S1/TOC × 100 (oil saturation index).
The EGA FID hydrocarbon pyrograms of the five naturally matured samples have been normalized to their TOC contents and overlapped one to another to show the systematic shift in the thermally evolved products from kerogen to petroleum with increasing thermal maturity (Figure 2A). The S1 peak on the left represents thermally evaporated petroleum substance already in the sample, whereas the S2 peak on the right corresponds to the remaining kerogen yet to be converted. With increase in thermal maturity, S2 peaks decrease in both height and size, accompanied by a shift in temperature at the peak generation rate. The diminishing of remaining kerogen generation potential with increasing maturity is clearly demonstrated by decreasing HI with increasing Tmax in Figure 4B. It should be noted that no special measures have been taken to prevent the evaporative loss of light hydrocarbons during coring and sample preparation for analysis of any of the five samples.
Several interesting observations can be made from Figure 2A on the change in S1 peaks. First of all, the temperature of peak valley between S1 and S2 peaks varies from around 300°C for immature source rock sample to 430°C for high maturity samples (Tmax > 460°C). The temperature shifts in both S1 and S2 curves suggest a dynamic process in kerogen conversion and show compositional changes in both kerogen and generated petroleum products through kerogen conversion to petroleum fluids. Secondly, S1 peak does not show a monotonic increase with thermal maturation and kerogen conversion to petroleum products (Figure 2A). The size and height of S1 curves reach the maximum at Tmax around 466–476°C (Figure 2A) due to oil expulsion in the source rock and evaporative loss of volatile components during coring/drilling, sampling and sample preparation in laboratory. Thirdly, change in the shape of S1 curve reflects oil compositional variation with thermal maturation. A considerable amount of light oil already in the sample seems to have disappeared, being partly expelled from the source rock as a consequence of fluid expansion and partly lost when the core was brought to the surface.
Among the five samples, the least thermal mature is C-590392 with a Tmax = 433°C, PI = 10% and vitrinite reflectance of 0.8%. To establish a full thermal decomposition trajectory for the Duvernay Shale from immature stage, it is preferably to start from an immature sample. The pyrolysis parameters and activation energy estimation of the sample SAP (Table 1; Figure 5A) from Dieckmann et al. (2004) were taken to serve as the immature sample. The forward kinetic modeling procedure by Chen et al. (2015 and 2019) is employed to generate pseudo Tmax-HI trajectory that are then superimposed by the measured sample data points to show the thermal decomposition path of the Duvernay Shale (Figure 5B). The modeled kerogen conversion using the activation energy and frequency factor of the SAP sample is shown in Figures 5A, C transformation ratio based on empirical equation of Chen and Jiang (2016) is plotted in Figure 5D.
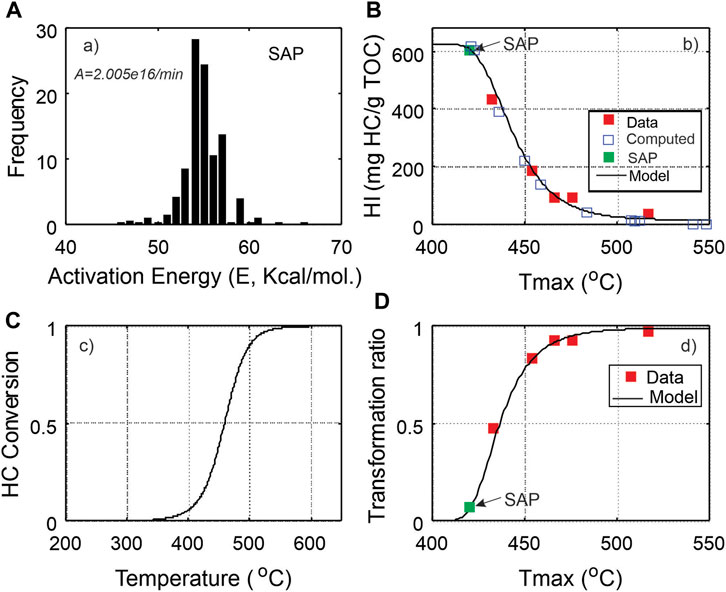
FIGURE 5. Comparison of kerogen conversion models from chemical reaction kinetic model and data-driven model. (A) Estimated kinetic parameters from the core sample SAP in Dieckmann et al. (2004) was used as immature source rock for hydrocarbon generation model; (B) Tmax-HI plot of data and computed Tmax-HI data pairs using a forward modelling (Chen et al., 2017b); (C) Computed kerogen conversion rate using kinetic parameters in Dieckmann et al. (2004); (D) Constructed empirical model of kerogen transformation ratio from data in Figure 5B).
A total of 238 horizontal production wells were drilled into the Upper Devonian Duvernay Shale with multi-stage fracturing between 2011 and 2015. The proven reserves include 210 million barrels of oil and 1.2 trillion cubic feet of natural gas from 21 shale oil wells and more than 100 gas wells (AER, 2016). Production data suggest a good correlation between gas-to-oil ratio (GOR) and formation volume factor (FVF) in conventional petroleum reservoirs (PetroWiki, 2018). Similarly, initial GOR of dissolved gas in shale oil reservoirs is well correlated with FVF. Available GOR, FVF and fluid density data from the proven Duvernay shale reservoirs are plotted in Figures 6A, B. In reservoir engineering practice, it is common to use GOR from production data to estimate FVF (Figure 6A), Data analysis shows that the maturity index Tmax and GOR also have a good empirical relationship (Figure 6C). By replacing GOR from production data by a highly correlated organic geochemical indicator Tmax (source rock maturity indicator), an empirical relationship between Tmax and FVF (Figure 6D) is derived based on the relationship in Figures 6A, C (Chen and Jiang, 2020).
where FVF is the oil formation volume factor of the source rock reservoir and FVF takes a value between 1-3 in oil generation window; Tmax (a kinetic parameter) is the pyrolysis temperature corresponding to the highest hydrocarbon generation rate on a pyrogram. Eq. 16 is applicable to source rock reservoir within oil generation window only. For the Duvernay shale, the upper limit of Tmax is around 465°C (Figure 6C). Figure 6E shows the reservoir pressure of the liquid rich Duvernay shale. For different source rocks, the parameters in Eq. 16 will have to be adjusted by fitting data.
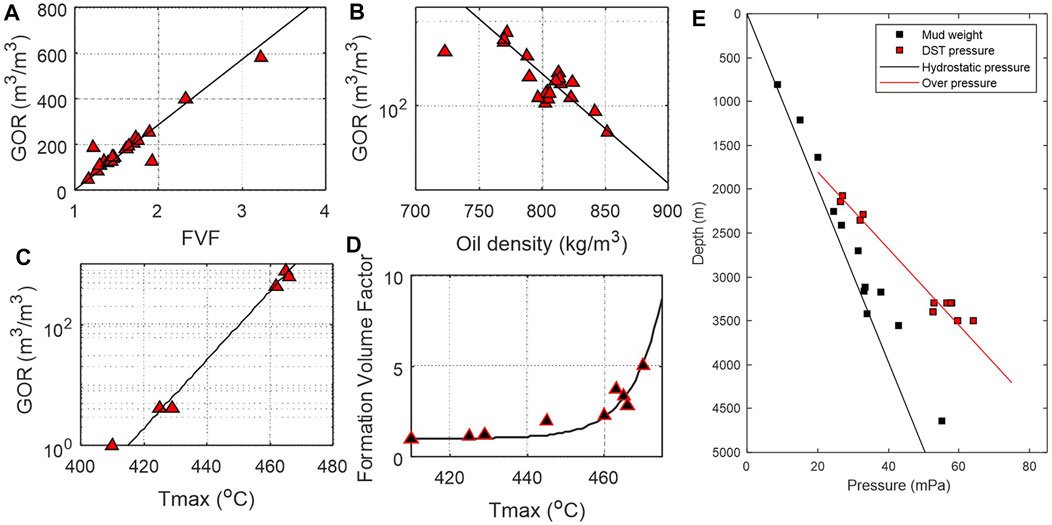
FIGURE 6. Cross-plots of reservoir parameters of the Duvernay Shale showing general characteristics of petroleum fluids at surface condition (modified from Chen and Jiang, 2020). (A) Gas to oil ratio GOR vs formation volume factor VFV; (B) GOR vs oil density; (C) GOR vs maturity index Tmax; (D) Formation volume factor FVF vs maturity index Tmax. (E) Reservoir pressure profile of the liquid-rich Duvernay shale.
For samples from gas generation window, Rock-Eval S1 measures the adsorbed gas only and Eq. 8 can be used directly to estimate the mass of natural gas in reservoir condition with the following parameters assumed: gas density of 0.7 kg/m3 at surface condition; oil density of 860 kg/m3 in reservoir condition; and gas compressibility factor z = 1.1. For the calculation of bg, measured pressure and temperature gradients in the region are used to obtain empirical models of reservoir pressure and temperature, leading to an average pressure gradient of 13.5 mPa/km and temperature gradient of 0.029°C/m in this study.
The estimated evaporative loss, that is, the difference between the HC retained and HC observed (S1) is shown in Figure 7 for each sample, and compared with the computed total petroleum that has been generated from the source rock at different maturities. The difference between the HC generated and HC retained indicates the amount of petroleum that has been expelled from the source rock.
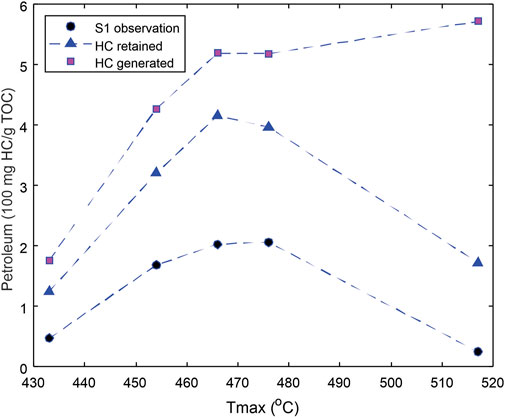
FIGURE 7. Comparison of observed S1 (free petroleum remained in samples) with retained petroleum (TOY defied by Eq. 1) that is the total quantity of petroleum corrected from light hydrocarbon loss. The total petroleum generated is shown as a reference.
The numerical method by Li et al. (2018) is used in this work to transform the Rock-Eval FID pyrogram from temperature domain to activation energy domain. Figure 8 displays the activation energy (Ea) distributions of the five samples with increasing thermal maturity. Each Ea distribution can be roughly divided into two populations (groups): petroleum substances already in sample prior to analysis (yellow) and petroleum generated from kerogen during lab pyrolysis (red). With increasing maturity, the petroleum population increases while kerogen population decreases. To separate the two groups, it is assumed that each of the Ea groups can be modelled by a normal distribution (e.g., Braun and Burnham, 1987). As the two distributions could overlap in a transition zone between 47 and 54 kcal/mol, a sigmoid function is used to fit the cumulative curve of kerogen group (Figure 9), thus determining its natural extension. By adopting the sigmoid natural extension to the left side and keeping the original Ea values on the right, we obtain a corrected Ea distribution for kerogen components for each sample. The difference between the corrected and uncorrected Ea distributions for kerogen components derived from the S2 curve is considered to be the equivalent of the petroleum sorbed in the source rocks or having complex petroleum molecules requiring high temperature to evaporate. The numerically estimated sorbed oil is plotted in Figure 10A.
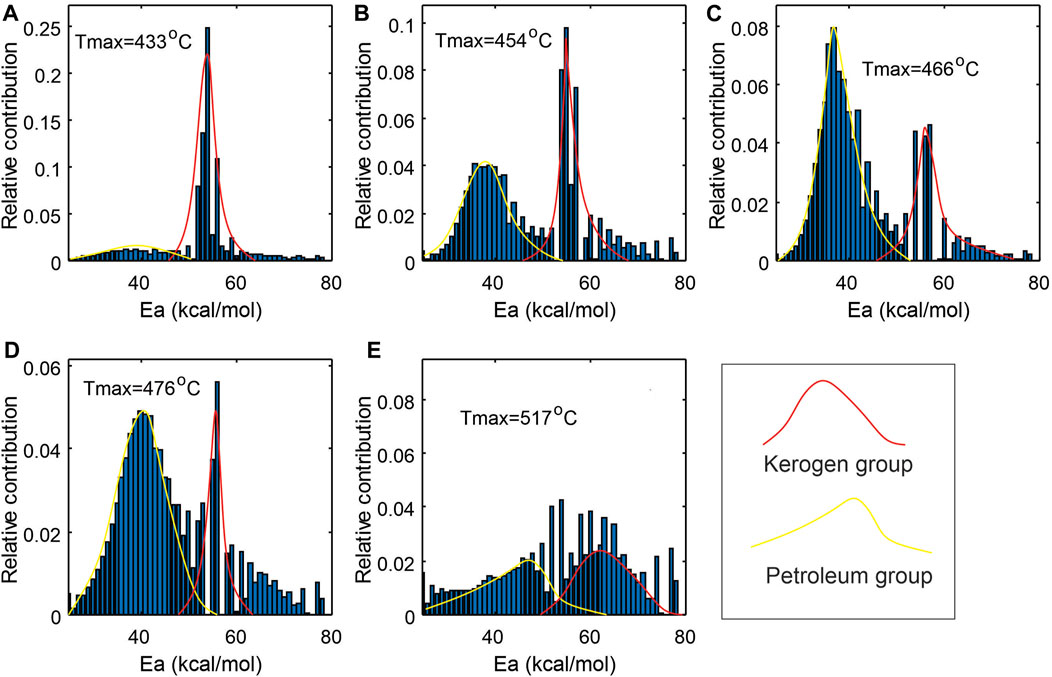
FIGURE 8. Petroleum and kerogen components grouping based on Ea values derived from Rock-Eval FID curve in an activation domain, seeing growth in petroleum and decline in kerogen components with increasing thermal maturity: (A–E) correspond to samples C-590392, C-594351, C-590327, C-590436 and C-590378 in Table 1.
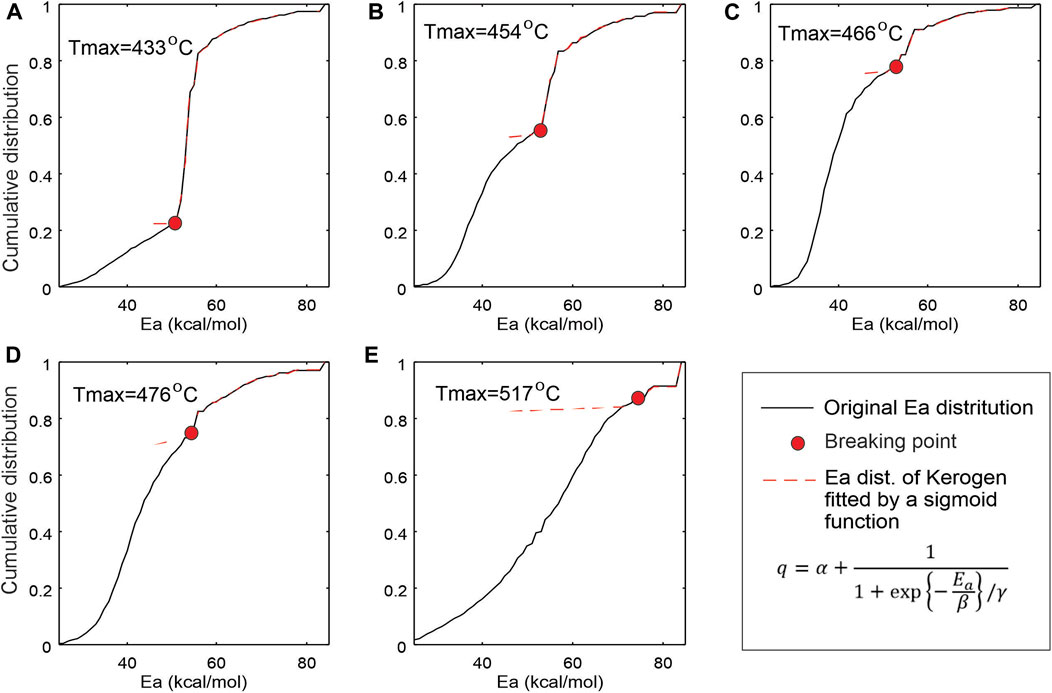
FIGURE 9. Separation of kerogen components from petroleum components in Ea domain. (A–E) correspond to samples C-590392, C-594351, C-590327, C-590436 and C-590378 in Table 1. Each group was fitted to a normal distribution, and separation in the mixed transitional area was achieved using a sigmoid function, in which α, β and γ are unknown parameters and obtained by fitting the S2 curve.
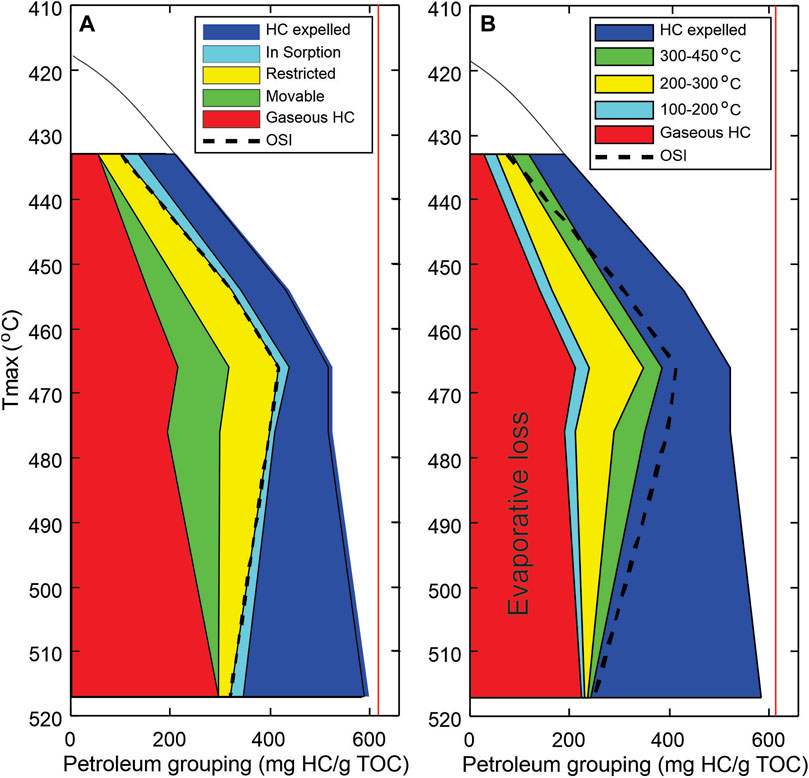
FIGURE 10. Petroleum fluid composition grouping and mobility estimation in shale petroleum reservoir, Duvernay Formation in WCSB. (A) resource grouping based on petroleum fluid mobility assessment in reservoir (phase behaviors and OSI); (B) petroleum compositional grouping (boiling temperature range equivalent) inverted from kinetic models. Oil saturation index: OSI=S1/TOCx100. The evaporative loss includes gaseous hydrocarbons and light oils that have been generated and retained in the shale, but lost prior to the sample analysis.
In this study, the TOY is divided into four sub-groups: sorbed oil (Eq. 1), oil and gas with restricted mobility, movable oil, and gaseous petroleum lost prior to analysis during coring, storage and sample preparation. The movable oil is defined as a portion of petroleum substances that can flow freely in reservoir condition. Jarvie (2012) defined an oil saturation index OSI = 100 × S1/TOC, and production statistics suggest that most producing shale oil intervals in North American have an OSI> 100 mg HC/g TOC, while Behar et al., 2002 called OSI > 100 “oil show” in conventional oil exploration. An OSI value greater than 100 mg HC/g TOC may suggest that the mass of petroleum fluids in the reservoir has exceeded the source rock retention capacity. We adopt the definition of movable oil as the portion of TOY that exceeds the critical threshold of the sample TOC value (Chen et al., 2019b; Li et al., 2019):
where
The oil and gas grouping (normalized to TOC) results for the five Duvernay shale samples with respect to mobility are plotted in Figure 10, showing the variation of different mobility groups with thermal maturation. Movable petroleum resource increases with increasing thermal maturity and reaches a maximum from the peak generation to wet gas window (Tmax from 450 to 490°C) where kerogen is almost depleted and condensate dominates. Massive cracking of oil to gas accelerates expulsion from Tmax = 475°C onward, leading to continuous loss of petroleum fluids and thus decreasing resource intensity (defined as mass of hydrocarbon/reservoir volume). Figure 10 demonstrates the changes in the mass of hydrocarbon retained in shale reservoir with maturity and shows mobility level of petroleum fluids increasing from left to right.
Following the steps of the proposed methods described above in Section 2.2.2, the retained petroleum substances in the analyzed sample represented by S1a and S1b can be grouped according the temperature sections in thermal analysis: 100–200°C, 200–350°C, 350–450°C, 400–650 and >650°C on the basis of evaporative kinetics (Figure 8). The corresponding Ea values in Figure 8 for each temperature interval was transformed back to temperature domain, representing evaporation/thermal desorption and chemical reaction equivalent composition (Figure 11). The first 3 groups with lower temperature in Figure 11 are the petroleum substances already generated and retained in the samples. The gaseous hydrocarbon group (<100°C) is the estimated evaporative losses and not shown in Figure 11. Numerically, the evaporation rate of petroleum products during pyrolysis is modeled as a convolution of the Ea distribution and evaporation/reaction rate constant (Eq. 11), as such, there will be overlaps between successive oil temperature groups. The degree of overlap depends largely on the temperature ramping rate of the experiment and is shown in Figure 11. The 100–200°C group components may represent light oil components < C12, corresponding to petroleum substances with boiling temperature <200°C. Those in temperature range 200–350°C may represent intermediate molecular weight components with carbon number less than C20, while the 350–450°C group likely represents components of high molecular weight and high boiling point substances (Li et al., 2020). The last two groups are kerogen (chemical decomposition) components (450–650°C) and spent kerogen and pyrobitumen (>650°C) that are exhausted of side aliphatic chains.
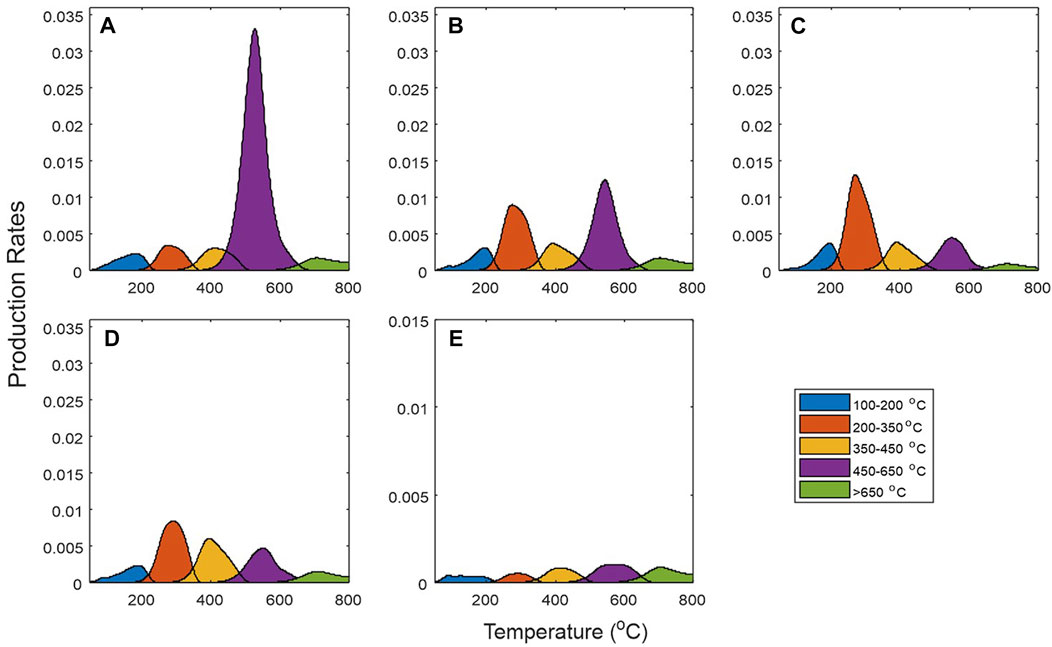
FIGURE 11. Petroleum and kerogen component grouping for the five Duvernay shale samples, showing progressive decrease in kerogen component and increase in petroleum components with increasing thermal maturity: (A–E) corresponding to samples C-590392, C-594351, C-590327, C-590436 and C-590378 in Table 1. Petroleum components are lost in gas generation windows due to hydrocarbon expulsion and evaporative loss of gaseous components.
There are several observations on the relationship between mobility groups and thermal maturity. First, in general sorbed oil decreases with increasing thermal maturity, so does the restricted oil and gas group (Figure 10). This reflects the thermal decomposition processes of large molecule heavy oil and bitumen complex breaking down with increasing thermal stress. When the size of petroleum molecule becomes smaller, the interaction between petroleum fluids and host rock is weakened, while when its quality is beyond a critical threshold, the excess part becomes mobile. In gas window, the petroleum group with restricted mobility represents the gases adsorbed to the walls of organic pore and the surface of clay minerals. Secondly, the gas component and movable petroleum groups behave differently. The movable oil increase gradually from early oil generation window and reaches a maximum at the end of oil generation and the beginning of wet gas window in a Tamx zone from 465 to 480°C, where large amount of gaseous petroleum is generated before massive hydrocarbon expulsion. The movable oil group starts to decrease as oil cracking intensifies, while gaseous group appears to decline slightly in mass with increasing thermal maturity. Petroleum fluid maintains an equilibrium between volume and pressure during oil cracking as evidenced from a drastic increase in the volume of expelled petroleum fluids. Thirdly, the mobility of petroleum fluids improves at the expenses of reduced resource potential in the shale reservoir as evidenced by decreased mass of petroleum (per unit TOC) at advanced thermal maturation levels. The total petroleum in mass reaches maximum at the end of oil generation window, and then follows a decreasing trend as fluid expansion causes expulsion. The maximum retaining rate of petroleum fluids (mg HC/g TOC) in shale is in the transitional zone from late oil generation to wet gas windows. Petroleum fluid gains its mobility by converting to smaller gaseous substances, which is a trade-off for reduced resource potential via petroleum expulsion. When the source rock enters gas generation window, the aliphatic carbon-carbon chains becomes shorter, improving the mobility of petroleum fluids in reservoir.
Figure 10 compares the grouping results by petroleum fluid mobility (Figure 10A) and by compositional evaporative kinetics (Figure 10B). The gaseous petroleum group is derived from PVT and phase behavior analysis associated with P/T changes from reservoir to surface conditions. The two low temperature petroleum groups (<350°C) (Figure 10B) appear to be comparable with the movable group determined from OSI. The calculated high molecular petroleum substances in temperature range of 350–450°C represent the groups affected by OM-mineral interaction and sorption. However, there are differences between the two types of grouping. The grouping based on evaporative kinetics of petroleum substance shows considerable amount of petroleum in low boiling temperature range at low maturity. This appears to be similar to the phenomena of “permeability jail” in tight gas reservoir, where when gas saturation is less than a critical value, the relative permeability of gas is too low to allow gas flowing to wellbore. For a shale oil reservoir with low thermal maturity, the amount of light oil is less than rock sorption capacity or is dissolved in heavy oil-bitumen, making it not movable. This is also true even in the gas generation window where there still requires a portion of available gas to saturate the active pore surfaces, making the recovery of those gas typically difficult. Thus, petroleum fluid mobility is not only a matter of its compositional characteristics, but also involves additional critical conditions due to increased complexity of interaction between the fluids and the host rock that contains mixed pore types with different physical and chemical properties. However, recent molecular thermodynamic simulation showed that petroleum fluid flow in a shale reservoir depends not only on fluid types (size of the molecule, viscosity, composition) and the pore characteristics (size distribution, type of pore, connectivity), but also the interaction between petroleum fluids and host rock (kerogen types, types and grain size of mineral contents) (e.g., Akkutlu and Fathi, 2012; Akkutlu et al., 2017; Bui et al., 2018; Baek and Akkutlu, 2019a; Baek and Akkutlu, 2019b; Baek and Akkutlu, 2019c). In addition, depending on compositional character of the petroleum fluids, hydrocarbon molecules are likely to be trapped in the pores when the pore size is smaller than a critical threshold (Zhang, et al., 2017). Oil nanopore confinement has also been shown to be a key issue in the mobility of oil, which involves pore size distribution and structure in shale reservoir. Therefore, oil mobility evaluation in shale reservoir has to consider both oil composition and pore characteristics simultaneously. In combination with pore structure and size distribution, it could provide new insights for better understanding the hydrocarbon mobility in shale reservoirs.
The above proposed method for resource estimation is a mass balanced approach that can potentially minimize the impacts of phase change on volumetric calculations of the resource. Hydrocarbons in the original samples were categorized into mobility groups largely based on their combined behavior of changes in phase and PVT characteristics under different physical conditions (reservoir versus surface) and responses to ramping temperature during routine pyrolysis in the laboratory. The utilization of evaporative kinetics for hydrocarbon fractional analysis avoids additional laboratory analyses, and can be directly related to chemical compositional fractions based on their boiling temperature ranges.
This study showed that PVT and phase behavior related changes in petroleum fluid volume and composition due to differences in T/P from reservoir to surface conditions can be used to estimate the amount of evaporative loss of free hydrocarbons in shale rock samples, providing additional information useful for assessing resource potential and oil mobility in shale reservoirs. In oil generation window, the oil formation volume factor is proposed for estimating the evaporative loss of dissolved gas in S1 because the dissolved gas is released due to pressure drop when core is brought to surface. In gas window, the gas volume change, quantified by gas formation volume factor as a function of temperature and pressure, is used to restore the mass of gaseous petroleum in a reservoir condition. With corrections for both evaporative hydrocarbon loss and heavy oil “carry over” in S2, the total oil yield represents better resource intensity in a shale reservoir.
While petroleum fluid mobility increases with maturity in general, the total movable resource reaches its maximum at the end of oil generation window around Tmax = 465°C, then declines towards gas generation window as a result of massive expulsion due to overpressure from thermal cracking of liquid to gaseous hydrocarbon. In this sense, increased oil mobility with thermal maturation is a trade-off with reduced resource intensity.
Evaporative kinetics-based petroleum composition grouping does not show a complete accordance with mobility grouping based on reservoir phase behavior and OSI, suggesting that composition is not the only factor controlling oil mobility. Similar to permeability jail in tight gas reservoir, oil also needs to saturate the retention capacity (including sorption, nanopore confinement and other impeding forces) of the host rock prior to flow. More studies are required to better understand the oil mobility in shale reservoirs.
The datasets presented in this article are available upon request that can be directed to the corresponding author: emh1b2hlbmcuY2hlbkBucmNhbi1ybmNhbi5nYy5jYQ==.
All authors participated in the preparation of the paper. ZC: Conceptualization, mathematical method development and data processing, original draft writing and revision; CJ: Conceptualization, programmed thermal analysis design and data interpretation, draft writing, review and revision; JR: Analytical data processing and iq16nterpretation, manuscript review and revision; XL: Mathematical method development and data processing, manuscript draft review and revision. EL: Resource and admin support of project, manuscript review.
This represents an output from Geoscience for New Energy Supply Program of Natural Resources Canada and is partly supported by PERD funding.
We thank the two journal reviewers as well as our internal reviewer J. Cesar Colmenares at Geological Survey of Canada, for their helpful comments and suggestions that improved the quality of the paper. This is Geological Survey of Canada NRCan Contribution 20220418.
The authors declare that the research was conducted in the absence of any commercial or financial relationships that could be construed as a potential conflict of interest.
All claims expressed in this article are solely those of the authors and do not necessarily represent those of their affiliated organizations, or those of the publisher, the editors and the reviewers. Any product that may be evaluated in this article, or claim that may be made by its manufacturer, is not guaranteed or endorsed by the publisher.
Abrams, M. A., Gong, C., Garnier, C., and Sephton, M. A. (2017). A new thermal extraction protocol to evaluate liquid rich unconventional oil in place and in-situ fluid chemistry. Mar. Pet. Geol. 88, 659–675. doi:10.1016/j.marpetgeo.2017.09.014
AER (2016). Duvernay reserves and resources report, A comprehensive analysis of alberta’s foremost liquids-rich shale resource. .
Akkutlu, I. Y., Baek, S., Olorode, O. M., Wei, P., Zhang, T., and Shuang, A. (2017). Shale resource assessment in presence of nanopore confinement, URTEC-2670808-MS. Unconventional Resources Technology Conference, SPE/AAPG/SEG Unconventional Resources Technology Conference. 24. July 26, Austin, Texas, USA, doi:10.15530/URTEC-2017-2670808
Akkutlu, I. Y., and Fathi, E. (2012). Multiscale gas transport in shales with local kerogen heterogeneities. SPE J. 17 (04), 1002–1011. doi:10.2118/146422-PA
Allan, J., and Creaney, S. (1991). Oil families of the western Canada basin. Bull. Can. Petroleum Geol. 39, 107–122.
Ambrose, R. J., Hartman, R. C., Diaz-Campos, M., Akkutlu, I. Y., and Sondergeld, C. H. (2012). Shale gas-in place calculations Part I: New pore-scale considerations. SPE J. (March) 17, 219–229. doi:10.2118/131772-pa
Baek, S., and Akkutlu, I. Y. (2019a). CO2 stripping of kerogen condensates in source rocks. SPE J. 24 (03), 1415–1434. doi:10.2118/190821-PA
Baek, S., and Akkutlu, I. Y. (2019c). Produced-fluid composition redistribution in source rocks for hydrocarbon-in-place and thermodynamic recovery calculations SPE J. 24 (03), 1395–1414. doi:10.2118/195578-PA
Baek, S., and Akkutlu, I. Y. (2019b). “Recovery mechanisms for nano-confined oil in source rocks using lean gas injection” in. SPE (Society of Petroleum Engineers) Western Regional Meeting. San Jose, CA, April 2019. doi:10.2118/195272-MS
Behar, F., Beaumont, V., De, B., and Penteado, H. L. (2002). Rock-eval 6 technology: Performances and development, oil & gas science and Technology. Rev. IFP 56 (2), 111–134.
Bohacs, K. M., Passey, Q. R., Rudnicki, M., Esch, W. L., and Lazar, O. R. (2013). The spectrum of fine-grained reservoirs from “shale gas” to “shale oil”/tight liquids: Essential attributes, key controls, practical characterization. IPTC 16676, 1–16.
Braun, R. L., and Burnham, A. K. (1987). Analysis of chemical reaction kinetics using a distribution of activation energies and simpler models. Energy & Fuels 1 (2), 153–161. doi:10.1021/ef00002a003
Bui, K., Akkutlu, I. Y., Zelenev, A., and Hill, W. A. (2018). “Kerogen maturation effects on pore morphology and enhanced shale oil recovery” in. SPE Europec featured at 80th EAGE Conference and Exhibition, Copenhagen, Denmark, June 2018. doi:10.2118/190818-MS
Burnham, A. (2017). Global chemical kinetics of fossil fuels, how to model maturation and pyrolysis. Springer, 145–147.
Burnham, A. K., and Braun, R. L. (1999). Global kinetic analysis of complex materials. Energy Fuels 13 (1), 1–22. doi:10.1021/ef9800765
Cander, H. (2013). Finding sweet spots in shale liquids and gas plays: (with lessons from the eagle ford shale). Search and discovery article #41093, 2012–2013. Posted May 13, 2013 Available.
Chen, J., Pang, X., Pang, H., Chen, Z., and Jiang, C. (2018). Hydrocarbon evaporative loss evaluation of lacustrine shale oil based on mass balance method: Permian Lucaogou Formation in Jimusaer Depression, Junggar Basin. Mar. Petroleum Geol. 91, 422–431. doi:10.1016/j.marpetgeo.2018.01.021
Chen, Z., Kong, B., and Lee, H. S. (2022). Reservoir characteristics and light hydrocarbon channeling revealed by production data: A case study of liquid rich Duvernay shale play with emphasis in fox creek area, Alberta Canada. Fuel 392. doi:10.2139/ssrn.4093750
Chen, Z., and Jiang, C. (2016). A revised method for organic porosity estimation in shale reservoirs using Rock-Eval data: Example from Duvernay Formation in the Western Canada Sedimentary Basin. Am. Assoc. Petroleum Geol. Bull. 100 (3), 405–422. doi:10.1306/08261514173
Chen, Z., Jiang, C., Lavoie, D., and Reyes, J. (2016). Model-assisted rock-eval data interpretation for source rock evaluation: Examples from producing and potential shale gas resource plays. Int. J. Coal Geol. 165, 290–302. doi:10.1016/j.coal.2016.08.026
Chen, Z., Lavoie, D., Malo, M., Jiang, C., Sanei, H., and Haeri-Ardakani, O. (2017a). A dual-porosity model for evaluating petroleum resource potential in unconventional tight-shale plays with application to Utica Shale, Quebec (Canada). Mar. Petroleum Geol. 80, 333–348. doi:10.1016/j.marpetgeo.2016.12.011
Chen, Z., Li, M., Jiang, C., and Qian, M. (2019b). Shale oil resource potential and mobility assessment: A case study of upper devonian Duvernay shale in the western Canada Sedimentary Basin. Oil Gas Geol. 40 (6), 459–468.
Chen, Z., Li, M., Ma, X., Cao, T., Liu, X., Li, Z., et al. (2018). Generation kinetics based method for correcting effects of migrated oil on rock-eval data – An example from the Eocene qianjiang formation, jianghan basin, China. Int. J. Coal Geol. 195, 84–101. doi:10.1016/j.coal.2018.05.010
Chen, Z., Liu, X., Guo, Q., Jiang, C., and Mort, A. (2017c). Inversion of source rock hydrocarbon generation kinetics from Rock-Eval data. Fuel 194, 91–101. doi:10.1016/j.fuel.2016.12.052
Chen, Z., Liu, X., and Jiang, C. (2017b). Quick evaluation of source rock kerogen kinetics using hydrocarbon pyrograms from regular rock-eval analysis. Energy 31 (2), 1832–1841. doi:10.1021/acs.energyfuels.6b01569
Chen, Z., Liu, X., and Osadetz, K. E. (2019a). Petroleum generation kinetic models for late ordovician kukersite yeoman Formation source rocks, williston basin (southern saskatchewan), Canada. Fuel 241, 234–246. doi:10.1016/j.fuel.2018.11.154
Chow, N., Wendte, J., and Stasiuk, L. D. (1995). Productivity versus preservation controls on two organic-rich carbonate facies in the devonian of Alberta: Sedimentological and organic petrological evidence: Bull. Can. Petroleum Geol., 43, 433–460.
Creaney, S., and Allan, J. (1992). “Petroleum systems in the foreland basin of Western Canada,” in Foreland basins and foldbelts. American Association of petroleum geologists. Editors R. W. Macqueen, and D. A. Leckie (Memoir, 55, 279–308.
Creaney, S., Allan, J., Cole, K. S., Fowler, M., Brooks, P. W., Osadetz, G. K., Snowdon, L., and Riediger, C. L. (1994). “Petroleum generation and migration in the Western Canada Sedimentary Basin[M],” in Geological atlas of the Western Canada Sedimentary Basin, G.D. Mossop and I. Shetsen (comp.) (Calgary: Canadian Society of Petroleum Geologists and Alberta Research Council). URLlast accessed online June 24, 2014).
Creaney, S. (1989). “Reaction of organic material to geological heat,” in Thermal history of sedimentary basins - methods and case histories. Editors N. D. Naeser, and T. H. McCulloh (Springer-Verlag), 37–52.
Delveaux, D., Martin, H., Leplat, P., and Paulet, P. (1990). Comparitive Rock-Eval pyrolysis as an improved tool for sedimentary organic matter analysis. Orgarnic Geochem. 16 (4-6), 1221–1229.
Dieckmann, V., Fowler, M., and Horsfield, B. (2004). Predicting the composition of natural gas generated by the Duvernay formation (Western Canada sedimentary basin) using a compositional kinetic approach. Org. Geochem. 35, 845–862. doi:10.1016/j.orggeochem.2004.02.010
Dong, T., Harris, N. B., McMillan, J. M., Twemlow, C. E., Nassichuk, B. R., and Bish, D. L. (2019). A model for porosity evolution in shale reservoirs: An example from the Upper Devonian Duvernay Formation, Western Canada Sedimentary Basin. AAPG Bull. 103 (5), 1017–1044. doi:10.1306/10261817272
Han, Y., Horsfield, B., Wirth, R., Mahlstedt, N., and Bernard, S. (2017). Oil retention and porosity evolution in organic-rich shales. AAPG Bull. 101, 807–827. doi:10.1306/09221616069
Han, Y., Mahlstedt, N., and Horsfield, B. (2015). The Barnett Shale: Compositional fractionation associated with intraformational petroleum migration, retention, and expulsion. Am. Assoc. Petroleum Geol. Bull. 99 (12), 2173–2202. doi:10.1306/06231514113
Hartigan, D. A. (2014). The petrophysical properties of shale gas reservoirs. UK: Ph.D thesis, the University of Leicester. .
Jarvie, D. M. (2014). “Components and processes affecting producibility and commerciality of shale resource systems,”Geol. Acta (December: ALAGO Special Publication), 12. 307–325. N. 12.
Jarvie, D. M. (2012). “Shale resource systems for oil and gas: part 2—shale–oil resource systems,”. Editor J. A. Breyer (AAPG Memoir), 97. 89–119.Shale reservoirs—Giant resources for the 21st century. Tulsa: American Association of Petroleum Geologists.
Jiang, C., Chen, Z., Mort, A., Milovic, M., Robinson, R., Stewart, R., et al. (2016). Hydrocarbon evaporative loss from shale core samples as revealed by Rock-Eval and thermal desorption-gas chromatography analysis: Its geochemical and geological implications. Mar. Petroleum Geol. 70, 294–303. doi:10.1016/j.marpetgeo.2015.11.021
Jiang, C., Mort, A., Sanei, H., Chen, Z., Milovic, M., and Robinson, R. (2015). S1 peak of Rock-Eval analysis: What does it represent for unconventional hydrocarbon resource assessment? GeoConcention. .
Jiang, Q., Li, M., Qian, M., LiLiHuang, Z. Z. Z., Zhang, C., and Ma, Y. (2016). Quantitative characterization of shale oil in different occurrence state and its application. Petroleum Geol. Exp. 38 (6), 843–848.
King, G. E. (20142014). Improving recovery factors in liquids-rich resource plays requires new approaches, the American oil & gas reporter. .
Lafargue, E., Marquis, F., and Pillot, D. (1998). Rock-Eval 6 Applications in Hydrocarbon Exploration, Production, and Soil Contamination Studies. Oil Gas Sci Technol, Rev. Fr. Petroleum Inst. 53, 421–437. doi:10.2516/ogst:1998036
Li, M., Chen, Z., Ma, X., Cao, T., Qian, M., Jiang, Q., et al. (2019). Shale oil resource potential and oil mobility characteristics of the Eocene-Oligocene Shahejie Formation, Jiyang Super-Depression, Bohai Bay Basin of China. Int. J. Coal Geol. 204, 130–143. doi:10.1016/j.coal.2019.01.013
Li, M., Chen, Z., Ma, X., CaoLi, T. Z., and Jiang, Q. (2018). A numerical method for calculating total oil yield using a single routine Rock-Eval program: A case study of the Eocene Shahejie Formation in Dongying Depression, Bohai Bay Basin, China. Int. J. Coal Geol. 191, 191 49–65. doi:10.1016/j.coal.2018.03.004
Li, M., Chen, Z., Qian, M., Ma, X., Jiang, Q., Li, Z., et al. (2020). What are in pyrolysis S1 peak and what are missed? Petroleum compositional characteristics revealed from programed pyrolysis and implications for shale oil mobility and resource potential. Int. J. Coal Geol. 217, 103321. doi:10.1016/j.coal.2019.103321
Michael, G. E., Packwood, J., and Holba, A. (2013). “Determination of in-situ hydrocarbon volumes in liquid rich shale plays,” in Unconventional Resources Technology Conference (Denver, Colorado, USA, August. .
Modica, C. J., and Lapierre, S. G. (2012). Estimation of kerogen porosity in source rocks as a function of thermal transformation: Example from the Mowry Shale in the Powder River Basin of Wyoming. Am. Assoc. Petroleum Geol. Bull. 96, 87–108. doi:10.1306/04111110201
Ole, M. E. (2015). Reservoir characterization of the Duvernay Formation, Alberta: A pore-to basin-scale investigation. Vancouver: Ph.D thesis, University of British Columbia. .
Passey, Q. R., Bohacs, K. M., Esch, W. L., Klimentidis, R., and Sinha, S. (2010), “From Oil-Prone Source Rock to Gas-Producing Shale Reservoir – Geologic and Petrophysical Characterization of Unconventional Shale-Gas Reservoirs” in International Oil and Gas Conference and Exhibition, Beijing, China, June, 2010. 131350.
Penner, S, S. (1952). On the kinetics of evaporation. J. Phys. Chem. 56 (4), 475–479. doi:10.1021/j150496a015
Sandvik, E. I., Young, W. A., and Curry, D. J. (1992). Expulsion from hydrocarbon sources: The role of organic absorption. Org. Geochem. 19, 77–87. doi:10.1016/0146-6380(92)90028-V
Sondergeld, C. H., Newsham, K. E., Comisky, J. T., Rice, M. C., and Rai, C. S. (2010). “Petrophysical considerations in evaluating and producing shale gas resources,” in Proceedings of the SPE Unconventional Gas Conference, Pittsburgh, Pennsylvania, USA, 23–25th February 2010, 1–34.Society of petroleum engineers.
Stasiuk, L. D., and Fowler, M. G. (2004). Organic facies in Devonian and Mississippian strata of Western Canada Sedimentary Basin; Relation to kerogen type, paleoenvironment, and paleogeography. Bull. Can. Petroleum Geol. 52 (3), 234–255. doi:10.2113/52.3.234
Stasiuk, L. D., and Fowler, M. G. (2002). Thermal maturity evaluation (vitrinite and vitrinite reflectance equivalent) of Middle Devonian, Upper Devonian, and Mississippian strata in the Western Canada Sedimentary Basin. Ottawa: Geological Survey of Canada. Open File 4341 (CD-ROM).
Stoakes, F. A., and Creaney, S. (1985). “Controls on the accumulation and subsequent maturation and migration history of a carbonate source rock,” in Society of Economic Paleontologists and Mineralogists, Core Workshop Proceedings, Golden, Colorado, U.S.A., August 1985.
Stoakes, F. A., and Creaney, S. (1984). “Sedimentology of a carbonate source rock: Duvernay Formation of central Alberta,” Proceedings of the 1984 Canadian Society of Petroleum Geologists Core Conference. Calgary. in Carbonates in subsurface and outcrop. Editor L. Eliuk, 132–147.
Switzer, S. B., Holland, W. G., Christie, D. S., Graf, G. C., Hedinger, A. S., McAuley, R. J., et al. (1994). “Devonian Woodbend-Winterburn Strata of the Western Canada Sedimentary Basin,” in Geological atlas of the Western Canada Sedimentary Basin (Calgary: Canadian Society of Petroleum Geologists and Alberta Research Council). URLlast accessed online Available at: August 21, 2014).
Whitson, C. H., and Sunjerga, S. (2012). PVT in Liquid-Rich Shale Reservoirs, SPE-155499-MS. SPE Annual Technical Conference and Exhibition, 8-10. San Antonio, Texas, USA.
Zhang, P., Hu, L., Meegoda, J. N., and Gao, S., (2015). Micro/Nano-pore Network Analysis of Gas Flow in Shale Matrix, Sci. Rep. 5:13501. doi:10.1038/srep13501
Keywords: oil compositional grouping, oil mobility, evaporative kinetics, evaporative loss, Duvernay shale
Citation: Chen Z, Jiang C, Reyes J, Liu X and Little E (2023) A method for evaluating resource potential and oil mobility in liquid-rich shale plays—An example from upper Devonian Duvernay formation of the Western Canada Sedimentary Basin. Front. Earth Sci. 11:1094434. doi: 10.3389/feart.2023.1094434
Received: 10 November 2022; Accepted: 16 January 2023;
Published: 15 February 2023.
Edited by:
Senhu Lin, Research Institute of Petroleum Exploration and Development (RIPED), ChinaReviewed by:
Yanyan Chen, Research Institute of Petroleum Exploration and Development (RIPED), ChinaCopyright © 2023 His Majesty the King in Right of Canada. This is an open-access article distributed under the terms of the Creative Commons Attribution License (CC BY). The use, distribution or reproduction in other forums is permitted, provided the original author(s) and the copyright owner(s) are credited and that the original publication in this journal is cited, in accordance with accepted academic practice. No use, distribution or reproduction is permitted which does not comply with these terms.
*Correspondence: Zhuoheng Chen, emh1b2hlbmcuY2hlbkBucmNhbi1ybmNhbi5nYy5jYQ==
Disclaimer: All claims expressed in this article are solely those of the authors and do not necessarily represent those of their affiliated organizations, or those of the publisher, the editors and the reviewers. Any product that may be evaluated in this article or claim that may be made by its manufacturer is not guaranteed or endorsed by the publisher.
Research integrity at Frontiers
Learn more about the work of our research integrity team to safeguard the quality of each article we publish.