 Jin Li
 Haikun Jiang4
94% of researchers rate our articles as excellent or good
Learn more about the work of our research integrity team to safeguard the quality of each article we publish.
Find out more
ORIGINAL RESEARCH article
Front. Earth Sci. , 03 March 2023
Sec. Solid Earth Geophysics
Volume 11 - 2023 | https://doi.org/10.3389/feart.2023.1094151
This article is part of the Research Topic Pre-, Co-, and Post-Seismic Processes of Recent Earthquakes in Mainland China View all 9 articles
The quality factor value (Q) of the crustal medium, which can describe the anelasticity within the Earth’s interior, is a sensitive indicator of changes in the crystalline structure induced by temperature and phase transformations. Although the velocity structure of the Tianshan region in Central Asia has been extensively studied, studies regarding its Q values are limited. These studies focus mainly on the crustal attenuation structure of the Tianshan region; however, their results are limited to the qualitative analyses of the local areas or averages over large areas. Therefore, in this study, we conducted seismic attenuation tomography to create a Q map of the crust underneath the Tianshan tectonic belt (TTB) at a resolution of 0.8° × 0.8° using data from 24,273 near-source waveforms recorded by 51 observation stations of the Xinjiang regional seismic network from 2009 to 2020. The regional distribution of the static and sliding-average values (QS) was calculated. The average value (Q0) of TTB was approximately 523. Additionally, Qs exhibited considerable lateral variations that strongly correlate with the surface tectonics of the TTB region. Furthermore, the velocity and attenuation structures of the TTB were positively correlated. The main part of the TTB exhibited high velocities and Q (indicating low attenuation), whereas the areas adjoining the Tarim and Junggar basins (at the South and North of the TBB, respectively) and their margins exhibited low velocities and Q (indicating high attenuation). This suggested that the attenuation structure of the TTB was highly consistent with its velocity and density structures. Since 1900, most earthquakes in the TTB having magnitudes ≥6.0 earthquakes have occurred at the junctions of high- and low-Q-value areas, or in areas with low Q values. According to the Qs values in different periods, the average Qs of the entire TTB only varied between 500 and 540. However, the average Qs in the middle TTB region portrays an upward trended over time (from 494 in 2010 to 554 in 2020). The average Qs of the southwestern TTB region has been relatively stable, varying between 490 and 530. The Q0 of the southwestern TTB region was lower than that observed in the middle TTB region in most of the time. This observation is more consistent with the tectonic activity recorded in the southwestern TTB region (with greater intensity) than that observed in the middle Tianshan. In addition, the number of earthquakes with magnitudes ≥4.0 correlated positively with the regional average Qs in the middle and southwestern Tianshan. Notably, the higher the regional average Q value, the larger the number of moderate earthquakes. This correlation suggests that in earthquake-prone regions, the accumulation and release of stress influence the opening or closure of crustal fractures, resulting in noticeable changes in the Q values. The findings of our study provide novel insights into the mechanisms of earthquakes and their correlation with the structure of the Earth’s crust.
The attenuation of seismic waves in the Earth’s crust is caused by geometric diffusion and crustal anelasticity (Liu et al., 2004a), which, in the lithosphere, is generally expressed by the rock quality factor value (Q) (Liu et al., 2004b; Wang et al., 2007; Hao et al., 2009). The characteristics of the crustal attenuation structure are closely related to the structural characteristics of the crust, e.g., the intensity of tectonic movements, distribution of active structures, velocity structure of the crust, thickness of the sedimentary layer, and properties of the crustal medium (Pei et al., 2006; Pei et al., 2008; Wang et al., 2007; Ma et al., 2007; Sun et al., 2012). For example, regions with intense tectonic activity are associated with a low Q value since seismic waves are considerably attenuated by fluids that fill fractured rocks and voids. Meanwhile, regions with stable crustal medium are generally associated with high Q values, as the seismic waves only lose a small amount of energy when propagating through these rocks (Walsh, 1966; Tapponnier and Molnar, 1979; Mitchell, 1995; Mitchell et al., 1997; Hu et al., 2003; Pei et al., 2010). Compared with the velocities of seismic waves, the Q value is more sensitive to changes in the structure of the lithosphere and its properties (Wang et al., 2007). For instance, the lateral variations in Q within the crust and upper mantle may exceed 100%, whereas those in velocity typically do not exceed 10% (Romanowicz, 1990; Romanowicz, 1994). Therefore, studies on the variations in the Q values within regional crustal media can provide insights into its structural characteristics and properties. Theoretically, Q can be expressed as a function of three-dimensional (3D) spatial coordinates. However, as Q is affected by the 3D velocity structure, errors in the velocity structure can be transferred to Q, resulting in inaccurate 3D Q-tomography (Su, 2009; Ye et al., 2018; Hu, 2020). In general, two-dimensional (2D) Q-tomography is performed by calculating the weighted average of the Q values in various depths; therefore, the results of this method can accurately reflect the lateral variations in Q. Indeed, recent studies that use 2D Q-tomography to investigate the lateral variations in crustal attenuation structure have provided several novel insights (Pei et al., 2006; Pei et al., 2008; Pei et al., 2010; Wang et al., 2007; Sun et al., 2012).
Studies on the crustal attenuation structure underneath the Tianshan tectonic belt (TTB) region in Central Asia have been hampered by the relatively slow development of a seismic network in Xinjiang Province, China. Our limited understanding of the crustal attenuation structure underneath the TTB is predominantly derived from the qualitative analyses of local areas, or the results averaged over large areas. Non-etheless, the western section of Tianshan is associated with a low Q value (high attenuation), whereas the eastern section is associated with a high Q value (low attenuation). The western and eastern sections of the Tarim Basin exhibit low and high seismic attenuations, respectively (Wang et al., 2008). Previous studies have calculated the average Q values of the local areas within the Tianshan region. For example, Jiang et al. (2007) obtained a Q0 value of 344 for the northern Tianshan region, whereas Liu and Li. (2014) reported 465 for the same region. Zhao et al. (2011) calculated a Q0 value of 460 for the middle Tianshan region, while Li et al. (2010) reported 213 for the southwestern Tianshan region, using Atkinson’s method (Atkinson and Mereu, 1992). The development of the Xinjiang regional seismic network has increased the number of digital seismic stations in the Tianshan region. Owing to the frequent seismic activity in Xinjiang (approximately 40% of the earthquakes in China occur in this province), these stations provide sufficient data for studying the crustal attenuation structure of the Tianshan region. In this study, we performed Q tomography for the Tianshan region, through the tomographic inversion of the high-frequency attenuation operator, t* (Zhou et al., 2009). By analyzing the spatiotemporal variation in the Q values in the TTB, we could elucidate the correlation between the structural characteristics and deep dynamics of the TTB and those of its adjacent blocks.
The TTB is 2,500 km in length, approximately two-thirds of which is located in the Chinese province of Xinjiang (Figure 1). The TTB also borders the Tarim and Junggar basins, at the south and north, respectively. During the Paleozoic era, the TTB experienced supercontinental rifting, the breakup of the North and South Tianshan oceans, continuous expansion of the ocean basin and continental block, subduction and subsidence of the oceanic crust, and plate collision-suture (Liu et al., 2011). During the early Cenozoic period, the convergence between the Indian and Eurasian plates was accommodated by crustal shortening at the Tibetan Plateau and Tianshan region and the eastward extrusion of the eastern Tibetan Plateau (Molnar and Tapponnier, 1975; Molnar and Tapponnier, 1978; Tapponnier and Molnar, 1977; Tapponnier and Molnar, 1979; Molnar and Lyon-Caen, 1989; Zhang et al., 1996; Shu et al., 2004; Zhao et al., 2021). Owing to intense crustal shortening, extrusion deformation, and tectonic upliftment, the TTB is the most active intracontinental orogenic belt in mainland China (Feng, 1985; Deng et al., 1991). These tectonic movements cause frequent earthquakes of high magnitude in the TTB region. Indeed, since the beginning of the 20th century, 11 earthquakes of magnitudes ≥7 have occurred in the TTB, the strongest of which was the Artux earthquake in 1902 (magnitude of 8¼). Since the turn of the century, 15 earthquakes of magnitudes ≥6 have occurred in the TTB. Based on global navigation satellite system data, rapid crustal shortening in the S–N direction is the defining characteristic of present-day tectonic activity in the TTB (Abdrakhmatov et al., 1996; Larson et al., 1999; Wang et al., 2000; Larson et al., 2003; Zhang et al., 2003). The rate of this S-N trending convergence gradually increases from East to West, along the TTB, with extrusion and shortening deformations primarily occurring in the areas adjoining the basins to the South and North. Therefore, the TTB has an uneven distribution of surface deformation (Wang et al., 2000; Reigber et al., 2001).
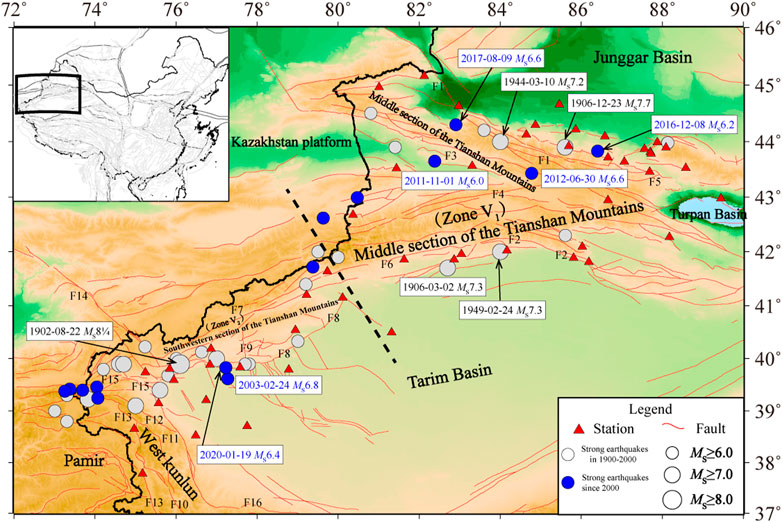
FIGURE 1. Map illustrating the Tianshan tectonic belt (TTB) and its adjacent tectonic units, along with the geographical distributions of the historical earthquakes and seismic observation stations in the region. The earthquakes having Ms ≥ 6.5 that occurred between 1900 and 2000 are indicated by gray circles, while the earthquakes of Ms ≥ 6.0 that occurred after 2000 are indicated by blue circles. The dotted line represents the border between the middle and southwestern TTB. F1: Borohoro‒Aqikekuduke fault; F2: Beiluntai fault; F3: Northern Ili Basin margin (Kashi River) fault; F4: Nalati fault; F5: Yilianhabierga fault; F6: Kumugeremu fault; F7: Maidan‒Shayilamu fault; F8: Kalpintag fault; F9: Piqiang fault; F10: Kangxiwa fault; F11: Kongur fault; F12: Oytak fault; F13: Karakoram fault; F14: Talas‒Fergana fault; F15: Kazkeaerte fault; F16: Tiklik fault.
Unique tectonic movements and frequent strong earthquakes have highlighted the importance of the TTB as an ideal location for promoting global studies on continental dynamics (Tapponnier and Molnar, 1977; Avouac et al., 1993; Roecker et al., 1993; Shu et al., 2004; Jolivet et al., 2010; Johnston et al., 2012; Liu et al., 2012; Deev and Korzhenkov, 2016; Cai et al., 2019). In recent years, several studies have been conducted on the TTB, which created a basic sketch of the TTB’s general tectonic framework. The crustal structure of the TTB, obtained by inverting artificial seismic reflection profiles, demonstrates that the Tarim Basin subducts northward under the TTB and that the Junggar Basin in the north experiences a strike-slip contact with the TTB (Lu et al., 2000; Gao et al., 2002; Xiao et al., 2004; Guo et al., 2006). As the basins to the South and North of TTB consist of rigid blocks, with an intact lithospheric structure, they exhibit high seismic wave velocities. In contrast, the TTB is a fragmented block that portrays low velocities (Zhao et al., 2021), while the crust-mantle structure in the TTB is complex and its unique tectonic movements have resulted in lateral non-uniformities in its medium properties and structural tectonics (Liu et al., 2011). Using dense array data, several studies have inverted the fine S- and P-wave velocity structures in the crust and upper mantle across the TTB and revealed significant deformation in the S–N direction, rock bodies with marked low S-wave velocity, and an arrangement of bodies with alternating high and low velocities in the crust beneath the TTB (Shao et al., 1996; Guo et al., 2006; Li et al., 2007; Xiong et al., 2011). Furthermore, the lithosphere under the TTB is relatively thin, which may be related to processes, such as continental collision-suture and delamination, along with the upliftment of the orogenic belt and subsidence of Moho (Schubert et al., 2001; Kumar et al., 2005; Liu, and Guo et al., 2007).
However, several of the abovementioned studies present inconclusive, or even contradictory, findings. The Q value is closely related to the structural characteristics of the crust, such as the distribution of faults in tectonically active regions, intensity of tectonic movement, distribution of magma in volcanic regions, and intracrustal low-velocity layers (Ma et al., 2007). Q-tomography can provide novel insights into the crustal structure of the TTB and help resolve the ambiguities in the current literature.
Digital seismic waveforms contain information about seismic hypocenters, seismic-wave propagation paths, and the site response of seismic stations. The factors responsible for the attenuation of seismic energy along its path of propagation include geometric attenuation and medium anelasticity (Liu et al., 2003; Zhou et al., 2009; Wang et al., 2012a; Wang et al., 2012b; Wang et al., 2016; Li et al., 2017).
In the frequency domain, the amplitude spectrum of the ith seismic event observed at the jth station,
where f is the frequency, Si(f) is the seismic source spectrum, Ij(f) is the instrument response function, Rj(f) is the site response, used to characterize the amplification of seismic waves by the surface stratum near the station, Gij(r) is the geometric diffusion term, and Bij(f) is the attenuation spectrum.
The source spectra were analyzed using the ω2 source model (Brune, 1970), in which the source spectra were described using the low-frequency asymptote (
In the geometric attenuation model, the coefficients b1, b2, and b3 are frequency independent. When r≤R01, the corresponding direct wave geometric attenuation. When R01<r≤R02, it corresponds to the transition zone. Within the range of this source distance, the reflection wave on the discontinuity and Moho in the crust is added to the direct wave. When r>R02, it corresponds to the attenuation of the S wave reflected by multiple refractions.
The attenuation spectrum along the entire ray path,
where tij is the travel time along the ray path, Qij is the dimensionless quality factor, and
As the seismic stations selected for this study were from Xinjiang regional seismological network, all set up on bedrock, their site responses were assumed to be 1 (Zhou et al., 2009); the instrument response was removed directly, using the stations’ parameters. Under this condition, the amplitude spectrum can be expressed as
The
where v is the S-wave velocity and ds is the unit ray path.
Equation 4 contains three unknown variables, namely,
The waveform data used in this study were obtained from 51 digital seismic stations in the TTB (Figure 2). First, we applied bandpass filtering and mean removing to the two horizontal components of the seismic waveforms and selected the S-wave and noise windows; the period containing 90% of the S-wave energy was selected as the S-wave window (Su, 2009). At near-source distances, the S-wave window only contains the direct S-wave. At longer epicentral distances, the S-wave window contains the waves reflecting off the intracrustal and Moho discontinuities. At very long distances, the S-wave window contains the Sn and Lg phases. The length of the S-wave window is directly proportional to the epicentral distance [or the arrival time difference (ATD)]. In other words, the length of the S-wave window increases with the epicentral distance (or ATD) (Li et al., 2010; Zhao et al., 2011; Liu, and Li, 2014). We manually recorded the “S wave window” of 721 original waveforms (Figure 3), and then fitted the “S-wave window” to epicentral distance relationship with a linear fit of the form y = 1.06x + 22.6, where y is the S-wave window and x is the epicentral distance (Sg-Pg). The selection of the noise window was performed by considering the waveform records prior to the arrival of the P-wave. The time-domain waveform data were converted into frequency-domain amplitude spectra, using the fast Fourier transform. Since all the seismometers at the stations selected in this study were velocity meters, the velocity-amplitude spectra were also converted to displacement spectra. To eliminate the seismic data having low signal-to-noise ratios (SNR), we used only the seismic data having an SNR of >2 (i.e., with an amplitude at least twice that of the noise) observed by a minimum of four stations in our subsequent calculations.
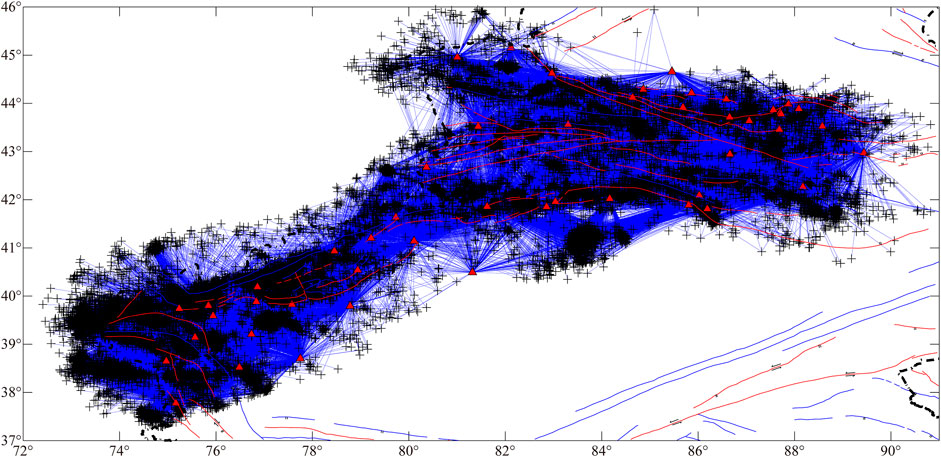
FIGURE 2. Distribution of seismic observation stations (red triangles), events (+), and rays in the Tianshan tectonic belt (TTB).
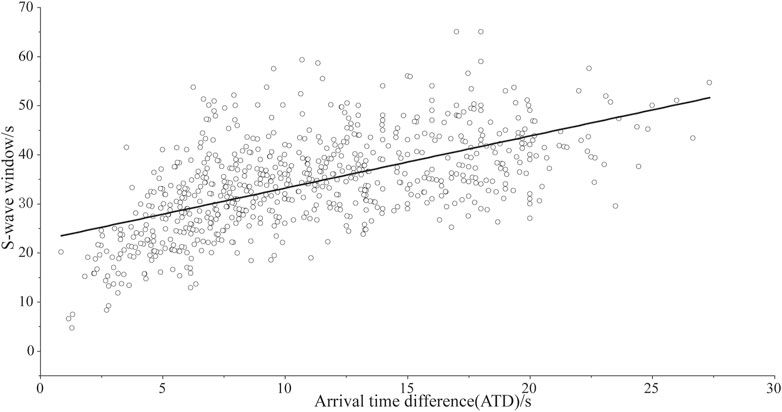
FIGURE 3. Graph showing the fitted relationship between the S-wave window and epicentral distance.
Suppose that an earthquake was recorded by n stations. As
In this study, we employed a genetic algorithm to invert the (n + 2) unknowns, to minimize the sum of the residuals between the observed and theoretical spectra at all the stations and frequency points (Liu et al., 2003). Based on the spectral inversion of noise- and geometry-corrected waveforms collected by multiple stations for the same seismic event, we could infer that the high-frequency attenuation of the displacement spectra was predominantly determined by the Q value of each path. Previous studies demonstrate that the high-frequency part of the noise spectrum has a high amplitude at frequencies above 15 Hz, which often decreases the SNR of displacement spectra to levels below the predetermined SNR criterion (Su et al., 2006). Therefore, the spectral inversions were constrained to 1–15 Hz (Zhou et al., 2009).
Notably, 2D Q-tomography may be viewed as the projection of a weighted average of Q values at different depths onto a plane. As a dominant focal depth will be present in any distribution of seismic events, the results of 2D Q-tomography correspond to the lateral distribution of the average crustal Q values above the dominant focal depth (Su, 2009; Ye et al., 2018).
In this study, for the static Q-tomography of the TTB, we used the observational data recorded by the Xinjiang regional seismic network from 2009 to 2020. During this period, a total of 24,273 locatable seismic events having magnitudes of 2.0–5.4 (ML 2.0–5.4) were recorded by 51 digital seismic stations in the Tianshan seismic zone (Figure 2). A total of 145,368 t* data records with high SNR were acquired through inversion, using the method described in the previous section. Previous studies have shown that the Q0 value of a region generally ranges from several tens to hundreds (Wang et al., 2012a), but may exceed 1,000 in rare cases (Mitchell et al., 1997; Baqer and Mitchell, 1998). Therefore, the data were first filtered by removing the t* data records having overly low values (specifically, a t* data record was removed when the epicentral distance/t* was greater than 4,000). If the intracrustal velocities within the TTB are uniform, the linear fitting of the travel time-epicentral distance graph (Figure 4A) will yield an average crustal S-wave velocity (
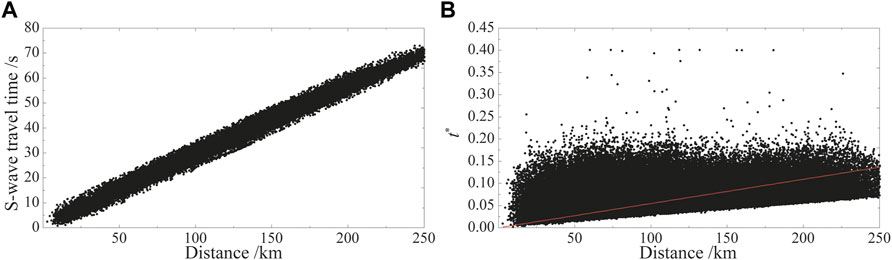
FIGURE 4. Linear fit of (A) arrival time difference (ATD) and (B) attenuation operator (t*) data to the epicentral distance.
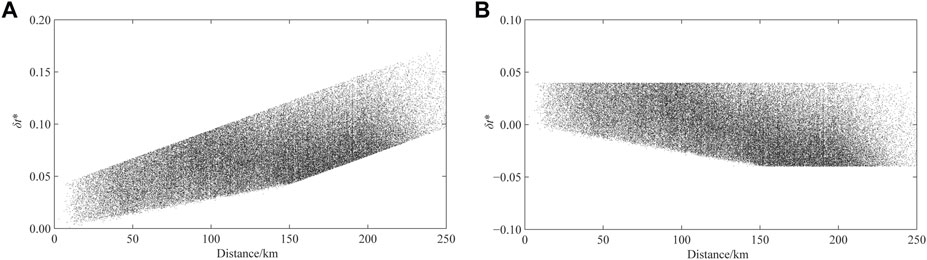
FIGURE 5. Variation in the residual with epicentral distance, (A) before and (B) after inversion.
To test the stability of the inversion results of Q0 value, 20% Gaussian noise, with a mean of 0 and variance of 1, was added to the original t* data (Pei et al., 2010), i.e., T* = t*× (1+20%gasdev) where t* is the original data, T* is the data after noise is added, and gasdev is a function with a mean value of 0 and a variance of one Gaussian distribution. The data with added noise were inverted using the same parameters as the actual inversion, and the error of Q0 value was obtained. For 50 times of noise synthesis data—inversion operation, the error result of Q0 value is not more than 14 (2.67% of the average Q0).
A checkerboard resolution test was performed, to determine whether the tomographic inversion for the 0.8° × 0.8° grids was reliable (Figure 6). As shown in Figures 2, 6, the TTB is densely covered with rays, and the resolution is high. False resolution only occurred in a few areas at the edges of the rays.
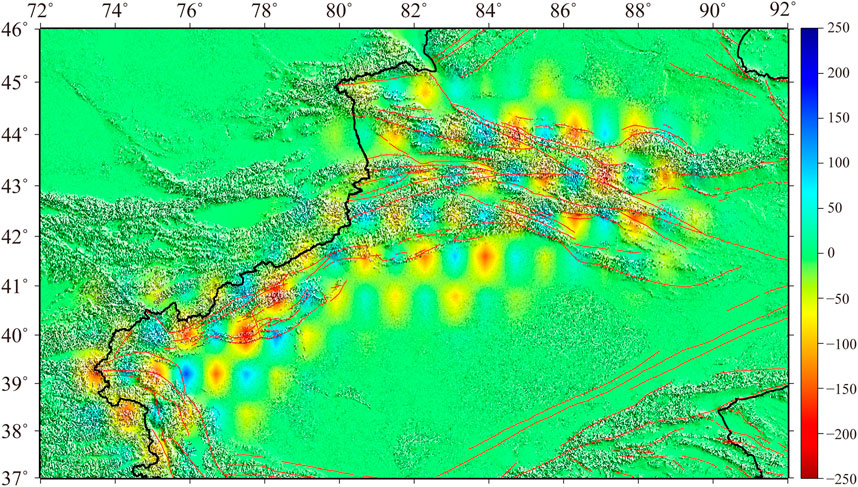
FIGURE 6. Results of the checkerboard resolution test.
Lateral variations in Q are associated with the thickness of the sedimentary layer, intensity of crustal movements, and nature of the medium (Sun et al., 2012). In this study, we performed Q-imaging of the Tianshan crust through attenuation tomography, at a resolution of 0.8° × 0.8°, using seismic data from January 2009 to December 2020 (Figure 7). The value of Qs ranged from 300 to 800, with an average Q0 value for the entire TTB of 523. This result is consistent with the average Q0 value (520) reported by Li et al. (2017) for the middle Tianshan region using the same method, but higher than the average Q0 value (460) for the middle Tianshan region reported by Zhao et al. (2011).
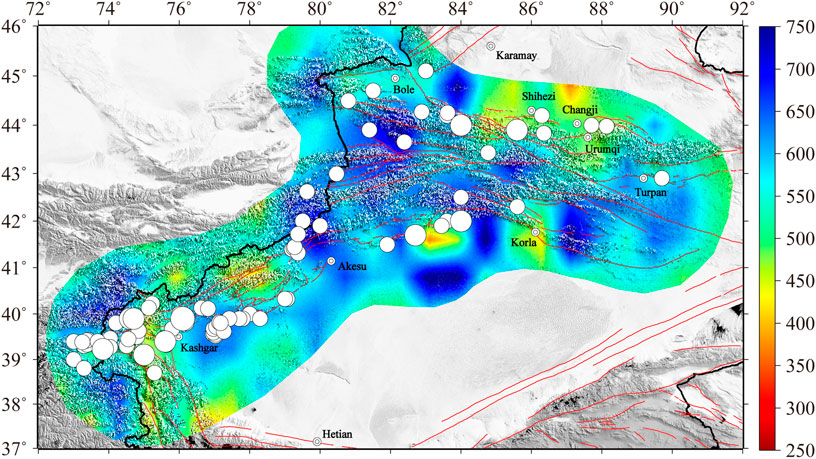
FIGURE 7. Distribution of S-wave-derived Q values for the Tianshan tectonic belt (TTB) in 2009–2020. White circles indicate the epicenters of earthquakes of magnitudes ≥6.0 that occurred after 1900.
The crustal Q values of the TTB region exhibited significant lateral variations (Figure 7). The distribution of these Q values and the corresponding variations in crustal attenuation were strongly associated with surface tectonics in this region. The main area of the TTB exhibited high Q values, whereas the parts adjacent to the basins in the south and north and the basin margins were characterized by low Q values, which was in line with the results obtained for other regions of China (Wang et al., 2008; Sun et al., 2012). For example, the regions having thick sedimentary layers, such as the North China Plain, Songliao Basin, and Hailar Plain, are associated with low Q0 values (high attenuation), whereas regions, such as the Yanshan, Taihang, and Xingmeng fold belts, exhibited high Q0 values (low attenuation), due to the presence of thin sedimentary layers or bedrock outcrops (Sun et al., 2012).
The area in the middle Tianshan region, between the Borohoro (F1) and the Beiluntai (F2) faults (termed zone V1 in this study) (Figure 1), constituted the main area of the TTB and had high Q values (650–750). The areas having low Q values (generally below 550) were primarily located adjacent to basins on the southern and northern sides of the TTB. In these areas, the medium gradually transitions from hard mountainous rock to soft sedimentary layers. Interestingly, a unique distribution of Q values was observed (Figure 7) in southwestern TTB (termed zone V2 in this study) (Figure 1). Specifically, there was a considerable difference in the Q values of the eastern and western sides of the Piqiang fault (F9), wherein the stations recorded low and high Q values in the eastern and western sides of the fault, respectively. The F9 fault portrayed a near S–N strike and was approximately perpendicular to the thrust nappe tectonic system of Kalpin, which separated it into eastern and western sections. Studies have shown that the eastern and western sides of the Kalpin thrust nappe tectonic system have tremendously different deformation rates; as the nappes in the western section generally exhibit higher slip rates than those in the eastern section. Furthermore, the difference in the slip rates increases with the proximity to the front (Ran et al., 2006; Yang et al., 2006; Li et al., 2016). Yang et al. (2008) have proposed that the F9 fault is a deep and large fault running through the base of the Tarim Basin, and that the Tarim Basin separates into two rock sheets in front of the southwestern TTB, subducting below the Tianshan Mountains. These factors lead to significantly more frequent and stronger earthquakes on the west side of the F9 fault, compared with its east side (Tang et al., 2013), resulting in a disparity in the Q values between its eastern and western sides. In addition, markedly low Q values were observed near the Pamir knot, which is known for extremely strong tectonic movements.
The low Q values partly reflect the intensity of tectonic activity in these areas. These low-Q areas of the TTB resemble the Himalayan fold belt on the southern margin of the Tibetan Plateau and the Yunnan–Tibet fold zone, in terms of their tectonic characteristics. Due to the collision and extrusion between the Indian and Eurasian plates, these areas experience intense tectonic activity, as well as continuous crustal thickening and plateau uplifting, which makes them susceptible to strong earthquakes (Cong et al., 2002). Conversely, tectonically stable regions are often associated with high Q values. For example, the Q values of the Siberian Platform (Mitchell et al., 1997) and the eastern United States of America (Baqer and Mitchell, 1998) can be >1,000.
Although the drivers of the lateral Q variations in the TTB require further investigation, it is generally believed that Q is closely related to the fractures in the medium and their degree of fluid filling. Tectonically active regions are associated with very low Q values because the medium is fragmented and contains a large number of fractures (Hu et al., 2003; Ma et al., 2007; Qiu et al., 2021). At high crustal fracture densities, fluids can flow freely into and through the fractures, thereby attenuating seismic waves (Mitchell, 1995).
Most of earthquakes with magnitudes ≥6.0 that have occurred in the TTB since 1900 are located in the transition zones between the high- and low-Q areas, or in the low-Q areas (Figure 7), e.g., the Pamir syntaxis that has a high density of earthquakes having magnitudes ≥6.0. Generally, it is believed that energy does not easily accumulate within a homogeneous crustal medium. As transition zones between high- and low-Q areas are areas of convergence between “soft” and “hard” materials, they can facilitate the accumulation of strain energy, resulting in earthquakes (Wang et al., 2012a; Ye et al., 2018). In addition, the area west of the F9 fault consisted of a junction between three tectonic systems, namely, the Tarim Basin and the Tianshan and West Kunlun Mountains; this area had a substantially higher Q value than that of the areas to its east and west. Notably, more than 10 strong earthquakes (magnitude ≥6) had occurred in this area during 1997–2003, collectively known as the Jiashi strong earthquake swarm (Zhao et al., 2008). Such earthquake swarms are rare in mainland China and the rest of the world V2. Most low-Q areas in the TTB are tectonically active.
To analyze the spatiotemporal variations in the Q values in the TTB in greater detail, the seismic data for the study area were divided into six 2-year periods (2009-2010, 2011-2012, 2013-2014, 2015-2016, 2017-2018, and 2019-2020). The calculation for each period involved 10,500–16,000 t* records, and there were 160–260 rays in each cell (Table 1). The average Q0 value of the TTB in each period ranged from 500 to 540, which was comparable to the average Q0 value (523) for the entire study period (2009–2020). In addition, the method of adding Gaussian noise to t* data was used to obtain the errors of Q0 values at different time periods (Table 1).
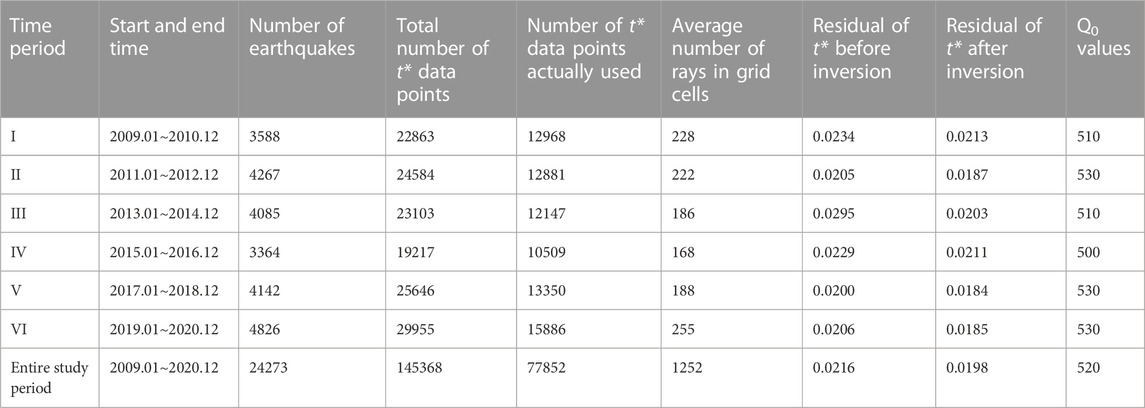
TABLE 1. Data statistics for the six two-year periods (between 2009 and 2020) considered in this study.
Figures 8A–F illustrate the lateral Qs variations in the TTB for each time period, indicated by a red–blue gradient; red indicates the areas having Qs values below the mean Q0 value (high attenuation), whereas blue indicates the areas having Qs values above the mean Q0 value. For comparison, the Q0 values for the abovementioned periods were used to calculate the lateral variation based on an average value of 523. The overall distribution of Q in the TTB did not significantly vary from one period to another. The high-Q-value areas were located primarily in the main TTB area, whereas the low-Q-value areas were predominantly located in the areas adjacent to the basins located to the South and North of the TTB, as well as those near the Pamir syntaxis in Zone V2 and the area east of the F9 fault. These results also proved the stability of the tomography results, as the period-wise tomographic inversions were generally consistent with the tomographic inversion for the entire study period. Notably, on the outer edges of the rays, the smearing effect resulted in a false resolution and potentially inaccurate Q values at the margins of the study area (He et al., 2017). Therefore, the Q values in these margins are not discussed further.
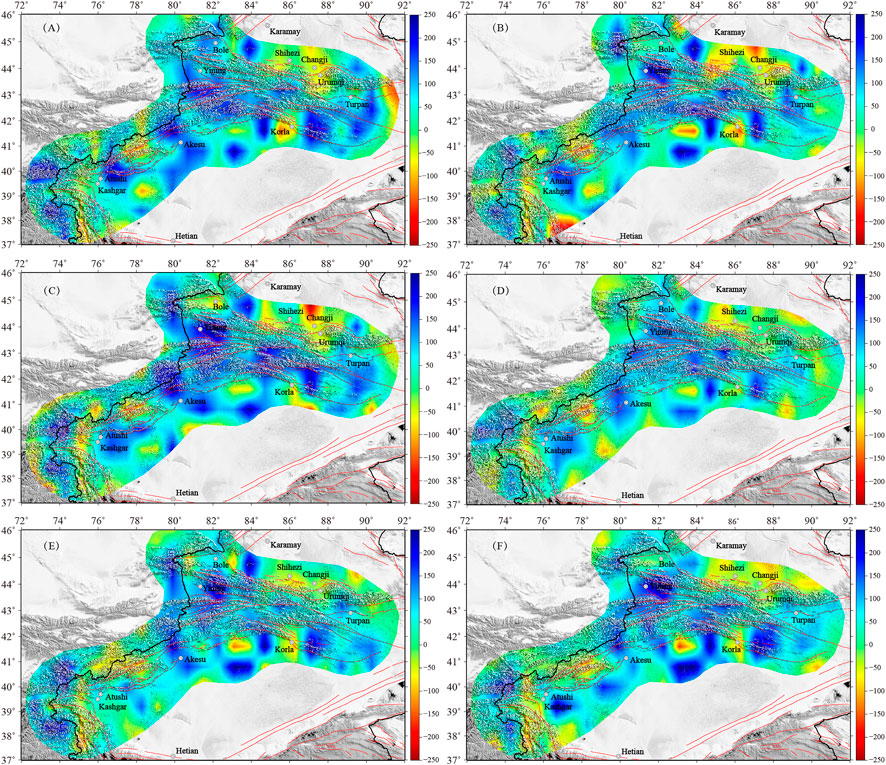
FIGURE 8. Temporal variations in the S-wave-derived Q values of the Tianshan tectonic belt (TTB) for the six 2-year periods considered in this study. (A) 2009-2010, (B) 2011–2012, (C) 2013–2014, (D) 2015–2016, (E) 2017–2018, and (F) 2019–2020.
Previous studies reported a positive correlation between seismicity and the regional average Q value (Pei et al., 2010; Wang et al., 2016). As the TTB exhibits significant lateral variations in Q, during the analysis it is often divided along the Kashgar–Aksu and Baicheng–Kuqa thrust systems to form two zones, namely, V1 (middle Tianshan) and V2 (southwestern Tianshan), which have distinct tectonic and seismic characteristics (Figure 1) (Yin et al., 1998; Chen et al., 2001). This zonation has been used in many previous studies (Yang et al., 2008; Gao et al., 2010; Qu et al., 2010; Wang et al., 2011). The temporal variation in the regional average Q of these zones is shown in Figure 9. The average Q value in zone V1 (red curve) ranged from 490 to 560, showing an upward trend since 2009 (except for the 2011-2012 period). Conversely, the average Q value (blue curve) in zone V2 was relatively stable, in the range of 490–530 for most of the study period. In addition, the average Q value in zone V1 was higher than that of zone V2 during most time periods (except for 2009-2010). The regions with intense tectonic activity and frequent strong earthquakes were characterized by low Q values (Hearn et al., 1991; Wang et al., 2007; Hearn et al., 2008; Wang et al., 2008; Wang et al., 2016; Ma et al., 2007; Pei et al., 2010). Haydar et al. (1990) have indicated that the active fault areas in the New Madrid seismic zone and its surrounding areas exhibited low Q values and strong seismic-wave attenuation, whereas the tectonically stable areas were associated with high Q values and weak attenuation. Our findings are in agreement with the results of Haydar et al. (1990); zone V2 portrayed lower Q values than zone V1, and the tectonic activity in zone V2 was also more intense than that in zone V1.
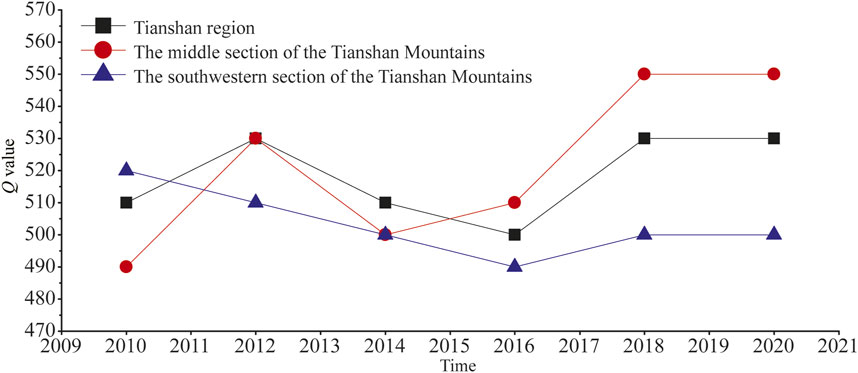
FIGURE 9. Temporal variations in the regional average Q values in the Tianshan tectonic belt (TTB), middle Tianshan (zone V1), and southwestern Tianshan (zone V2) regions.
Regions with high stress accumulation are typically associated with frequent and intense seismic activities (Wan et al., 2009; Yi et al., 2013). Destabilization in a rock body occurs when the differential stress on a fault exceeds the rock fracture strength, resulting in an earthquake. Therefore, an increase in stress release often manifests as an increase in the seismic activity and earthquake frequency (Pei et al., 2010). Several studies have shown that the variations in the regional Q value tend to be strongly correlated with the local seismicity. In the Sichuan-Yunnan region, temporal variations in the regional average Q correlate significantly and positively with the number of earthquakes with magnitudes ≥4.5 that occurred during the corresponding period (Pei et al., 2010). In Hainan Island and its adjacent areas, the increase and decrease in the moving average Qs values generally coincide with the increase and decrease in the local earthquake frequency (Wang et al., 2016). Laboratory studies (Toksoz et al., 1979; Winkler and Nur, 1979) have shown that the Q value of a rock increases with its stress level, regardless of whether the rock is dry, or completely or partially saturated with water. Furthermore, Pei et al. (2010) noted that an increase in rock stress decreased the number of fractures, which in turn decreased the attenuation of seismic waves. In other words, the increase in seismic activity, accompanied by an increase in Q values, are external manifestations of stress accumulation.
Based on the abovementioned results, we tallied the numbers of moderate and strong earthquakes in zones V1 and V2 over the six 2-year time periods (Table 2). There was a strong positive correlation between the regional average Q and the number of earthquakes having magnitudes ≥4.0, in each zone and period (Figure 10). This result was consistent with the findings for the Sichuan–Yunnan region (Pei et al., 2010) and Hainan Island (Wang et al., 2016), where an increase in the Q value was generally accompanied by an increase in the number of earthquakes. However, the causal relationship between the Q value and the number of earthquakes remains ambiguous, because no existing studies could determine whether the increase in the earthquake frequency was caused by an increases in the Q value, or vice versa. In regions where moderate–strong earthquakes are frequent (e.g., the Sichuan–Yunnan region), some scholars are of the opinion that the former (increases in the Q value increase the earthquake frequency) is a better fit for their observations (Pei et al., 2010). That is, the pre-earthquake increase in stress can induce expansions in the rock volume (Scholz, 2002), resulting in the initiation, growth, and propagation of microcracks, until the rock is fractured and changes the regional Q value.
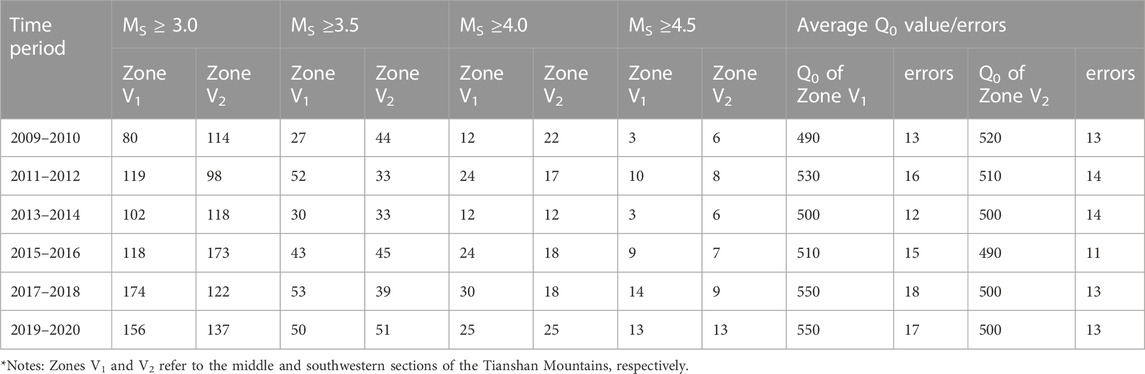
TABLE 2. Earthquake numbers and Q0 values observed in the middle and southwestern regions of the Tianshan Mountains.
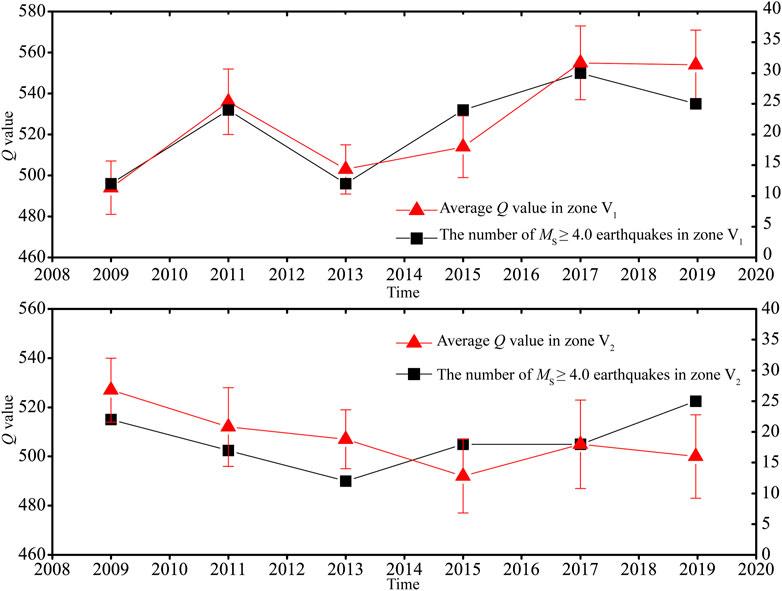
FIGURE 10. Correlation between average Q values and the number of earthquakes in the Tianshan tectonic belt (TTB) over the study period.
In this study, we performed high-resolution (0.8°×0.8°) Q-tomography for the crust beneath the TTB, via attenuation tomography, using 24,273 near-source waveforms collected from 51 digital seismic stations in the Xinjiang regional seismic network from 2009 to 2020. A high-resolution crustal attenuation model of the TTB was thus, obtained. The major conclusions of this study are explained below.
(1) For the TTB, we observed QS values between 300 and 800, with an average Q0 value of 523. The QS value exhibited significant lateral variation, and the distribution of QS (and the crustal attenuation structures represented by this distribution) correlated strongly with the TTB’s surface tectonics. The main region of the TTB portrayed high Q values (650–750), whereas the areas adjacent to the basins to the south and north and the basin margins exhibited low QS values (<550). These trends reflected the transition from the mountainous regions to the plains and basins, along with the gradual thickening of the sedimentary strata.
The crustal medium in the TTB is associated with high S-wave velocities; however, the Tarim, Junggar, and Turpan Basins are characterized by low wave velocities, as they are covered by thick sedimentary layers (Guo et al., 2010; Tang et al., 2011; Cai et al., 2019; Kong et al., 2021). Low-velocity bodies were observed in many parts of the TTB’s middle and upper crust, being predominantly located in the block intersections and mountain-basin transition zones on either side of the Tianshan Mountains (Li et al., 2007). The 3D velocity structure of the crust in the middle Tianshan region revealed a high-velocity zone in the shallow strata and a low-velocity zone in the region close to the Junggar Basin (Zhang et al., 2021). These studies indicated that within the TTB, velocity structures portray a positively correlation with the attenuation structures. The main area of the TTB exhibited high velocities and Q values (low attenuation), whereas the areas adjacent to the basins and the basin margins exhibited low velocities and Q values (high attenuation). This confirmed that 2D attenuation structures were generally consistent with the velocity and 2D density structures (Burtman and Molnar, 1993). Notably, the lateral heterogeneities in the TTB’s attenuation structure were mainly caused by the heterogeneities in the crustal medium. In addition, according to the deep structure reported by Xu et al. (2000) for the TTB, an intracrustal low-velocity zone that extends in the NNE direction is present between the southern Tianshan region, Pamir Mountains, and Tarim Basin. This low-velocity zone is flanked by Bachu and Makit (a high-velocity zone) to the east, and Pamir and southern Tianshan to the west. These results generally agree with the distribution of the Qs values obtained to determine the crustal attenuation structure of southwestern Tianshan for study period (2009–2020) (Figure 7).
(2) Most earthquakes in the TTB of magnitudes ≥6.0 since 1900 (Figure 7) occurred in the transition zones between the high- and low-Q transition zones, or in the low-Q areas. This phenomenon was consistent with the previous observations of the Sichuan–Yunnan region (Pei et al., 2010). Similar phenomena have also been reported in other regions within and outside China (Hansen et al., 2004; Wang et al., 2007; Zhang et al., 2009; Wang et al., 2012a; Qiu et al., 2021). Pei et al. (2010) hypothesize that earthquakes occur most likely in transition zones since the maximum change in the differential stress in rocks occurs in such areas. It has also been proposed that these transition zones tend to accumulate strain (which induces earthquakes) because they are areas where “soft” and “hard” crustal media converge (Wang et al., 2012a).
Previous studies also suggested that strong earthquakes at the junctions between basins and mountains predominantly occur in high-velocity zones in the middle or lower crust, or in the vicinity of areas with large velocity gradients (Zhao et al., 1996; Xu et al., 2000; Zhao et al., 2002; Mukhopadhyay et al., 2006; Wang et al., 2007; Zheng et al., 2007). Based on the results obtained from different regions, heterogeneity in the crustal medium is a prerequisite for strong earthquakes. Our study results are in agreement with these findings, as most earthquakes of magnitudes ≥6.0 (Figure 7) occurred in transition zones between areas of high and low Q values, or in those having low Q values.
(3) In this study, the average Qs value of the TTB only varied between 500 and 540 from one period to another, which was consistent with the average Q0 value (523) for the entire study period (2009–2020). However, the average Qs values for the middle Tianshan region portrayed a general upward trend since 2009 (from 494 in 2010 to 554 in 2020). By contrast, the average Qs value for the southwestern Tianshan regions was relatively stable (from 490 to 530) during most periods. The regional average Q value for the middle Tianshan region was higher than that of the southwestern Tianshan region, during most periods (except 2009–2010), which was consistent with the fact that tectonic movements were more intense in the southwestern Tianshan area than the.middle Tianshan region.
(4) The dynamics of the Q value provided insights into the trends pertaining to tectonic activity, rock fracturing, and subsurface fluid flow, serving as a foundation for the understanding of seismogenic mechanisms. By comparing the number of earthquakes and the regional average Q value of the middle and southwestern Tianshan regions, we could deduce that seismic frequency was positively correlated with the regional average Q value. This was consistent with the findings from the Sichuan–Yunnan region (Pei et al., 2010) and Hainan Island and its adjacent areas (Wang et al., 2016), i.e., the greater the regional average Q, the greater the number of earthquakes. The temporal variations in the Q values were related to the tectonic activity trends, and the accumulation and release of stress were essentially the processes through which the earthquakes occurred. Notably, changes in rock stress may cause fractures within the rock to close or open, thus, changing the density of fractures in the rock, ultimately changing the regional Q values (Pei et al., 2010).
The original contributions presented in the study are included in the article/supplementary material, further inquiries can be directed to the corresponding author.
JL completed the data processing and writing of the manuscript. HJ and QW developed the idea of the manuscript and supported the completion of the manuscript. All authors contributed to the article and approved the submitted version.
This study was jointly funded by the Natural Science Foundation of the Xinjiang Uygur Autonomous Region (Grant No. 2020D01A83), Earthquake Science and Technology Spark Program of the China Earthquake Administration (Grant Nos. XH22025D and XH21042), and Key Research and Development Program of the Xinjiang Uygur Autonomous Region (Grant Nos. 2022B03001-1 and 2020B03006-3) and Institute of Engineering Mechanics (China Earthquake Administration) Scientic Research (Grant Nos.22020EEEVL0203).
We thank Dr. Qingdong Ye of the First Monitoring and Application Center of the China Earthquake Administration (CEA), Senior Engineer Huilin Wang of the Hainan Earthquake Agency, and Senior Engineer Yurong Qiu of the Shaanxi Earthquake Agency for assistance with this study. We would also like to thank Researcher Shunping Pei of the Institute of Tibetan Plateau Research (Chinese Academy of Sciences) and Researcher Longquan Zhou of the CEA for their guidance and suggestions. The research was assisted by the research team of earthquake sequence tracing and post-earthquake trend, China Earthquake Administration. Some of the figures in this paper were prepared using the GMT software (Wessel and Smith, 1995).
The authors declare that the research was conducted in the absence of any commercial or financial relationships that could be construed as a potential conflict of interest.
All claims expressed in this article are solely those of the authors and do not necessarily represent those of their affiliated organizations, or those of the publisher, the editors and the reviewers. Any product that may be evaluated in this article, or claim that may be made by its manufacturer, is not guaranteed or endorsed by the publisher.
Quality factor value (Q), Three-dimensional (3D), Two-dimensional (2D), Tianshan tectonic belt (TTB), Arrival time difference (ATD), Attenuation operator (t*), Sliding-average value (Qs), Average value (Q0).
Abdrakhmatov, K. Y., Aldazhanov, S. A., Hager, B. H., Hamburger, M. W., Herring, T. A., Kalabaev, K. B., et al. (1996). Relatively recent construction of the Tien Shan inferred from GPS measurements of present-day crustal deformation rates. Nature 384, 450–453. doi:10.1038/384450a0
Atkinson, G. M., and Mereu, R. F. (1992). The shape of ground motion attenuation curves in southeastern Canada. Bull. Seismol. Soc. Amer. 82, 2014–2031. doi:10.1785/bssa0820052014
Avouac, J. P., Tapponnier, P., Bai, M., You, H., and Wang, G. (1993). Active thrusting and folding along the northern tien Shan and late cenozoic rotation of the Tarim relative to dzungaria and Kazakhstan. J. Geophys. Res. 98 (B4), 6755–6804. doi:10.1029/92jb01963
Baqer, S., and Mitchell, B. J. (1998). Regional variations of Lg coda Q in the continental United States and its relation to crustal structure and evolution. Pure Appl. Geophys. 158, 613–638.
Brune, J. N. (1970). Tectonic stress and the spectra of seismic shear waves from earthquakes. J. Geophys. Res. 75 (26), 4997–5009. doi:10.1029/jb075i026p04997
Burtman, V. S., and Molnar, P. (1993). Geological and geophysical evidence for deep subduction of continental crust beneath the Pamir. Geol. Soc. Am. Inc 281, 248–251.
Cai, Y., Wu, J. P., Ming, Y. H., Fang, L. H., Wang, W. L., Kong, X. Y., et al. (2019). Crust-mantle S wave velocity structures beneath Tianshan area and its deformation analysis. Chin. J. Geophys. 62, 4214–4226. doi:10.6038/cjg2019M0589
Chen, J., Ding, G. Y., Burbank, D. W., Scharer, K., Rubin, C., Sobel, E., et al. (2001). Late cenozoic tectonics and seismicity in the southwestern tianshan China. Earthq. Res. China 17, 134–155.
Cong, L. L., Hu, J. F., Fu, Z. W., Wen, Y. B., Kang, G. F., Wu, X. P., et al. (2002). Distribution of Lg cada Q in the Chinese continent and its adiacent regions. Sci. China Earth Sci. 32, 617–624.
Cormier, V. F. (1982). The effect of attenuation on seismic body waves. Bull. Seis Soc. Amer 72, 169–200.
Deev, E. V., and Korzhenkov, A. M. (2016). Paleoseismological studies in the epicentral area of the 1911 Kemin earthquake (northern Tien Shan). Russ. Geol. Geophys. 57, 337–343. doi:10.1016/j.rgg.2016.02.010
Deng, Q. D., Feng, X. Y., and You, H. C. (1991). “Characteristics and mechanism of deformation along the Dushanzi-Anjihai active reverse fault and fold zone, Xinjiang,” in Research on active fault (Beijing: Seismic Publishing House), 17–36.
Gao, G. Y., Nie, X. H., and Long, H. Y. (2010). Discussion on the characteristics of regional tectonic stress field of Xinjiang Fron 2003-2008. Seismol. Geol. 32, 70–79. doi:10.3969/j.issn.0253-4967.2010.01.007
Gao, R., Xiao, X. C., Gao, H., Li, Q. S., Liu, X., Jiang, M., et al. (2002). Summary of deep seismic probing of the lithospheric structure across the west Kunlun-Tarim-Tianshan. Geol. Bull. China 21, 11–18.
Guo, B., Liu, Q. Y., Chen, J. H., Zhao, D. P., Li, S. C., and Lai, Y. G. (2006). Seismic tomography of the crust and upper mantle structure underneath the Chinese Tianshan. Chin. J. Geophys. 49, 1543–1551. doi:10.1002/cjg2.982
Guo, Z., Gao, X., Wang, W. M., Li, G. L., Duan, Z. Q., and Shi, H. (2010). S-wave velocity of the crust around Tianshan Mountains inverted from seismic ambient noise tomography. Chin. Sci. Bull. 55, 3590–3598. doi:10.1007/s11434-010-4017-3
Haberland, C., and Rietbrock, A. (2001). Attenuation tomography in the Western central andes: A detailed insight into the structure of a magmatic arc. J. Geophys. Res. 106 (B6), 11151–11167. doi:10.1029/2000jb900472
Hansen, S., Thurber, C., Mandernach, M., Haslinger, F., and Doran, C. (2004). Seismic velocity and attenuation structure of the east rift zone and south Flank of Kilauea volcano, Hawaii. Bull. Seis Soc. Amer 94, 1430–1440. doi:10.1785/012003154
Hao, Z. B., Qin, J. X., and Wu, X. Y. (2009). Overview of research on the seismic wave quality factor (Q). Prog. Geophys. 24, 375–381. doi:10.3969/j.issn.1004-2903.2009.02.002
Haydar, J., Ai-Shukri, , and Mitchell, B. J. (1990). Three dimensional attenuation structure in and around the new Madrid seismic zone. Bull. Seis Soc. Amer 80, 615–632.
He, J., Sandvol, E., Wu, Q. J., Gao, M. T., Gallegos, A., Ulziibat, M., et al. (2017). Attenuation of regional seimic phase (Lg and Sn) in eastern Mongolia. Geophys. J. Int. 211 (2), 1001–1011. doi:10.1093/gji/ggx349
Hearn, T. M., Beghoul, N., and Barazangi, M. (1991). Tomography of the Western United States from regional arrival times. J. Geophys. Res. 96, 16369–16381. doi:10.1029/91jb01509
Hearn, T. M., Wang, S. Y., Pei, S. P., Xu, Z. H., Ni, J. F., and Yu, Y. X. (2008). Seismic amplitude tomography for crustal attenuation beneath China. Geophys. J. Int. 174, 223–234. doi:10.1111/j.1365-246x.2008.03776.x
Hu, J. (2020). Development of regional-scaleseismic velocity and attenuation tomography methods and its applications. [Ph. D. thesis]. Hefei: University of Science and Technology of China.
Hu, J. F., Cong, L. L., Su, Y. J., and Kang, G. F. (2003). Distribution characteristics of q value of the Lg coda in Yunnan and its adjacent regions. Chin. J. Geophys. 46, 809–813.
Jiang, H., Gao, M. T., Yu, Y. X., and Tang, L. H. (2007). S wave inelastic attenuation and site effect in the northern Tianshan area. Acta Seismol. Sin. 29, 181–186.
Johnston, D. H., Toksoz, M. N., and Timur, A. (2012). Attenuation of seismic waves in dry and saturated rocks: II. Mechanisms. Geophysics 44, 691–711. doi:10.1190/1.1440970
Jolivet, M., Dominguez, S., Charreau, J., Chen, Y., Li, Y. G., and Wang, Q. C. (2010). Mesozoic and Cenozoic tectonic history of the central Chinese Tian Shan: Reactivated tectonic structures and active deformation. Tectonics 29, TC6019. doi:10.1029/2010tc002712
Kong, X. Y., Wu, J. P., and Liu, J. (2021). S-wave velocity structure inversed by ambient noise tomography in Xinjiang Tienshan and its surrounding areas. Earthq. Res. China 37, 43–58.
Kumar, P., Yuan, X., Kind, R., and Kosarev, G. (2005). The lithosphere-asthenosphere boundary in the tien Shan-karakoram region from S receiver functions: Evidence for continental subduction. Geophys. Res. Lett. 32, L07305. doi:10.1029/2004GL022291
Larson, K. M., Burgmann, R., Bilham, R., and Freymueller, J. T. (1999). Kinematics of the India-Eurasia collision zone from GPS measurements. J. Geophys. Res. 104, 1077–1093. doi:10.1029/1998jb900043
Larson, K. M., Palu, B., and Joan, G. (2003). Using 1-Hz GPS data to measure deformations caused by the Denali fault earthquake. Science 300, 1421–1424. doi:10.1126/science.1084531
Li, A., Ran, Y. K., Liu, G. H., and Xu, X. L. (2016). Active characteristics and paleo earthquakes in the west Kalpin nappe since the Holocene, SW Tianshan Mountain. Adv. Earth Sci. 31, 377–390. doi:10.11867/j.issn.1001-8166.2016.04.0377
Li, J., Zhou, L. Q., Wang, H. L., and Xiang, Y. (2017). Tomograpgy for Q of eastern section of the Tianshan area from high-frequency attenuation of S wave. Earthq. Res. China 33, 229–238.
Li, Y., Liu, Q. Y., Chen, J. H., Li, S. C., Guo, B., and Lai, Y. G. (2007). Shear wave velocity structure of the crust and upper mantle underneath the Tianshan orogenic belt. Sci. China Earth Sci. 50, 321–330. doi:10.1007/s11430-007-0008-x
Li, Z. H., Zhu, C. Y., Xia, A. G., Feng, L., and Tang, L. L. (2010). Study on non-elasticity attenuation, site response and source parameters in the Jiashi region. Xinjiang. Earthq. Res. China 26, 340–348.
Liu, J. H., Liu, F. T., Yan, X. W., Xu, Y., and Hao, T. Z. (2004b). A study of Lg coda attenuation beneath north China: Seismic imaging of Lg coda Q0. Chin. J. Geophys. 247, 1044–1052.
Liu, J. H., Xu, Y., and Hao, T. Y. (2004a). Study on physical mechanism of the seismic wave attenuation. Prog. Geophys. 19, 1–7.
Liu, J., Liu, Q. Y., Guo, B., and Song, H. Z. (2007). Small-scale upper mantle convection and orogeny of Tianshan Mountains in China. Sci. China Earth Sci. 50, 1142–1149. doi:10.1007/s11430-007-0070-4
Liu, J. M., and Li, Z. H. (2014). Non-elastic attenuation, site response and source parameters in the Northern Tianshan Mountain, Xinjiang of China. Earthquake 34, 77–86.
Liu, J., Zheng, S. H., and Huang, Y. L. (2003). The inversion of non-elasticity coefficient, source parameters, site response using genetic algorithms. Acta Seismol. Sin. 25, 211–218.
Liu, Y. H., Liu, X. W., Yang, X., Zheng, J. J., Wang, Y. D., and Su, L. (2012). Discussion of some problems of plate tectonics evolution and mantle dynamics of Tianshan and its adjacent area. J. Geod. Geodynam. 32, 31–37.
Liu, Y. H., Liu, X. W., Zheng, J. J., Zhao, D. D., Yang, X., and Wang, Y. D. (2011). Coupling dynamic mechanisms between plate tectonics evolution and mantle convection of south and north Tianshan. Prog. Geophys. 26, 1544–1556. doi:10.3969/j.issn.1004-2903.2011.05.006
Lu, D. Y., Li, Q. S., Gao, R., Li, Y. K., Li, D. X., Liu, W., et al. (2000). A deep seismic sounding profile across the Tianshan Mountains. Chin. Sci. Bull. 45, 2100–2107. doi:10.1007/bf03183536
Ma, H. S., Wang, S. Y., Pei, S. P., Liu, J., Hua, W., and Zhou, L. Q. (2007). Q0 tomography of S wave attenuation in Sichuan, Yunnan and adjacent regions. Chin. J. Geophys. 50, 423–429. doi:10.1002/cjg2.1051
Mitchell, B. J. (1995). Anelastic structure and evolution of the continental crust and upper mantle from seismic surface wave attenuation. Rev. Geophys. 33, 441–462. doi:10.1029/95rg02074
Mitchell, B. J., Pan, Y., Xie, J. K., and Cong, L. L. (1997). Lg coda Q variation across Eurasia and its relation to crustal evolution. J. Geophys. Res. 102, 22767–22779. doi:10.1029/97jb01894
Molnar, P., and Lyon-Caen, H. (1989). Fault plane solution of earthquakes and active tectonics of the Tibetan Plateau and its margins. Geophys. J. Int. 99, 123–153.
Molnar, P., and Tapponnier, P. (1978). Active tectonics of tibet. J. Geophys. Res. 83, 5361–5374. doi:10.1029/jb083ib11p05361
Molnar, P., and Tapponnier, P. (1975). Cenozoic Tectonics of Asia: Effects of a Continental Collision: Features of recent continental tectonics in Asia can be interpreted as results of the India-Eurasia collision. Science 189, 419–426. doi:10.1126/science.189.4201.419
Mukhopadhyay, S., Mishra, O. P., Zhao, D., and Kayal, J. R. (2006). 3-D seismic structure of the source area of the 1993 Latur, India, earthquake and its implications for rupture nucleations. Tectonophysics 415, 1–16. doi:10.1016/j.tecto.2005.10.041
Pei, S. P., Liu, J., Ma, H. S., Gao, X., and Su, J. R. (2010). Dynamic variation of S-wave Q value beneath Sichuan-Yunnan, China. Chin. J. Geophys. 53, 1639–1652. doi:10.3969/j.issn.0001-5733.2010.07.015
Pei, S. P., Su, J. R., Gao, X., Zhao, J. M., and Liu, H. B. (2008). S-wave attenuation tomography of upper crust in Japan. Chin. J. Geophys. 51, 828–835.
Pei, S. P., Zhao, J. M., Rowe, C. A., Wang, S. Y., Hearn, T. M., Xu, Z. H., et al. (2006). M-L amplitude tomography in north China. Bull. Seis Soc. Amer. 96, 1560–1566. doi:10.1785/0120060021
Qiu, Y. R., Yang, Y. H., Shao, H. C., and Zhang, E. H. (2021). Crustal QS tomography in intersection area of shaanxi-gansu-ningxia. Earthq. Res. China 37, 95–106.
Qu, Y. J., Wang, Q., and Nie, X. H. (2010). Research on the structural belts and earthquake activity state in the south part of Xinjiang. Inland Earthq. 24, 298–306.
Ran, Y. K., Yang, X. P., Xu, X. W., Chen, J. W., and Chen, L. C. (2006). Deformation pattern and shortening rates in the east part of kalpin thrust system in southwest Tianshan during late quaternary. Seismol. Geol. 28, 179–193.
Reigber, C., Michel, G. W., Galas, R., Angermann, D., Klotz, J., Chen, J. Y., et al. (2001). New space geodetic constraints on the distribution of deformation in Central Asia. Earth Planet. Sci. Lett. 191, 157–165. doi:10.1016/s0012-821x(01)00414-9
Roecker, S. W., Sabitova, T. M., Vinnik, L. P., Burmakov, Y. A., Golvanov, M. I., Mamatkanova, R., et al. (1993). Three-dimensional elastic wave velocity structure of the Western and central Tien Shan. J. Geophys. Res. 98, 15779–15795. doi:10.1029/93jb01560
Romanowicz, B. (1994). On the measurement of anelastic attenuation using amplitudes of low frequency surface waves. Phys. Earth Planet. Inter. 84, 179–191. doi:10.1016/0031-9201(94)90040-x
Romanowicz, B. (1990). The upper mantle degree 2: Constraints and inferences from global mantle wave attenuation measurements. J. Geophys. Res. 95, 11051–11071. doi:10.1029/jb095ib07p11051
Sanders, C. O. (1993). “Local earthquake tomography: Attenuation theory and results,” in Seismic Tomography: theory and Practice (New York: Chapman & Hall), 676–694.
Scholz, C. H. (2002). The mechanics of earthquakes and faulting. 2nd ed. Cambridge: Cambridge Univ. Press.
Schubert, G., Turcott, D. L., and Olsen, P. (2001). Mantle convection in the earth and planets. Oxford: Cambridge University Press.
Shao, X. Z., Zhang, J. R., Fan, H. J., Zheng, J. D., Xu, Y., Zhang, H. Q., et al. (1996). The crust structures of tianshan orogenic belt: A deep sounding work by converted waves of earthquakes along rmqi-korla profile. Chin. J. Geophys. 39, 336–346.
Sherbaum, F. (1990). Combined inversion for the three-dimensional Q structure and source parameters using microearthquake spectra. J. Geophys. Res. 95, 12423–12438. doi:10.1029/jb095ib08p12423
Shu, L. S., Guo, Z. J., Zhu, W. B., Lu, H. F., and Wang, B. (2004). Post-collision tectonism and basin-range evolution in the tianshan belt. Geol. J. China Univ. 10, 393–404.
Su, Y. J. (2009). Inversion tomography of the seismic wave attenuation (Q value) structure in Yunnan region. [Ph. D. thesis]. Hefei: University of Science and Technology of China.
Su, Y. J., Liu, J., Zheng, S. H., Liu, L. F., Fu, H., and Xu, Y. (2006). Q value of anelastic S-wave attenuation in Yunnan region. Acta Seismol. Sin. 28, 206–212.
Sun, L., Li, Y. H., Wu, Q. J., and Wang, S. Y. (2012). Q0 tomography of S wave attenuation in Northeast China and adjacent regions. Chin. J. Geophys. 55, 1179–1185. doi:10.6038/j.issn.0001-5733.2012.04.014
Tang, L. L., Kong, X. Y., Long, F., and Feng, J. G. (2013). Identification and spatio-temporal characteristics of re-peating earthquakes in Kepingtage fault zone. Acta Seismol. Sin. 35, 328–340. doi:10.3969/j.issn.0253-3782.2013.03.005
Tang, X. Y., Fan, W. Y., Feng, Y. G., Tang, Y. C., Chen, Y. S., and Zhu, L. X. (2011). Phase velocity tomography of Rayleigh wave in Xinjiang from ambient noise. Chin. J. Geophys. 54, 2042–2049. doi:10.3969/j.issn.0001-5733.2011.08.011
Tapponnier, P., and Molnar, P. (1979). Active faulting and cenozoic tectonics of the tien Shan, Mongolia, and baykal regions. J. Geophys. Res. 84, 3425–3459. doi:10.1029/jb084ib07p03425
Tapponnier, P., and Molnar, P. (1977). Active faulting and tectonics in China. J. Geophys. Res. 82, 2905–2930. doi:10.1029/jb082i020p02905
Toksoz, M. N., Johnston, D. H., and Timur, A. (1979). Attenuation of seismic waves in dry and saturated rocks: I. Laboratory measurements. Geophysics 44, 681–690. doi:10.1190/1.1440969
Walsh, J. B. (1966). Seismic wave attenuation in rock due to friction. J. Geophys. Res. 71, 2591–2599. doi:10.1029/jz071i010p02591
Wan, Y. G., Shen, Z. K., Sheng, S. Z., and Xu, X. F. (2009). The influence of 2008 Wenchuan earthquake on surrounding faults. Acta Seismol. Sin. 31, 128–139.
Wang, H. L., Xu, X. F., Zhou, L. Q., Zhang, X. D., Shen, F. L., Li, Z. X., et al. (2016). Crustal Qs tomography in hainan Island and adjacent region. Seismol. Geol. 38, 631–645. doi:10.3969/j.issn.0253-4967.2016.03.010
Wang, H. L., Zhang, X. D., Zhou, L. Q., and Xu, X. F. (2012b). Relationship between the reservoir storage and crustal QS dynamic variation in Zipingpu reservoir area. Acta Seismol. Sin. 34, 676–688. doi:10.3969/j.issn.0253-3782.2012.05.009
Wang, H. L., Zhang, X. D., Zhou, L. Q., Xu, X. F., Yang, Z. G., Lu, X., et al. (2012a). Study on the relationship between fluid infiltration and QS tomography of the crust in Zipingpu Reservoir Area. Chin. J. Geophys. 55, 526–537. doi:10.6038/j.issn.0001-5733.2012.02.015
Wang, Q., Ding, G. Y., Qiao, X. J., Wang, X. Q., and You, X. Z. (2000). Recent rapid shortening of crust across the Tianshan Mts. and relative motion of tectonic blocks in the north and south. Chin. Sci. Bull. 45, 1995–1999. doi:10.1007/bf02909695
Wang, Q., Qu, Y. J., and Nie, X. H. (2011). Analysis on seismicity state of tectonic regions in the northern part of Xinjiang. Northwest. Seismol. J. 33, 137–142.
Wang, S. Y., Pei, S. P., Thomas, M. H., Xu, Z. H., James, F. N., and Yu, Y. X. (2008). Crustal S-wave Q estimated from ML amplitude Ⅱ: Q lateral variation in China. Chin. J. Geophys. 51, 133–139.
Wang, S. Y., Pei, S. P., Xu, Z. H., Zhang, G. M., Yu, Y. X., and Pan, H. (2007a). Crustal S wave Q estimated from ML amplitude I: Attenuation in different tectonic regions of China. Chin. J. Geophys. 50, 1740–1747. doi:10.3321/j.issn:0001-5733.2007.06.014
Wang, W. J., Chen, L., Chen, Q. F., and Liu, J. (2007b). Velocity and attenuation structures in the focal area of 2003 Dayao earthquakes. Chin. J. Geophys. 50, 686–696. doi:10.1002/cjg2.1082
Wessel, P., and Smith, W. H. F. (1995). New version of the generic mapping tools. EOS Trans. AGU 76, 329. doi:10.1029/95eo00198
Winkler, K., and Nur, A. (1979). Pore fluids and seismic attenuation in rocks. Geophys. Res. Lett. 6, 1–4. doi:10.1029/gl006i001p00001
Wittlinger, G. H., Haessler, H., and Granet, M. (1983). Three dimensional inversion of Qp from low magnitude earthquakes analysis. Ann. Geophys. 6, 427–438.
Xiao, X. C., Liu, X., and Gao, R. (2004). The crustal structure and tectonic evolution of southern Xinjiang. China. Beijing: The Commercial Press.
Xiong, X. S., Gao, R., Li, Q. S., Wang, H. Y., Lu, Z. W., and Hou, H. S. (2011). The deep structure of Tienshan orogenic belt. Prog. Geophys. 26, 1906–1914. doi:10.3969/j.issn.1004-2903.2011.06.003
Xu, Y., Liu, F. T., Liu, J. H., and Sun, R. M. (2000). Crustal structure and tectonic environment of strong earthquakes in the Tianshan earthquake belt. Chin. J. Geophys. 43, 184–193.
Yang, S. M., Li, J., and Wang, Q. (2008). The deformation pattern and fault rate in the Tianshan Mountains inferred from GPS observations. Sci. China Earth Sci. 51, 1064–1080. doi:10.1007/s11430-008-0090-8
Yang, X. P., Ran, Y. K., Song, F. M., Xu, X. W., Chen, J. W., Min, W., et al. (2006). The analysis for crust shortening of kalpin thrust tectonic zone, south-Western tianshan, Xinjiang, China. Seismol. Geol. 28, 194–204.
Ye, Q. D., Yan, C. H., Wang, S. W., Mao, Y. F., Yu, D. X., and Yan, L. L. (2018). Crustal 2-D QS tomography in Longtan reservoir,Guangxi region. Acta Seismol. Sin. 40, 689–700. doi:10.11939/jass.20170227
Yi, G. X., Wen, X. Z., Xin, H., Qiao, H. Z., and Gong, Y. (2013). Stress state and major-earthquake risk on the southern segment of the Longmen Shan fault zone. Chin. J. Geophys. 56, 1112–1120. doi:10.6038/cjg20130407
Yin, A., Nie, S., Craig, P., Harrison, T. M., Ryerson, F. J., Qian, X. L., et al. (1998). Late Cenozoic tectonic evolution of the southern Chinese Tian Shan. Tectonics 17, 1–27. doi:10.1029/97tc03140
Zhang, J. Q., Liu, J., and Zhou, L. Q. (2009). Tomography and analysis of velocity and attenuation structure for the 2000 Yaoan aftershock tomography and analysis of velocity and attenuation structure for the 2000 Yaoan aftershock area in Yunnan. Earthquake 29, 126–135.
Zhang, P. Z., Deng, Q. D., Yang, X. P., Peng, S. Z., Xu, X. W., and Feng, X. Y. (1996). Late cenozoic tectonic deformation and mechanism along the tianshan Mountain,Northwestern China. Earthq. Res. China 12, 127–140. doi:10.3969/j.issn.0001-5733.2011.06.007
Zhang, P. Z., Deng, Q. D., Zhang, G. M., Ma, J., Gan, W. J., Min, W., et al. (2003). Strong earthquake activity and active blocks in Chinese Mainland. Sci. China Earth Sci. 33, 12–20. doi:10.3321/j.issn:1006-9267.2003.z1.002
Zhang, Z. B., Liang, X. F., Zhou, B. B., Liu, D. Q., and Tang, M. S. (2021). Three-dimensional seismic velocity structure of the middle part of north Tianshan mountains, Xinjiang based on seismic relocation and local seismic tomography. Seismol. Geol. 43, 1292–1310. doi:10.3969/j.issn.0253-4967.2021.05.015
Zhao, C. P., Chen, Z. L., Zheng, S. H., and Zhang, Z. Q. (2008). Moment inversion of moderate earthquakes and the locally perturbed stress field in the Jiashi source region. Chin. J. Geophys. 51, 782–792. doi:10.3321/j.issn:0001-5733.2008.03.019
Zhao, C. P., Chen, Z. L., Hua, W., Wang, Q. C., Li, Z. X., and Zheng, S. H. (2011). Study on source parameters of small to moderate earthquakes in the main seismic active regions, China mainland. Chin. J. Geophys. 54, 1478–1489. doi:10.3969/j.issn.0001-5733.2011.06.007
Zhao, D. P., Kanamori, H., Negishi, H., and Wiens, D. (1996). Tomography of the source area of the 1995 Kobe earthquake: Evidence for fluids at the hypocenter? Science 274, 1891–1894. doi:10.1126/science.274.5294.1891
Zhao, D. P., Mishra, O. P., and Sanda, R. (2002). Influence of fluids and magma on earthquakes: Seismological evidence. J. Geophys. Res. 132, 249–267. doi:10.1016/s0031-9201(02)00082-1
Zhao, J. M., Zhang, P. Z., Zhang, X. K., Yuan, X. H., Rainer, K., Robert, V. D., et al. (2021). Crust-mantle structure and geodynamic processes in Western China and their constraints on resources and environment: Research progress of the ANTILOPE Project. Earth Sci. Front. 28, 230–259. doi:10.13745/j.esf.sf.2021.9.38
Zheng, J. C., Gu, J. P., and Zhang, Y. S. (2007). Combined Inversion of the upper crust 3-D velocity structure in north China. Prog. Geophys 22 (06), 1706–1714.
Keywords: Tianshan tectonic belt, quality factor value (Q), tomographic imaging, seismic activity, attenuation operator (t∗), crustal attenuation, spatiotemporal variation, seismic attenuation tomography
Citation: Li J, Jiang H and Wang Q (2023) Crustal attenuation structure of the Tianshan tectonic belt and its spatiotemporal variations. Front. Earth Sci. 11:1094151. doi: 10.3389/feart.2023.1094151
Received: 09 November 2022; Accepted: 20 February 2023;
Published: 03 March 2023.
Edited by:
Jiancang Zhuang, Institute of Statistical Mathematics, JapanReviewed by:
Shunping Pei, Institute of Tibetan Plateau Research (CAS), ChinaCopyright © 2023 Li, Jiang and Wang. This is an open-access article distributed under the terms of the Creative Commons Attribution License (CC BY). The use, distribution or reproduction in other forums is permitted, provided the original author(s) and the copyright owner(s) are credited and that the original publication in this journal is cited, in accordance with accepted academic practice. No use, distribution or reproduction is permitted which does not comply with these terms.
*Correspondence: Jin Li, bGlqaW42MjA1QDE2My5jb20=
Disclaimer: All claims expressed in this article are solely those of the authors and do not necessarily represent those of their affiliated organizations, or those of the publisher, the editors and the reviewers. Any product that may be evaluated in this article or claim that may be made by its manufacturer is not guaranteed or endorsed by the publisher.
Research integrity at Frontiers
Learn more about the work of our research integrity team to safeguard the quality of each article we publish.