 Bo Zhang
 Shi Chen
 Jiancang Zhuang
 Bei Zhang
 Xu Wu2,3
- 1Liaoning Earthquake Agency, Shenyang, China
- 2Institute of Geophysics, China Earthquake Administration, Beijing, China
- 3Beijing Baijiatuan Earth Science National Observation and Research Station, Beijing, China
- 4The Institute of Statistical Mathematics, Research Organization of Information and Systems, Tokyo, Japan
- 5School of Electrical Control, Chang’An University, Xi’an, China
Epicenter locations are generally adjacent to active faults and past seismicity regions. Past earthquake catalogs and the geometry of the active faults can provide key prior knowledge concerning earthquake forecasts. In this study, we first introduce two straightforward dedicated models, the proximity-to-past-earthquakes (PPE) and proximity-to-mapped-faults (PMF) models, to fit the seismicity in the Sichuan-Yunnan region, China. The hybrid proximity-to-known-sources (PKS) model with the optimized model parameters is then used to estimate the probability of earthquake occurrence. Second, to compare the PKS forecast efficiency to those of different models, retrospective tests are applied to a dataset located in the Sichuan-Yunnan region. The results show that the probability maps derived from PPE, PMF, and PKS have non-uniform Poisson distribution features and that there is forecasting significance for past cases of moderate earthquakes in the test region. Finally, using Molchan error diagram tests, we find that the hybrid PKS model performs better than the other models in the testing region. The unsatisfactory performance of the PMF model for earthquake forecasting may lie both in the incompleteness of the fault database and the lack of consideration of co-seismic ruptures. Therefore, one of the three models can be used as a base model for comparing and evaluating earthquake forecast strategies.
1 Introduction
More than one-third of the global population experiences earthquakes, with frequent slight or greater damage to lives and property from such events (Marti et al., 2019). However, at present, earthquake forecasting remains a major unsolved scientific problem and is not sufficiently reliable to rapidly predict earthquakes. Seismologists can also contribute to society by performing long-term probabilistic seismic hazard assessments. As a basic input for building codes, such assessments are crucial to ensure good building practices to save lives (Hiemer et al., 2013).
Mapped faults and past earthquakes have historically been the two main types of data used by seismic hazard models to estimate the likelihood of earthquake occurrence (Rhoades et al., 2017). Some short-term models have been built using only cataloged earthquakes, including the short-term earthquake probability (STEP) (Gerstenberger et al., 2005) and epidemic-type aftershock sequence (ETAS) (Ogata, 1988; Ogata, 1998; Gerstenberger and Rhoades, 2010) models, which are based on the decay of aftershock rates and the Omori–Utsu law (Utsu, 1961). Other useful medium- or long-term models, such as the proximity-to-past-earthquakes (PPE) (Kagan and Jackson, 1994; Jackson and Kagan, 1999) and the every-earthquake-a-precursor-according-to-scale (EEPAS) (Rhoades and Evison, 2004; Rhoades and Evison, 2005; Rhoades, 2007) models, rely only on past earthquakes. Meanwhile, long-term models such as the proximity-to-mapped-faults (PMF) model (Rhoades and Stirling, 2012) often use mapped faults with their slip rates. In addition, the increasing availability of crustal movement observational data, such as Global Positioning System (GPS) network data and derived models of crustal strain rate (Bird et al., 2015; Rhoades et al., 2017) are important to estimate the earthquake occurrence rate (Rhoades et al., 2015).
A parallel development is that of hybrid methods, which combine two or more different models to gain predictive skills from a single idea or data source. The results of retrospective and pseudo-prospective analyses have shown that some multiplicative ensembles provide statistically better forecasts than their constituent forecasting models (Rhoades and Stirling, 2012; Rhoades 2013; Gerstenberger et al., 2014; Rhoades et al., 2015; Rhoades et al., 2016). Therefore, the international Collaboratory for the Study of Earthquake Predictability (CSEP) supports methods to evaluate combinations of two or more individual models or to assimilate new gridded covariates into existing models (Schorlemmer et al., 2018).
The robustness of various earthquake forecast models cannot be fully described without first being assessed in diverse regions with distinct seismic features. The Sichuan-Yunnan region provides a natural earthquake forecast experiment because, following the MS 8.0 Wenchuan earthquake, it became more seismically active. For example, two earthquakes of magnitude ≥7.0, the MS 7.0 Lushan and MS 7.0 Jiuzhaigou earthquakes, have occurred in this region in the last 10 years since the MS 8.0 Wenchuan earthquake; however, no earthquakes had occurred over the same time period before the MS 8.0 Wenchuan earthquake. Moreover, substantial infrastructure, such as reservoirs, railway networks, and electricity grids, is spread throughout the Sichuan-Yunnan region. While earthquakes of great intensity occurring due to natural processes cannot be avoided, forewarning can help minimize their often catastrophic and damaging impacts (Herrera et al., 2022). Much work is required regarding probabilistic seismic hazard assessments in this area. Therefore, we introduce individual probabilistic models based on past earthquakes or mapped faults and a hybrid model based on both to estimate the probability of earthquake occurrence; we then take a statistical approach to evaluate the efficiency of earthquake forecasting in the Sichuan-Yunnan region.
Section 2 includes a full description of the mapped faults and cataloged earthquakes that were used in this study. The two individual models and the hybrid model are introduced in Section 3. Section 4 and Section 5 present, successively, the results of the estimated seismicity rate for each model, along with an evaluation of their predictive effectiveness.
2 Data
We chose the Sichuan-Yunnan region for testing because of the good monitoring capability in this region with respect to seismicity and fault movement. In the test area of the Sichuan-Yunnan region, which is marked in Figure 1, 1,234 earthquakes with magnitudes ≥4.0 and depth ≤50 km were recorded in the China Earthquake Networks Center (CENC) catalog from January 1, 1970, to September 10, 2022, including the MS 8.0 Wenchuan earthquake, the largest earthquake in the test region. Of these, 14 target earthquakes in the test region with M ≥ 6.0 and depth ≤ 50 km that occurred during the three periods of May 20, 2008–May 20, 2011; January 1, 2013–January 1, 2016; and September 10, 2019–September 10, 2022, listed in Table 1, were used to evaluate the forecast efficiency of the three different models. Figure 1 shows the epicenters of the earthquakes that occurred in the test region.
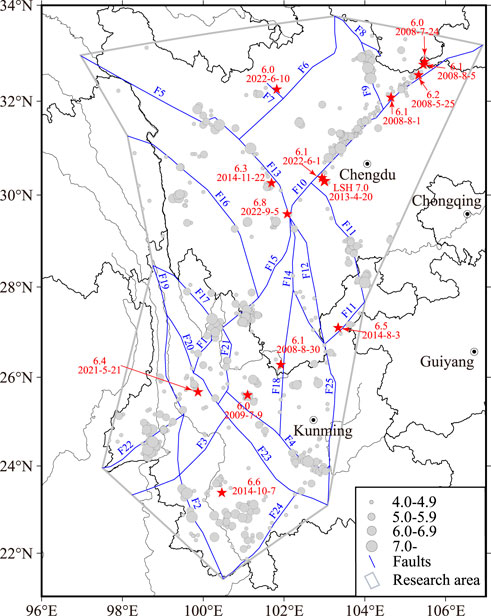
FIGURE 1. Epicenters of the earthquakes in the research area in the Sichuan-Yunnan region, China. The circle sizes represent the earthquake magnitudes. The red stars indicate the target earthquakes. The blue lines show the faults in the fault-model database. The gray line encloses the test area in the Sichuan-Yunnan region. Fault numbers F1–F25 indicate the Lijiang-Xiaojinhe, Hanmuba-Heihe-Mengzhe, Nandinghe, Chuxiong-Jianshui, Ganzi-Yushu, Longriba, Songgang, Tazang, Huya, Longmenshan, Mabian, Daliangshan, Xianshuihe, Anninghe, Jinpingshan, Litang, Deqin-Zhongdian-Daju, Yuanmou-Xigeda, Lancangjiang, Weixi-Qiaohou, Chenghai, Longling-Ruili, Honghe, Menglong, and Xiaojiang faults, respectively.
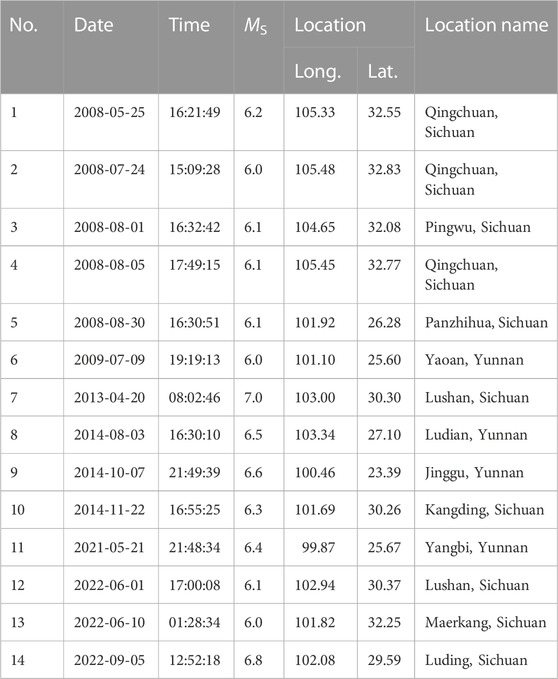
TABLE 1. Target earthquakes (MS > 6.0) in the test area in the Sichuan-Yunnan region, China, during the three periods of May 20, 2008–May 20, 2011, January 1, 2013–January 1, 2016, and September 10, 2019–September 10, 2022.
The Chinese Earthquake Administration (CEA) and other groups launched the Project Crustal Movement Observation Network of China (CMONC) to monitor the crust dynamics using various techniques including GPS. Based on the GPS measurements and the fault locations in the test region, the Second Monitoring and Application Center of CEA calculated the fault rates in the Sichuan-Yunnan region and provided the fault-model datasets for this study (Figure 2). Figure 2 shows the higher slip rates in the Ganzi-Yushu fault (F5), the fault intersection segment of the Xianshuihe fault (F13), the Longmenshan fault (F10), the Jinpingshan fault (F15), the Anninghe fault (F14), and the Daliangshan fault (F12). The Qinghai-Tibet Plateau Block moves eastward continuously, blocked by the relatively stable Sichuan Basin, and the South China Block in the Sichuan-Yunnan region moves from east to south along these faults at a relatively high slip rate. In Figure 2, four aftershocks of the MS 8.0 Wenchuan earthquake with magnitudes of MS 6+ occurred near the northern segment (latitude >32°N) of the Longmenshan fault (F14), however, the segment of the fault does not have the expected relatively high slip rate (Shen et al., 2009; Xiong et al., 2021).
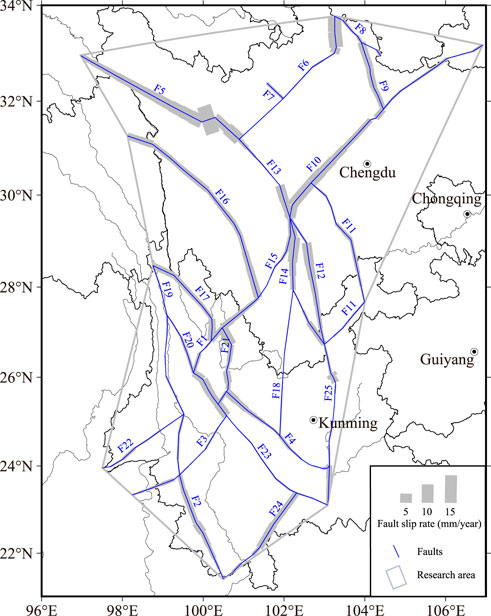
FIGURE 2. Fault slip rates. The blue lines indicate the faults in the fault-model database in the test area, with line thicknesses proportional to the fault slip rate. The gray line encloses the test area in the Sichuan-Yunnan region. The fault numbers are as indicated in Figure 1.
3 Method
3.1 Proximity-to-past-earthquakes model
According to the assumption that future earthquakes are more likely to occur near past earthquakes, Jackson and Kagan (1999) proposed the PPE forecasting model, in which the contribution from every earthquake is inversely proportional to the epicentral distance and is directly dependent on the earthquake magnitude.
Under the PPE model, the earthquake occurrence-rate density λ at time t and location (x, y) can be calculated from the earthquakes (ti, mi, xi, yi), where i = 1, …, neq, in the catalog such that
where a is a normalization parameter, d is the smoothing distance, and s is a small spatially uniform background rate of earthquake occurrence per day per kilometer squared to allow for earthquakes far from past earthquakes. The seismicity rate λ(t, x, y) is higher near past earthquakes of greater magnitude.
By maximizing the likelihood function, the three parameters (ae, de, se) can be computed by fitting the model to the past earthquake catalog. We used earthquakes with magnitudes of MS > 4.0 to compute the conditional density, using January 1, 1970, to January 1, 1990, as the learning period. The likelihood was only calculated for earthquakes with magnitudes of MS > 6.0 over the learning period. The three parameters were optimized for target earthquakes with MS > 6.0 over the forecast period from January 1, 1990, to May 20, 2008. Using the same parameters, the seismicity rates for January 1, 2013, and September 10, 2019, can also be estimated.
3.2 Proximity-to-mapped-faults model
The PMF model assumes that the mapped fault sources are frequently affected by earthquakes having the same characteristic magnitudes (Rhoades and Stirling, 2012). Under the PMF model, the mapped fault sources are composed of planar segments and each source has its own slip rate. Some long faults are divided into multiple segments, which are assigned their own slip rates. Because of earthquake depth estimation issues or because they are assigned a fixed depth, every fault is treated as if its dip angle were 90°; therefore, the distance between the faults and earthquakes has no relevance to the earthquake depths reported in the earthquake reports. The separated segments of the mapped faults and the individual associated slip rates are used to fit the PMF model. The seismicity rate λPMF at time t and location (x, y) is of the form
where xi and yi are the locations of the individual point fault sources, nf is the total number of points with associated slip rates ri, and i = 1, ..., nf. df is the space smoothing distance, which is not sensitive to the actual spacing between the individual points if it is much greater than df. sf is a small spatially uniform background rate of earthquake occurrence per day per kilometer squared, which allows for earthquakes far from the mapped faults. Therefore, the seismicity rate λPMF(t, x, y) is greater near mapped faults and lower far from mapped faults. In addition, the seismicity rate increases with the fault slip rate of the surrounding identified faults.
The test area of the Sichuan-Yunnan region has 25 mapped faults with known slip rates, as shown in Figure 2. Each mapped fault is separated into multiple point sources closely spaced at 0.01° intervals along the fault. To compare the earthquake forecast efficiency of the PMF model to that of the PPE model, we used the same learning and forecast periods as used in the PPE model. The three parameters were optimized for target earthquakes with magnitudes of MS > 6.0 over the three periods of January 1, 1990–May 20, 2008; January 1, 1990–January 1, 2013; and January 1, 1990–September 10, 2019.
3.3 Proximity-to-known-sources model
Mapped faults and cataloged earthquakes can sometimes each contribute differently to the creation of conventional probabilistic seismic-hazard models. For short periods, the fault data may not play a worthwhile role in estimating the earthquake likelihood. Accordingly, Rhoades and Stirling (2012) proposed an optimal model for earthquake occurrence, called the proximity-to-known-sources (PKS) model, that combines the fault location and estimated slip rates with the cataloged earthquake locations and magnitudes. This model consists of a convex linear combination of the PPE and PMF models. The seismicity rate λPKS at time t and location (x, y) is of the form
where μ is an additional parameter to be estimated in the range of 0 ≤ μ ≤ 1, such that seven parameters are needed for the model.
Here, we provide three methods to combine the two models: 1) Based on the optimized parameters (ae, de, se) of the PPE model and (af, df, sf) of the PMF model, we calculated the seismicity rate λPKS on May 20, 2008; January 1, 2013; and September 10, 2019, using an empirically specified μ; i.e., μ = 0.1 and 0.9, and 2) μ is a liner dependent on magnitude, as proposed by Hiemer et al. (2013) and called PKS weighted model (PKSW) in this study. The form is
where mc is the upper corner magnitude of the Gutenberg-Richter relationship (Gutenberg and Richter, 1944). All mc values over the three time intervals are MS7.0. 3) All seven parameters of the hybrid model were optimized by maximizing the likelihood function over the same three time intervals. Finally, we compared the earthquake forecasting performances of the various parameter combinations.
4 Results
4.1 Results of the PPE model
Figure 3 shows the results of the fitted seismicity rates for the three different times: May 20, 2008; January 1, 2013; and September 10, 2019. The black stars represent earthquakes of MS 6+ that occurred over the 3 years following the above three dates. The spatial inconsistency of the PPE model is due to its strong event location density concentration.
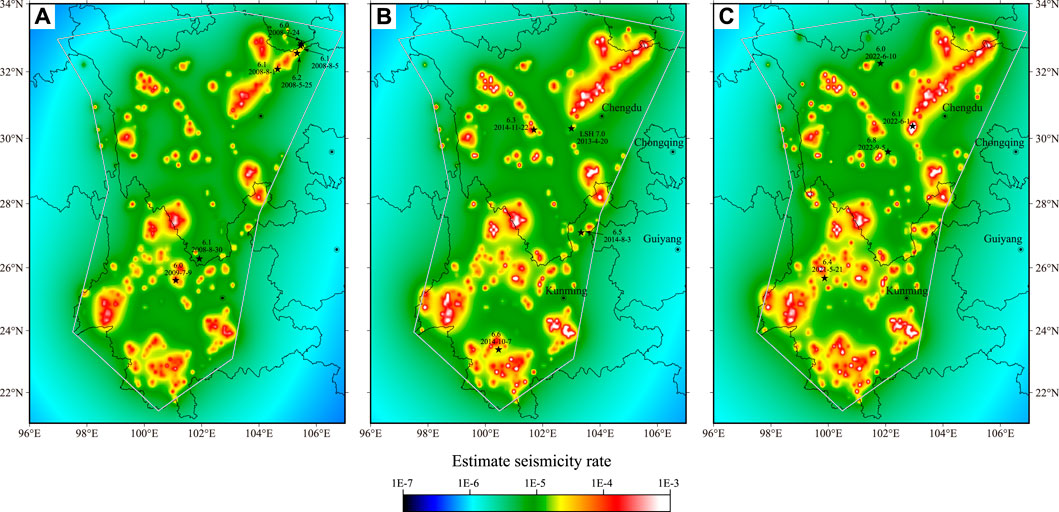
FIGURE 3. Estimated seismicity rate using earthquakes based on the China Earthquake Networks Center (CENC) catalog. The learning period was from January 1, 1970, to January 1, 1990, based on the proximity-to-past-earthquakes (PPE) model to calculate the conditional density. (A–C) Estimated results using data before May 20, 2008; January 1, 2013; and September 10, 2019, respectively. The black stars indicate the target earthquakes. The gray line encloses the test area in the Sichuan-Yunnan region.
Some obvious differences along the Longmenshan fault between the exceptions of the earthquake occurrence are shown in Figures 3A, B. The MS 8.0 Wenchuan earthquake and its aftershocks may be the dominant earthquake source locations contributing to the spatial variation differences in the rate density. The seismicity rate of the Lushan region in Figure 3C is higher than that in Figure 3B because of the MS 7.0 Lushan earthquake. The PPE model gets its strength from its ability to use data from these huge earthquakes.
As shown in Figure 3, the MS 6.1 Panzhihua, MS 6.0 Maerkang, and MS 6.8 Luding earthquakes are not located at locations of relatively higher seismicity rate, which indicates that no earthquake clustering occurred during the last several decades. This adds to the difficulty of forecasting earthquakes using the PPE model.
4.2 Result of the PMF model
Figures 4A–C show the spatial variation in seismicity rates at three different dates, May 20, 2008; January 1, 2013; and September 10, 2019, respectively. As shown in Figure 4, the location probability decreases with distance from the mapped faults. The spatial variations do not differ obviously in Figures 4A–C because the map of the seismicity rate is related to the locations of the mapped faults and their slip rates, which are static on decadal timescales.
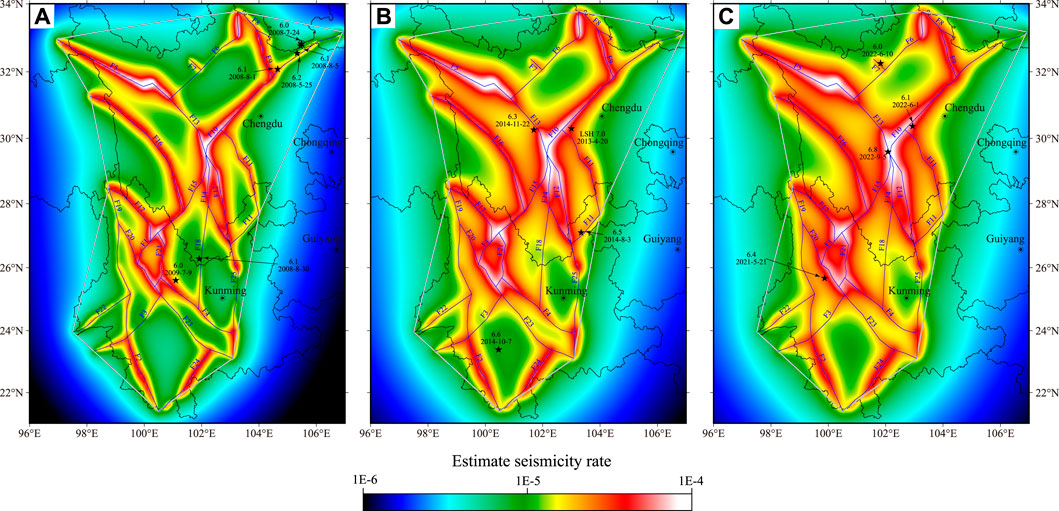
FIGURE 4. Estimated seismicity rate using earthquakes based on the CENC catalog and mapped faults. (A–C) Estimated results using data before May 20, 2008; January 1, 2013; and September 10, 2019, respectively. The black stars indicate the target earthquakes. The gray polygon encloses the test area in the Sichuan-Yunnan region. The fault numbers are as indicated in Figure 1.
As shown in Figure 4B, the seismicity rate at the location where the MS 6.6 Jinggu earthquake occurred is low because the epicenter of the earthquake was far from the mapped faults. However, three of the MS 8.0 Wenchuan aftershocks and the MS 6.1 Panzhihua earthquake (Figure 4A) are not located in relatively high seismicity rate areas, even though they are near mapped fault sources. One possible explanation may be that the fault slip rate at these locations is small and that the seismicity rate did not benefit sufficiently from the fault slip rates, as seen in Figure 2.
4.3 Results of the PKS model
Based on the various μ values, the varying seismicity rates at the three dates, May 20, 2008; January 1, 2013; and September 10, 2019, are illustrated in Figure 5. All the graphs indicate that the rate density is highest near the greatest concentration of large earthquakes during the entire history of the catalog, as well as the mapped fault sources to different extents. The value of μ is related to the proportion of the contribution of the PPE model used to construct the PKS model. Figure 5 illustrates that the smaller the μ value, the more “hot spots” with high seismicity rates will appear. The estimated seismicity rate of the PKS model looks like that for the μ value calculated using Eq. 4 at the three dates.
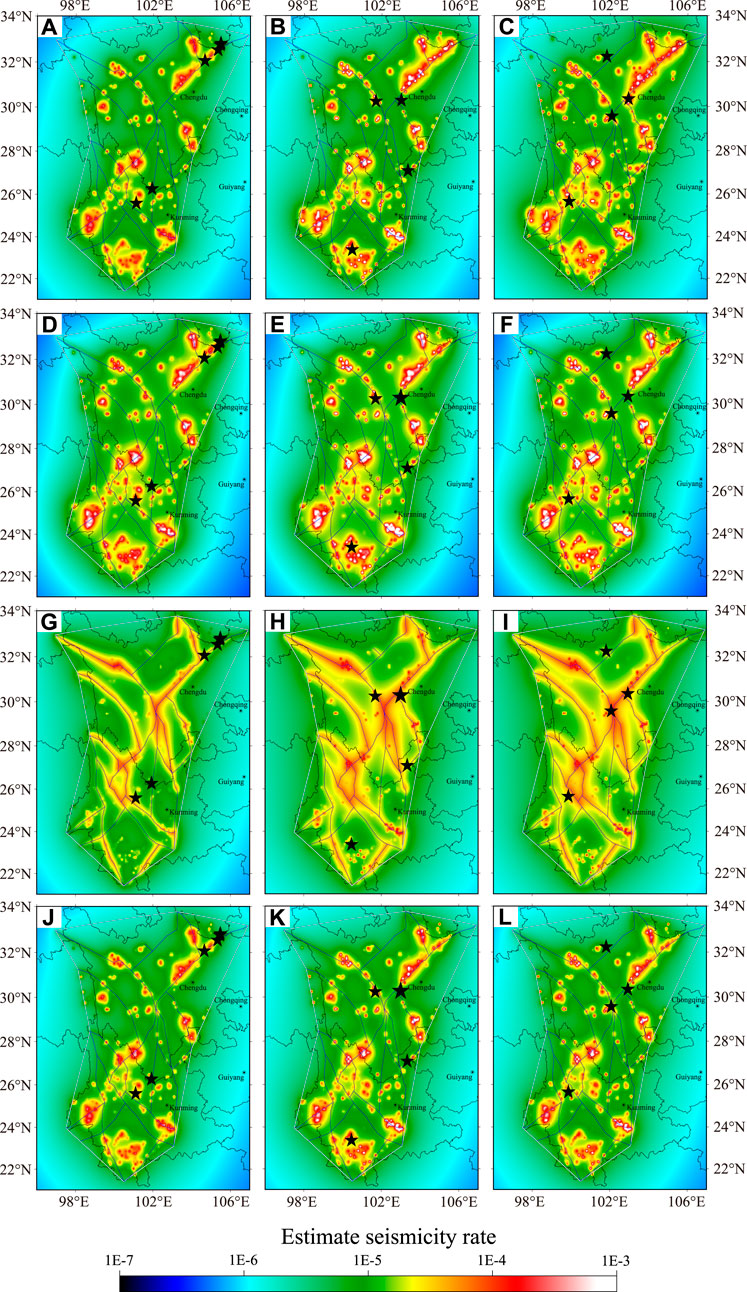
FIGURE 5. Estimated seismicity rate based on cataloged earthquakes and mapped faults, showing results for May 20, 2008 (left), January 1, 2013 (middle), and September 10, 2019 (right, L). (A–C) Spatial variations in estimated seismicity rates. (D–F) Seismicity rate with μ calculated using Eq. 4. Seismicity rate with μ set to (G–I) 0.9 and (J–L) 0.1. The black stars indicate the target earthquakes.
5 Discussion
A hybrid model may underperform in a separate testing period if the seismicity rates that contribute to it are not well correlated with the earthquake locations or if the model is overfitted to a training period in which the seismicity rates are more closely correlated with the earthquake locations than those in the testing period (Rastin et al., 2022). Unaffected by any model fitting, an error diagram is a valuable tool to illustrate the relationship between the seismicity rate and the earthquake occurrence during various time periods and is also commonly used to evaluate earthquake forecast strategies (Molchan, 1991; Zechar and Jordan, 2008).
In this study, we defined the following earthquake forecast strategy: there will likely be earthquakes of MS ≥ 6.0 occurring in the subsequent 3-year period at locations with relatively high seismicity rates based on the PPE, PMF, and PKS models.
The testing region was divided into multiple cells 0.5° × 0.5° in size. The seismicity rate of each cell was assigned the average of all the seismicity rates in the cells. A threshold was then specified and an alarm was generated if the seismicity rate of the cells was higher than the threshold. The fraction of the space-time occupied by the alarm (τ) of the Poisson is defined such that
The fraction of earthquakes missed (ν) is defined such that
where S(i) is the seismicity rate of the ith cell, slevel is the threshold value of the seismicity rate, A(i) is the area of the ith cell, and E(i) is the number of the targeted earthquakes at the ith alarm. We used the area skill score (ASS) and the probability gain to summarize the potential performance of the earthquake forecast strategy. The region above the error diagram inside the unit square, called ASS, serves as a summary of the prospective performance of the seismicity rate in alarm-based earthquake occurrence forecasting (Zechar and Jordan, 2008; Zechar and Jordan, 2010). The diagonal line indicates ASS = 0.5. A positive connection between the seismicity rate and the frequency of earthquakes is denoted by ASS >0.5, while ASS <0.5 denotes a negative correlation (Rhoades et al., 2017). The probability gain (Gain) is defined such that
The sample value of Gain corresponds to the slope of the line connecting (0,1) to (τ, ν), as shown in Figure 6. The diagonal line corresponds to a completely random guess, and Gain = 1. A higher Gain value indicates that fewer cells are needed for the same “hits,” which means better performance of the earthquake forecast strategy.
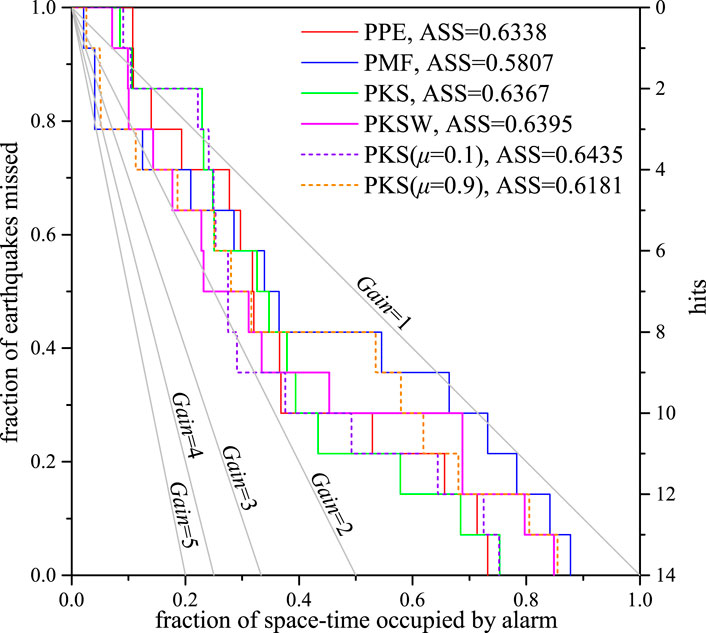
FIGURE 6. Molchan error diagram for the PPE (red curves), proximity-to-mapped-faults (PMF) (blue curves), and proximity-to-known-sources (PKS) models with different weighting schemes (green curves: μ value optimized by maximizing the likelihood function, pink curves: μ value calculated using Eq. 4; short purple and orange dashed curves: μ values manually specified at 0.1 and 0.9) at three different times: May 20, 2008; January 1, 2013; and September 10, 2019. The area skill score (ASS); that is, the area above the error diagram inside the unit square, is used to evaluate the efficiency of the earthquake forecast.
In Section 4, the spatial variation of the estimated seismicity rate under the PPE, PMF, and PKS models was calculated at three dates, May 20, 2008; January 1, 2013; and September 10, 2019. By adjusting the threshold of the seismicity rate from the highest to the lowest, the fraction of the space-time occupied by alarm and alarmed targeted earthquakes was obtained and their correlations are illustrated in a Molchan error diagram, as seen in Figure 6. All 14 targeted earthquakes during the three periods of May 20, 2008–May 20, 2011, January 1, 2013–January 1, 2016, and September 10, 2019–September 10, 2022, are included.
With respect to the individual models, the PPE model slightly outperforms the PMF model in the efficiency of earthquake forecast because the ASS value of the PPE model is higher than that of the PMF model. However, the PMF model has a more informative probability gain than the PPE model because when
As shown in Figure 6, ASSPMF < ASSPPE; therefore, the PPE model is more informative than the PMF model. Meanwhile, ASSPMF < ASSPPE ≈ ASSPKS ≈ ASSPKSW ≈ ASSPKS(μ=0.1), which implies that, when we specify a low value of μ close to zero, the hybrid PKS model outperforms the PMF model in any combination but does not obtain a better forecast efficiency than the PPE model.
In addition, we obtained the performance for the two methods of combining the PMF model with the PPE model. A comparison of the results reveals that, according to the ASS value, there is no obvious difference between the two ensemble methods. However, the combination method in which μ is manually specified has a more informative gain when
6 Conclusion
Predicting the time, location, and magnitude of future seismic events is possible using information from earthquakes in historical and instrumental catalogs and geologically mapped active faults, as proven in multiple studies (Rhoades and Stirling, 2012; Rhoades et al., 2015). In the present study, we applied the PPE and PMF models to fit the seismicity in the Sichuan-Yunnan region in China. Using the optimized parameters, we estimated the seismicity rates of the PPE and PMF models at three different times: May 20, 2008; January 1, 2013; and September 10, 2019. Retrospective synthetic testing has consistently shown that both independent and hybrid models can provide informative forecasts (Rhoades and Gerstenberger, 2009; Bayona et al., 2022). Next, we introduced the PKS model proposed by Rhoades and Stirling (2012) to fit the seismicity and to calculate the seismicity rate for the same dates using the PPE and PMF models. Finally, we collected the earthquakes with MS 6.0+ in the test region during three time periods, May 20, 2008–May 20, 2011, January 1, 2013–January 1, 2016, and September 10, 2019–September 10, 2022, as target events for prospective testing. The Molchan error diagram method was used to evaluate the model performances with respect to earthquake forecasts. Based on our results, our main conclusions are as follows.
(1) The PPE, PMF, and PKS models show better forecast efficiency with respect to moderate earthquakes compared to a homogeneous Poisson distribution in the Sichuan-Yunnan test region. While the PPE model is straightforward, its earthquake forecast ability is significant. In some cases, the PMF model has a more informative probability gain than the PPE model when
(2) The forecast efficiencies differed due to discrepancies in the prior information or precursors related to the earthquakes and active tectonic setting. The PMF model, which is derived from the time-independent slip rate of the active faults, represents features that are expected to affect the earthquake occurrence over a long-time frame. The results of the PMF model are also affected by the intrinsic incompleteness of the fault database (e.g., Basili et al., 2013), especially any unknown faults in the test region. However, it is impossible to obtain all of the existing faults. The missed earthquakes; e.g., the MS 6.6 Jinggu earthquake, may have occurred in the vicinity of an unknown fault. Moreover, some large earthquakes can produce higher scaling co-seismic ruptures equal to thousands of times the slip displacement in a single year. The highest slip displacement, that of the MS 8.0 Wenchuan earthquake, was 12–15 m (Li et al., 2009), located at Beichuan, where three aftershocks occurred that were missed in the forecast by the PMF model. The unsatisfactory performance of the PMF model may lie both in the incompleteness of the fault database and in the lack of consideration of co-seismic ruptures.
(3) The hybrid PKS model can incorporate information from the PPE and PKS models and consequently maintained the best performance over the three testing epochs. This is consistent with previous studies of hybrid short-, medium-, and long-term components (Rhoades et al., 2016; Christophersen et al., 2017; Rhoades et al., 2017). The key point may be that the hybrid model obtains a variety of strengths from the component in ways that other components do not. However, the PKS model, given any method of combination, did not outperform the PPE model, possibly due to the poor efficiency of the PMF model.
(4) Comparisons of the methods of hyper-parameter optimization in which the seven parameters are fit by maximizing the likelihood function, calculating the value of μ based on the linear function of magnitude, or by specifying the value of μ showed an efficiency difference in the PKS model performance. In particular, the optimization method with a manually specified μ potentially obtained a good informative gain for some particular seismic events, which implies that the earthquake forecast strategy could be adjusted using an appropriate specified threshold in the test region.
The retrospective tests in our study also had limitations; for instance, the earthquake forecast strategy was originally designed for a specified 3-year interval. The performance may change somewhat when applied to other periods because of the degree of time dependence in the data used to generate the models. In addition, we did not account for location uncertainties when estimating the seismicity rates of the three models. Because we calculated their seismicity rates on a rather coarse grid of 0.1° × 0.1° cells, location errors can naturally be accommodated without significantly affecting the correlation with the earthquake locations (Rastin et al., 2022).
The Sichuan-Yunnan region is one of the most active seismic regions on the Chinese mainland, and various spatial parameters carrying different types of information have been used to analyze the seismic activity. The PPE model, which is straightforward, has good forecast efficiency and can be used as a base model to evaluate the effectiveness of various earthquake forecast methods. Moreover, the results of our study indicate that an approach to earthquake forecasting that is model-driven and hyper-parameter controlled could be a promising means to implement operational earthquake forecasting.
Data availability statement
The data analyzed in this study is subject to the following licenses/restrictions: The datasets used and/or analyzed during the current study are available from the corresponding author upon reasonable request. Requests to access these datasets should be directed to Y2hlbnNoaUBjZWEtaWdwLmFjLmNu.
Author contributions
Study conception and design: SC and BoZ. Manuscript drafting: BoZ and SC. Data acquisition: SC and XW. Data interpretation: BoZ, SC, JZ, BeZ, XW, and BL. Manuscript revision critically for important intellectual content: JZ and SC.
Funding
This study was funded by the National Key R&D Program of China (2017YFC1500503) and the National Natural Science Foundation of China (U1839207 and U1939205).
Acknowledgments
The authors acknowledge the Second Monitoring and Application Center (TSMAC) and the China Earthquake Networks Center (CENC) for providing the data used in this study.
Conflict of interest
The authors declare that the research was conducted in the absence of any commercial or financial relationships that could be construed as a potential conflict of interest.
Publisher’s note
All claims expressed in this article are solely those of the authors and do not necessarily represent those of their affiliated organizations, or those of the publisher, the editors, and the reviewers. Any product that may be evaluated in this article, or claim that may be made by its manufacturer, is not guaranteed or endorsed by the publisher.
References
Basili, R., Kastelic, V., Demircioglu, M. B., Garcia Moreno, D., Nemser, E. S., Petricca, P., et al. (2013). The European database of seismogenic faults (EDSF) compiled in the framework of the Project SHARE. Strasbourg, France: The European-Mediterranean Seismological Centre(EMSC). doi:10.6092/INGV.IT-SHARE-EDSF
Bayona, J. A., Savran, W. H., Rhoades, D. A., and Werner, M. J. (2022). Prospective evaluation of multiplicative hybrid earthquake forecasting models in California. Geophys. J. Int. 229, 1736–1753. doi:10.1093/gji/ggac018
Bird, P., Jackson, D. D., Kagan, Y. Y., Kreemer, C., and Stein, R. S. (2015). GEAR1: A global earthquake activity rate model constructed from geodetic strain rates and smoothed seismicity. Bull. Seism. Soc. Am. 105 (5), 2538–2554. doi:10.1785/0120150058
Christophersen, A., Rhoades, D. A., Gerstenberger, M. C., Bannister, S., Becker, J., Potter, S. H., et al. (2017). “Progress and challenges in operational earthquake forecasting in New Zealand,” in New Zealand Society for Earthquake Engineering Annual Technical conference, Wellington, New Zealand, April, 2017, 27–29.
Gerstenberger, M. C., McVerry, G. H., Rhoades, D. A., and Stirling, M. W. (2014). Seismic hazard modeling for the recovery of christchurch. Earthq. Spectra. 30 (1), 17–29. doi:10.1193/021913eqs037m
Gerstenberger, M. C., and Rhoades, D. A. (2010). New Zealand earthquake forecast testing centre. Pure Appl. Geophys. 167, 877–892. doi:10.1007/s00024-010-0082-4
Gerstenberger, M., Wiemer, S., Jones, L. M., and Reasenberg, P. A. (2005). Real-time forecasts of tomorrow’s earthquakes in California. Nature 435, 328–331. doi:10.1038/nature03622
Gutenberg, B., and Richter, C. (1944). Frequency of earthquakes in California. Bull. Seismol. Soc. Am. 34 (4), 185–188. doi:10.1785/bssa0340040185
Herrera, V. M. V., Rossello, E. A., Orgeira, M. J., Arioni, L., Soon, W., Velasco, G., et al. (2022). Long-term forecasting of strong earthquakes in north America, south America, Japan, southern China and northern India with machine learning. Front. Earth Sci. 10, 905792. doi:10.3389/feart.2022.905792
Hiemer, S., Jack, D. D., Wang, Q., Kagan, Y. Y., Woessner, J., Zechar, J. D., et al. (2013). A stochastic forecast of California earthquakes based on fault slip and smoothed seismicity. Bull. Seism. Soc. Am. 103 (2A), 799–810. doi:10.1785/0120120168
Jackson, D. D., and Kagan, Y. Y. (1999). Testable earthquake forecasts for 1999. Seismol. Res. Lett. 70 (4), 393–403. doi:10.1785/gssrl.70.4.393
Kagan, Y. Y., and Jackson, D. D. (1994). Long-term probabilistic forecasting of earthquakes. J. Geophys. Res. 99, 13685–13700. doi:10.1029/94jb00500
Li, H. B., Si, J. L., Fu, X. F., Qiu, Z. L., Li, N., Woerd, J. V., et al. (2009). Co-seismic rupture and maximum displacement of the 2008 Wenchuan earthquake and its tectonic implications. Quat. Sci. 29 (3), 387–402.
Marti, M., Stauffacher, M., and Wiemer, S. (2019). Difficulties in explaining complex issues with maps: Evaluating seismic hazard communication-the Swiss case. Nat. Hazards Earth Syst. Sci. 19 (12), 2677–2700. doi:10.5194/nhess-19-2677-2019
Molchan, G. M. (1991). Structure of optimal strategies in earthquake prediction. Tectonophysics 193, 267–276. doi:10.1016/0040-1951(91)90336-q
Ogata, Y. (1998). Space-time point process models for earthquake occurrences. Ann. Inst. Stat. Math. 50, 379–402. doi:10.1023/a:1003403601725
Ogata, Y. (1988). Statistical models for earthquake occurrences and residual analysis for point processes. J. Am. Stat. Assoc. 83, 9–27. doi:10.1080/01621459.1988.10478560
Rastin, S. J., Rhoads, D. A., Rollins, C., and Gerstenberger, M. C. (2022). How useful are strain rates for estimating the long-term spatial distribution of earthquakes? Appl. Sci. 12, 6804. doi:10.3390/app12136804
Rhoades, D. A. (2007). Application of the EEPAS model to forecasting earthquakes of moderate magnitude in southern California. Seismol. Res. Lett. 78, 110–115. doi:10.1785/gssrl.78.1.110
Rhoades, D. A., Christophersen, A., and Gerstenberger, M. C. (2015). Multiplicative earthquake likelihood models based on fault and earthquake data. Bull. Seism. Soc. Am. 105 (6), 2955–2968. doi:10.1785/0120150080
Rhoades, D. A., Christophersen, A., and Gerstenberger, M. C. (2017). Multiplicative earthquake likelihood models incorporating strain rates. Geophys. J. Int. 208, ggw486–1774. doi:10.1093/gji/ggw486
Rhoades, D. A., and Evison, F. F. (2004). Long-range earthquake forecasting with every earthquake a precursor according to scale. Pure Appl. Geophys. 161, 47–72. doi:10.1007/s00024-003-2434-9
Rhoades, D. A., and Evison, F. F. (2005). Test of the EEPAS forecasting model on the Japan earthquake catalogue. Pure Appl. Geophys. 162, 1271–1290. doi:10.1007/s00024-004-2669-0
Rhoades, D. A., and Gerstenberger, M. C. (2009). Mixture models for improved short-term earthquake forecasting. Bull. Seism. Soc. Am. 99 (2A), 636–646. doi:10.1785/0120080063
Rhoades, D. A., Liukis, M., Christophersen, A., and Gerstenberger, M. C. (2016). Retrospective tests of hybrid operational earthquake forecasting models for Canterbury. Geophys. J. Int. 204 (1), 440–456. doi:10.1093/gji/ggv447
Rhoades, D. A. (2013). Mixture models for improved earthquake forecasting with short-to-medium time horizons. Bull. Seism. Soc. Am. 103 (4), 2203–2215. doi:10.1785/0120120233
Rhoades, D. A., and Stirling, M. W. (2012). An earthquake likelihood model based on proximity to mapped faults and cataloged earthquakes. Bull. Seism. Soc. Am. 102 (4), 1593–1599. doi:10.1785/0120110326
Schorlemmer, D., Werner, M. J., Marzocchi, W., Jordan, T. H., Ogata, Y., Jackson, D. D., et al. (2018). The collaboratory for the study of earthquake predictability: Achievements and priorities. Seismol. Res. Lett. 89, 1305–1313. doi:10.1785/0220180053
Shen, Z. K., Sun, J. B., Zhang, P. Z. H., Wan, Y. G., Wang, M., Bürgmann, R., et al. (2009). Slip maxima at fault junctions and rupturing of barriers during the 2008 Wenchuan earthquake. Nat. Geosci. 2 (10), 718–724. doi:10.1038/ngeo636
Xiong, Z. Y., Zhuang, J. C., Zhou, S. H. Y., MitsuhiroHao, M., and Wang, Q. L. (2021). Crustal strain-rate fields estimated from GNSS data with a Bayesian approach and its correlation to seismic activity in Mainland China. Tectonophysics 815, 229003. doi:10.1016/j.tecto.2021.229003
Zechar, J. D., and Jordan, T. H. (2008). Testing alarm-based earthquake predictions. Geophys. J. Int. 172 (2), 715–724. doi:10.1111/j.1365-246x.2007.03676.x
Keywords: earthquake catalog, Molchan error diagram, statistical evaluation, earthquake forecast, active fault
Citation: Zhang B, Chen S, Zhuang J, Zhang B, Wu X and Liang B (2023) Statistical evaluation of earthquake forecast efficiency using earthquake-catalog and fault slip rate in the Sichuan-Yunnan region, China. Front. Earth Sci. 11:1091408. doi: 10.3389/feart.2023.1091408
Received: 07 November 2022; Accepted: 23 January 2023;
Published: 15 February 2023.
Edited by:
Fuqiong Huang, China Earthquake Networks Center, ChinaReviewed by:
Lingyuan Meng, China Earthquake Networks Center, ChinaYufang Rong, FM Global Research, United States
Copyright © 2023 Zhang, Chen, Zhuang, Zhang, Wu and Liang. This is an open-access article distributed under the terms of the Creative Commons Attribution License (CC BY). The use, distribution or reproduction in other forums is permitted, provided the original author(s) and the copyright owner(s) are credited and that the original publication in this journal is cited, in accordance with accepted academic practice. No use, distribution or reproduction is permitted which does not comply with these terms.
*Correspondence: Shi Chen, Y2hlbnNoaUBjZWEtaWdwLmFjLmNu