 Svein Vagle
 Eddy Carmack
95% of researchers rate our articles as excellent or good
Learn more about the work of our research integrity team to safeguard the quality of each article we publish.
Find out more
ORIGINAL RESEARCH article
Front. Earth Sci. , 21 February 2023
Sec. Hydrosphere
Volume 11 - 2023 | https://doi.org/10.3389/feart.2023.1090124
François Lake is a long, deep, seasonally ice-covered, dimictic lake set in an east-west orientation in mid-British Columbia. As a baseline we here present data from a full-depth temperature mooring deployed at the lake’s mid-point in 2004–2005 and one full-depth conductivity-temperature-depth cast. We use these temperature records to define lake stability, scales of motion and the annual cycle of thermal stratification, mixing and deep-water ventilation. Owing to its length (110 km) both the Wedderburn and Lake numbers—indices of thermocline tilt and mixing under wind forcing—transition through critical values during fall and spring seasons, suggesting thermocline outcropping and strong turbulent mixing within the thermocline at these times. Owing to its depth (240 m) the decreasing temperature of maximum density (TMD) with depth (thermobaric effect) adds complexity to overturn events. Owing to its seasonal ice cover (2–3 months per year) the critical period for effective fall ventilation occurs before ice formation and concurrent wind shielding, while that of spring ventilation lies between the dates that the ice cover melts and the lake surface water warms above 4°C. While the lake undergoes full depth ventilation in both fall and spring, we show that both progress in distinct dynamical stages. Fall ventilation is more efficient than that of spring, and the transition temperature and resulting bottom temperature from fall to winter stratification (positive to inverse) and winter to spring stratification (inverse to positive) lies close to the temperature of maximum density calculated for the maximum depth of free and forced convection (in this case, closer to 3.7°C).
Western Canada, has 15 or more dimictic lakes deeper than 200 m, many of which are seasonally ice covered. Yet despite the ecological, economic, social, cultural and esthetic value of deep, cold-water lakes, an insufficient number of studies focus on their basic physical limnology, which we hold to be essential knowledge for responsible management and protection under human activities and climate warming. François Lake, a long (110 km), deep (240 m), seasonally ice-covered (typically 2–3 months per year), long residence time (∼35 years) dimictic lake at an elevation of 715 m in the Cordilleran geological domain of central British Columbia, is one such lake (Figure 1).
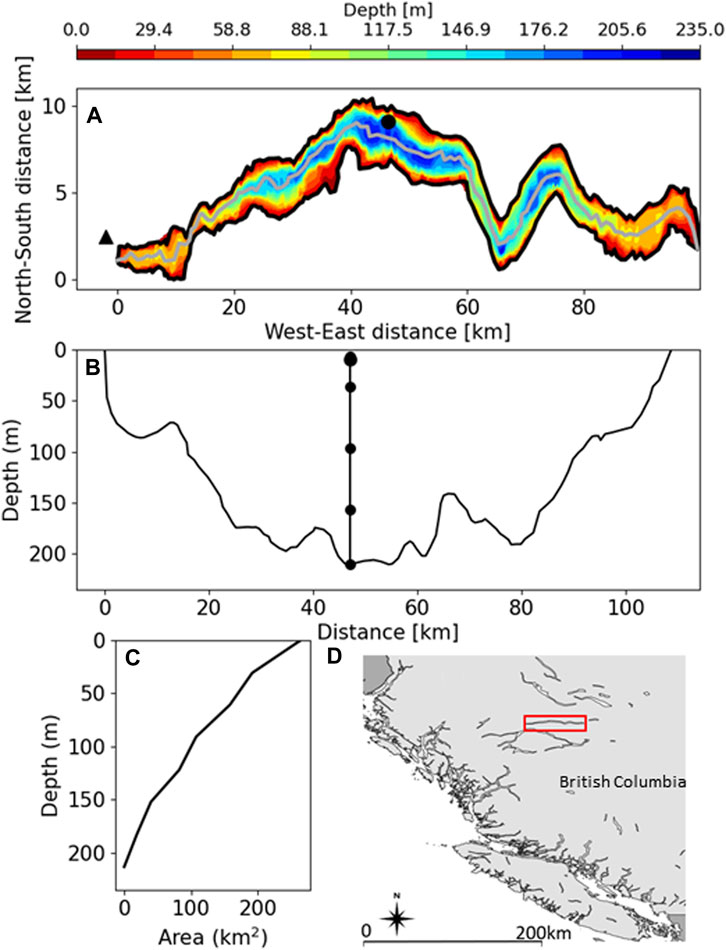
FIGURE 1. François Lake (A) Bathymetry of the lake at length-to-width aspect of roughly 1:2.5, and showing the location of the mooring (black circle) and meteorological station (black triangle) (B) depth profile along thalweg including mooring array (C) hypsographic curve, and (D) showing the location of the lake in British Columbia (red rectangle).
Of fundamental importance to lakes is their seasonal pattern of stratification (the vertical layering of water bodies) and ventilation (the convective renewal of subsurface waters), for they jointly constrain the internal redistribution of heat, nutrients and dissolved oxygen (see reviews by Boehrer and Schultze, 2008; Bouffard and Wüest, 2019). It is usually assumed that dimictic lakes convectively mix from top to bottom when the lake surface temperature cools (fall) or warms (spring) through ∼4°C, the temperature of maximum density (TMD) at surface pressure. However, bottom temperatures in most deep, temperate-latitude lakes reveal more complex features, and many remain below ∼4°C throughout the year (Johnson 1966; Carmack and Vagle, 2021). This is because deep layers are made stable by the fact that TMD decreases with depth at a rate of 0.021°C per 100 m (Eklund, 1965). In addition, Boehrer et al. (2013) found a correlation between lake length and bottom temperature; the greater the lake’s length the colder the bottom temperatures, so that the longitudinal dimension of a lake is also a decisive for the bottom temperatures.
That water colder than 4°C at the surface can convectively displace 4°C below to initiate ventilation was noted by Johnson (1966), who, recognized that if cold upper layer water is forced downwards to a depth where its temperature crosses the TMD curve it will become unstable and sink. Farmer and Carmack (1981) described the winter onset of inverse stratification (Tsurf < 4°C) when wind mixing is opposed by the positive buoyancy flux associated with lake waters cooling, and showed that an inverse stratified lake will be made conditionally unstable if the interface at the base of the cold, upper mixed layer is forced to a depth where its temperature matches that of maximum density at that depth. Above this depth, the interface is stable and the wind must work against buoyancy during cooling; below this depth, the interface becomes gravitationally unstable and free convection occurs. This process is termed a thermobaric instability, and has been proposed as the ventilation mechanism in other deep lakes (Carmack & Weiss, 1991; Weiss et al., 1991; Crawford & Collier, 1997; 2007; Wüest et al., 2005; Schmid et al., 2008; Laval et al., 2012; Boehrer et al., 2013; Tsimitri et al., 2015; Carmack and Vagle, 2021). Of especial importance to the annual cycle of deep, dimictic lakes is whether or not an ice cover forms annually, as this limits the time and intensity of direct wind forcing. The morphometric constraints of depth and size are discussed in detail by Yang et al. (2020) and reiterated below.
To our knowledge, only one report referring to the physical limnology of François Lake has been published in the open literature, and this only used a reduced portion of the data reported here (temperature vertically averaged over the upper 60 m) to place the lake in the context of a latitudinal climate gradient for cordilleran lakes in western Canada (Carmack et al. 2014). We here use the full data set from François Lake and examine the consequences of three specific features: that it is long and narrow (length ∼110 km; mean width ∼2 km), that it is deep (maximum depth = 240 m) and that it has (now at least) a seasonal ice cover; the latter being subject to change under climate warming.
In late summer, 2004, we hand-deployed a full-depth, temperature-logger mooring from a 13-foot rigid hull inflatable boat near the deepest spot in the lake. These five sensors (described below) were attached individually to a 3/8” polypropylene rope between the bottom 100 kg junk-iron anchor and the sub-surface floatation buoy. At the same time, we lowered a CTD profiler to full depth. In August 2005 we returned and recovered the mooring by lassoing the subsurface float. Admittedly, this is a sparse data set for a lake of this size and depth; our purpose, however, is to demonstrate that much can be learned from an inexpensive data set about annual patterns of circulation and mixing that can then serve as a baseline for subsequent biogeochemical or management applications.
The bathymetry, thalweg depth profile, and hypsographic curve of François Lake are shown in Figure 1. The lake drains at its east end into the Stellako River, a tributary to the Fraser River, with a mean annual flow of 20.1 m3s-1 (∼0.65 km3yr-1), yielding a bulk residence time of ∼35 years (Westenhofer et al. 2000). The winter minimum flow is 2 m3s-1, and the summer maximum flow is 183 m3s-1 (this flow, averaged through a 2 km wide by 10 m deep riverine cross-lake section, yields an equivalent riverine interflow velocity of approximately 1 cm-1; small, but still about 1 km day-1 so, hypothetically, a parcel of river water entering the west end would take about 100 days to transit the lake).
Temperature time-series were obtained using a full-depth mooring consisting of four RBR TR-1050 internally recording thermistors at nominal depths of 36.5, 96.5, 156.5 and 232.5 m, each with a resolution of 0.001°C and an accuracy of ± 0.003°C. A RBR TDR-2050, which also recorded depth with a resolution of 0.5 cm and accuracy of 0.2 m, was positioned at the shallowest depth (6.5 m) to detect changes in lake surface level as well as temperature. Measurements were recorded at 10-min intervals throughout the year. The mooring was deployed on 7 August 2004 at 54.04757 N 125.7937 W and recovered on 30 August 2005. A Seabird-19 + CTD, with a temperature, T, resolution of 0.001°C and an accuracy of ± 0.003°C, and conductivity (specific conductance), κ, data with an accuracy of + 0.002 μS cm-1 was used to vertically profile the full depth of the lake next to the mooring directly following mooring deployment on 7 August 2004. A crude measure of salinity is the total dissolved solids (TDS) (Pawlowicz and Feistel, 2012). This can be calculated by temperature correcting κ to a reference temperature of 25°C (Clesceri et al. 1998), using:
and relating κ25 to TDS and salinity using Salinity = 0.75* κ25/(μS cm-1) (Pawlowicz and Feistel, 2012).
Meteorological data was obtained from British Columbia Government climate data set portal using station 1741 under network FLNRO-WMS located near the West end of the lake (53.9867N 126.5217W) (https://data.pacificclimate.org/portal/pcds/map/) (Figure 1). No meteorological data are available between December 19 and 31, 2004. Dates of ice formation and ice break-up were visually determined using NASA Worldview EOSDIS imagery.
Figures 2A–D show wind speed at a height of 10 m (U10), and the air-temperature from the meteorological station near the west end of the lake, the water temperature from the top thermistor at a nominal depth of 6.5 m, and the actual depth of the upper sensor, respectively. Dates of full or partial ice cover are shown by horizontal bars above the water temperature and lake level data. Freeze-up began on 2 January 2005, and the lake was ice free sometime between 19—27 April 2005; a total of approximately 110 days. Note, however, that ice on François Lake is relatively thin, and thus subject to intermittent break-up and re-formation throughout winter. In addition, a track across the lake near mid-lake is kept open to allow ferry crossings, except in the coldest weather. Brief periods of open water at the ends of the lake were also observed, perhaps related to upwelling events. Large variations in the dates of freeze-up and break-up are expected from year-to year.
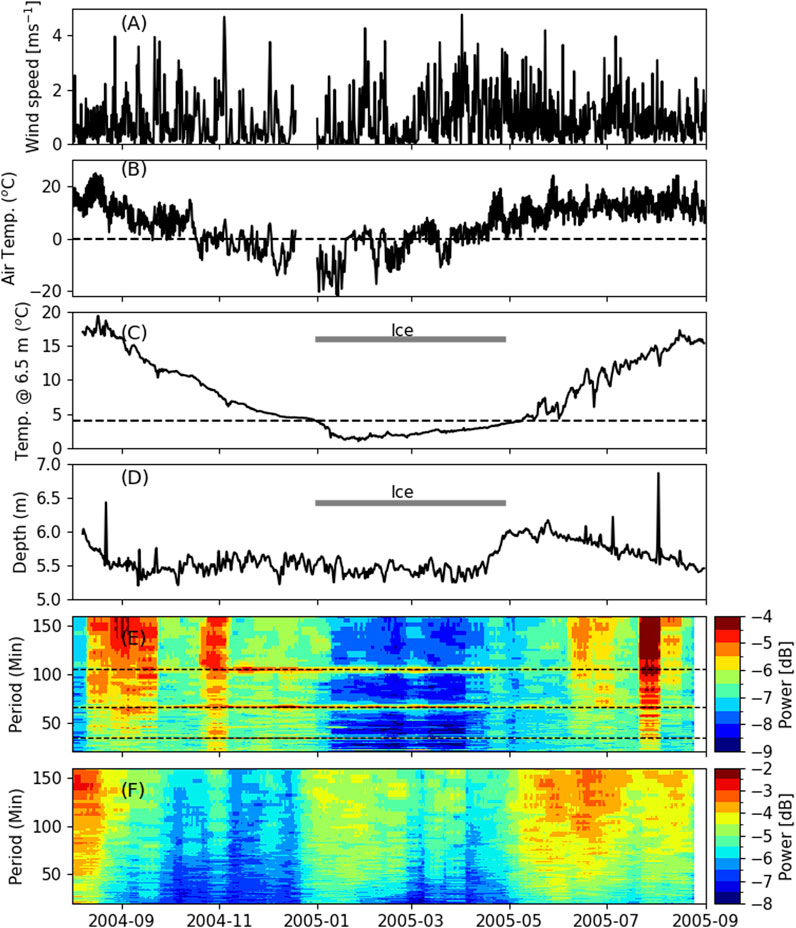
FIGURE 2. (A) Wind speed at 10 m (U10) (B) air temperature (C) lake temperature at top of mooring (D) depth of top thermistor. All these data are shown with daily running means. The period when ice was detected from satellite pictures (grey horizontal lines in (C, D)), temperature of maximum density at the surface (4°C) (horizontal dashed line in (C)) and freezing temperature (0°C) (horizontal dashed line in (B)) are also shown (E) Spectrograms of depth, and (F) spectrograms of upper thermistor signal. The horizontal dashed lines in (E) indicate periods of 34, 66, and 105 min representing seiche periods.
The lake’s internal response to external forcing, as indicated by pressure fluctuations is indicated by the spectrograms in Figure 2E wherein signal power (in dB) is plotted versus frequency (shown as period in minutes). The spectra were calculated over a 14-day period using 512-point Fast Fourier Transform (FFTs). These FFTs were calculated every day by shifting the input time series by 144 points for every time step to give the smoothed results shown in Figure 2E. These observed depth sensor variations are likely due to wind-forced, upper-layer currents and internal seiching, causing the mooring to tilt. These fluctuations are always strongest during ice free conditions, almost absent during the ice-covered period, and greater at lower frequencies. Significantly, three narrow bands, at ∼ 105, ∼66, and ∼34 min persist throughout the year; each is close to the first three internal seiche nodes computed from Merian’s formula (Figure 2E; Table 1).
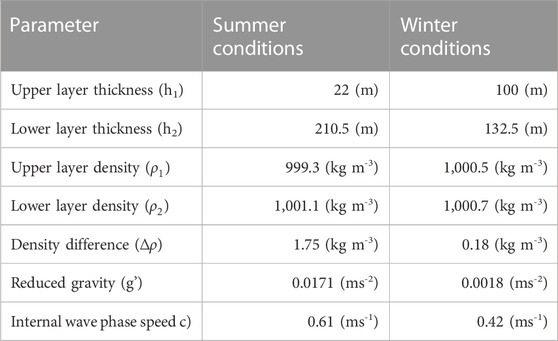
TABLE 1. Lake diagnostics comparing summer and winter conditions in François Lake. The parameters were calculated from the temperature, conductivity profile on 7 August 2004 for the summer conditions and using the mooring data on 12 January 2005 for the winter conditions.
Similar spectrograms were calculated for the upper temperature sensor (6.5 m nominal depth) (Figure 2F). The observed temperature fluctuations are especially high in the summer and early fall period of strong stratification and weak during later fall as stratification decreases during overturn, and moderate during the winter period of inverse stratification.
The conductivity-temperature-depth (CTD) profile obtained on 7 August 2004, near the time of maximum surface temperature, is shown in Figure 3A, B at both full and expanded temperature and salinity scales; salinity is reported as mg kg-1. Also shown is a winter temperature profile, constructed form the moorings data on 12 January 2005, near the time of minimum heat content. These profiles are used later to calculate representative scales of motion (Section 3.5). The profile representing the temperature of maximum density (TMD) is shown as a dashed line. At this time near-surface temperatures are approximately 18°C while bottom temperatures are near 3.87°C. The corresponding T/S correlation plots with isolines of density at the surface and at a depth of 200 dbars are shown in Figures 3C, D respectively. Comparing this profile to the mooring data we note that sensors at 6.5 and 36.5 m approximate the upper and lower boundaries of the mid-summer thermocline. Values of S range from roughly 62 mg kg-1–89.2 mg kg-1, appear to serve as a useful trace of river throughflow, and reveal very weak vertical structure below approximately 50 m. T/S correlations show the joint effects of T and S on density. From Figures 3C, D we also conclude that while weak salinity gradients are present, they are unlikely to constrain whole lake ventilation and deep-water renewal. Small gradients may, however, be significant in the hypolimnion near T=TMD where the thermal expansion coefficient is near zero.
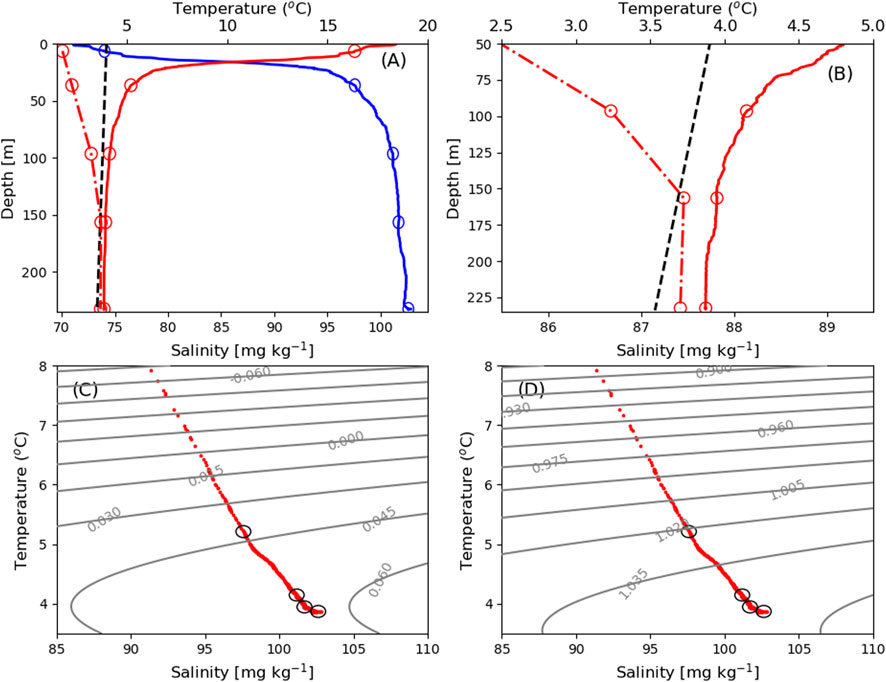
FIGURE 3. (A) Temperature, T (solid red) and salinity, S (blue) from CTD cast in position 54.04757 N 125.7937 W on 7 August 2004 from surface to bottom and a winter temperature profile, constructed form the mooring data on 12 January 2005 (dash dot red) (B) T and S at expanded scale. T/S correlation at full scale with isolines of σ-t (density-1000 in kg m-3) calculated for 0 dbar (C), and for 200 dbar (D). Temperature of maximum density (TMD) is shown as dashed line in (A) and (B).
Annual patterns of stratification and mixing are critical determinants for both the phasing and rates of geochemical and biological processes. The temperature data collected by the full depth mooring was plotted for both the annual cycle at full temperature scale (Figure 4A), at expanded temperature scales (Figure 4B), at expanded temperature scales for deep waters only (Figure 4C) and for T—TMD (Figure 4D). Visual inspection of these plots confirms that (1) the lake is, indeed, dimictic with surface temperatures cooling through 4°C in late December and warming through 4°C in early April (Figure 4A); 2) deep waters remain below 4°C throughout most of the year except for a period of approximately 100 days in the first phase of fall overturn (Figure 4B); 3) much greater temperature changes in deep waters are observed during fall overturn (∼0.8°C) than during spring overturn (∼0.2°C), indicating stronger deep water renewal (Figure 4C); and 4) throughout winter the zero crossing waters above 96.5 m have negative T—TMD values while waters below 156.5 m have positive T—TMD values, the T—TMD = 0 crossing being a signature of thermobaric stratification in deep waters (Figure 4D).
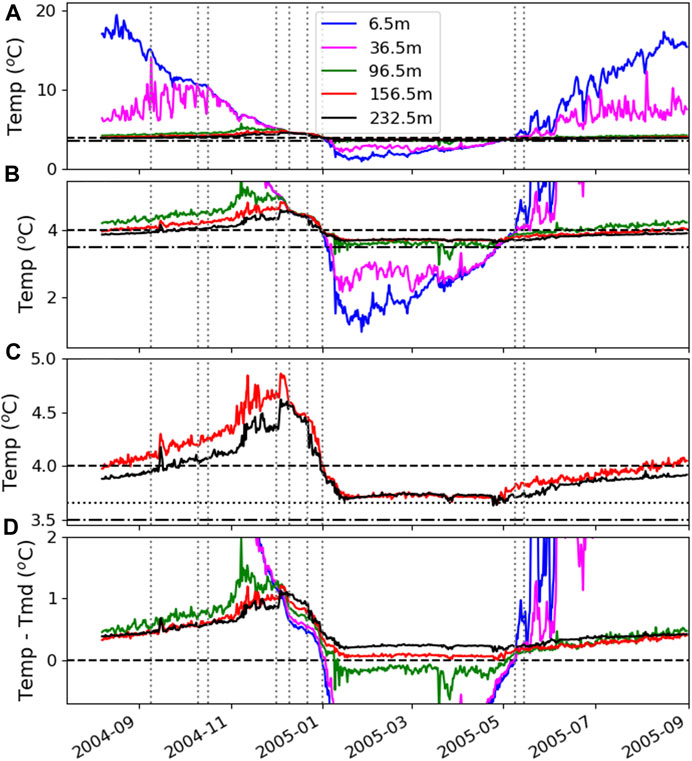
FIGURE 4. Temperatures (T) versus time measured at 5 depths in François Lake (solid lines) for T at full scale (A) and T at expanded scale (B) and at expanded scale for only the two deepest sensors (C) (D) Shows expanded scale for T-TMD at each depth. Horizontal dashed lines indicate a temperature of 4 °C and 0°C, dashed-dot lines indicate TMD at 232.5 m and dotted line TMD at 156.5 m. The vertical dotted lines indicate important dates discussed in text (9 September 2004, 10 October 2004, 17 October 2004, 1 December 2004, 10 December 2004, 22 December 2004, 1 January 2005, 9 May 2005 and 15 May 2005) as reference (All these data are shown with daily running means.).
It is useful to discuss fall convection and ventilation as progressing in terms of structures occurring in two distinct stages wherein differing processes dominate. Stage one of fall overturn (Figure 5A) was marked by mixed layer deepening, reduced stratification, increased amplitude of temperature fluctuations related to internal seiching, and progressive warming of deep waters as heat is entrained downwards. On 18 August 2004, lake temperatures at 6.5 m reached an annual maximum temperature of 19.5°C, and afterwards began to cool at an average rate of 0.2°C day-1. At the same time, lower thermocline waters at 36.5 m began to warm as surface waters progressively mixed downwards and were entrained in deeper layers. Between early September and mid-October large internal temperature fluctuations of 4–6°C infered correspondingly large internal seiches, with periods of 6—8 days, within the thermocline at 36.5 m. Near-surface temperatures merged with those at 36.5 m on 9 and 11 September and again on 10 October. These oscillations were characterized by broad crests and narrow troughs, with imbedded waves of shorter period, characteristic of non-linear internal surges (cf. Farmer, 1978). On 17 October the upper mixed layer deepened past 36.5 m and together these layers cooled at a near constant rate of approximately 0.1°C d-1. Continued downward warming by entrainment reached 96.5 m on 1 December. This was followed sequentially by downward entrainment and warming reaching waters at 156.5 m by 4 December, and waters at 232.5 m on 8 December. Between 1 November and 8 December, the mixed surface layer of the lake cooled at an average rate of 0.07°C day-1 while bottom waters warmed by approximately 0.5°C.
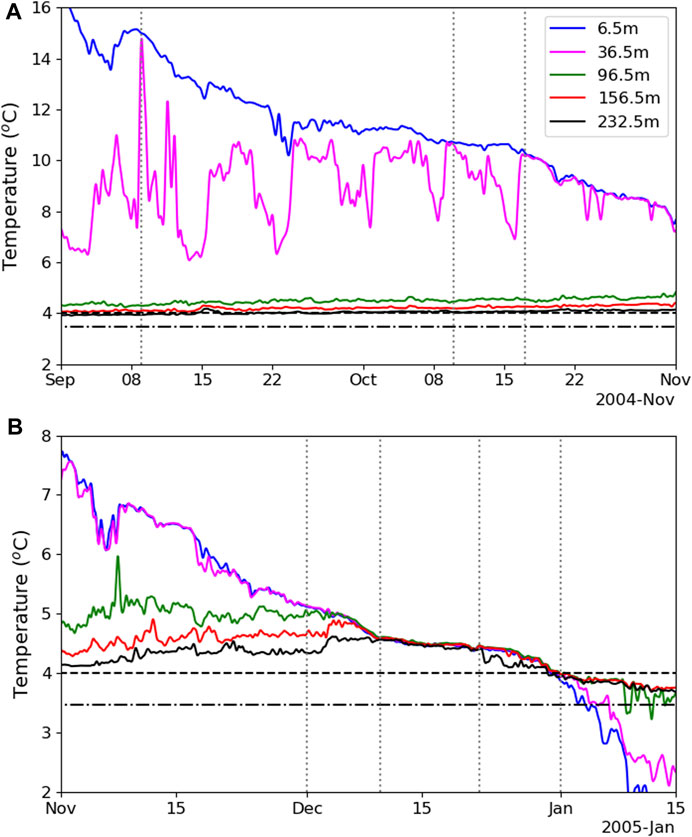
FIGURE 5. Details of Fall ventilation for two periods in 2004 (A) and 2004–2005 (B) showing temperatures versus time measured at 5 depths (solid lines). Dashed horizontal lines indicate a temperature of 4°C while the dash-dotted lines indicate TMD at 232.5 m. The vertical dotted lines indicate important dates discussed in text (1 December 2004, 10 December 2004, 22 December 2004, and 1 January 2005) as reference (All these data are shown with daily running means.).
Stage two of Fall overturn (Figure 5B) began on 8 December when water at all depths attained the same temperature (to within 0.075°C) at a temperature of approximately 4.5°C in the entire water column. Then, between 10 December and 22 December, the full water column cooled at an average rate of 0.02°C day-1, and on 01 January the temperature at 6.5 m passed through 4°C. During this period the water column was well-mixed, cooling uniformly, and no internal structure is observed.
Winter stratification (see Figure 4) began on 1 January as the lake entered inverse stratification (temperatures increasing with depth). This occurred initially when surface waters (6.5 m) reached 4°C, but then later and progressively with depth at lower temperatures. Bottom temperatures (232.5 m) reached approximately 3.7°C in mid-January and then remained at this temperature until early April. This initial interval was also accompanied by relatively large internal waves developing at 96.5 m, with temperature fluctuations of ∼0.5°C and periods of about 1 day.
At this time waters below 156.5 m remained above 3.7°C, the TMD at that depth, while waters above at 96.5 m cooled below 3.7°C, indicative of thermobaric stratification during the winter season. Also, a faint mesothermal temperature maximum of order 0.02°C formed at 156.5 m but was erased by mixing by 17 January, evidence that deep ventilation is in part constrained by thermobaric processes; that is, the near-bottom waters are possibly cooled by lateral intrusions emanating from lake boundaries where downwelling can occur (cf. Carmack and Vagle, 2021). Deep and bottom temperatures then remain relatively constant until 1 May. Maximum winter stratification in the upper layers developed by the end of January.
As in fall, two stages of spring ventilation and re-stratification are noted (Figures 6A, B). The first stage began in early February when temperatures at 6.5 m rose slowly, evidence of warming by solar radiation, while temperatures at 36.5 m remained constant until crossed by those at 6.5 m in late March. Warming continued progressively from the surface downwards throughout April, with solar driven, diurnal fluctuations of about 0.1°C coupling waters at 6.5 and 36.5 m. Progressive warming continued and around 1 May the full water column merged at 3.7°C, signaling the end of winter inverse stratification.
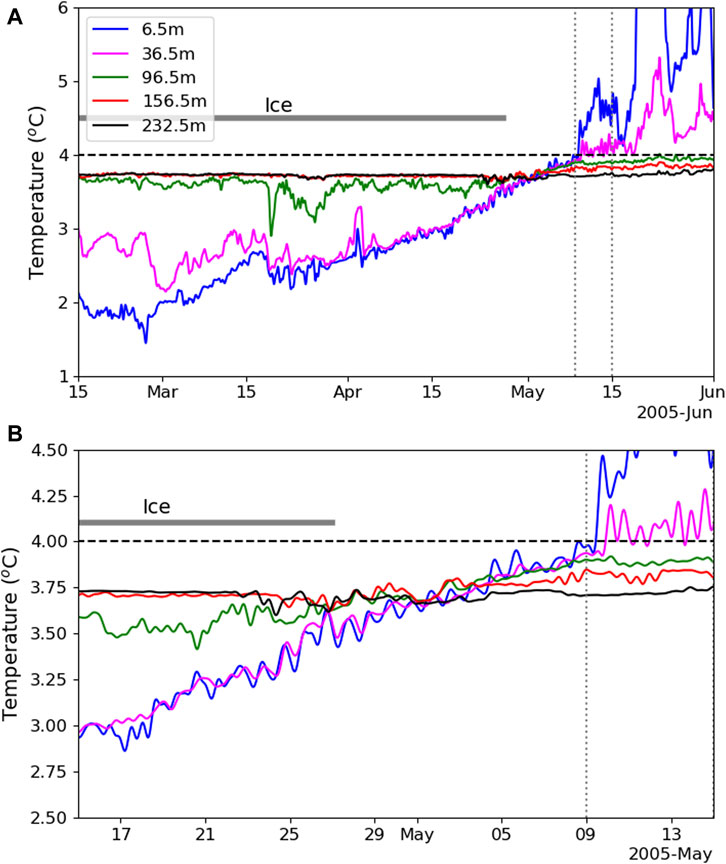
FIGURE 6. Details of Spring ventilation for two periods in 2005 (A) 15 February - 1 June, and (B) 14 April - 15 May showing temperatures versus time measured at 5 depths (solid lines). Dashed horizontal lines indicate a temperature of 4°C. Grey horizontal lines indicate periods with ice cover. The vertical dotted lines indicate important dates discussed in text (9 May 2005 and 15 May 2005) as reference (All these data are shown with daily running means).
The second stage began during the first week of May when deep and bottom waters (156.5 and 232.5 m) settled at temperatures slightly above winter value of 3.7°C–3.9°C, thus never warming through 4°C. On about 9–15 May the upper layer temperatures (at 6.5 m and 36.5 m) warmed through 4°C and the upper layers began to re-stratify. Mixed-layer warming was about 0.05°C/day between 17 April and 29 April, and about 0.03°C/day between 3 May and 9 May, presumably due to changing snow on ice conditions allowing greater penetration of solar radation. Maximum temperatures and stratification were reached in late August.
In summary, a comparison of Fall and Spring temperature records suggests that the Fall event is much more effective in the ventilation of deep and bottom waters (Figure 4C). At the same time, late-winter temperature records suggest that sunlight effectively penetrates the ice and snow cover by early February and March, with the potential to initiate primary production (Figure 6B). These conclusions must be checked with future in situ measurements of nutrients and dissolved oxygen, and against conditions existing today, almost 2 decades after the data described herein were collected.
The annual heat budget is estimated from the 1-D integrated heat content relative to the TMD (Figure 7A). Surface heat flux is found from the mean slope of heat content versus time. Maximum heat content values of approximately 2.0 x 10⁹ J m-2 are attained during August in both years. Fall cooling begins in early October and proceeds into December at a cooling rate of ∼ −200 W m-2. Through December and up until the time of ice formation the rate of cooling roughly doubles to a rate of ∼400 W m-2. From 10 January to 1 April the heat content beneath the ice cover is relatively constant, aside from wave-related fluctuations. Throughout April the lakes’ heat content increases at a rate of ∼100 W m-2. Since the lake is ice-covered at this time, warming of the water column infers that solar radiation is now penetrating the snow and ice cover, warming the lake and driving convection. It also infers that solar radiation is available for photosynthesis, as discussed in Section 4 below. From approximately 1 May until the removal of the mooring on 30 August the heat content of the lake increased at a rate of ∼180 W m-2.
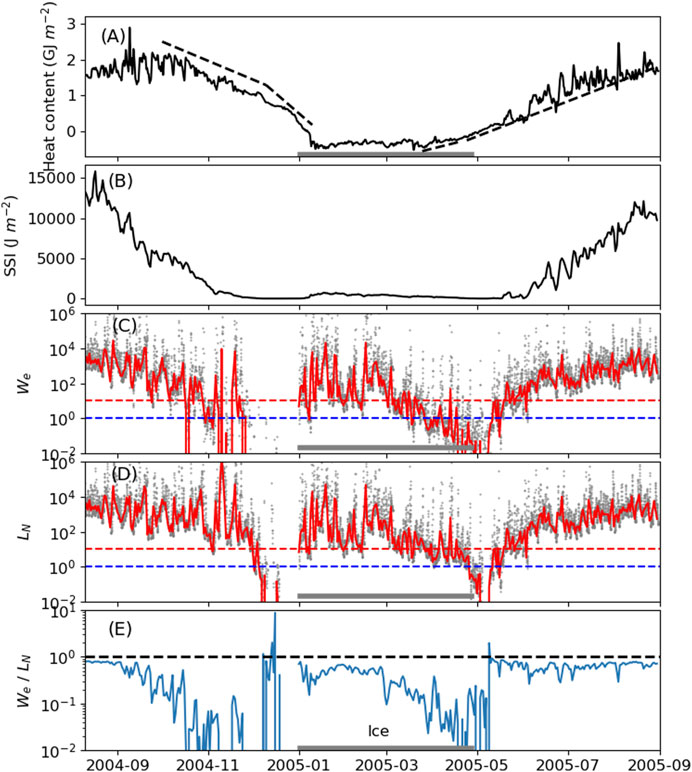
FIGURE 7. Daily running means of annual heat budget calculated as the integrated heat content relative to the TMD. Black dashed lines show cooling and heating rates pre- and post-ice formation (A). Daily averaged Schmidt stability index (SSI) (B), daily (red) and hourly (grey) averaged Wedderburn numbers (We) (C), daily (red) and hourly (grey) averaged Lake numbers (Ln) (D), and ratio of daily We to Ln (E). Grey horizontal lines indicate period with ice cover.
Insight into salient lake dynamics can be gained through the calculation of lake diagnostics and scales of motion (Imberger and Hamblin, 1982; Robinson and Imberger, 1994). The data presented here, although sparse, allows calculation of the primary scales of motion, both for seasonal ranges (Table 1; Table 2) and higher frequency motions (Figure 7).

TABLE 2. Merian’s formula versus observed surface seiche periods using a mean depth h=90 m and a length L=93 km. Fundamental and subsequent harmonics were calculated.
The temperature profiles representing conditions near the time of maximum surface temperature from the 7 August 2004 CTD profile and representing conditions near the time of minimum heat content on 12 January 2005 from the mooring temperature loggers can be used to calculate the range of scales of motion representing the annual cycle. For both seasons a two-layer approximation was visually determined and used to determine the depths of the upper and lower layers, h1 and h2, the densities of the upper and lower layers, ρ1 and ρ2, and the density difference, Δρ = ρ2—ρ1. Using these values, we then calculate the reduced gravity parameter g’ = g (Δρ/ρ2), where g is the acceleration of gravity (9.81 ms-2), and the internal wave phase speed c =
Seiching motions, both surface and internal, are important agents for lake mixing and transport processes. The longest natural period of a seiche is the period associated with the fundamental resonance for the body of water. This corresponds to the longest standing wave. For a surface seiche in an enclosed rectangular body of water this can be estimated using Merian’s formula:
where
Using a mean depth
In addition to representative values of diagnostic scales for mid-summer and mid-winter, the thermistor and wind data can be used to examine short-term responses throughout the year (Figure 7). As a measure of overall stratification, we calculated the Schmidt Stability Index, SSI (J m-2) (Idso, 1973), which is the difference between a stratified lake and a fully mixed lake without changing its heat content,
where
where
Two dimensionless indices: the Wedderburn Number, We, and the Lake Number Ln, can be used to estimate the overall resistance of stratification to wind mixing. The Wedderburn Number is defined as the ratio between the wind friction and the gradient of pressure established by the stratification (Imberger and Patterson, 1989), or
where
where
For calculations of both We and Ln hourly wind speed observations were smoothed with a 20-h low-pass filter before calculating the wind shear velocity.
The ratio of We/Ln (Figure 7E) clearly shows the relative applicability of both diagnostics. During periods of summer and winter stratification the ratio of We to Ln is approximately 1, as much of the motion is confined to waters above and within the summer and winter thermoclines. At this time the simpler We diagnostic is sufficient to assess mixing and upwelling potential. During fall and spring overturn, however, the ratio of We to Ln falls over two orders of magnitude, as motions occur throughout the full depth of the water column. It follows that Ln is the preferred diagnostic during the critical periods of ventilation and nutrient renewal. As such, Ln has been used by Robinson and Imberger (1994) and Saber et al. (2020) to empirically model seasonal oxygen concentrations.
We now apply the baseline temperature structure and diagnostics gained from this study to address problems of deep ventilation, primary productivity, and climate change.
A practical question regarding thermobaric processes is, simply, how deep must a lake be to be constrained by thermobaric processes, and what joint roles do lake size and seasonal ice cover play? To examine this question, we compare deep water properties and patterns observed in François Lake to those in other lakes in Norway, the United States, Japan, and western Canada. Boehrer et al. (2013) presented temperature profiles from five deep (288–514 m) and long (∼18–96 km) lakes in Norway, each having thermobaric stratification with bottom temperatures between TMD and 4°C. They further concluded that lake length played a major role in determining bottom temperatures, perhaps because wind-driven triggering of thermobaric instabilities is more likely to occur in long lakes with correspondingly small Wedderburn number. In contrast to conditions in long lakes, Crawford and Collier (1997; 2007) described conditions over a 14-year period in 590 m deep Crater Lake, a classic caldera system where wind-driven triggering of the thermobaric instability is constrained by high caldera walls and limited wind fetch (∼10 km). They showed significant year-to-year variability in effectiveness of ventilation, concluding that details of surface cooling and wind-driven mixing during the early stages of inverse stratification determine the net amount of ventilation in any year. Similarly, Boehrer and Schultze (2008) presented data from six caldera lakes in Japan with depths ranging from 148 to 423 m deep, two in which deep ventilation was limited by chemical stratification, two in which complete seasonal mixing occurred, and two in which showed limited deep recirculation due to thermobaric effects.
Next, we compare François Lake to three other deep lakes in Western Canada of comparable length but with contrasting ice cover and with depths both greater and smaller that François Lake; these are: Great Slave Lake (Carmack and Vagle, 2021), Quesnel Lake (Laval et al., 2012); and Lake Laberge (Carmack et al., 1987) (Table 3). Each of these is plotted as T-TMD, noting that positive values of T-TMD at temperatures below 4°C reflect thermobaric stratification (Figure 8). In Great Slave Lake (614 m deep, 100 km long, and ∼6—8 months of ice cover) positive values of T-TMD in winter are found below depths of below 186 m in both winter and summer. In Quesnel Lake (502 m deep, 110 km long, and no seasonal ice cover) positive values of T-TMD develop below 190 m in early winter, but are gradually eroded by mid-winter, leaving only waters below 300 m thermobarically stratified. We suggest this is because of the absence of ice in shielding the lake from wind mixing. Finally, in the shallower Lake Laberge (146 m deep, 48 km long and ∼6 months of ice cover) full depth ventilation occurs in both fall and spring and positive values of T-TMD are absent.
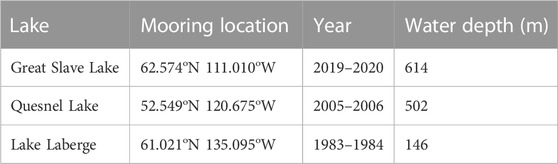
TABLE 3. Information about the three temperature data sets used in comparisons with the François Lake data (Carmack et al., 1987; Laval et al., 2012; Carmack and Vagle, 2021).
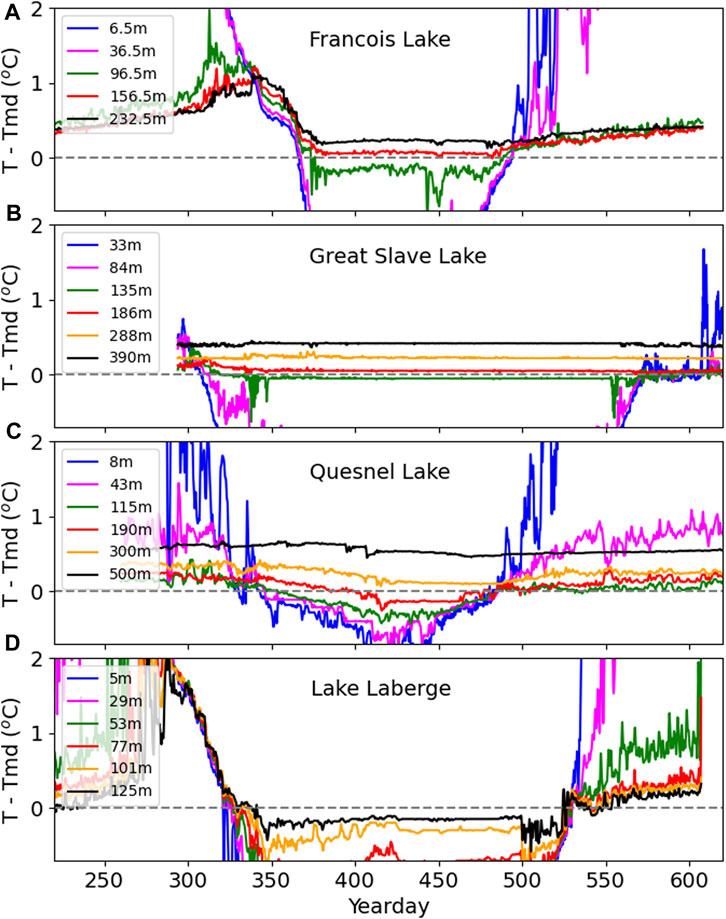
FIGURE 8. Expanded daily running mean T-TMD temperatures for a number of depths from four different lakes (A) François Lake (2004–2005) (B) Great Slave Lake (2019–2020) (C) Quesnel Lake (2005–2006), and (D) Lake Laberge (1983–1984) (Table 3).
Little research has been conducted on biological processes occurring under ice cover, some notable exceptions being Yang et al., 2020; Hampton et al., 2017; and Vehmaa and Salonen, (2009). In lieu of biological data from François Lake, we infer productivity cycles based on studies of physical processes under ice by Yang et al. (2020), Carmack and Vagle (2021), Ulloa et al. (2018), Kelley (1997), Farmer, (1975) and Mironov et al. (2002). For example, evidence that solar radiation is penetrating the snow and ice cover is given by the observed warming and penetrative convection in the upper waters beginning as soon as early March. From these temperature records we suggest that spring, prior to full snow and ice melt, is likely the critical period for initiation of the spring phytoplankton bloom, and hypothesize that, in general, primary productivity during spring in a very deep, dimictic lake with full seasonal ice cover will progress in four stages: 1) initially, when surface temperatures are at 0°C and less than that of surface TMD (∼4°C) below, the increasing penetration of solar radiation through the ice cover, particularly after snow cover melt, will drive both thermal convection and high primary productivity, thus leading to an under-ice spring bloom, as neither light nor nutrients are then limiting; 2) continued nutrient uptake in the mixed-layer may diminish productivity under ice should nutrients become limiting; 3) subsequent to ice melt, but prior to the surface warming through 4°C, further decreases in primary productivity may occur due to continued radiatively-driven mixed-layer deepening and light limitation (cf. Sverdrup, 1953), but, at the same time, additional supplies of nutrients may be entrained upwards into the euphotic zone; and 4) restratification and mixed-layer shoaling as the surface warms through 4°C, provides potential for a second spring bloom using the additional nutrients mixed upwards in stage 3. This period from late ice-cover through early ice-free conditions may be key to setting the overall primary productivity and oxygenation of the lake, in support of Hampton et al (2017), Yang et al. (2020), and Jansen et al. (2021).
Finally, we note that lakes are increasingly recognized as sentinels of climate change (Livingstone, 2003; Adrian et al., 2009; Williamson et al., 2008; 2009; O'Reilly et al., 2015 among others). As well, major shifts in ecological structure and function may result from warming by forcing the annual cycles of stratification and ventilation across classically-defined mictic states (e.g., from seasonally ice-covered to ice-free, or from dimictic to warm monomictic; see Shikhani et al. (2021), for example,). Dimictic lakes with two convective periods each year will have different patterns of nutrient cycling than either warm or cold monomictic lakes with one. Dimictic lakes must also utilize a portion of the incoming solar radiation in spring to drive convective overturn and warm past 4°C, instead of all incoming radiation going to surface layer warming and the re-establishment of stratification (cf. Bennett, 1978). The presence or absence of ice is also a key factor in that lakes with a winter ice cover remain sheltered, with important constraints on heat loss, wind mixing, and gas exchange (cf. Carmack and Farmer, 1982; Carmack et al., 1987; Dibike et al., 2011). Thus, lakes close to thermal conditions that allow either the establishment or loss of their seasonal ice cover, or the transition from one mictic state to another, are of especial interest for long-term ecological observation. Studies of Canadian lakes over the period 1951–2000 by Duguay et al. (2006) show a trend towards earlier break-up, but with few significant trends in freeze-up dates. The data presented here was obtained almost 2 decades ago, and while NOAA EOSDIS satellite imagery shows that seasonal ice still forms, it is trending to shorter periods of cover and increasing open water areas during winter, and future monitoring is recommended. As with many complex systems with internal dynamics under external forcing, the ice cover on François Lake is likely to flicker before it flips (C.S. Holling, Pers. Comm).
From the data presented here, and comparisons to other lakes elsewhere, three main characteristics are now evident in the seasonal limnology of François Lake and its response to external forcing.
1. Owing in part to its length, Wedderburn and Lake Numbers predict frequent outcropping and mixing of metalimnion water during periods of weak stratification in fall and spring even under moderate winds.
2. Owing in part to its depth, hypolimnion temperatures are set by TMD at the depth of fall and spring convection, and not at the surface TMD, i.e., near 3.7°C and not 4°C. In addition, permanent, thermobaric stratification below ∼150 m persists throughout winter.
3. Owing in part to seasonal ice-cover formation, the critical period for fall ventilation occurs before the establishment of winter ice cover when the weakly stratified lake is exposed to the full force of the wind. We suggest this is the main time of deep-water oxygenation and the recharge of surface-layer nutrients. Similarly, the critical period for spring ventilation lies between the date of ice removal and the date the surface warms past 3.7°C (TMD near 150 m depth). The effectiveness of spring ventilation, as judged by deep water temperature variability, is less than that of fall.
The raw data are available at http://arcrcticesearch-20220915111649-hostingbucket-arfprod.s3-website-us-east-1.amazonaws.com/metadata-display/project-6934951299171483648.
SV and EC conceived the idea, collected and analyzed the data, discussed the results and contributed to the final manuscript.
This work was undertaken through general research funding to the two authors from the Department of Fisheries and Oceans, Canada.
We thank Ralph and Marnie Keefe, residents along the shore of François Lake, for logistical advice and hospitality. The local hardware store in Burns Lake provided the necessary mooring supplies and the $40/night motel in Burns Lake allowed us to remain underbudget for field work. Stephen Déry helped us finding the regional meteorological data. Rianna Burnham for valuable comments and suggestions on an earlier version. Melinda Cownden and her Coffee House for giving us a friendly place to work on the manuscript.
The authors declare that the research was conducted in the absence of any commercial or financial relationships that could be construed as a potential conflict of interest.
All claims expressed in this article are solely those of the authors and do not necessarily represent those of their affiliated organizations, or those of the publisher, the editors and the reviewers. Any product that may be evaluated in this article, or claim that may be made by its manufacturer, is not guaranteed or endorsed by the publisher.
Adrian, R., O’Reilly, C. M., Zagarese, H., Baines, S. B., Hessen, D. O., Keller, W., et al. (2009). Lakes as sentinels of climate change. Limnol. Oceanogr. 54 (6), 2283–2297. doi:10.4319/lo.2009.54.6_part_2.2283
Bennett, E. B. (1978). Characteristics of the thermal regime of lake superior. J. Gt. Lakes. Res. 4, 310–319. doi:10.1016/s0380-1330(78)72200-8
Boehrer, B., Golmen, L., Løvik, J. E., Rahn, K., and Klaveness, D. (2013). Thermobaric stratification in very deep Norwegian freshwater lakes. J. Gt. Lakes Res. 39, 690–695. doi:10.1016/j.jglr.2013.08.003
Boehrer, B., and Schultze, M. (2008). Stratification of lakes. Rev. Geophys. 46, RG2005. doi:10.1029/2006RG000210
Bouffard, D., and Wüest, A. (2019). Convection in lakes. Annu. Rev. Fluid Mech. 51, 189–215. doi:10.1146/annurev-fluid-010518-040506
Carmack, E. C., and Farmer, D. M. (1982). Cooling processes in deep, temperate lakes: A review with examples from two lakes in British Columbia. J. Mar. Res. 40, 85–11.
Carmack, E. C., Vagle, S., Morrison, J., and Laval, B. (2014). Space-for-time proxy for climate change in deep lakes in the Canadian cordillera: Seasonality along a latitudinal climate gradient. J. Gt. Lakes. Res. 40, 608–617. doi:10.1016/j.jglr.2014.06.007
Carmack, E. C., and Vagle, S. (2021). Thermobaric processes both drive and constrain seasonal ventilation in deep Great Slave Lake. J. Geophys. Res. Earth Surf. 126, e2021JF006288. Available at: https:/doi.org/10.1029/2021JF006288.
Carmack, E. C., and Weiss, R. F. (1991). “Convection in lake baikal: An example of the thermobaric instability,” in Deep convection and deep-water formation in the ocean. Editors P.-C. Chu, and J.-C. Gascard (Elsevier), 215–228.
Carmack, E. C., Wiegand, R. C., Marles, E., Alford, M. E., and Chamberlain, V. A. (1987)., 157. Ottawa, 56.Physical limnology of an ice-covered lake with winter through-flowEnviron. Can. Sci. Res. Ser.
L. S. Clesceri, A. E. Greenberg, and A. D. Eaton (Editors) (1998). Standard methods for the examination of water and wastewater. 20th ed. (American Public Health Association).
Crawford, G. B., and Collier, R. W. (2007). Long-term observations of deep-water renewal in Crater Lake, Oregon. Hydrobiologia 574, 47–68. doi:10.1007/s10750-006-0345-3
Crawford, G. B., and Collier, R. W. (1997). Observations of a deep-mixing event in Crater Lake, Oregon. Limnol. Oceanogr. 42, 299–306. doi:10.4319/lo.1997.42.2.0299
Dibike, Y., Prowse, T., Saloranta, T., and Ahmed, R. (2011). Response of northern hemisphere lake-ice cover and lake-water thermal structure patterns to a changing climate. Hydrol. Proc. doi:10.1002/hyp.8068
Duguay, C. R., Prowse, T. D., Bonsal, B. R., Brown, R. D., Lacroix, M. P., and Menard, P. (2006). Recent trends in Canadian lake ice cover. Hydrol. Proc. 20, 781–801. doi:10.1002/hyp.6131
Eklund, H. (1965). Stability of lakes near the temperature of maximum density. Science 149, 632–633. doi:10.1126/science.149.3684.632
Farmer, D. M., and Carmack, E. C. (1981). Wind mixing and restratification in a lake near the temperature of maximum density. J. Phys. Oceanogr. 11, 1516–1533. doi:10.1175/1520-0485(1981)011<1516:wmaria>2.0.co;2
Farmer, D. M. (1978). Observations of long non-linear internal waves in a lake. J. Phys. Oceanogr. 6, 63–73. doi:10.1175/1520-0485(1978)008<0063:oolniw>2.0.co;2
Farmer, D. M. (1975). Penetrative convection in the absence of mean shear. Quart. J. Roy. Meteor. Soc. 101, 869–891. doi:10.1002/qj.49710143011
Hampton, S. E., Galloway, A. W. E., Powers, S. M., Ozersky, T., Woo, K. H., Batt, R. D., et al. (2017). Ecology under lake ice. Ecol. Lett. 20, 98–111. doi:10.1111/ele.12699
Idso, S. B. (1973). On the concept of lake stability. Limnol. Oceanogr. 18, 681–683. doi:10.4319/lo.1973.18.4.0681
Imberger, J., and Hamblin, P. F. (1982). Dynamics of lakes, reservoirs, and cooling ponds. Annu. Rev. Fluid Mech. 14 (1), 153–187. doi:10.1146/annurev.fl.14.010182.001101
Jansen, J., MacIntyre, S., Barrett, D. C., Chin, Y., Cortes, A., Forrest, A. L., et al. (2021). Winter limnology: How do hydrodynamics and biogeochemistry shape ecosystems under ice? J. Geophys. Res. Biogeosciences 126, e2020JG006237. Available at: https://doi.org/10.1029/2020JG006237.
Johnson, L. (1966). Temperature of Maximum density of fresh water and its effect on circulation in Great Bear Lake. J. Fish. Res. Bd. Can. 23 (7), 963–973. doi:10.1139/f66-089
Kelley, D. (1997). Convection in ice-covered lakes: Effects on algal suspension. J. Plankton Res. 19, 1859–1880. doi:10.1093/plankt/19.12.1859
Laval, B. E., Morrison, J., Vagle, S., Potts, D., James, C., Foreman, M., et al. (2012). The joint effects of thermal, riverine and wind forcing on dimictic fjord lakes: A case study. J. Gt. Lakes. Res. doi:10.1016/j.jglr.2012.06.007
Livingstone, D. M. (2003). Impact of secular climate change on the thermal structure of a large temperate central European Lake. Clim. Change 57, 205–225. doi:10.1023/A:1022119503144
Mironov, D., Terzhevik, A., Kirillin, G., Jonas, T., Malm, J., and Farmer, D. (2002). Radiatively driven convection in ice-covered lakes: Observations, scaling, and a mixed layer model. J. Geophys. Res. 107 (C4), 3032. doi:10.1029/2001JC000892
O'Reilly, C. M., Sharma, S., Gray, D. K., Hampton, E. S., Read, J. S., Rowley, R. J., et al. (2015). Rapid and highly variable warming of lake surface waters around the globe. Geophys. Res. Lett. 4210, 773–810. 10.1002/2015GL066235.
Pawlowicz, R., and Feistel, R. (2012). Limnological applications of the thermodynamic equation of seawater 2010 (TEOS-10). Limnol. Oceanogr. Methods 10, 853–867. doi:10.4319/lom.2012.10.853
Robinson, D. M., and Imberger, J. (1994). Lake number, a quantitative indicator of mixing used to estimate changes in dissolved oxygen. Int. Rev. gesamten Hydrobiol. Hydrogr. 79 (2), 159–176. doi:10.1002/iroh.19940790202
Saber, A., James, D. E., and Hannoun, I. A. (2020). Effects of lake water level fluctuation due to drought and extreme winter precipitation on mixing and water quality of an alpine lake, Case Study: Lake Arrowhead, California. Sci. Total Environ. 714, 136762. doi:10.1016/j.scitotenv.2020.136762
Schmid, M., Budnev, N. M., Granin, N. G., Sturm, M., Schurter, M., and Wüest, A. (2008). Lake Baikal deepwater renewal mystery solved. Res. Lett. 35, L09605. doi:10.1029/2008GL033223
Shikhani, M., Gevorgyan, A., Gevorgyan, G., Misakyan, A., Azizyan, L., et al. (2021). Simulating thermal dynamics of the largest lake in the Caucasus region: The mountain Lake Sevan. J. Limnol. 81. doi:10.4081/jlimnol.2021.2024
Sverdrup, H. (1953). On conditions for the vernal blooming of phytoplankton. J. du Conseil/Conseil Perm. Int. pour l'Exploration de Mer 18, 287–295. doi:10.1093/icesjms/18.3.287
Tsimitri, C., Rockel, B., Wüest, A., Budnev, N. M., Sturm, M., and Schmid, M. (2015). Drivers of deep-water renewal events observed over 13 years in the south basin of lake baikal. J. Geophys. Res. Oceans 120, 1508–1526. doi:10.1002/2014JC010449
Ulloa, H., Wüest, A., and Bouffard, D. (2018). Mechanical energy budget and mixing efficiency for a radiatively heated ice-covered waterbody. J. Fluid Mech. 852, R1. doi:10.1017/jfm.2018.587
Vehmaa, A., and Salonen, K. (2009). Development of phytoplankton in Lake Pääjärvi (Finland) during under-ice convective mixing period. Aquat. Ecol. 43, 693–705. doi:10.1007/s10452-009-9273-4
Weiss, R. F., Carmack, E. C., and Koropolov, V. M. (1991). Deep water renewal and biological production in Lake Baikal. Nature 349, 665–669. doi:10.1038/349665a0
Westenhofer, L., Roberts, A. E., and Sharpe, I. (2000). François Lake management plan may 2000. Lakes Prot. Soc. 132pp. Available at: https://www.google.com/search?client=firefox-b-d&q=François.
Williamson, C. E., Dodds, W., Kratz, T. K., and Palmer, M. A. (2008). Lakes and streams as sentinels of environmental change in terrestrial and atmospheric processes. Front. Ecol. Environ. 6, 247–254. doi:10.1890/070140
Williamson, C. E., Saros, J. E., Vincent, W. F., and Smol, J. P. (2009). Lakes and reservoirs as sentinels, integrators, and regulators of climate change. Limnol. Oceanogr. 54 (62), 2273–2282. doi:10.4319/lo.2009.54.6_part_2.2273
Wüest, A., Ravens, T. M., Granin, N. G., Kocsis, O., Schurter, M., and Stur, M. (2005). Cold intrusions in lake baikal—direct observational evidence for deep water renewal. Limnol. Oceanogr. 50 (1), 184–196. doi:10.4319/lo.2005.50.1.0184
Keywords: seasonal stratification, deep lakes, mixing, ventilation, lake productivity
Citation: Vagle S and Carmack E (2023) Annual patterns of stratification, mixing and ventilation in long, deep, seasonally ice-covered François lake, British Columbia, Canada. Front. Earth Sci. 11:1090124. doi: 10.3389/feart.2023.1090124
Received: 04 November 2022; Accepted: 06 February 2023;
Published: 21 February 2023.
Edited by:
Lei Wang, Institute of Tibetan Plateau Research (CAS), ChinaReviewed by:
Bertram Boehrer, Helmholtz Association of German Research Centres (HZ), GermanyCopyright © 2023 Vagle and Carmack. This is an open-access article distributed under the terms of the Creative Commons Attribution License (CC BY). The use, distribution or reproduction in other forums is permitted, provided the original author(s) and the copyright owner(s) are credited and that the original publication in this journal is cited, in accordance with accepted academic practice. No use, distribution or reproduction is permitted which does not comply with these terms.
*Correspondence: Svein Vagle, c3ZlaW4udmFnbGVAZGZvLW1wby5nYy5jYQ==
Disclaimer: All claims expressed in this article are solely those of the authors and do not necessarily represent those of their affiliated organizations, or those of the publisher, the editors and the reviewers. Any product that may be evaluated in this article or claim that may be made by its manufacturer is not guaranteed or endorsed by the publisher.
Research integrity at Frontiers
Learn more about the work of our research integrity team to safeguard the quality of each article we publish.