 Ruichun Liu
 Jin Zhang
 Wenfeng Guo2,3
95% of researchers rate our articles as excellent or good
Learn more about the work of our research integrity team to safeguard the quality of each article we publish.
Find out more
ORIGINAL RESEARCH article
Front. Earth Sci. , 18 May 2023
Sec. Structural Geology and Tectonics
Volume 11 - 2023 | https://doi.org/10.3389/feart.2023.1083562
This article is part of the Research Topic Measuring and Modeling the Ground Deformation of Geological Disasters Using Modern Geodesy View all 11 articles
The Shanxi rift valley is a continental rift system that is characterized by mantle uplift, crustal thinning, and tectonic deformation. A continuous, vertical crustal-deformation field can elucidate the constraints for understanding the mechanisms currently driving the deformation of the rift. Accordingly, we acquired and processed data from 250 continuous and mobile GPS stations located in the Shanxi rift valley and its surrounding region. Accounting for the influence of fault activity, we established the vertical crustal-deformation field of the Shanxi rift valley as a continuous function of space, using an adaptive least-squares collocation method. The main research findings are stated as follows: 1) the adaptive least-squares model yielded a reliable interpolation prediction results with adequate robustness, even for relatively sparse actual observation data. 2) The current general deformation pattern of the Shanxi rift valley exhibits an uplift of the mountainous regions on both sides and subsidence of the central basin. The average uplift rate of the mountain area is 2–3 mm/a, and the subsidence rate of the basin is not uniform and is positively correlated with the spatial distribution of the Cenozoic sediment thickness. However, in certain areas, a high subsidence rate of 10–30 mm/a is associated with human activities such as groundwater exploitation. 3) In summary, the current vertical crustal deformation occurring in the Shanxi rift valley correlates with the pattern over a time scale of millions of years. Overall, it is controlled by regional geological structure pattern, and is influenced by nonstructural factors in the shallow crust, exhibiting both complex and orderly characteristics in its spatial distribution.
Continental rifting is an important global tectonic phenomenon and rift valleys are one of the most intense places of tectonic movement. Their formation and development are of great significance to the study of geodynamics (Zygouri et al., 2008; Zwaan et al., 2020), mineral exploration (Zou et al., 2015), and seismology (Crone and Haller, 1991; Roberts and Koukouvelas, 1996). The Shanxi rift valley is a distributed continental rift system that spans more than 1,000 km from north to south in a slanted “S” shape. The northeast-end strikes to the ENE, extending into Yuxian–Huailai Basin in Hebei province, and the southwest-end trends toward the WSW, extending into the Weihe Basin in Shaanxi Province (Zhang et al., 1981; Liu et al., 1982; Xu and Ma, 1992). As a boundary zone between the Ordos and North China Plain, the Shanxi rift valley exhibits strong mantle upwelling, crustal thinning, and tectonic deformation (Xu et al., 1993). Strong earthquakes (Ms ≥ 5.0) have frequently occurred here, indicating frequent activity and ongoing development of the rift valley (Xu and Ma, 1992; Bai et al., 1994). The interior of the rift is not a single shear and tensile structure but is composed of five Cenozoic graben basins en echelon with NNE–and NE–trending strikes: Datong, Xinding, Taiyuan, Linfen, and Yuncheng. The non-uniformity of crust deformation in the rift is reflected by the significant variations in seismic activity of these faulted basins, and variable the Cenozoic sediment thickness (Xu et al., 1993) (Figure 1). The nonuniform deformation characteristics indicate that the intensity of fault activity and the risk of future strong earthquakes differ in each graben basin. To clearly reveal these nonuniform deformation characteristics, a reliable and accurate 3D-velocity field of the present crustal deformation is required.
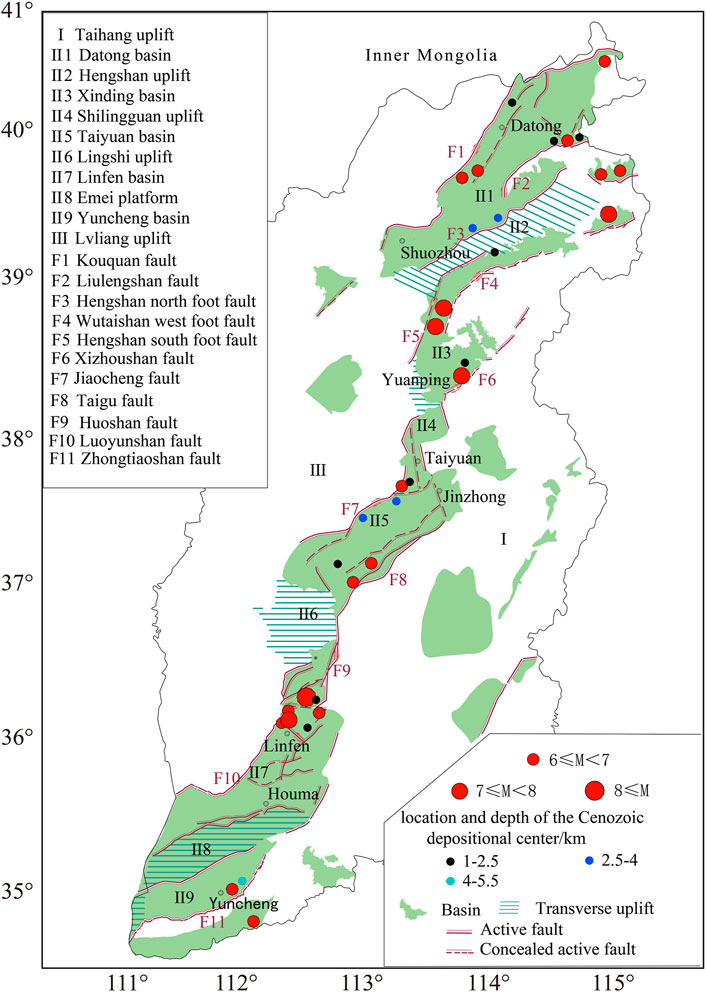
FIGURE 1. Seismic geological structure of the Shanxi rift valley.
Several research groups have comprehensively studied the deformation characteristics of its rift structures in depth. In terms of horizontal deformation, the Shanxi rift valley is consistent with the entire North China region. In other words, the maximum compressive stress axis of the tectonic stress field is aligned in the ENE–WSW direction, the maximum tensile stress axis is in NNW–SSE direction, and the elevation angle of principal stress axis is close to zero (Li, 1980; Li et al., 1982; Zhang et al., 1987; Zhuo et al., 2016). This tectonic deformation feature may be related to the far-field effect of subduction and the impact of the Indian and Eurasian plates (Li, 1997; Cen, 2015; Zhang et al., 2019). In terms of vertical deformation, the Shanxi rift valley displays characteristics of inheritance and neogenesis, which may be related to the geological structure pattern (Hu et al., 1987; Zhang, 1993), regional stress-field variations (Hu et al., 1993), deep mantle material activity (Hao et al., 2016), and human activities, particularly groundwater extraction (Zhao et al., 2018; Yang et al., 2020; Liu et al., 2021).
Although Zhao et al. (2014) determined the GNSS vertical motion rate in North China, most measurement points were in campaign measurement mode and had a short observation periods and limited accuracy. Pan et al. (2021) used 260 continuously operating GNSS stations to demonstrate the vertical rate in mainland China. However, the obtained spatial resolution was low owing to the sparsely located cGNSS stations, and only the overall characteristics of a large range of vertical deformations were revealed. In general, the detailed characteristics of the current high-precision vertical deformation, along with its tectonic significance in the Shanxi rift valley, are still unclarified, mainly because of the following reasons: 1) The sparse spatial distribution of cGNSS observation data and the short observation period of the GNSS data in the campaign measurement mode failed to fulfill the high accuracy requirements of vertical deformation mapping. 2) The high-precision leveling points are primarily distributed along the roads; many of them are insufficient in the main structural units, and the crustal movement pattern as imaged by the measured points is incomplete.
Aiming at the need for studying vertical crustal deformation in the Shanxi rift valley, this study proposes a modeling method of crustal-deformation field based on an adaptive least-squares collocation method, considering regional fault activity. Subsequently, we acquired GNSS observation station data of 70 continuous measurement sites and 180 campaign sites for multiple period observations in the Shanxi rift valley and its surrounding areas. We computed regional GNSS vertical motion velocity field by refined processing and constructed the continuous distribution of the vertical crustal-deformation field of the Shanxi rift valley with the constraint of vertical motion velocity (Dong et al., 2008; Zhang et al., 2011; Liang, 2014). Furthermore, the fine features of the present vertical deformation and its tectonic significance were analyzed. The results provide reliable data constraints for the dynamic mechanism of current vertical deformations in the Shanxi rift valley.
Vertical crustal deformation includes both regional-scale tectonic deformation and local-scale nontectonic deformation. Regional-scale tectonic deformation exhibits appropriate stability over the geological time scale of millions of years, whereas local-scale nontectonic deformation exhibit randomness. In this paper, the least-square configuration method was employed to construct a vertical crustal-deformation model, which was segmented into two components: fixed effects and random effects, representing the background field and local motion signals of vertical crustal deformation obtained from the geodetic survey.
where L denotes the observation vector, representing the vertical deformation of the monitoring point; AX represents the fixed effect component; BS denotes the random effect component; X denotes a nonrandom undetermined parameter vector; A indicates the coefficient matrix, representing the influence of parameter X (coordinate information of observation station) on the observed value L; S denotes the signal vector, representing the current crustal-deformation signal of the monitoring point after subtracting the overall crustal background deformation; B indicates the coefficient matrix of S, considered to be the identity matrix. R indicates the random observation-error vector.
The first term accounts for the regional-scale tectonic deformation of the block. Herein, a two-dimensional surface with a second-order polynomial fit in latitude and longitude is used for fitting, and the coefficient matrix A can be expressed as
where (φ, λ) denotes the coordinate of the monitoring point, and (∆φ, ∆λ) represents the coordinate of the monitoring point relative to a central reference location.
The estimated and signal values of the least-square configuration can be derived as
In the Equation,
To determine the optimal weighting between the covariance matrices of observation noise and signal, we employed the Helmert variance component method to estimate the posterior unit-weight variance of the observation noise and signal, respectively. Moreover, the adaptive factor of the variance component was constructed. After several iterations, the covariance matrix relationship was balanced. The adaptive factor is expressed as follows (Yang et al., 2008):
where
The adjusted observation-noise covariance matrix was used to adjust until the adaptive factor α approached 1.
Quaternary active faults segment the Earth’s crust into active blocks of multiple sizes, and the positions and dimensions of fault segments can be identified by analyzing spatial variation in fault displacements and fault kinematics (Roberts and Koukouvelas, 1996). Under the influence of tectonic stress, the crustal deformation is primarily characterized by the differential movement of each active block. Although the internal movement of the block remains consistent, the movement characteristics of the blocks vary. In particular, the fault and its adjacent crust show high displacement gradients (Zhang and Zhu, 2000; Deng et al., 2002; Li, 2003; Tan et al., 2009). To reduce the difference between observations, the values observed in each block are first centralized for establishing the function model, i.e., in Eq. 1, L is the velocity relative to a reference velocity, such as
where
Principally, the Gaussian function is used to fit the covariance of the crustal movement rate (Jiang and Liu, 2010). First, the study area is segmented into multiple blocks, and the long-term background velocity of the corresponding block is deducted from the measured velocity field according to the block affiliation, i.e., the velocity after centralization is determined via Eq. 6 to evaluate the signal. Second, the correlation coefficient β (0 ≤ β ≤ 1) of the points on both sides of the main fault is defined with a weakened correlation to reflect the characteristics of regional crustal deformation (Zhang and Jiang, 2001; Chai et al., 2009). Accordingly, the covariance fitting formula is derived as follows:
The value of β is set as 1 when the two points are located on the same side of the main fracture, and that on the opposite side is less than 1, which is determined based on the actual situation, recommended at 0.5. In the case of using the determined covariance function to calculate
To evaluate the reliability of the crustal-deformation model along with the applicability of the method, we initially used an elastic dislocation model to simulate fault activity and forward the “theoretical deformation field.” Thereafter, we compared and analyzed the deviation degree between the “calculated deformation field” and the “theoretical deformation field” simulated by various methods.
A fault with a positive dip distributed in the study area (115°–120° E, 35°–40° N), with starting point (117.375° E, 39° N), end point (117.375° E, 36° N), dip angle (45°), and dip E. In particular, we assumed complete locking from the surface to 15 km underground, with 30 mm/a positive dip-slip and 20 mm/a right-lateral shear below 15 km. The homogeneous isotropic semi-infinite spatial dislocation model (Okada, 1985) is used to simulate the deformation field (0.25° × 0.25°) generated by the fault activity on the surface. As depicted in Figure 2A, the area with the high displacement gradient was primarily distributed in the vicinity of the fault. To simulate and analyze the influence of the discreteness and inhomogeneity of the measured points on the modeling, the measuring points in the range of the fault hanging wall (117.5°–118° E, 36.5°–38.5° N) were initially deleted. Subsequently, 30% of the remaining measuring points were randomly deleted. According to the above scheme, the velocities of 281 points in total can be used as constraints for fitting (Figure 2B), and those for 160 points can be used for result checking (Figure 2C).
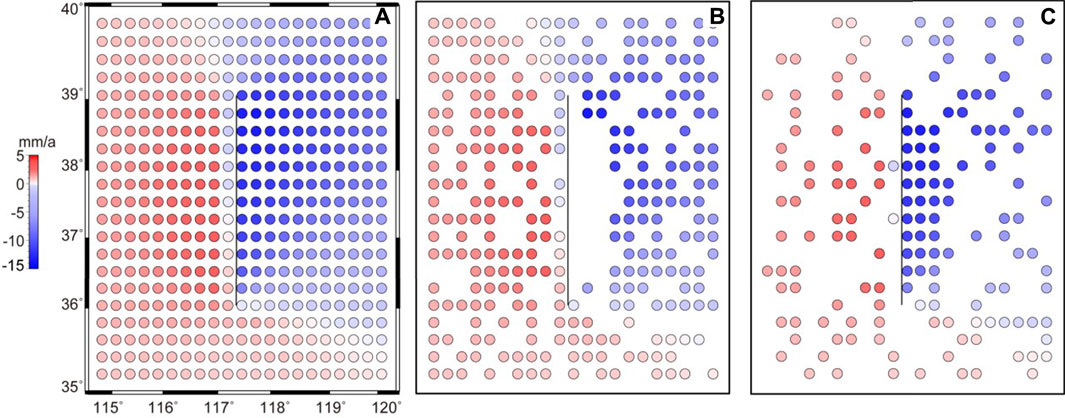
FIGURE 2. Vertical-deformation field derived from dislocation model.
The least-square collocation method was used to establish the overall crustal-deformation field with 0.25° × 0.25° resolution. Moreover, the Gaussian-type function with the decay of distance was adopted in the empirical covariance function fitting model. According to the distribution of the measurement points, we determine the covariance function model parameter K = 0.84 and the correlation distance d = 160 km (Zhang and Jiang, 1999). To evaluate the applicability of the method, modeling is performed according to the following four schemes:
Scheme 1: Using least-squares collocation modeling without considering fault activity;
Scheme 2: The variance factor for modeling was adjusted based on scheme 1;
Scheme 3: Considering the fault activity, the study area was segmented into two blocks along the fault. The average observed rate in the block was used to centralize the known observed values, and the covariance between the points on opposite sides of the fault was weakened. The point correlation coefficient on opposite sides of the fault was set as 0.5, and the least-squares collocation was used for modeling;
Scheme 4: The variance factor for modeling was adjusted based on scheme 3.
The crustal-deformation field obtained based on the four schemes is presented in Figures 3–6, depicting the (Figures 3A–6A) vertical-deformation field estimation result, (Figures 3B,C–6B,C) residuals of fitting points and checking points, respectively, and (Figures 3D,E–6D,E) residual frequency distributions of fitting points and checking points, respectively. As shown in Figure 3A, 6A, the deformation fields obtained from the four schemes exhibited similar overall characteristics. All of them revealed the crustal-deformation pattern of the falling on the hanging wall and the relatively rising on the footwall. In detail, the area with a large-displacement difference was distributed in the blank observation area of the hanging wall as well as the fault end. Influenced by the fault activity in these regions, the variations in the crustal-deformation velocity are susceptible to abrupt variability, and the interpolation accuracy of the model is poor. In particular, the velocity value in Figure 3A is evidently small in the fault hanging wall area, which differs from the original velocity field. Figure 4A, 5A, 6A are approximate to the original deformation field, but the details of the crustal deformation vary. To evaluate the accuracy and usability of the model, we employed qualitative and quantitative analysis methods to comprehensively evaluate the fitting and interpolation effects of the four stated methods. The RMS (Root Mean Square) values of the velocity residual between the actual observed values and the model values of fitting points and checkpoints obtained using the four methods are presented in Table 1. Among them, the near-field checkpoints of the fault included all the points within the range of 117.5°–118° and 36.5°–38.5°, and all the regional checkpoints incorporated the near-field checkpoints of the fault and the randomly deleted points.
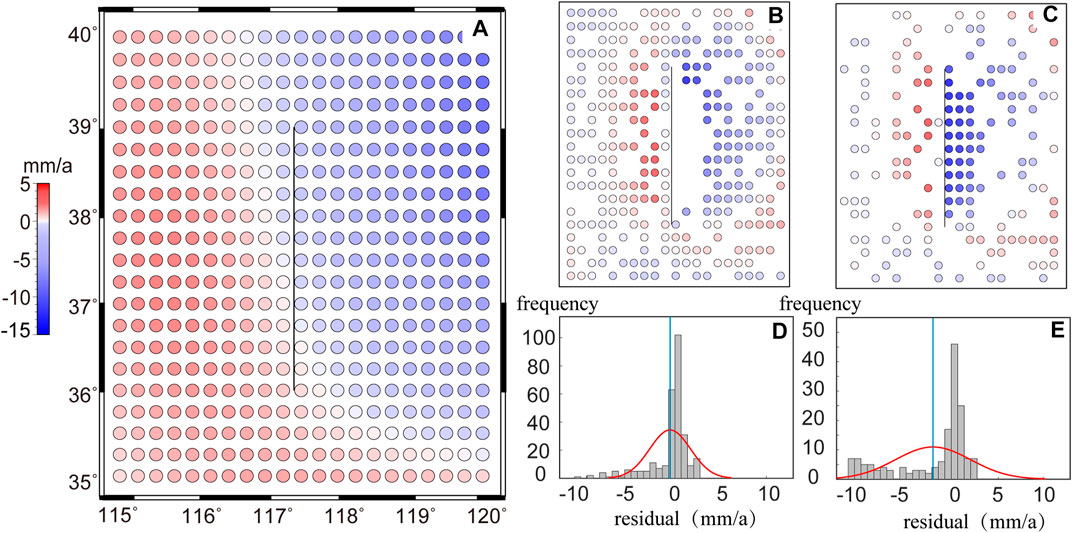
FIGURE 3. Deformation field model fitting based on Scheme 1.
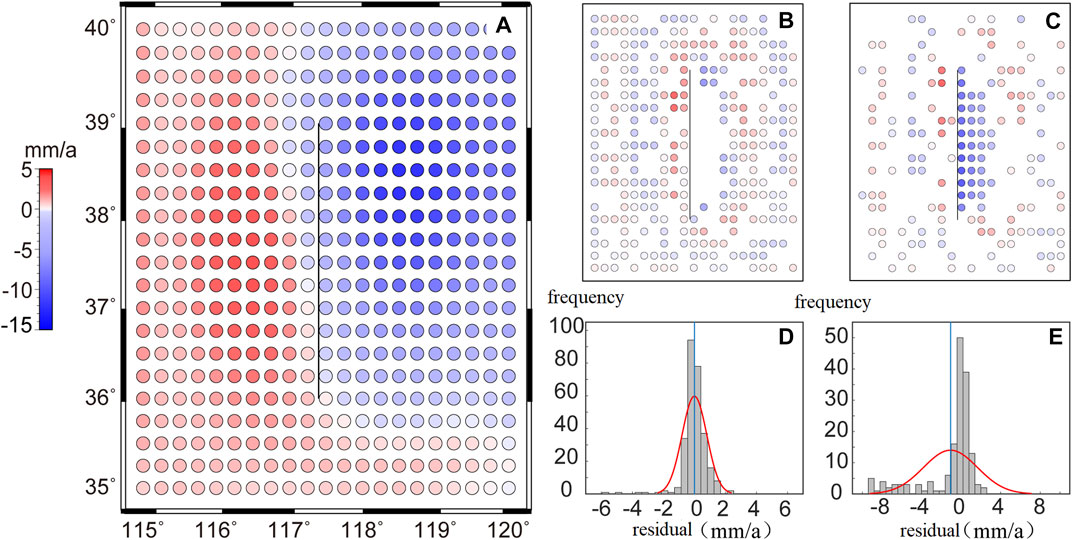
FIGURE 4. Deformation field model fitting based on Scheme 2.
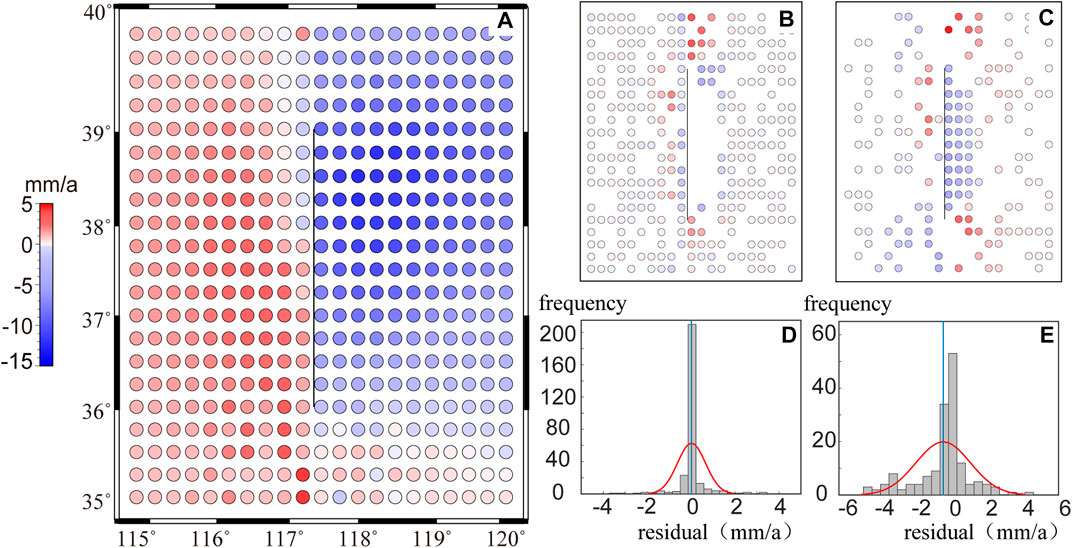
FIGURE 5. Deformation field model fitting based on Scheme 3.
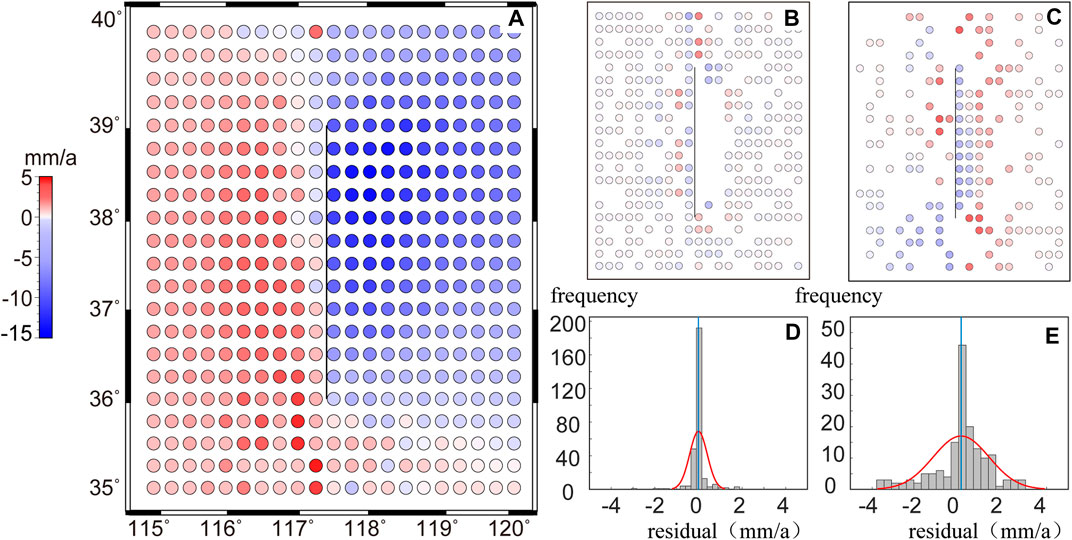
FIGURE 6. Deformation field model fitting based on Scheme 4.
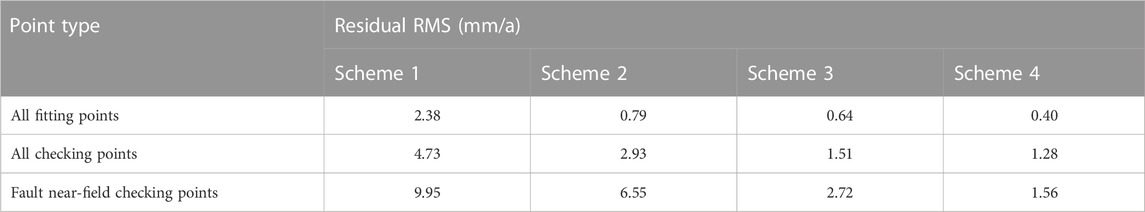
TABLE 1. Comparison of different velocity field modeling methods.
In this example, Method 1 assumes continuous spatial variations of the crustal deformation. Consequently, the model exhibits inferior fitting accuracy, and the fitting residuals are skewed owing to the influence of abrupt variations caused by tectonic activities in the deformation field (Figures 3B, D). In comparison, Method 2 uses the Helmert variance component to estimate and construct the adaptive factor of the variance component. After several iterations, the balance of the covariance matrix relationship was achieved. Compared with the results of Method 1, the fitting accuracy of the model significantly improved with the application of Method 2, and the fitting residual approximated normal distribution with zero mean (Figure 4D). Method 3 considers the influence of geological structure and regards the regional faults as discontinuities in the continuum, which is a slight improvement compared to Method 2 in terms of fitting accuracy and statistical distribution of residuals. Method 4 combines the advantages of Methods 2 and 3 by simultaneously considering the balance of the covariance matrix relationship and the influence of geological structure. Consequently, the fitting accuracy of the model is the highest, and the residual approximates normal distribution with zero mean.
Based on the perspective of external coincidence accuracy, the interpolation accuracy of Method 4 is higher than that of Methods 1, 2, and 3, regardless of considering all regional checkpoints or fault near-field checkpoints for analysis. Based on the perspective of all checkpoints in the region, the interpolation accuracies of Methods 1 and 2 were greater than 2 mm/a, and the residuals displayed skewed distribution (Figures 3E, 4E). The velocity obtained via interpolation exhibited prominent systematic deviation in the observed blank area of the fault hanging wall (Figures 3C, 4C). Although the interpolation accuracy of Methods 3 and 4 is less than 2 mm/a, Method 4 delivers higher accuracy, more proximate residual to a normal distribution with zero mean (Figure 6E), and smaller residual in the blank area of near-field observations of fault (Figure 6C).
Owing to the influence of the velocity of points at the footwall of the fault, the interpolation results of Methods 1 and 2 were remarkably inferior and failed to accurately reflect the crustal-deformation status in the near-field area of the fault. In Method 3, the influence of fault activity was considered for constructing the covariance matrix, and the modeling accuracy and reliability in this area were significantly improved, which reflected the differential motion of the two blocks. This indicated that in areas with large local deformation, the least-squares collocation model, without considering fault activity, could not easily reflect these local variations without applying finer constraints. Based on the perspective of interpolation accuracy of fault near-field blanks, the results obtained by Method 4 were less than 2 mm/a. This finding demonstrates the advantages of using Method 4, implying that the regional fault activity and determination of optimal weight of noise covariance and signal covariance matrix must be considered in practical application.
The GPS data used in this paper were primarily acquired from the “Crustal Movement Observation Network of China,” “Shanxi CORS network,” and “Shanxi Earthquake GPS Monitoring Network,” with 70 continuous stations and 180 campaign stations in the study area. Additionally, data processing was performed in four steps using GAMIT/GLOBK (Herring et al., 2010) and QOCA software. In particular, 1) GAMIT software was used to process the daily observation data for obtaining the single-day relaxation constraint solutions of the satellite orbit, station coordinates, antenna-phase offset, and zenith atmospheric delay parameters. 2) The regional single-day solutions were merged with the single-day solutions of approximately 80 IGS core stations produced by SOPAC. These IGS core stations were used as a “bridge” to transform the single-day relaxation constraint solutions into the ITRF2014 framework using seven parameters. 3) The annual motion amplitude of the GPS vertical time series can reach up to 5–10 mm owing to nontectonic factors such as atmospheric pressure, nontidal ocean loads, and hydrological loads (snow cover and soil water) (Mangiarotti et al., 2001; Dong et al., 2002; Dong et al., 2006; Wang, 2009; Jiang, 2013).The observation period of the campaign sites is small and the observation time is not fixed each year, it is significantly affected by the unestimated parameters when determining the vertical motion rate (Blewitt and Lavallée, 2002; Dong et al., 2002; Bos et al., 2010; Zhan et al., 2016). Considering that GPS vertical annual motion bears regional correlation (Wdowinski et al., 1997; Jiang, 2013; Sheng et al., 2014), this paper used the method of Liang (2014) to correct the vertical nonstructural load deformation of the GPS campaign station. First, 64 GPS continuous stations with long observational timespan were selected in the study area, and the annual term amplitude and initial equality parameters of the continuous station time series were fitted through the chord function. Thereafter, by eliminating the “abnormal” continuous stations inconsistent with the annual term amplitude and initial phase, 61 GPS continuous stations with adequate observation quality were ultimately selected to construct the Delaunay triangulation network. Using the harmonic function obtained by fitting the GPS vertical time series of the three endpoints of each triangle, the nonstructural deformation correction corresponding to the actual observation date of the campaign station in the network was evaluated based on the inverse-distance weighted-average algorithm. To ensure the accuracy and reliability of the vertical motion rate, only GPS campaign stations with observation timespan longer than 7 years were corrected (Blewitt and Lavallée, 2002; Bos et al., 2010; Li et al., 2015). 4) QOCA software was used to combinedly adjust the single-day relaxation constraint solutions of all GPS stations that completed the nonstructural deformation correction. Consequently, we obtained the present vertical motion velocity field of the Shanxi rift valley relative to the ITRF2014 reference frame.
The RMS of vertical motion rates ranged between 0.1 and 1.0 mm/a at the GPS continuous station and between 0.3 and 1.3 mm/a at the GPS campaign station (Figure 7). Owing to the long observation period of the continuous station, the RMS of certain measuring points may be slightly larger than that of the campaign station because of the noise interference, but most of them did not exceed 2 mm/a. The observation timespan of certain GPS campaign stations was longer than that of the continuous stations. However, owing to the limitation of the observation mode, the campaign observation inevitably excluded a considerable amount of “noise” records, whereas the “signal” (velocity) retained the information as the observation period increased and, finally, obtained a statistically smaller RMS. Certain scholars believe that the RMS of the GPS campaign stations should be increased at least two times to correspond to the continuous station (Wang and Shen, 2020). However, the RMS of the vertical movement rates of the two kinds of GPS stations were comparable after the nonstructural load deformation correction applied in this study. For GPS vertical motion, the points whose uplift rate is inconsistent with the movement of most measuring points in the same block are removed, and the remaining 212 measuring points are used for subsequent analysis.
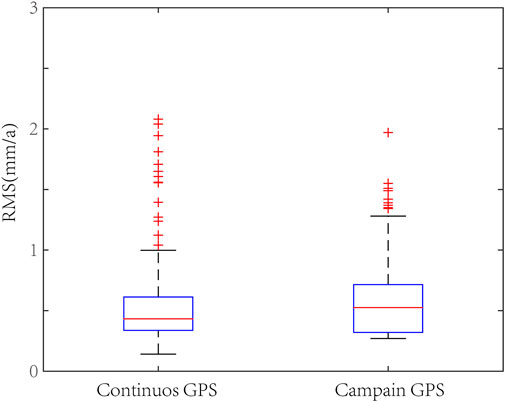
FIGURE 7. GPS measuring point vertical velocity RMS box diagram.
The GPS-derived vertical-deformation field of the Shanxi rift valley relative to the ITRF2014 reference frame is presented in Figure 8, depicting that the GPS measuring points include both uplift and subsidence. However, the uplift rate is significantly lower than the subsidence rate, generally less than 3.0 mm/a. Primarily, the uplift measurement points are distributed in the Taihang Mountain area in the east and the Lvliang Mountain area in the west. In comparison, the settlement points are mainly distributed in two types of areas: first, the Hebei Plain in the east of the Shanxi rift valley, with a relatively dense distribution of subsidence points and the largest subsidence amount. The maximum subsidence rate of the measurement points is greater than 60 mm/a. Second, the Datong, Taiyuan, and Yuncheng basins in the Shanxi rift valley. The Datong Basin exhibits a small subsidence rate (maximum rate of ∼10.0 mm/a), whereas the Taiyuan and Yuncheng basins display larger subsidence rates—maximum rates of −30.5 and −36.2 mm/a, respectively. To further analyze and study the current vertical deformation fine feature of the Shanxi rift valley, the continuous spatial distribution of vertical crustal deformation is deduced using the GPS velocity field of unified reference.
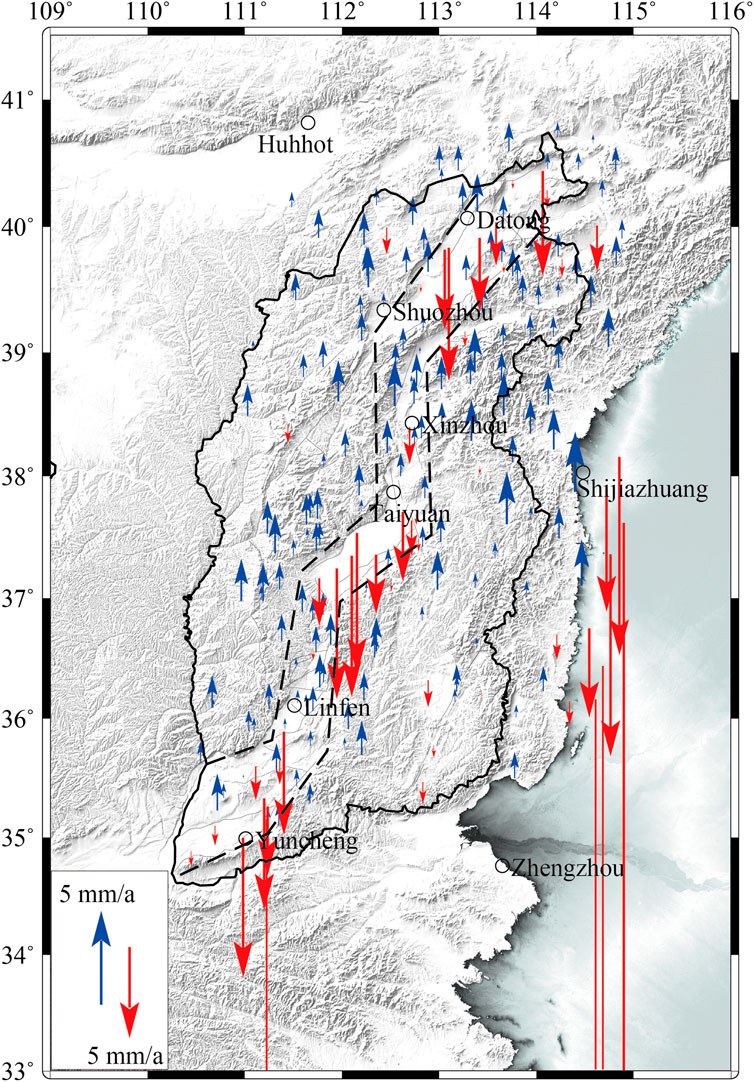
FIGURE 8. GPS vertical-deformation field in the Shanxi rift region (relative to ITRF2014 reference frame).
Due to the high gradient in crustal movement on both sides of the fault and uneven distribution of GPS measuring stations, the spatial information of regional crustal vertical deformation in the Shanxi Rift is unclear. Based on the information distribution of all observed data, spatially correlated models can be developed using traditional spatial statistical modeling methods, which yield singular values. In comparison, the adaptive least-squares collocation method considering fault activity can estimate the vertical-deformation velocity through the optimized empirical covariance function, which enables appropriate modeling of regions with significant differential crustal deformation. Herein, we apply the least-squares collocation method to construct the continuous vertical-deformation model of the Shanxi rift valley.
The Shanxi rift valley and its surrounding areas can be segmented into three relatively independent blocks along the boundary faults of the five major graben basins, namely, the Lvliang Mountain in the west, the Taihang Mountains in the east, and the central graben basin belt. In Figure 9, the block boundaries are demarcated using gray-dashed lines. According to the determined block boundary, the known observed values in each block area were respectively centralized. According to the distribution of measurement points, the correlation distance of spatial signals d was determined as 158.7 km, and following inverse calculation, the covariance function model parameter K was obtained as 0.02 (Zhang and Jiang, 1999). Considering that the vertical motion of the mountainous region on both sides is completely opposite to that of the graben basin, the point correlation on both sides of the block boundary was defined as 0.5 when the prior covariance matrix is determined using the Gaussian-type empirical covariance function. Simultaneously, the Helmert variance component was introduced to estimate the a posteriori unit-weight variance of the noise and signal, which balanced the relationship between their covariance matrices.
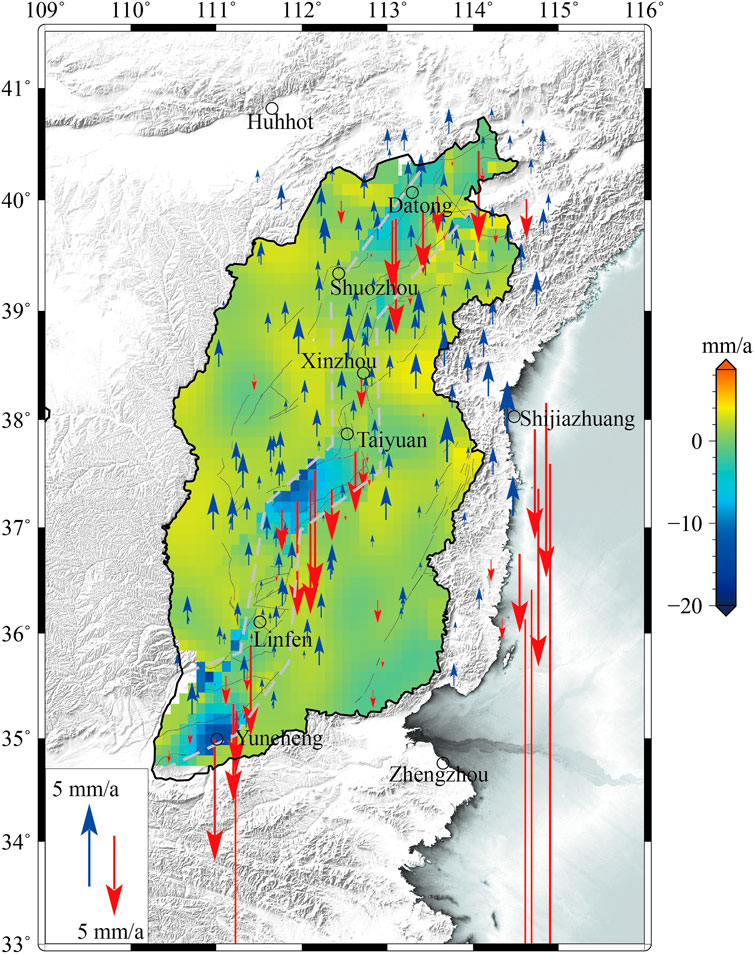
FIGURE 9. Model of vertical crustal-deformation field in the Shanxi region.
The vertical crust-deformation image of the continuous distribution of the Shanxi rift valley established based on the GPS-measured data is illustrated in Figure 9, which indicates that the vertical deformation of the Shanxi rift valley is correlated with the overall tectonic landform. The orogenic belt and plateau area compose the uplift areas, primarily including the Taihang Mountains and Lvliang Mountains on both sides of the Shanxi rift valley, and the lateral uplift areas, such as Lingshi and Shiling Pass, are situated between two graben basins. Moreover, the basins along the rift valley and plain area form the subsidence regions, including the central graben basin of the Shanxi rift valley and Hebei Plain, which is consistent with prior research results (Zhao et al., 2014). Furthermore, the average uplift rate of the Taihang and Lvliang mountains was approximately 2 mm/a, which is consistent with the InSAR monitoring results. The vertical crustal deformation in this region is unaffected by groundwater extraction, which may cause the background tectonic movement during the interseismic period (Zhao et al., 2018). Nonetheless, the subsidence of Datong, Taiyuan, and Yuncheng basins in the central rift valley is significantly large at a rate of 10–30 mm/a. Moreover, these regions experience severe groundwater extraction that causes hazardous geological disasters such as land subsidence and ground fractures (Yang et al., 2016, 2021; Peng et al., 2017; Liu et al., 2021). Although the Xinding Basin does not appear to subside, it exhibits a weak uplift that is consistent with the current horizontal extrusion deformation characteristics of the basin (Zhao et al., 2017).
The adaptive least-squares collocation method considering fault activity can adjust the empirical covariance matrix according to the structural characteristics of the Shanxi rift valley and the actual situation of the observed data, which can effectively improve the model fitting and interpolation accuracy. Specifically, in the blank observation area near the fault field, the interpolation results were obtained based on the observation results of the same structural area on same side of the fault. Overall, the interpolation results yielded no singular values, and the model results were consistent with the measured values. We believe that this method is suitable for studying the vertical-deformation characteristics of the Shanxi rift valley, and the interpolation results can represent the real deformation information of the region to a certain extent.
The current subsidence rate in the central and southern regions of the Datong Basin increases up to 9.1 mm/a, which is the most significant subsidence region in the basin. This area is structurally located in the hanging wall of the Kouquan fault, with a Cenozoic sediment thickness of 1,800 m (Xu et al., 1993). More specifically, it encloses an industrial and agricultural activity area of Datong City, and the excessive groundwater exploitation by industrial and agricultural production resulted in the drainage of several aquifers and the continuous decline of underground water level, forming three large sedimentation funnels (Guo et al., 2002; Dong et al., 2008). The present vertical-deformation rate reported herein is consistent with the spatial distribution of the subsidence funnel, which indicates that groundwater exploitation is a vital reason for the present vertical deformation of the crust in the Datong Basin.
The current subsidence rate of the Taiyuan Basin reaches up to 10.5 mm/a and is primarily distributed along and near the Jiaocheng fault. In comparison, the Taigu fault along the eastern boundary exhibits a relatively small subsidence rate: 3–4 mm/a. Geological studies have reported that the deep-fault depression in the Taiyuan Basin is mainly distributed along the Jiaocheng fault in the west. The Cenozoic sediment thickness detected by artificial seismic is from 2,000 to 3,800 m, wherein the Quaternary sediment thickness ranges from 300 to 500 m (Xu et al., 1993). Although the Cenozoic sediment thickness along the Taigu fault in the east spans only hundreds of meters, the Quaternary sediment thickness ranges only within 100–150 m. The positive correlation between the current vertical-deformation rate and the Cenozoic sediment thickness of the basin suggests that the current vertical-deformation pattern of the Taiyuan Basin is consistent with the long-term deformation on geological time scales. However, the deformation of >10 mm/a in the western region of the basin is not entirely caused by the tectonic deformation, and it is closely related to groundwater exploitation (Sun, 2016).
The current subsidence rate of Yuncheng Basin is up to 36.2 mm/a, and the subsidence center region is located in the alluvial plain of the hanging wall on the north foot of the Zhongtiaoshan fault. In this region, the Cenozoic sediment thickness is up to 5,500 m at the deepest point, the largest Cenozoic sediment thickness in the Shanxi rift valley. The types of regional groundwater include pore water in loose rocks, and the phreatic aquifer, phreatic-confined aquifer, and confined aquifer as the major groundwater exploitation layers (Huang, 2007). The excessive groundwater exploitation has formed a permanent groundwater drop funnel that reduces the pore pressure of the aquifer, resulting in severe land subsidence (Yao, 2017). Compared with the Yuncheng Basin, the vertical-deformation range and amplitude of the Linfen Basin are relatively small. In this region, the maximum thickness of the Cenozoic sediment is approximately 2,200 m and pertains to the loess platform. Moreover, the groundwater content differs, and the correlation with land subsidence is weak (Yang et al., 2016).
The present vertical deformation of the Shanxi Rift Valley is controlled by the existing structural pattern and influenced by the shallow nonstructural factors as well as the physical properties of the crustal medium. Since the Quaternary age, the faulted basins have maintained a pattern of inherited decline, but the subsidence rate expresses prominent inhomogeneity, which is positively correlated with the Cenozoic sediment thickness of the basins. This type of deformation occurs only on the shallow surface of the Earth. Based on seismic geology, the deformation is much larger than the dip-slip rate of ∼1 mm/a (Miao et al., 2014), and based on leveling, the vertical movement rate of 6–8 mm/a (Hao et al., 2016) is completely different from the fault activity mechanism driven by deep sliding (Qiao et al., 2019; Liu, 2021).
The subduction of the Indian plate to the Eurasian plate promoted the eastward expansion of the Tibetan Plateau along with the vertical uplift, and the eastward transmission of the tectonic stress generated the counterclockwise rotation of the Ordos block and the eastward extrusion escape of the Qinling Mountain (Deng and You, 1985; Xu et al., 1993; Zhang et al., 2019). The northwestern boundary of the Pacific plate subducted westward at the Japan Trench, and the westward progression of the flattened oceanic plate at a depth of 660 km possibly extended to the Shanxi rift valley (Huang and Zhao, 2006; Lei, 2012; Shao et al., 2016). Therefore, the far-field effect caused by the collision of the Indian and Eurasian plates and the mantle upwelling resulting from the subduction of the Pacific plate affected the tectonic movement and deformation of the Shanxi rift valley through various mechanisms.
The regional vertical crustal-deformation images presented in this paper reflect the inherited deformation of the basin subsidence and mountain uplift since the neotectonic movement. However, as the vertical crustal deformation in the basin is gravely affected by nontectonic interference, the vertical tectonic differential deformation rate between the faulted basin and the mountainous regions on both sides cannot be accurately determined at present. Considering the Datong Basin in the north of the rift valley as an example, a vertical differential deformation rate of 2.5 mm/a was obtained from the observation data of ground fracture activity in the basin. After deducting the displacement caused by seasonal groundwater exploitation, the vertical differential deformation rate caused by tectonic activities ranged from 0.75 to 1.0 mm/a (Liu, 2021), which is approximate to the variation range of 0.12–1.48 mm/a of a normal fault-type vertical slip rate in the Datong Basin derived from geological data (Zhang et al., 1998; Deng, 2002). Therefore, the neotectonic movement and human activities, such as groundwater exploitation, combinedly affect the vertical crustal deformation in the Shanxi rift valley. In particular, neotectonic movement acts as the controlling factor, and under the compound influence of upper mantle uplift, regional tensile stress, and tectonic block movement, the fault system progress along the fault and forms a hidden fault system on its hanging wall (Wang et al., 2020). In certain regions of the basin, excessive groundwater exploitation has formed a permanent groundwater downward funnel, which consequently reduced the aquifer pore pressure and triggered severe land subsidence.
The velocity variations occurring because of crustal deformation in regions with strong tectonic activity cannot be neglected, their estimation using accurate functional models is challenging (Diao and Xiong, 2008; Li et al., 2012; Wang et al., 2020). The least-squares collocation is a typical statistical method with theoretical rigor, which poses certain advantages when applied for estimating the signal in the spatial domain based on the crustal-deformation data of limited observation points. However, if the crustal-deformation field exhibits discontinuous variations caused by fault activity, the least-squares method can unreasonably estimate the correlation of point velocities on both sides of faults, which reduces the fitting accuracy of the velocity values in the near-fault region. Thus, the crustal deformation is artificially weakened or annihilated. The estimation of the variance component for adjusting the observation noise and signal in proportion to the covariance can yield a relationship that is more proximate to the real value. This improves the precision of the fitting and interpolation model to a certain extent. However, the interpolation accuracy of the deformation field remains inferior in the significant local-effect areas such as fault near-field. Thus, the model cannot facilely yield reliable fitting results in case of a wide range of measured data gaps for the above regions.
The empirical covariance matrix can be adjusted with the adaptive least-squares collocation considering the regional structural characteristics and the actual situation of the observed data, which effectively improves the accuracy of model fitting and interpolation in regions with fault activity. Specifically, the above-stated method delivers higher interpolation accuracy compared with the least-squares collocation method considering only the tectonic characteristics in the observation blank region near the fault field, which facilitates the current fulfillment of regional crustal deformation monitoring and research. In addition to providing an accurate description of the local deformation characteristics inside the basin, the vertical crustal-deformation field in the Shanxi rift valley based on the geological structure and GPS data can reveal the discontinuous deformation characteristics between the mountainous regions on both sides and the graben basin.
Notably, the interpolation method based on the mathematical model is insufficient in the physical sense. Regardless of the least-squares collocation method, the relationship between the interpolation point and the known point can be derived from the mathematical perspective. In fact, the movement and deformation of the Earth’s crust are driven by certain dynamic mechanisms, such as the surface movement rate of an observation point is an external response under dynamic action. Thus, revealing the internal physical relationship between the motion of every point position can accurately evaluate the deformation rate. In addition, this study considered only a strike-slip and dip-slip fault activity, whereas fault movement, and tectonic deformation are extremely complex to be considered in practice. The extensive Late Quaternary active faults in the Chinese mainland segmented the Earth’s crust into multiple levels of active blocks, thereby presenting extremely complex motion and deformation characteristics under the action of tectonic stress. Based on the variance among multiple observation data and geological structural environment, several algorithm models and parameter settings should be utilized according to the specific problems, which requires further in-depth research.
The adaptive least-squares collocation model considering fault activity effect can yield more reliable interpolation prediction results in case of relatively sparse actual observation data, and it exhibits appropriate robustness. These results revealed fine characteristics of vertical deformation in the Shanxi rift valley and provided reliable data to analyze the characteristics and tectonic implications of the present vertical deformation of the rift, thereby clarifying the mechanism of the present vertical deformation of the rift.
The current vertical crustal deformation in the rift valley follows the deformation pattern continuing for millions of years of geological history—generally characterized by continuous subsidence of the graben basin and relative uplift of the mountainous regions on both sides. The average uplift rate of the mountains on both sides was 2–3 mm/a, which may have been caused by the background tectonic deformation. Expectedly, the nonuniform subsidence rate of the graben basins was positively correlated with the Cenozoic sediment thickness in spatial distribution. However, the subsidence of 10–30 mm/a in certain regions was not entirely driven by tectonic deformation; it is closely associated with human production and life, such as groundwater exploitation.
Therefore, the complex yet orderly spatial distribution of the vertical deformation in the Shanxi rift valley and its surrounding regions reveals the control of regional geological structure pattern on its current vertical deformation and the influence of nontectonic factors on its shallow crust.
The raw data supporting the conclusion of this article will be made available by the authors, without undue reservation.
RL performed data processing and modeling and drafted the manuscript; JZ revised the manuscript and analyzed the results; WG and HC illustrated the figures. All authors contributed to the article and approved the submitted version.
This research was funded jointly by the National Natural Science Foundation of China (42171424), the Basic Research Plan of Shanxi Province (202103021224438), the Science and Technology Research and Development Program of Shanxi Province (No. 20140313023-1), Earthquake Prediction Open Fund of China Earthquake Administration (XH22031D), Shanxi Taiyuan Continental Rift Dynamics National Observation and Research Station (Project Nos NORSTY20-09 and NORSTY20-01), Scientific Research Project of Shanxi Earthquake Administration (SBK-2121).
We would like to thank Associate Researcher Shiming Liang for his guidance in GPS data processing and senior engineer Yuebing Wang for providing GPS data.
The authors declare that the research was conducted in the absence of any commercial or financial relationships that could be construed as a potential conflict of interest.
The reviewer LJ declared a shared affiliation with the author(s) RL, WG, and HC to the handling editor at the time of review.
All claims expressed in this article are solely those of the authors and do not necessarily represent those of their affiliated organizations, or those of the publisher, the editors and the reviewers. Any product that may be evaluated in this article, or claim that may be made by its manufacturer, is not guaranteed or endorsed by the publisher.
Blewitt, G., and Lavallée, D. (2002). Effect of annual signals on geodetic velocity. J. Geophys. Res. Solid Earth. 107, ETG 9-1–ETG 9-11. doi:10.1029/2001JB000570
Bos, M. S., Bastos, L., and Fernandes, R. M. S. (2010). The influence of seasonal signals on the estimation of the tectonic motion in short continuous GPS time-series. J. Geodyn. 49, 205–209. doi:10.1016/j.jog.2009.10.005
Bai, L., and Hou, T. (1994). Deep Geophys. Explor. Shaanxi Rift Syst. N. China Earthq. Sci. 12, 27–35.
Cen, M. (2015). Structural analysis on the formation mechanism of Datong Basin. Geol. Rev. 61, 1235–1247. doi:10.16509/j.georeview.2015.06.004
Chai, H. Z., Cui, Y., and Ming, F. (2009). The determination of Chinese mainland crustal movement model using least-squares collocation. Acta Geod. Cartogr. Sin. 38, 61–65.
Crone, A. J., and Haller, K. M. (1991). Segmentation and the coseismic behavior of Basin and Range normal faults: examples from east-central Idaho and southwestern Montana, U.S.A. U.S.A. J. Struct. Geol. 13, 151–164. doi:10.1016/0191-8141(91)90063-O
Deng, Q., Zhang, P., Ran, Y., Yang, X., Min, W., and Chu, Q. (2002). Basic characteristics of active tectonics in China. Sci. Sin. (Terrae). 32, 1021–1030. doi:10.3321/j.issn:1006-9267.2002.12.007
Deng, Q., and You, H. (1985). The characteristics of tectonic activity and its formation mechanism in the rifted basins around Ordos 1985. Beijing: Institute of Geology, China Earthquake Administration Seismological Press, 58–78.
Diao, F., and Xiong, X. (2008). Interpolation Approach for Velocity Field of Crustal Movement. Geom. Info. Sci. 33, 627–630.
Dong, D., Fang, P., Bock, Y., Cheng, M. K., and Miyazaki, S. (2002). Anatomy of apparent seasonal variations from GPS-derived site position time series. J. Geophys. Res. Solid Earth. 107, ETG 9-1–ETG 9-16. doi:10.1029/2001jb000573
Dong, D., Fang, P., Bock, Y., Webb, F., Prawirodirdjo, L., Kedar, S., et al. (2006). Spatiotemporal filtering using principal component analysis and Karhunen–Loeve expansion approaches for regional GPS network analysis. J. Geophys. Res. Solid Earth. 111, 1–16. doi:10.1029/2005jb003806
Dong, S., Tang, Z., Liu, B., and Su, C. (2008). Numerical simulation of groundwater in Datong basin and evaluation of optimal allocation of water resources. Geotech. Investig. Surv. 3, 30–35.
Guo, H., Wang, Y., Wang, R., and Deng, A. (2002). Shallow groundwater environment evolution impacted by intensive anthropic activities in Datong city. Bull. Geol. Sci. Technol. 21, 65–72. doi:10.3969/j.issn.1000-7849.2002.04.014
Hao, M., Wang, Q., Cui, D., Liu, L., and Zhou, L. (2016). Present-day crustal vertical motion around the Ordos block constrained by precise leveling and GPS data. Surv. Geophys. 37, 923–936. doi:10.1007/s10712-016-9375-1
Herring, T. A., King, R. W., and McClusky, S. C. (2010). GAMIT Reference Manual, Release 10.4. Cambridge. Mass. Inst.of Technol.
Hu, H., Huang, L., and Wang, J. (1987). Recent structural activity in Linfen basin. China Earthq. Eng. J. 4, 90–92.
Hu, H., Huang, L., and Yang, G. (1993). Recent vertical crustal deformation in the coastal area of eastern. Chin. J. Geol. Sci. Geol. Sin. 3, 270–278.
Huang, J., and Zhao, D. (2006). High-resolution mantle tomography of China and surrounding regions. J. Geophys. Res. 111, B09305. doi:10.1029/2005JB004066
Huang, X., Dong, S., Tang, Z., and Hou, X. (2007). Groundwater numerical simulation and prediction of Yuncheng basin. Resour. Environ. Eng. 21, 402–406.
Jiang, W. (2013). Cause analysis of the non-linear variation of the IGS reference station coordinate time series inside China. Chin. J. Geophys. 56, 2228–2237. doi:10.1007/s11425-013-4584-2
Jiang, Z., and Liu, J. (2010). The method in establishing strain field and velocity field of crustal movement using least squares collocation. Chin. J. Geophys. 53, 1109–1117. doi:10.3969/j.issn.0001-5733.2010.05.011
Lei, J. (2012). Upper-mantle tomography and dynamics beneath the North China Craton. J. Geophys. Res. Solid Earth 117, 1–29. doi:10.1029/2012jb009212
Li, B., Atakan, K., Sørensen, M. B., and Havskov, J. (2015). Stress pattern of the Shanxi rift system, North China, inferred from the inversion of new focal mechanisms. Geophys. J. Int. 201, 505–527. doi:10.1093/gji/ggv025
Li, C., Li, J., and Qu, W. (2012). Establishing regional crustal movement velocity field with collocation model based on displacement principle. J. Geod. Geodyn. 32, 33–36.
Li, Q. (1980). General features of the stress field in the crust of north China. Chin. J. Geophys. 4, 376–388.
Li, Q., Jin, Y., and Yu, X. (1982). Focal mechanisms and crustal stress field in north China. Acta Seismol. Sin. 1, 55–61.
Li, S. (1997). The morphotectonics, seismicity, and origin of Shanxi Graben system, East China. Acta Sci. Nat. Univ. 04, 61–68.
Li, Y. (2003). Movement and strain state of active blocks in Chinese mainland. Sci. Sin. (Terrae). 33, 65–81. doi:10.3321/j.issn:1006-9267.2003.z1.008
Liang, S. (2014). Three-dimensional velocity field of present-day crustal motion of the Tibetan plateau inferred from GPS measurement (Beijing: Institute of Geology).
Liu, G., Ma, T., Huang, P., and Wang, S. (1982). Present-day tectonic movement along active faults in the east of China’s mainland. Seismol. Geol. 4, 3–16.
Liu, R., Zhang, J., Guo, W., and Chen, H. (2021). Study on the recent deformation characteristic and structural deformation model of the south-eastern margin of Ordos block. Seismol. Geol. 43, 540–558. doi:10.3969/j.issn.0253-4967.2021.03.005
Liu, R., Yang, C., Wang, Q., and Ji, L. (2021). Possible mechanism of the formation of the Jichechang ground fissure in Datong, China, based on in-situ observations. Environ. Earth Sci. 80, 1–13. doi:10.1007/s12665-021-09715-2
Mangiarotti, S., Cazenave, A., Soudarin, L., and Crétaux, J. F. (2001). Annual vertical crustal motions predicted from surface mass redistribution and observed by space geodesy. J. Geophys. Res. 106, 4277–4291. doi:10.1029/2000JB900347
Miao, D., Li, Y., Lv, S., Tian, J., Wang, Y., and Si, S. (2014). Neotectonic activity in Xinxian segment of the North Zhongtiao Mountain fault zone, Shanxi. Geol. Resour. 33, 665–673.
Okada, Y. (1985). Surface deformation due to shear and tensile faults in a half-space. Bull. Seismol. Soc. Am. 75, 1135–1154. doi:10.1785/BSSA0750041135
Pan, Y., Hammond, W. C., Ding, H., Mallick, R., Jiang, W., Xu, X., et al. (2021). GPS imaging of vertical bedrock displacements: Quantification of two-dimensional vertical crustal deformation in China. J. Geophys. Res. Solid Earth. 126, JB020951. doi:10.1029/2020jb020951
Peng, J., Lu, Q., and Huang, Q. (2017). Ground fissure disaster in fenwei basin. Science Press, Beijing.
Qiao, X., Qu, C., Shan, X., Li, Y., and Zhu, C. (2019). Deformation characteristics and kinematic parameters inversion of Haiyuan fault zone based on time series, inSAR. Seismol. Geol. 41, 1481–1496.
Roberts, G. P., and Koukouvelas, I. K. (1996). Structural and seismological segmentation of the Gulf of Corinth fault system: Implications for models of fault growth. Ann. Geofis. 39, 618–646. doi:10.4401/ag-3996
Shao, Z., Wang, F., and Li, H. (2016). Review on researches associated with 2011 Mw9.0 Tohonku-Oki earthquake. Earthquake 36, 1–21. doi:10.3969/j.issn.1000-3274.2016.04.001
Sheng, C., Gan, W., Liang, S., Chen, W., and Xiao, G. (2014). Identification and elimination of non-tectonic caused by land water from time series in the Western Yunnan Province based on GRACE observations. Chin. J. Geophys. 57, 42–52. doi:10.6038/cjg20140105
Sun, X. (2016). Relationship between Ground Fissures, Groundwater Exploration and Land Subsidence in Taiyuan Basin. Chin. J. Geol. Haz. Control. 27, 91–98.
Tan, H., Shen, C., Li, H., and Li, J. (2009). Characteristics of Surface Deformation Caused by Fault Dislocation. J. Geod. Geodyn. 29, 42–49. doi:10.3969/j.issn.1671-5942.2009.03.008
Wang, F., Peng, J., Chen, Z., Wang, Q., Meng, Z., Qiao, J., et al. (2020). Development characteristics and mechanisms of damage-causing urban ground fissures in Datong City, China. Eng. Geol. 271, 105605. doi:10.1016/j.enggeo.2020.105605
Wang, H., Ren, Y., Lian, L., Wang, J., Cheng, Y., Wang, Y., et al. (2020). Research on an integrational scheme of large-scale GNSS network data processing and establishment of the horizontal grid velocity field model in Chinese Mainland. J. Geod. Geodyn. 40, 881–887 + 897.
Wang, M. (2009). Analysis of GPS data with high precision & study on present-day crustal deformation in China. Beijing: Institute of Geology.
Wang, M., and Shen, Z. K. (2020). Present-day crustal deformation of continental China derived from GPS and its tectonic implications. J. Geophys. Res. Solid Earth. 125, B018774. doi:10.1029/2019JB018774
Wdowinski, S., Bock, Y., Zhang, J., Fang, P., and Genrich, J. (1997). Southern California permanent GPS geodetic array: Spatial filtering of daily positions for estimating coseismic and postseismic displacements induced by the 1992 Landers earthquake. J. Geophys. Res. 102, 18057–18070. doi:10.1029/97JB01378
Xu, X., Ma, X., and Deng, Q. (1993). Neotectonic activity along the Shanxi rift system, China. Tectonophysics 219, 305–325. doi:10.1016/0040-1951(93)90180-R
Xu, X., and Ma, X. (1992). Geodynamics of the Shanxi rift system, China. Tectonophysics 208, 325–340. doi:10.1016/0040-1951(92)90353-8
Yang, C. S., Wei, Y., Xu, Q., Liu, R., and Liu, Y. (2021). Large-area ground deformation investigation over Taiyuan Basin, China 2007–2011 revealed by ALOS PALSAR imagery. Arab. J. Geosci. 14, 2055. doi:10.1007/s12517-021-08325-3
Yang, C. S., Zhang, F., Liu, R., Hou, J., Zhang, Q., and Zhao, C. (2020). Ground deformation and fissure activity of the Yuncheng Basin (China) revealed by multiband time series InSAR. Adv. Space Res. 66, 490–504. doi:10.1016/j.asr.2020.04.039
Yang, C. S., Zhang, Q., Xu, Q., Zhao, C., Peng, J., and Ji, L. (2016). Complex Deformation Monitoring over the Linfen–Yuncheng Basin (China) with Time Series InSAR Technology. Remote Sens. 8, 284–313. doi:10.3390/rs8040284
Yang, Y., Zhang, J., and Zhang, L. (2008). Variance component estimation based collocation and its application in GIS error fitting. Acta Geod. Cartogr. Sin. 37, 152–157. doi:10.3321/j.issn:1001-1595.2008.02.004
Yao, L. (2017). Analysis of the status quo and treatment measures of the groundwater funnel area in Yuncheng City. Ground Water 39, 57–59.
Zhan, W., Li, F., Zhu, S., and Zhang, J. (2016). Analysis and Test of Correction to Vertical Velocity Measured by GPS Mobile Observation with Continuous Observation. Geom. Info. Sci. 41, 963–968. doi:10.1002/gepi.22030
Zhang, C. (1993). Characteristics and origin of the vertical deformation in Shanxi Graben system, Shanxi Province. Earthq. Res. China. 9, 327–333.
Zhang, G., Yang, Z., Wang, Q., and Liu, T. (2011). Study on movement characteristic of Bayanhar Block in the Qinghai–Tibet Plateau based on least-squares collocation model. J. Earth Sci. Environ. 33, 213–216. doi:10.3969/j.issn.1672-6561.2011.02.018
Zhang, Q., and Zhu, W. (2000). Preliminary construction of motion models of tectonic blocks in China’s crust. Chin. Sci. Bull. 45, 967–974. doi:10.1360/csb2000-45-9-967
Zhang, W., Li, Y., Ma, F., and Zhong, J. (1981). On the mechanical mechanism of the formation of graben. Chin. J. Geol. (Sci. Geol. Sin.) 1, 1–11.
Zhang, X., and Jiang, Z. (2001). Preliminary study on method of the least square collocation considering regional tectonic features. Earthq. Res. China. 17, 403–407.
Zhang, X., and Jiang, Z. (1999). Study on some questions of dynamic pictures of crustal deformation and strain fields obtained by the least square collocation. J. Geod. Geodyn. 19, 32–39. doi:10.3969/j.issn.1671-5942.1999.03.006
Zhang, Y. Q., Mercier, J. L., and Vergély, P. (1998). Extension in the graben systems around the Ordos (China), and its contribution to the extrusion tectonics of south China with respect to Gobi–Mongolia. Tectonophysics 285, 41–75. doi:10.1016/S0040-1951(97)00170-4
Zhang, Y., Shi, W., and Dong, S. (2019). Neotectonics of North China: Interplay between far-field effect of India–Eurasia collision and Pacific subduction related deep-seated mantle up welling. Acta Geol. Sin. 93, 971–1001. doi:10.3969/j.issn.0001-5717.2019.05.001
Zhang, Z., Fang, X., and Yan, H. (1987). A mechanical model of the formation mechanism of the Shanxi Graben zone and the characteristics of Shanxi earthquake zone. Acta Seismol. Sin. 1, 28–36.
Zhao, B., Nie, Z., Huang, Y., Wang, W., Zhang, C., and Tan, K. (2014). Vertical motion of north China inferred from dense GPS measurements. J. Geod. Geodyn. 34, 35–39.
Zhao, B., Zhang, C., Wang, D., Huang, Y., Tan, K., Du, R., et al. (2017). Contemporary kinematics of the Ordos block, North China and its adjacent rift systems constrained by dense GPS observations. J. Asian Earth Sci. 135, 257–267. doi:10.1016/j.jseaes.2016.12.045
Zhao, C. Y., Liu, C., Zhang, Q., Lu, Z., and Yang, C. (2018). Deformation of Linfen-Yuncheng Basin (China) and its mechanisms revealed by Π-RATE, inSAR technique. Remote Sens. Environ. 218, 221–230. doi:10.1016/j.rse.2018.09.021
Zhuo, Y., S.A., Bornyakov., Guo, Y., Ma, J., and Sherman, S.I. (2016). Influences of obliquity angle difference on the evolution of Fen–Wei Rift: A study from segmented transtension clay model. Seismol. Geol. 38, 259–277.
Zou, C., Zhai, G., Zhang, G., Wang, H., Zhang, G., Li, J., et al. (2015). Formation, distribution, potential and prediction of global conventional and unconventional hydrocarbon resources. Petrol Explor dev+ 42, 14–28. doi:10.1016/s1876-3804(15)60002-7
Zwaan, F., Corti, G., Keir, D., and Sani, F. (2020). A review of tectonic models for the rifted margin of Afar: Implications for continental break-up and passive margin formation. J. Afr. Earth Sci. 164, 103649. doi:10.1016/j.jafrearsci.2019.103649
Keywords: vertical deformation field, Helmert estimation, GPS, Shanxi rift valley, least-square collocation
Citation: Liu R, Zhang J, Guo W and Chen H (2023) Adaptive vertical-deformation field estimation and current tectonic deformation significance analysis in Shanxi rift valley. Front. Earth Sci. 11:1083562. doi: 10.3389/feart.2023.1083562
Received: 29 October 2022; Accepted: 05 May 2023;
Published: 18 May 2023.
Edited by:
Jeffrey Todd Freymueller, Michigan State University, United StatesReviewed by:
Xiwei Xu, Ministry of Emergency Management, ChinaCopyright © 2023 Liu, Zhang, Guo and Chen. This is an open-access article distributed under the terms of the Creative Commons Attribution License (CC BY). The use, distribution or reproduction in other forums is permitted, provided the original author(s) and the copyright owner(s) are credited and that the original publication in this journal is cited, in accordance with accepted academic practice. No use, distribution or reproduction is permitted which does not comply with these terms.
*Correspondence: Jin Zhang, empncHNAMTYzLmNvbQ==
Disclaimer: All claims expressed in this article are solely those of the authors and do not necessarily represent those of their affiliated organizations, or those of the publisher, the editors and the reviewers. Any product that may be evaluated in this article or claim that may be made by its manufacturer is not guaranteed or endorsed by the publisher.
Research integrity at Frontiers
Learn more about the work of our research integrity team to safeguard the quality of each article we publish.