 Pouria Marzban1,2*
 Stefan Bredemeyer1,3
 Thomas R. Walter1,4
 Friederike Kästner5
 Daniel Müller1
 Sabine Chabrillat5,6
- 1GFZ German Research Centre for Geosciences, Physics of Earthquakes and Volcanoes, Telegrafenberg, Potsdam, Germany
- 2German Archaeological Institute (DAI), Scientific Computing Unit, Central Research Services, Berlin, Germany
- 3GEOMAR Helmholtz Center for Ocean Research Kiel, Research Division 4, Magmatic and Hydrothermal Systems, Kiel, Germany
- 4Institute of Geosciences, University of Potsdam, Potsdam, Germany
- 5GFZ German Research Center for Geosciences, Remote Sensing and Geoinformatics, Telegrafenberg, Potsdam, Germany
- 6Institute of Soil Sciences, Leibniz University Hannover (LUH), Hannover, Germany
Volcanic flanks subject to hydrothermal alteration become mechanically weak and gravitationally unstable, which may collapse and develop far-reaching landslides. The dynamics and trajectories of volcanic landslides are hardly preserved and challenging to determine, which is due to the steep slopes and the inherent instability. Here we analyze the proximal deposits of the 21 July 2014, landslide at Askja (Iceland), by combining high-resolution imagery from satellites and Unoccupied Aircraft Systems. We performed a Principal Component Analysis in combination with supervised classification to identify different material classes and altered rocks. We trained a maximum-likelihood classifier and were able to distinguish 7 different material classes and compare these to ground-based hyperspectral measurements that we conducted on different rock types found in the field. Results underline that the Northern part of the landslide source region is a hydrothermally altered material class, which bifurcates halfway downslope and then extends to the lake. We find that a large portion of this material is originating from a lava body at the landslide headwall, which is the persistent site of intense hydrothermal activity. By comparing the classification result to in-situ hyperspectral measurements, we were able to further identify the involved types of rocks and the degree of hydrothermal alteration. We further discuss associated effects of mechanical weakening and the relevance of the heterogeneous materials for the dynamics and processes of the landslide. As the study demonstrates the success of our approach for identification of altered and less altered materials, important implications for hazard assessment in the Askja caldera and elsewhere can be drawn.
1 Introduction
Landslides, slope instability, mass movements, and sector collapses are among the most hazardous events in volcanic areas. All these are driven by gravitational loading, where the slope and strength of a volcanic material are controlled by its edifice height (Delaney, 1992). Consequently, taller volcanoes are clearly associated with more common lateral collapse scars (Francis and Wells, 1988; Norini et al., 2020). Some sector collapses produce far-reaching debris avalanches (van Wyk de Vries and Davies, 2015; van Wyk de Vries and Delcamp, 2015) such as the catastrophic event at Socompa volcano which is one of the earliest detailed examples documented (van Wyk de Vries et al., 2001). In total such events caused about 20,000 fatalities by historic collapses alone (Siebert, 1984; Siebert et al., 1987). Even small sector collapses may enter the sea and produce tsunami, such as occurred on 22 December 2018 at Anak Krakatau (Walter et al., 2019). Other historical collapses occurred at El Hierro on the Canary Islands (Gee et al., 2001), or at Mount St. Helens (Lipman and Mullineaux, 1981).
Drivers of volcano flank collapses may be complex, and a number of different sources have been identified, ranging from pressurization of pore fluids, oversteepening by material addition or basal erosion, and triggering by earthquakes (McGuire, 1996). Volcanic edifices are almost permanently affected by a number of processes that weaken their stability, which include an overall acting weathering and erosion associated to climatic processes (Day et al., 1999; Hürlimann et al., 1999; Kerle and de Vries, 2001) and a commonly spatially more confined acting degradation of rocks through hydrothermal activity involving hyperacidic brines (Lopez and Williams, 1993; Kempter and Rowe, 2000; van Wyk de Vries et al., 2000; Reid et al., 2001; Varekamp et al., 2001). Similarly, as volcanic edifices may collapse, also caldera walls may become unstable and produce large landslides. In some cases also a combination of edifice collapse and caldera collapse has been inferred, such as the edifices surrounding the Uzon caldera in Kamchatka (Belousov et al., 2005). The material composition, particularly of large landslides in such a setting can be very complex (Ward et al., 2020). Identification of the hydrothermally weakened materials, however, is challenging and may be indirectly advanced using remote sensing methods. The altering rocks change their porosity, permeability and may reduce their strength by a factor of ten or even more (Heap et al., 2019).
The analysis of satellite spectral data allows monitoring and mapping minerals on the Earth’s surface, allowing deciphering effects of alteration, weathering, erosional and depositional processes in the context of changing weather, climate, and tectonics (Cudahy et al., 2016). Remote sensing imagery has a very high potential to access sites of geohazards. Hydrothermal activity commonly influences the surrounding rock masses, leading to chemical interaction with hydrothermal fluids and a hydrothermal (re-)mineralization that is also of interest for exploration geologists (Pirajno, 1992). At the surface, the spatial distribution of those hydrothermally altered rocks is key to identify potential mineral deposits and hydrothermal systems (Rajesh, 2004). The presence of iron oxides/hydroxides and clay minerals, in particular, with spectral signatures that are identifiable in the visible/shortwave infrared (VSWIR) portion of the electromagnetic spectrum, is a common indicator for identifying hydrothermal alteration zones (Bedell et al., 2009; Bedini, 2017). In this view, clays, with their hydroxyl bearing minerals, can be remotely identified through their spectral characteristics. Effective methods to identify the presence of iron-oxides and hydrous mineral species have been implemented in multispectral satellites such as Landsat, Sentinel-2, or ASTER (Mia et al., 2019; Sekandari et al., 2020; Tompolidi et al., 2020; Aguilera et al., 2021), or airborne instruments such as AVIRIS (Crowley and Zimbelman, 1997). However, spatial and spectral resolutions often do not allow locating details in the sub-meter scale so that their value for examination of very localized hydrothermal zones has been limited (spatially 10–30 m and spectrally 4–15 bands at best). However, drone-based data acquisitions and hyperspectral point measurements may provide a landmark change allowing accessing volcanic regions (James et al., 2017; James et al., 2018; Govil et al., 2021). Hyperspectral point spectroradiometer with a high spectral resolution (narrow, spectrally contiguous wavelength) in visible-infrared and shortwave infrared (VNIR-SWIR) wavelength region may allow a detailed and fast identification of hydrothermally altered facies in the field without time-consuming and cost-intensive laboratory analysis (Schwartz et al., 2011; Govil et al., 2021). A rapid, easy-to-use and portable hyperspectral system provides information of the chemical composition of the absorbing mineral, e.g., controlled by the shape, depth and position of the spectral features (Pazand et al., 2013). A quick monitoring of hydrothermal zones is still missing or was not often used in areas with rough terrain (e.g., Madani, 2015).
The study site is located on the rim of a caldera lake, in eastern Iceland (Figure 1). On 21 July 2014, a massive landslide occurred at the steep Askja caldera rim, mobilizing an estimated volume of 35–80 × 106 m³ (Schöpa et al., 2018). Others calculated differently and there seems to be some controversy about the actual volumes (Jóhannesson et al., 2018), e.g., 12–50 × 106 m3 (Gylfadóttir et al., 2017), 30–50 × 106 m3 (Helgason et al., 2019) and 20–50 × 106 m3 (Saemundsson et al., 2015). The most recent estimation is 20 × 106 m3, half of which was deposited in the lake and the other half on the shore (Eliasson and Sæmundsson, 2021). The event was recorded by seismic stations located south of the Askja caldera (Schöpa et al., 2018) and is also reported by eyewitnesses close on-site (Helgason et al., 2019). The flank was generally known to be a site of intense hydrothermal alteration and fumarole degassing activity, where frequent small-scale rock falls posed a hazard to daily hikers. When a significant portion of the southeastern flank slipped into the caldera lake (Öskjuvatn), it triggered a tsunami that traveled throughout the lake with reported run-up heights of 60–80 m above lake level (Gylfadóttir et al., 2017), with impact for the shore around the lake (Rauter et al., 2022). He collapsed flank allows studying deposits that did not travel far and to explore how moving rock masses are disintegrated, and mixed as a consequence of weak materials. Therefore, investigations of trigger mechanisms, detailed understanding of the flow dynamics and mass redistributions of this event are crucial.
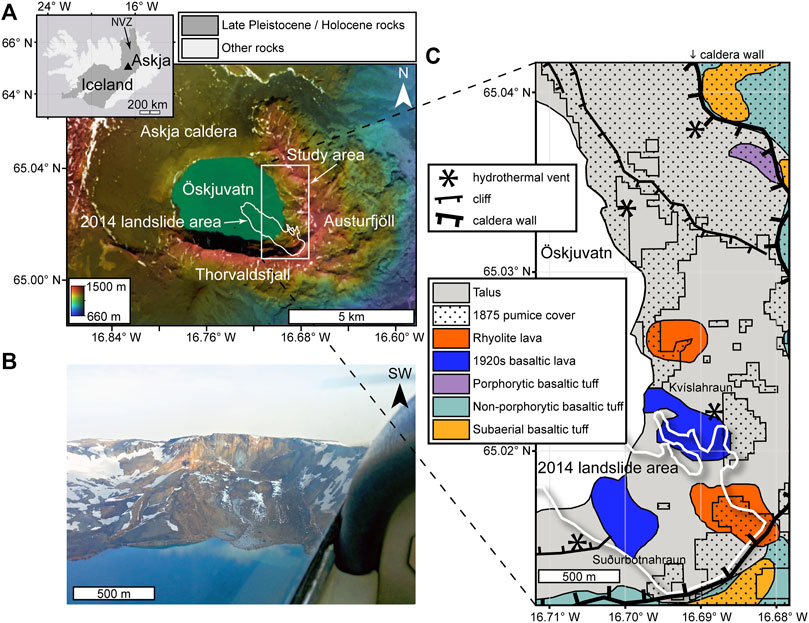
FIGURE 1. Area of the 21 July 2014 landslide. (A) Landsat 8 satellite image (bands 4-3-2, scene of 6 September 2014) and EU-DEM v.1.0 elevation map (showing the topography) of the Askja Caldera in the Northern Volcanic Zone (NVZ) of Iceland (see inset map). The location of the study area on the east of Lake Öskjuvatn and the areal extent of the 2014 landslide are outlined in white (landslide outline adapted from Gylfadóttir et al., 2016). (B) Aerial photograph taken one day after the landslide, showing the landslide headwall, and the light-colored red-brownish altered rocks partly covering black basaltic lava-flows (image provided by Magnus T. Gudmundsson). (C) Pre-slide geological map of the study area detailing the onshore portion of the landslide (lithological units adapted from maps of Graettinger, 2012; Graettinger et al., 2013, shoreline and caldera wall morphology adapted from post-slide VHR satellite imagery). The approximate extent of the 2014 landslide is shown by the white outline.
In an attempt to analyze the lithological and geomorphological consequences of the 2014 Askja landslide, we have realized a series of Unoccupied Aircraft System (UAS) surveys in August 2019 in order to acquire highly resolved visible range imagery of the eastern part of the Askja caldera which contains the 2014 landslide deposition area. For a detailed characterization and thematic mapping of the deposited materials we applied a machine learning based classification approach utilizing Principal Component Analysis (PCA) to highlight relevant features in our airborne imagery, as already has successfully been done in other studies in order to classify different volcanic materials (Amici et al., 2014; Kereszturi et al., 2018), or for localization of geothermal areas and sulfur deposits (Müller et al., 2021). Other studies shown that applying PCA is helpful in identifying weakened materials by hydrothermal activities (Darmavan et al., 2022).
Here we considered the visible bands of RapidEye-1 and PlanetScope DOVEs satellite imagery, newly acquired high-resolution visible range imagery from UAS and ground-based hyperspectral point measurements (https://doi.org/10.5281/zenodo.7575783) to analyze the materials that collapsed in a hydrothermally affected region. The UAS data provide high spatial data needed for mapping details of the landslide area. The ground-based hyperspectral point measurements were carried out in the VNIR-SWIR wavelength range (350–2,500 nm) using a High-Resolution Field Spectroradiometer on representative rock surfaces in the field, to better characterize the different rock types and to validate our classification of different rock units from drone imagery. Here we present a detailed description of how we processed our imagery data from the drone camera and furthermore, how we proceeded in extracting information from that by means of PCA and classification methods, highlighting the importance of hydrothermal alteration for caldera wall collapses.
2 Geologic setting
Iceland is the subaerial part of a divergent plate boundary where the Eurasian plate and the North American plate are drifting apart at average 2 cm/yr (Sigmundsson, 2006). The uprise of the oceanic crust and magmatism in this area is also strongly affected by a colocated mantle plume, giving rise to the formation of the island about 16–18 million years ago (Sigmundsson et al., 2020).
The Askja volcanic system is located on a ∼200 km long and ∼20 km wide NNE-SSW trending fissure swarm, and covering an area of 2,300 km2 in the middle of Iceland’s North Volcanic Zone (NVZ, Thordarson and Larsen, 2007; inset of Figure 1). In this part of the Icelandic rift zone, the island grows at slightly faster than average spreading rates by 2.3 cm/year towards the East (e.g., Perlt et al., 2008).
The central volcano of the Askja volcanic system is located at the very southern end of the system. The equally named predominantly basaltic central volcano, that has also produced major silicic eruptions, has been active for ∼200–300 ka (Brown et al., 1991; Sigvaldason, 2002). Askja central volcano has produced more than 175 effusive and explosive eruptions during the last 7 ka, more than 50 of which have occurred in historical times (Hartley et al., 2016). Askja formed within the Dyngjufjöll, a 400 km2 large predominantly pre-Holocene basaltic hyaloclastite massif of subglacial origin (Sigvaldason, 1964), which can be divided into Vesturfjöll and Nordurfjöll bounding the central volcano to the West and North, and Thorvaldsfjall and Austurfjöll to the South and East (e.g., Hartley et al., 2016; Figure 1A).
On the 21st of July 2014, a large landslide occurred in the SE sector of the inner Askja caldera wall (Figure 1B), causing massive material redistributions and a tsunami that inundated the shores around the entire caldera lake (Vogfjörd et al., 2015; Gylfadottir et al., 2016; Schöpa et al., 2018). The source location of the landslide was found to be along a known ring fault, which formed during caldera subsidence (Hartley and Thordarson, 2012). Field surveys showed that the site of the landslide was a hydrothermally very active region (Sigmundsson et al., 2014; Vogfjörd et al., 2015; Schöpa et al., 2018). In addition, ground displacements and newly formed tensile fractures were identified in the source region of the landslide in photographs taken in the years between 2007 and 2014 (Gylfadottir et al., 2016; Helgason et al., 2019). The landslide has left a crescent-shaped 800–900 m long scar at around 1,400 m a.s.l in the caldera wall and moved downhill on a spoon-shaped sliding plane in the uppermost portion of the slope (Saemundson et al., 2015; Eliasson and Saemundson, 2021). The initial rock-dominated avalanche was un-roofing hydrothermally active sites in its path and depositing a debris tongue, which extends ∼1900 m into the lake and was followed by intense mudflows (Gylfadottir et al., 2016; Eliasson and Saemundsson, 2021). The volume of the landslide was estimated based on multibeam echo sounding surveys of the bottom of Lake Askja, together with measurements of the lake level, which rose at least 1 m following the slide and photogrammetric digital elevation models (DEMs) of the landslide area on land before and after the slide, yielding a volume of 20 × 106 m3 (Gylfadóttir et al., 2017).
This study focuses on the inner eastern flank of Askja caldera (Öskjuvatn caldera) and more precisely on the landslide deposition area (Figure 1B) and the classification of materials deposited and sourced in this part of Askja volcano. Pre-slide geological maps of Askja (Figure 1C) show that this area is largely covered by the talus of historic volcanic deposits that mainly consist of non-porphyritic basaltic tuffs and lavas, a minor fraction of porphyritic and subaerial basaltic tuffs and lavas, and by extensive sheets of the 1875 rhyolite pumice and ash deposits (Sigurdsson and Sparks, 1981; Sparks et al., 1981; MacDonald et al., 1987; Graettinger et al., 2013). Moreover, the area contains the outcrops of two (2) rather small basaltic lava flows that erupted in 1922–23 in the SE part of the caldera from vents north and south of the landslide (Thorinasson and Sigvaldason, 1962; Sigvaldason, 1964; Thorinasson, 1968), and two (2) rhyolite lava bodies of unknown age situated in the SE corner of the caldera (McGarvie, 2009; Graettinger et al., 2019). The southern of the two (2) domes is located in the alleged source region of the landslide, where it is attached to and conformably overlain by the subglacial deposits of the Austurfjöll massif (Graettinger, 2012) forming the part of the caldera wall that later collapsed including its pumice cover.
3 Data and methods
In the following we will first describe the satellite, drone and ground-based hyperspectral datasets that have been used in this study (Section 3.1), and explain the processing methods applied on the imagery datasets such as Structure from Motion (SfM), PCA and classification (Section 3.2). Further, we will explain how we validate the classification results using a confusion matrix and compare to hyperspectral data of selected rock samples in the field (Section 3.3).
3.1 Data
We use high-resolution visible range imagery, which we acquired during a series of UAS surveys in August 2019 over the Eastern Askja caldera for the purpose of mapping different geomaterials by means of RGB-color distinction and compare these to the results obtained from very high resolution (VHR) satellite images. To better characterize the different rock types and to validate our classification of different rock units from drone imagery, these surveys were further complemented by ground-based hyperspectral measurements on representative rock samples in the field. In the following we describe 1) the VHR satellite data and then in detail how we acquired 2) our imagery data from the drone camera and 3) the narrow-band spectra collected by means of the field spectroradiometer.
3.1.1 Satellite data
In order to provide details on the temporal development of the landscape in the landslide deposition area and to compare the different situations to that encountered during our high-resolution drone survey, we used very high resolution (VHR) satellite imagery acquired one year before and two months respectively five years after the landslide, i.e., 24 days prior to our drone survey. The satellite scene of July 2012 was obtained from RapidEye-1, that of September 2014 from RapidEye-2 both images are having 5 m resolution. We also consider an image from August 2019 from PlanetScope with 3 m resolution. In this study, we used the RGB bands of the available Geotiff dataset. In the acquired VHR satellite images, areas with steep slopes are shadowed, and we can not observe any features in those areas therefore, drone imagery acquired in the field can be helpful.
3.1.2 Drone data
For our drone surveys, we used a DJI Inspire1 quadcopter with a gimbal-stabilized Zenmuse X3 Full HD camera system onboard. The sensor size of the camera system is 1/2.3 inch, providing images with 4,000 × 3,000 pixels. We conducted 4 overflights on 28 August 2019 starting and landing in the NE corner of the caldera from where we managed to cover the eastern part of the caldera. Ambient temperatures were below the freezing point in the morning hours of that day, thus we warmed up the batteries by keeping them beside thermos bottles of warm water wrapped in our scarfs, because the drone was not working with batteries cooled down. To ensure that we are covering the whole study area, we flew multiple loops over the eastern part of the caldera. During the flights it was difficult to keep track as we had to deal with a moderate to strong breeze and gusty winds with speeds of between 5 and 10 m/s blowing from SSE. In these cold and windy conditions, the duration of flights was about 15 min long, and we had to be careful about the elevation differences in the area in order to avoid crashing the drone. Skies were overcast by a heterogeneous cover of white and gray rain clouds, thus light conditions varied slightly during the surveys. Despite these unfavorable weather conditions, we managed to fly the drone up to 500 m altitude and captured 259 usable images of the eastern inner flank of the caldera. The velocity of the drone was in between 10 and 15 m/s during the flight and the camera was taking partly overlapping photos in a nadir view in a 5 s interval.
3.1.3 Hyperspectral field data
While drone data allow distinguishing different features related to materials, a direct compositional interpretation remains challenging. To this aim, we use in-situ hyperspectral field measurements, to identify fundamental differences of the rocks and validate the classification results. Hyperspectral remote sensing can effectively contribute in identifying minerals and rocks with diagnostic spectral absorption bands, with increasing use in mineral exploration (Clark et al., 2003). The aim of this is to explore the relevance of hydrothermal alteration involved in the landslide process.
Reflectance spectra of representative rock samples were acquired in the field by a portable PSR+ 3,500 High-Resolution Field Spectroradiometer (Spectral Evolution, Massachusetts, United States) equipped with a contact probe with a field-of-view of 2–3 cm and a built-in 5 W halogen light source. The spectral range covers 350–2,500 nm with a spectral resolution (full width at half maximum) of 2.8 nm at 700 nm, 8 nm at 1,500 nm and 6 nm at 2,100 nm. We used a contact probe due to rapidly changing weather conditions. Each reflectance spectrum corresponds to the average of 30 individual colocated measurements to improve the signal-to-noise ratio, and each sampled spectrum was corrected with the reference spectrum of a standardized white reference panel with 20% reflectance.
The sample reflectance spectra were collected from different characteristic materials occurring at 15 different locations within the study area (Figure 5B) in order to cover the variety of encountered rock types. To identify corresponding materials, these sample spectra were visually compared to reference reflectance spectra obtained from laboratory measurements of well-characterized minerals and geologic materials as, e.g., provided by the USGS spectroscopy laboratory (SpecLab) in Denver.
3.2 Methods
We applied processing steps to prepare the VHR satellite images and our high-resolution drone imagery for PCA analysis, and the latter data additionally were used in order to obtain a classification map distinguishing between different surface materials found in the field (Figure 2).
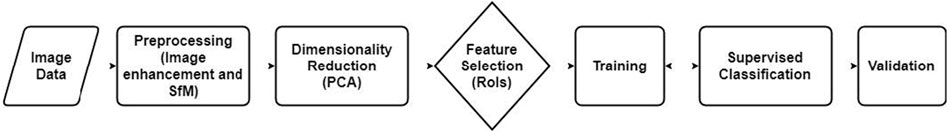
FIGURE 2. Flowchart of image processing steps.
3.2.1 Satellite image processing
Optical satellite imagery usually does not exploit the full dynamic range of the sensors, thus these typically require some color and contrast enhancement before objects in the image obtain their natural appearance, which matches the color perception of the human eye. The histograms of each color band of the VHR satellite images were stretched linearly using the ENVI 5.4 image analysis and processing software in order to enhance contrast without changing color hues of the images prior to further analysis of the images. Afterwards, we masked out the water bodies in order to reduce the unnecessary information. Further, we applied PCA (see action 3.2.4 for details) to visualize the landslide and hydrothermal areas. As colors in satellite imagery tend to be more pale than seen from ground, we increased color saturation of images in Figure 3 by ∼15% to match the rock sample colors for clearer display of different rock types.
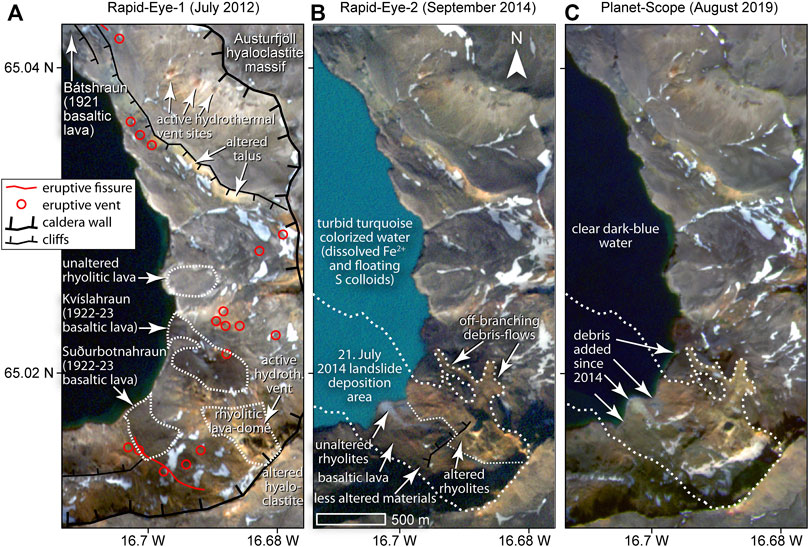
FIGURE 3. Very High Resolution (VHR) satellite images of the study area. (A) RapidEye-1 before (16 July 2012) and (B) RapidEye-2 after the landslide (6 September 2014) and (C) PlanetScope only 24 days prior to our drone survey (4 August 2019). Hydrothermally affected areas appear in rusty red colors. (A) Locations of the 1920 basaltic lava flows and two rhyolitic lava domes in the SE sector of the caldera are indicated. Corresponding eruptive vents and fissures—also those of older eruptions—are encircled in red, respectively indicated by red lines (locations adapted from Trippanera et al., 2018; Graettinger et al., 2019). (B). (C) The deposition area of the 2014 landslide is outlined by a thick white dotted line (subaqueous landslide outlines adapted from Gylfadóttir et al., 2016), and preferentially deposited materials are indicated. Hydrothermally altered materials of the unroofed rhyolite lava dome were mostly deposited in the northern half of the landslide deposition area. The southern limit of deposition of yellow-brown hydrothermally affected rocks in the rockslide is indicated by a thin white stippled separation line. Most material was deposited in the upper half of the slope forming a pronounced morphological edge (black line) with respect to the downslope portion of the deposition area. (C) Locations of secondary downwash deposits formed along the coast since 2014. Selected scenes were least affected by snow and cloud cover.
3.2.2 Drone data processing
We first extracted the images from drone storage, and imported all the high quality geotagged images into Agisoft Metashape Professional Version 1.5.2. Then we manually deselected the pictures that were blurred or out of focus and followed the predefined workflow to generate an orthomosaic image of the study area. For this purpose, we applied image alignment in order to sort the images based on the coordinate of the drone when it was acquiring the photo. We obtained a coarse point cloud with 214,496 tie points. In the following step, we built a dense cloud of 172,135,880 points with ultra-high quality. From this we generated a 3D model mesh with 34,427,157 faces. Eventually, we generated the Digital Elevation Model (DEM) and orthomosaic based on the processing of dense cloud and mesh covering an area of 3.2 km2 reaching a resolution of 16.6 cm/pix. For the purpose of this study, we relied on the internal GPS of the drone, which yields a location error on the order of several meters horizontally and vertically, but which will not be relevant for the purpose of our study.
3.2.3 Hyperspectral processing methods
The preprocessing of the reflectance data included a correction of spurious spikes caused by instrumental noise, which were sporadically occurring at wavelengths (∼2018, ∼2048 and ∼2,185 nm) in the SWIR region and a smoothing of the spectra for reduction of further noise, eminent particularly below 500 nm and beyond 1800 nm. The data were de-noised with a Savitzky–Golay filter applying second-order polynomial fits to a window size of 77 data points. Due to the use of the contact probe, errors related to stray light were largely eliminated, and the signal-to-noise ratio was optimized. Furthermore, its use ensured that illumination conditions stayed comparable throughout the field survey.
3.2.4 Principal component analysis (PCA)
Principal component analysis is a common image pre-processing method used 1) for the enhancement of color differences of features in imagery and 2) to aid machine learning based image classification approaches in the process of discriminating between different classes of image pixels (Canty, 2019). We applied PCA to highlight the main features in the orthomosaic and the VHR satellite images using the ENVI 5.4 image analysis and processing software. In the first step, we masked out water bodies and all pixels outside the image area (as the latter are white in ENVI and thus would be confused with snow) in order to reduce the range of RGB data values for further processing, both in the sense of data size and color spread. Similarly, the water bodies were also masked out in the VHR satellite image scenes prior to PCA. These masking out allows to focus the PCA analyses and further classification steps on only the geological outcrops of the caldera, and finally to improve the spectral discrimination within the caldera.
For performing PCA, we used the standard Forward PCA Rotation from ENVI’s Transform toolbox. Since we used the three color bands from our RGB orthomosaic and the VHR satellite scenes, for each we obtained three grayscale representations of the principal components in the output, which were then merged into an RGB composite image, where RGB channels correspond to PC1-PC2-PC3.
3.2.5 Classification method
To retrieve more details on different features and materials, we further applied classification methods implemented in ENVI to the RGB composite of the three principal components. In order to determine a suitable number of classes required to characterize different rock units in our dataset, we applied several unsupervised classification methods such as K-means and ISO-data in each of which we tried different numbers of classes to check 1) which algorithm performs best on our data, and 2) how many classes are required to capture the materials to be mapped. Furthermore, based on 1) the color patterns we found in the results of our principal component analysis, 2) the classification results of our unsupervised classifications and 3) the knowledge we had from the RGB color space of our orthomosaic, we defined regions of interest (RoI) covering the materials to be classified using the standard RoI defining tool of ENVI. These snippets of the original raster image were then used to train the maximum-likelihood classifier provided in the corresponding toolbox of ENVI based on which it performed the final classification shown in the results section. The classifications are based on pixel intensity in the RGB composite of the principal components determined by PCA. The maximum likelihood classification performs the discriminant function for each pixel as follows (Richards and Richards, 1999):
where,
3.2.6 Class attribution and validation
In general, there are several methods in order to validate classification results. Here, we first used a confusion matrix to measure the accuracy and efficiency of our classification algorithm based on the user-defined classes (RoI). Afterward, to qualitatively assess our classification based on real world ground-truth data, we used ground-based hyperspectral measurements.
A confusion matrix was used in order to compare our classification raster image to the training data set, which comprises the raster snippets of our ground truth RoI. In this matrix we can find the numbers of correctly classified pixels in each class at the diagonal axis from left to right, while the numbers of misclassified pixels are being displayed off that axis, where omission errors (false negatives) appear along the column, and commission errors (false positives) appear along row of a class. By using these statistics, we calculated the overall accuracy of our classification and determined the kappa coefficient as a measure of the efficiency of our classifier. The kappa coefficient (Richards and Richards, 1999) was calculated as follows:
Where
4 Results
We provide a phenomenological explanation based on the three satellite images, one before the landslide and two after (Section 4.1). Then, we describe the derived PCA analysis of these images (Section 4.2). After this general comparison, we describe the result derived from our drone imagery consisting of SfM, PCA and classification (Section 4.3, Section 4.4, Section 4.5). We perform the validation measures and also interpretation for the spectra of the hyperspectral measurements for our classification (Section 4.6).
4.1 General phenomenology deduced from VHR satellite imagery
VHR satellite scenes acquired over the Askja edifice reveal a talus-covered inner Eastern caldera flank. Images acquired prior to and following the 2014 landslide (Figures 3A–C) allow to reconstruct the major changes in consequence of the event. The 2014 landslide covered a large portion of the talus-covered flank by mostly light-gray material. These are redeposited pyroclastic deposits of the 1875 eruption, which are particularly widespread in the NE section of the caldera (compare areal extents in Figure 1C and Figures 3A–C). Our field visit reveals that most of these pyroclastic deposits consist of unusually vesicular and crystal-poor white rhyolitic pumices, which in the field near the source appear colorized yellow to orange, while the remainder consists of pale to dark-gray pumice, which further have been distinguished into three different types according to their composition: (1) dark steel-gray rhyolite pumice, (2) pale to dark-gray brownish pumice consisting of varying amounts of rhyolite and basalt glass, and (3) pale gray crystal-rich basaltic andesite pumice, mainly found as enclaves within the white pumice. Since the pyroclastic deposits are commonly heterogeneously colored and individual pumice clasts are max. 1 m large, the colors of these deposits as they are resolved by satellite merge into different shades of bright-gray and brown-gray, however.
The two small 1920s basaltic lava flows north and south of the landslide (see outlines in Figure 3A) appear in dark-gray to black colors in the VHR satellite image. This Virtually resembles the talus of a third 1920s basaltic lava flow that is situated N of the study area, which covers much of the lower caldera terraces at the N margin of the study area. In addition, the RGB data resolve the rhyolite lava body of unknown age situated in the SE corner of the caldera (outlined in Figure 3A). The body located right within the source region of the landslide is dominated by yellow-brownish rhyolites showing signs of intense hydrothermal alteration (Figure 3A). This body is attached to and conformably overlain by the subglacial deposits (Graettinger, 2012; Figure 1C) forming the part of the caldera wall that later collapsed, which mainly consisted of similarly yellow-brownish colored hydrothermally affected hyaloclastite and pillow lavas of the Austurfjöll massif. A pinkish-white spot on the northern slopes of that dome indicates the location of a hydrothermal replacement deposit (clays and sulfates) is visible in satellite images that formed at a likely still active fumarolic vent. Notably, we find several eruptive vents and active hydrothermal vent sites within and surrounding the landslide area (Figure 3A), and a large cluster of fumarolic vent sites, which is appearing in the satellite image as reddish-brown spots with bleached margins. The fumarole sites are located on the NE slopes of the caldera wall (Figure 3A). The chemically altered and reworked material of alluvial fans found in morphological depressions and drainage channels, e.g., south of the northern rhyolite lava body, and the talus deposited along the steep cliff in the NE part of the caldera is characterized by similar red-brown to yellowish-brown hues, implying active or inactive hydrothermally active sites.
The 2014 landslide mobilized large parts of the rhyolitic lava body in the caldera wall together with the overlying basaltic hyaloclastites and pillow lavas. The landslide has emplaced blocks of up to 80 m in diameter on the slopes of the unroofed dome, split up into several different streams further downslope, and near the lakeshore additionally partly buried two of the 1920s basaltic lava flows, Kvíslahraun to the North and Suðurbotnahraun to the South, before it finally reached the Öskjuvatn lake (Figure 3B). We measure the onshore portion of the landslide deposition that covers an area of ∼0.8 km2. Previous to the landslide event we measure that 27% of the onshore depositional area were covered by bluish black basaltic lava flows and their talus, 33% by yellow-brown altered rocks, most of which originate from the rhyolite lava body, and 40% by dark-brown to bluish black and greenish gray undifferentiated mostly basaltic talus material of the Austurfjöll (compare Figures 3A, B, features compiled in Supplementary Figure S3).
The central material stream of the slide was emplaced on the rather flat surface of the Suðurbotnahraun lava flow, where it built up an ∼250 m wide horn-shaped coastal block. Which initially extended ∼100 m into the lake, at the same time eroding the coastline by some 10 m forming embayments at its northern and southern margins (indicated by white arrows Figure 3B). The Northern half of the subaerial landslide deposition area is dominated by a bilobate central blocky stream of yellow-brown hydrothermally altered rhyolite and hyaloclastite material, from which ∼50 m wide secondary branches of finer yellow-brown debris material split off, spreading towards North. In the southern half, in contrast, we find less altered and less blocky materials (light-gray rhyolitic lava, and greenish-gray hyaloclastite and pillow lavas), mostly in the upper half of the slope, while at the coast merely little debris was deposited (also compare with Eliasson and Saemundson, 2021) and thus the black basaltic lavas of the Suðurbotnahraun flow shine through the debris cover in large parts of that area. The material stream in the center of the landslide area, which formed above the mentioned block of the coastline, seems to have been the preferential path of unaltered light-gray rhyolitic lava, which was exhumed at the southern margin of the hydrothermally affected rhyolite dome.
Comparing coastlines in the satellite images of 2012 and 2014 shows that the shoreline in our study area significantly retreated as a consequence of the sliding event and tsunami resulting in loss of 32,800 m2 land along this ∼3.5 km long portion of the coast. Satellite images acquired in the months following the landslide further show a pronounced turbidity and turquoise colorization of the usually dark-blue and clear water in the caldera lake, which lasted for several months following the landslide event.
In August 2019, the month of our field campaign, the waterbody had regained its typical dark-blue color and was completely clear, enabling us to see the submerged parts of the steep coastal cliff (Figure 3C). Furthermore, the shoreline advanced again following the landslide event in 2014, adding an area of 29,074 m2 between 2014 and 2019, i.e., almost as much land surface was regained as was previously lost in the study area. Particularly within the landslide area significant amounts of additional debris were deposited along the coast leading to infilling of previously formed embayments and further protrusion of the coastline up to ∼10 m, thus hinting at intense erosion of the landslide surface and formation of downwash.
4.2 PCA of satellite images
Features can be highlighted in aerial or satellite imagery by applying a PCA to the bands of interest. Here, we first will take a look at the results of a PCA performed on the RGB bands of the three natural color VHR satellite images displayed in Figure 2. In the RGB composite (Figure 4) we can observe different features in false-color that can be associated with fumarolic areas, snow (in green), and a variety of different volcanic rocks. It has to be noted that the false-colors of some of these PCA features vary slightly in between the scenes, partly due to the redeposition or alteration of materials and partly due to the different light conditions that were encountered during the acquisition of the three scenes. The yellow-brownish to red-brownish colors associated with altered materials of the landslide and debris fans in the natural color satellite image, however, are commonly highlighted by PCA in false-color magenta to purple colors and light-gray to whitish materials commonly appear in a false-color dark blue. The whitish hydrothermal replacement deposit in the fumarolic area in the northern part of the study area appears in PCA in blue hues surrounded by a mixture of light bluish and pinkish colors. Light-green colored areas are associated with snow deposits except for in the scene of September 2014, in which additionally a stream of very light-gray rhyolite extending from the central part of the landslide to the lake has this PCA color. In the scene of August 2019, the same rhyolite stream appears in rather dark blue colors, despite having the same light-gray color in the satellite image, and the same is true for the dirty-gray snow cover, e.g., in the landslide area. Furthermore, shadowed areas are similarly colored in orange hues as the basaltic lava flows thus posing a potential problem for distinction by color. Especially the Southern limit of the landslide area and its source region in satellite images commonly is obscured by a large shadowed area extending along the southern caldera wall which is particularly pronounced in the scenes of 2014 and 2019 (Figures 4B, C).
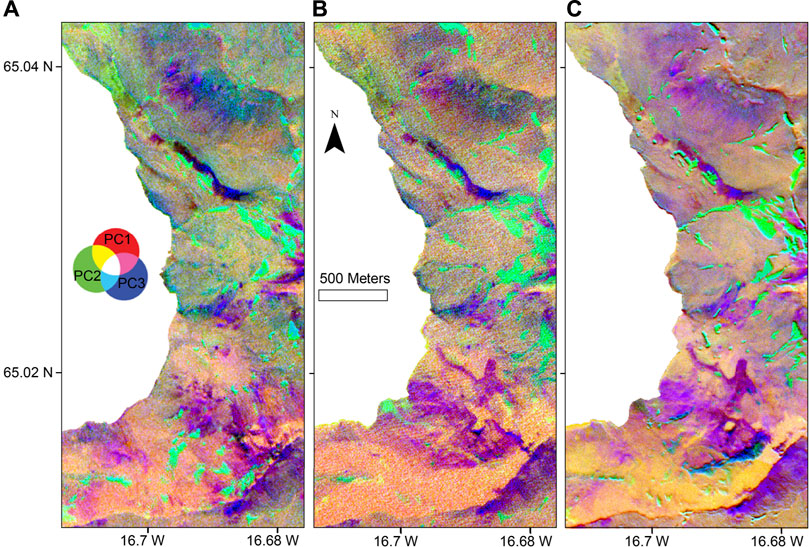
FIGURE 4. False-color RGB composite of the PCA results obtained from VHR satellite image sequence of the study area. (A) RapidEye-1 before the landslide (16 July 2012), (B) RapidEye-2 after the landslide (6 September 2014), and (C) PlanetScope just 24 days prior to our drone survey (4th of August 2019).
We note that already in July 2012 (Figure 4A), prior to the occurrence of the landslide the upper slope of the area is covered with hydrothermally affected materials appearing in purple hues side by side with less altered volcanic materials appearing in orange to orange-green. Furthermore, we can note the redistribution and areal increase of such purple materials that are partly mingled with less altered surrounding materials in the two satellite scenes acquired after the landslide (Figures 4B, C). Moreover, in the scene of 2019, we observe an increase in intensity of such purple features also along the steep slopes despite there is hardly any morphologic change visible in the northern part of the study area.
Figure 4 shows that the spatial distribution of different surface materials has drastically changed at the location of the landslide before and after the event. Outside the landslide, a similar spatial distribution of materials is observed in the 3 images: light green areas that are interpreted to be snow covers, and purple areas that are spatially associated with altered materials. On the other hand, in the Southern part of the images, the distribution of materials has changed before and after the event. Outcrops of altered materials that were not exposed before the event became exposed after the event in the landslide areas. The different PCA colors, therefore represent the spatial distribution of materials that are similar.
4.3 Drone data structure-from-motion results
In order to obtain more detailed information on the study site, we analyzed the high-resolution imagery recorded during the UAS overflights of 28 August 2019 (Figure 5A). The orthophoto mosaic and the DEM that we obtained from our drone imagery (Figures 5A, B) provide highly detailed information on the spatial distribution of different types of materials (rocks, snow, vegetation, waterbody) at the time of our survey, and of different morphological structures (cliffs, drainage gullies, and tectonic structures), which occur in the area. We resolve some of the different materials small-scale surface structures, such as flow-textures of lava and debris flows, or fracture networks and layering in bedrock and sedimentary deposits. Moreover, the data are almost free of large deeply shadowed areas as they appear in the VHR satellite images, and only some minor patchy and blurry shadows from clouds are visible due to the heterogeneously overcast skies we encountered during their acquisition. Some general large scale features can be observed, such as: the deep-blue water body and current shoreline of Öskjuvatn, a widespread light-gray pumice which covers large parts of the Northern portion of the eastern inner caldera flank, several blackish basaltic lava flows from previous eruptions and the entire subaerial portion of the landslide area with its central blocky rockslide and a number of secondary debris flows. Furthermore, we can see details such as the pinkish-to-whitish hydrothermal deposits and reddish-brown coated (probably Fe-oxide) rocks of two major actively degassing fumarole areas that are located on the inner slopes of the NE and SE caldera rim, the latter of which is located near the landslides source region (see Figure 5). Small batches of minor vegetation such as moss can be observed growing on the clay-rich substrates close to the hydrothermally active areas. Note, that the checkerboard pattern of interchangeably dark and bright blue on the water surface of Öskjuvatn is the result of an image (compression) artifact.
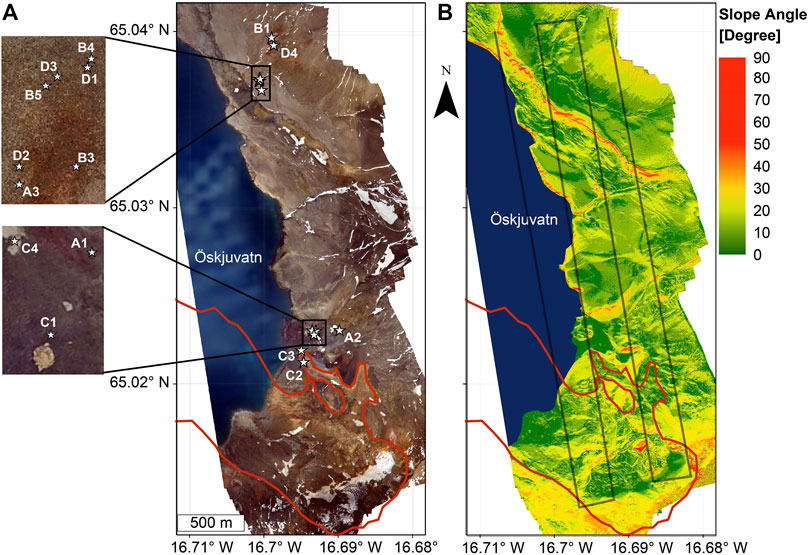
FIGURE 5. (A) Drone derived orthomosaic showing the rock sample locations indicated by white stars and (B) slope map of eastern Askja caldera. The landslide outline is illustrated as a red polygon. The flight path is sketched in black lines in (B).
A slope map generated from the DEM of the surveyed area (Figure 5B) illustrates the flat surfaces of lava flows and of pumice filled depressions (green colors) and several oversteepened slopes (orange-red colors) along the shoreline of the lake and morphological edges demarking the Southeastern caldera rim and drainage channels within the caldera. A detailed view into the landslide area reveals a chaotic pattern of smooth plains, e.g., in the depletion zone and the coastal areas of the landslide, between rugged surfaces of debris flows and steep slopes with irregularly distributed and differently sized blocky materials. Particularly large blocks, which are up to 100 m in diameter, have been emplaced in the downslope portion of the collapsed rhyolite dome, which is situated in the zone of accumulation of the landslide.
4.4 PCA of drone data
We applied the PCA in order to reduce the dimensionality of the data and highlight the main spectral features that can be extracted from the image. Since the vibrant blue water body was masked out previous to analysis, our PCA focused on the reduced color palette of the less colorful volcanic materials in the subaerial portion of the orthomosaic.
Having a look at the grayscale image reveals that the values of PC1-PC3 are largely uncorrelated, and that different landscape features preferentially have been captured by one of the different components. PC1 preferentially captured the bright features of the orthomosaic image such as snowfields and hydrothermal mineral deposits, which in PC1 occur as sharply outlined dark features (Figure 6A). PC2 is dominated by intense dark features, which correspond to talus deposits and the redeposited material in the landslide area (Figure 6B). Furthermore, the hydrothermally active areas and eruptive vents appear as dark-gray spots in PC2, while basalts and snow patches are bright. PC3 generally looks rather noisy, but closer visual inspection reveals that the brightest spots as well demark the locations of hydrothermally active venting areas and rock surfaces with intense iron oxide coatings (Figure 6C).
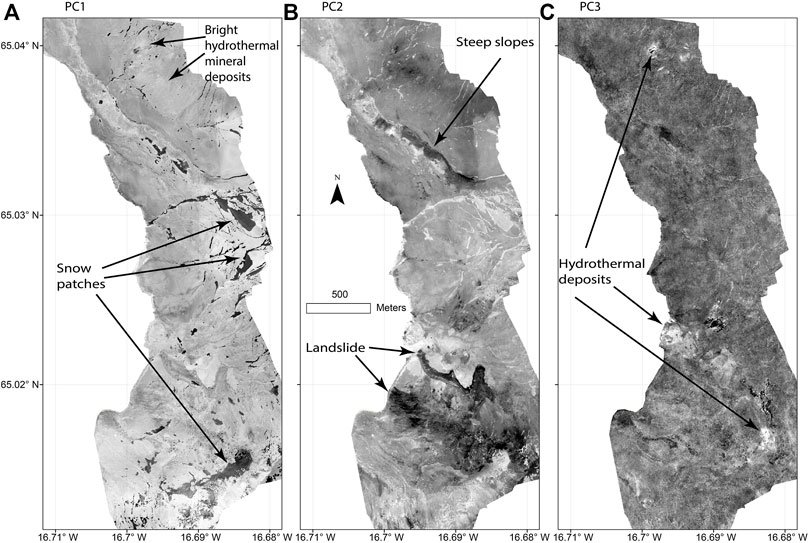
FIGURE 6. Grayscale images of the three principal components obtained from the 2019 drone orthomosaic (from left to right: PC1, PC2, and PC3). (A) Dark-colored areas in PC1 correspond to snow-cover and bright hydrothermal mineral deposits. (B) Landslide area and the steep debris-covered slopes in the Northeastern part of the caldera are accentuated by dark tones in PC2. (C) Note the bright spots in PC3, which mark the locations of the hydrothermally active areas.
The RGB composite of our PCA output (Figure 7A) shows a variety of color patches that correspond to different types of materials. Especially the mixed material of the landslide area, and the loose material of other areas that were affected by mass movements such as the talus accumulation along the cliff and the steep inner caldera wall in the NE part of the caldera, is strongly outlined in dark red to purple colors. Moreover, some color differences between pumice-covered areas (olive) in morphological lows, snowfields (bright green), and several lava flows (bright yellowish-green) which are distributed along the eastern lake shoreline are clearly visible. Particularly, the snow bodies seem to be captured perfectly. Furthermore, the two main fumarole areas in the NE and the SE of the caldera appear in blue-violet color and are easily detected with a simple PCA analysis. However, the landslide outline and full extent of the redeposited materials particularly along the southern landslide margin are not fully and precisely detected and still, there might be some other features to extract which so far after applying PCA, still are not well distinguished. Therefore, we conducted classification for further analysis of the PCA results in order to better visualize different features. Next to the PCA analysis, we see the classification output (Figure 7B) for detecting different materials in more detail, which we will explain and analyze in the next section.
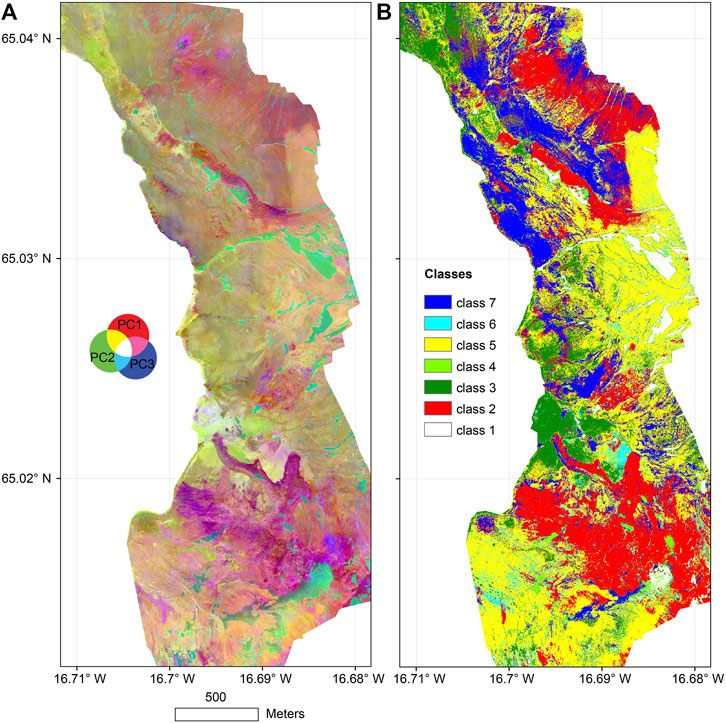
FIGURE 7. Results of the drone data analysis. (A) RGB composite of PC1 to PC3 and (B) classification results displaying the areal extents of classes 1 to 7.
4.5 Classification results
We applied classification methods to the RGB composite of the PCA output obtained from our orthomosaic. We defined 7 general classes to be classified by our maximum-likelihood classifier, 6 of which are related to distinguished geological materials and structures. Defined classes and their color-coded visualizations are illustrated in Figure 7B, and they are as follows: 1. Whitish materials like snow (White class), 2. Yellow-brown Fe-oxide coated materials as found in the hydrothermally altered rhyolite dome, yellow-orange pumice and materials with a characteristic ochre stain including loose reworked debris depositions along steep slopes and materials covering the landslide area, but also minor light-green vegetation which preferentially occurs in these reworked areas (Red class), 3. Black to dark-gray mafic materials like, e.g., the basaltic lava flows, dark brown basaltic pumice (Dark Green class), 4. Light-gray to whitish materials as found in hydrothermally affected areas (bleached volcanic rocks, clay- and sulfate-rich hydrothermal replacement deposits and solfataric mineral coatings) or dirty snow with slight irregularities in color (Light Green class), 5. Brownish dark-gray materials, basalts, and rhyolites with minor Fe-oxide coating (Yellow class), 6. Red-brown materials, mostly oxidized basaltic lavas with reddish Fe-oxide coatings as found at volcanic vents, and in oxidation zones of hydrothermal vents (Light Blue class), 7. Light-gray to medium-gray materials, mostly white and pale-gray pumice, but also very dirty snow (Dark Blue class).
At the landslide area (Figure 7B) data reveal the transport paths of hydrothermally altered and Fe-oxide coated materials from the landslide source area. Several types of rock and material deposits can be seen in different areas all over the entire flank and specifically in steep areas and mainly in the landslide zone below the cliffs. The red class shows the spatial extent of Fe-oxide coated materials in debris fans and the landslide, at the northern margin of the landslide area, representing the landslide outline. The southern half of the landslide area is dominated by yellow class materials corresponding to brownish dark-gray materials, mainly basalts with minor alleged Fe-oxide coatings. The yellow class further is dissected by streaks of the light-blue class, which are elongated in sliding direction, and correspond to red-brown oxidized materials as found in surrounding eruptive fissures and vents.
We counted the number of pixels in each class and determined the approximate areas that each material covers in a) the entire subaerial part of the study area and b) the onshore portion of the landslide area (Table 1). Both areas are dominated by materials corresponding to classes 5 (undifferentiated brown gray talus) and 2 (hydrothermally affected ochre to red-brown talus), which in the entire area cover 37 and respectively 23%, and almost equal portions (each ∼36%) of unaltered and altered talus are found in the area of landslide deposition. The study area further contains significant portions of class 3 and 7 materials (17% and 13%) corresponding to black to dark-gray basaltic lava flows and medium gray rhyolite pumice, while these materials only constitute a minor fraction (4% and 6%) of the landslide area.
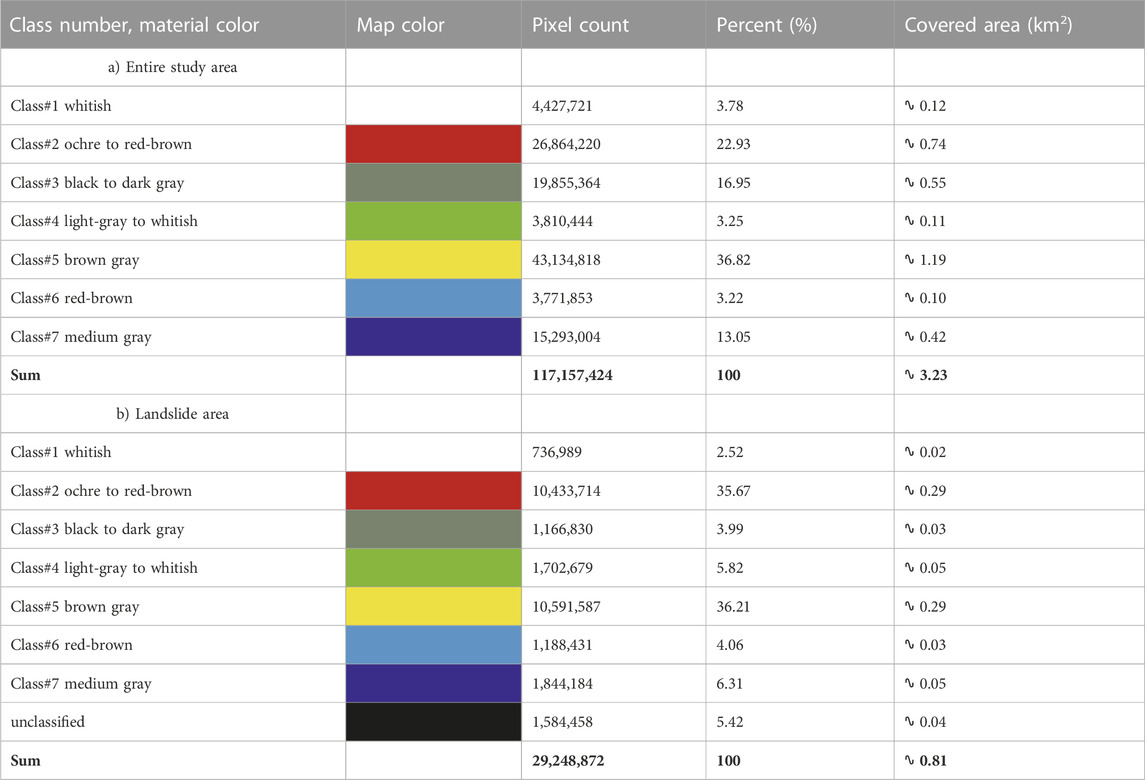
TABLE 1. Areal Statistics of Classification Results for a) the entire study area and b) the onshore portion of the landslide area.
4.6 Validation of classes
4.6.1 Confusion matrix
In order to determine the quality of our classification results, we prepared a confusion matrix (Table 2) displaying the number of RoI pixels that our maximum-likelihood classifier correctly assigned to the classes that were predefined by the RoIs we used for training of the classifier. These values can be found in the orthogonal axis of the confusion matrix marked in color, while misclassified pixels are shown off-axis. The sum of correctly classified pixels is 991,965 of a total number of 1,051,109 pixels. This corresponds to an overall accuracy of 991,965/1,051,109 pixels, i.e., approximately 94.38%. Further, we calculated a kappa value of approximately 0.92. Misclassifications were in the range between 2% and 3% of the pixels for most classes (classes 2,3,4,7), while no misclassification occurred in class 1, and slightly more misclassification was observed for classes 5 and 6 in which 7% and respectively 10% of the training data pixels set were not correctly assigned to their corresponding class. The amount of misclassified pixels in the latter two classes reflects the heterogeneity of color values found in the RoIs defining these classes.
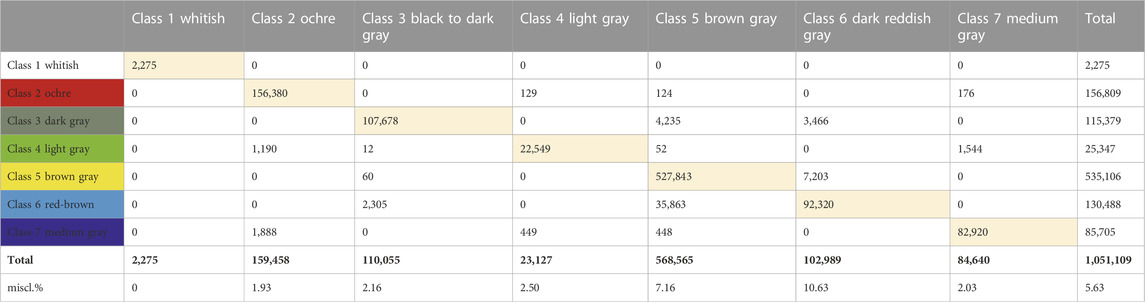
TABLE 2. Confusion Matrix of actual and predicted classes from drone data. Percentages of misclassified pixels of each class in the training data set are indicated below.
4.6.2 Comparison of classes to hyperspectral information
In order to better characterize the material properties of our classes, we compared the color properties of our material classes as seen by drone with the reflectance spectra obtained from our ground-based hyperspectral measurements, summarized in Figure 8. The comparison revealed that the materials found in different classes show similarly different characteristics in hyperspectral signatures, which means that characteristic colors of each class are reflected in the spectral fingerprints of predominant minerals in corresponding sampled rocks.
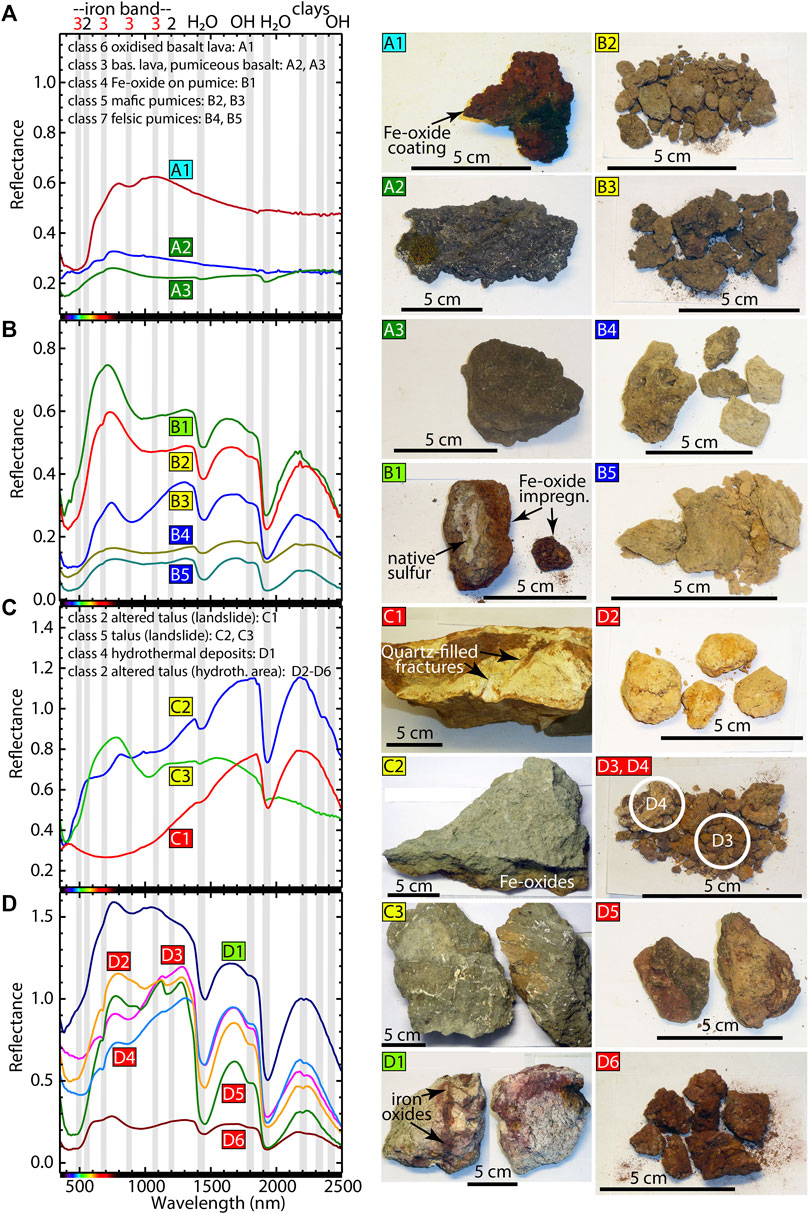
FIGURE 8. Spectra of rock samples acquired in the field (left) and corresponding photos (right) attributed to the 6 different rock classes. Important absorption features are indicated by light-gray vertical lines. (A) Spectra of black basaltic materials. (B) Spectra of white and gray rhyolitic and brown basaltic pumices. (C) Spectra of differently colored altered landslide materials and (D) spectra of hydrothermally altered material (mostly pumices in different alteration stages). (A1) Fe-oxide coated basaltic lava, with mm-sized Feldspar phenocrysts. (A2) Back glassy basaltic lava, with mm-sized Feldspar phenocrysts and overgrown with moss. (A3) Black-gray pumiceous basalt. (B1) Clayiferous brown-gray pumice substrate with Fe-oxide impregnations and native sulfur coatings. (B2) Clayiferous steel-gray pumice with partial Fe-oxide impregnation and native sulfur coatings (B3) Clayiferous “earthy” brown-gray pumice. (B4) Vesicular pale-gray pumice, brown-gray pumice, and white pumice. (B5) Vesicular brittle clasts of orange stained (hydrothermally affected) white pumice. (C1) Yellow-brownish piece of hydrothermally altered rhyolite with Quartz-filled fractures, possibly from the dome in the upper slope of the landslide. (C2) Greenish-gray hyaloclastite from the Austurffjöll. (C3) Greenish-brown brecciated basaltic hyaloclastite or pillow lava from the Austurffjöll. (D1) Clayiferous bleached “white tuff” with Fe-oxide impregnation, possibly a piece from one of the hydrothermal replacement deposits in the NE caldera wall. (D2) Orange-yellow clay-rich white pumice. (D3+D4). Yellow-brown to red-brown colored clayiferous gray pumice. (D5) Dark-brown Fe-oxide coated gray pumice. (D6) Fe-oxide coated pale brown obsidian lava.
Our 1920 basaltic lava samples found at locations which were successfully classified into class numbers 3+6 are visually characterized by a low modal phenocryst abundance (approx. <5% plagioclase, clinopyroxene, and sparse olivine) in a slightly glassy microcrystalline groundmass (Appendix Table 1). The spectra of black basaltic materials are fairly similar in shape and reflectance values (Figure 8A). The reflectance values of the glassy black basalt lava (class3, Figure 8A2) and the black-gray pumiceous basalt (class3, Figure 8A3) range between 0.2 and 0.3 and are lower in comparison to that of the Fe-oxide coated basalt lava (class6, Figure 8A1) whose reflectance reaches values of 0.6 in the iron band. Spectra are rather featureless with exception of weak spectral features in the iron-band around 500, 530, 630 and 900 nm in the VNIR region. In the SWIR region the spectra hardly show any absorption features, besides of that of the pumiceous basalt. Here, additional weak absorption troughs are shown around 1,400 nm and 1900 nm.
Samples of the 1875 rhyolite and basaltic pumice from locations classified as 2,4,5, and 7 (samples B1-B5) exhibit a broad range of alteration degrees ranging from clayiferous to highly vesicular vitreous pumice and as the 1920 basalts merely contain minor amounts of phenocrysts (approx. <5% plagioclase, clinopyroxene, orthopyroxene, and magnetite). The spectra of white-gray rhyolitic and brown basaltic pumices show similar spectral shapes and absorption features, and mainly differ in reflectance values (Figure 8B). Reflectance is strongest on the most altered clay-rich and Fe-oxide coated pumice clasts (Figures 8B1, B2), while less altered glass-rich pumices are characterized by low reflectance (Figure 8B 4, 5). The spectra show absorption features around 500, 650, 900 nm in the VNIR region, which are more pronounced in Fe-oxide-rich samples. Further, the spectra of the pumices exhibit strong absorption features around 1,400 and 1900 nm, which as above are related to hydrated glass and water on the rock surface.
The spectra of various colored altered landslide materials display different shapes and spectral absorption features, having in common absorption features related to OH-groups and water around 1,400 and 1900 nm (Figure 8C). The greenish-gray hyaloclastite (Figure 8C2) shows small absorption features around 400, 500, 650, 900, 1,100 nm, weak features around 2,350 and even weaker features at 2,450 nm. The spectrum of the brecciated hyaloclastite (Figure 8C3) indicates features around 400, 500 and 1,000 nm. The altered rhyolite dike sample (Figure 8C1) is characterized by a broad absorption feature around 650 nm.
The spectra of hydrothermally altered material are shown in Figure 8D and indicate all the same spectral shape and absorption features with changing reflectance values between 0.2 and 1.5 (Figure 8D, D1-2, D5-6). The brown-gray colored pumice (Figure 8D, D3-4) differ from the other spectra in spectral shape but show almost the same spectral features. In the VNIR region, there are absorption features around 500, 650, 900 or 1,000 nm. Absorption features around 1,200, 1,400, 1800, 1900 and 2,200 nm.
Altered materials generally exhibit higher reflectance than the above-mentioned less altered basaltic lavas and pumices, both in the visible and infrared ranges of the spectra. Similarly, different patterns are visible in the infrared range of the spectrum as well. In the landslide and hydrothermally affected areas we observe materials, which our classification identified as red or Fe-coated class. This suggests that the Fe-coated class consists of a diverse variety of rocks that can be found in the surroundings of the landslide area and also on the south-east of the caldera wall where the material originated from. An image of the wall and an RGB composite of its principal components can be found in the appendix.
5 Discussion
Steep slopes and altered source materials are potential sources of volcano landslides (Heap et al., 2021). An early detection of such areas utilizing a combination of remote sensing methods and machine learning can be helpful in avoiding casualties or damages. We used UAS to map the study area and took rock samples and measured in-situ spectral signatures. Regarding the data from the drone, we applied the structure from motion technique to have an overview of the area and with that generated a high-resolution DEM. As first and second derivatives of the DEM, we calculated slope and hillshade maps to identify steep slopes. Thereafter, we applied PCA and classification on the orthomosaic to identify different materials and in general to detect altered and less-altered materials. Furthermore, for validating our results and to have a better understanding of the material combinations in that area, we used the ground-based sampling and rock surface spectral analysis.
5.1 Benefits of joint drone orthophoto classification and hyperspectral sampling
We closely compared the classes identified in our drone classification analyses to hyperspectral information (compare Figures 5, 7, 8). The rock samples were visually identified, and no chemical analysis was carried out. However, Van Der Meer (2004) describes that the position, shape, depth and width of the absorption features can be directly associated with the chemistry and structure of the rock sample. Thus, the hyperspectral information can provide selective, fast detailed information of specific minerals in rock samples without time-consuming chemical analysis.
We found that 6 of the 7 classes (class1=snow not considered here) were well sampled by hyperspectral measurements. The closer comparison shows that the information from classification analysis and from hyperspectral measurements are complimentary, rather than simply correlated.
The Askja landslide mass is best described by the classes 2 and 4, which we could sample with our hyperspectral device as well. The class 2 characterizes yellow-brown Fe-oxide coated materials in the hydrothermally altered rhyolite dome and yellow-orange pumice. The presence of iron oxide is also shown in the corresponding spectra for the class 2. Here, absorption features in the VNIR region are related to iron oxide due to electronic transition, bound on hydroxyl groups or other metal cations (Hunt, 1977; Gholizadeh et al., 2015). The absorption features around 1,400 nm are characteristic for the overtone of OH-groups in the hydroxyl-group or in clay minerals. In combination with the 1900 nm feature, the presence of water molecules is implied, which is likely due to wet sample surfaces (Hunt, 1977). The weak features around 2,200 nm are just shown in the rhyolitic pumice (D2-D3) and Fe-coated obsidian (D4) and are combination tones of the OH-group and the Al-OH bending mode found in clay minerals or mica (Hunt, 1977). In this view, the classification may indeed be a first order spatial characterization of hydrothermally altered rocks, which is relevant for slope stability measurements.
A closer look reveals, however, also important differences in the two data sets. Here the classification results show rather uniform classes 3 and 6. Class 3 is characterized by basaltic lava with a glassy crust or black pumice from basaltic lava flow or scoria. The spectra are rather featureless as is typical of volcanic glass (e.g., Henderson et al., 2021; Rader et al., 2022) with exception of weak spectral features around 500, 530, 630 and 900 nm in the VNIR region, which are related to iron oxides. The spectra in the SWIR region hardly show any absorption features, besides that of the pumiceous basalt. Here, additional weak absorption peaks are shown around 1,400 nm and 1900 nm due to the presence of hydrated silicate glass and water on the sampled surface. The class 6 is characterized by oxidized basaltic lava from flow or pillow breccia with reddish oxides coating. The reddish oxides coating is visible in the VNIR region (around 500 and 900 nm), which is related to the absorption features of iron oxides.
The class 5 also describes the landslide area and is characterized by brecciated hyaloclastite with healed Calcite-filled fractures and hyaloclastite or tuff with greenish altered minerals. The class 5 summarizes four samples with nearly similar spectral shapes (Figures 8B2, B3, C3), except for sample C2 (Figure 8C2). All spectra show absorption features around 440, 700 and 900–1,000 nm, which indicate a presence of ferrous iron (∼900–1,000 nm) and of ferric iron (∼440 nm). The samples B2, B3 and C3 also show absorption features around 700 nm, related to ferrous ions (Hunt, 1977). The features around 1,400 and 1900 nm in the SWIR region are water-related absorption features, whereby the absorption feature at 1,400 nm is less distinct in sample C2 and C3. Sample B3 and C2 also indicate absorptions features around 2,200 nm and 2,350 nm, which normally appear in pairs with the 1,400 nm band, due to combination of the hydroxyl-group and the presence of aluminum (2,200 nm) and magnesium (2,350 nm) (Hunt, 1977). Here, both samples may belong to hydroxyl-bearing minerals, such as hydrothermal clays or sulfates (Van der Meer et al., 2012). Comparing the absorption features of sample B2 and B3 to the results of Van der Meer et al. (2012), shows that they are related to a volcanogenic massive sulfide formation.
The class 7 is described by the samples B4 and B5. The samples are characterized by rhyolitic pumice and to some extent with mafic enclaves (B4). Here, the reflectance of both samples is very low, even the sample color is bright. The low reflectance values are caused by the wet samples surface or due to the stored water in the pores.
5.2 Data comparison and limitation
5.2.1 Comparison of optical and spectral data
We presented different satellite and drone data acquired during different periods and with different resolutions and information content. Ideally more frequent acquisitions may have improved our work, but as Askja is located in an area difficult to access in rarely good weather conditions, a more systematic acquisition plan seems challenging. The freely available Multi-spectral satellite imageries such as Landsat-8 and Sentinel-2 and Hyper-spectral ones such as Hyperion and soon to be available EnMAP provide high resolution spectral information. But they provide limited information on the highland and mountain areas due to cloud or snow. And in general do not provide detailed spatial information on some areas. Therefore, it is necessary to get access to VHR datasets. And, in order to compare these different datasets and see which features are visible there, we have realized a fieldwork in order to acquire drone imagery and ground-based information. Besides our drone imagery, we ordered VHR satellite images to compare and assess our results from fieldwork. From satellite data analysis such as the performed PCA, we can only distinguish some general features and from the field data such as drone and ground-based spectral analysis we can even realize different types of material and classify higher risk areas based on that information together with the high-resolution DEM. The information content is hence dependent on the resolution of imaging datasets.
For identification of different rock types and alteration grades, ideally a spatially dense hyperspectral dataset is acquired. At Askja, however, similarly as at most volcanoes, hyperspectral data are difficult and expensive to acquire from airborne platforms, so that the approach we presented may be a good alternative, combining low-cost photogrammetry with point-wise hyperspectral imaging and classification. We note that by this method, local details and heterogeneities may be missed, which in our case may be especially true for the Southern regions of the landslide area. This is because the area was not possible to access due to frequent rock falls and loose ground, putting the researcher at risk.
The other challenging task is the georeferencing of these datasets. There are several ways of georeferencing the drone data such as (i) using actual ground control points (GCPs), (ii) using the orientation of the camera during acquisition together with the GPS location of the drone, or (iii) direct georeferencing using the drone-interior GPS, possibly refined by an RTK/PPK approach (Aber et al., 2010). We used the drone-interior GPS location, which is in the metadata of each image to align and reference images. Thereby, we generated a DEM and an orthophoto based on the automatic positioning of the images from drone GPS only, with absolute positioning errors on the order of several meters. Since we used the same coordinate system for comparison of all datasets and most of our analysis is based on drone data, it does not have any effect on our results.
The color and brightness of materials in air- or spaceborne imagery can change due to different angles of sunlight and inclination of the sensor, therefore additional filters should be applied on the image if this effect is too large. Also, precipitation can cause such changes in light reflection both in RGB images obtained from the drone or satellite and in the spectral signatures of the ground-based hyperspectral data. Therefore, it always makes sense to apply smoothing and histogram equalization methods in order to reduce or eliminate these sorts of effects.
The number of classes used for the classification can be an arbitrary choice, depending on the number of materials one wants to distinguish. The number of different materials depicted in geological maps may serve as a first approximation of resolvable features, which can be refined by testing different classification methods with different numbers of classes until a consistency between features in the classification results and original image has been reached. Moreover, it is commonly recommended to first perform different dimensionality reduction algorithms before applying unsupervised classifications as it improves the distinction of features.
Regarding ground-based hyperspectral sampling it has to be considered that it commonly is not possible to take too many samples or measure them since some areas within the caldera wall are not easy to access. Also, it is not possible to do sampling often since Askja is a remote area specifically during autumn or winter, difficult to reach.
5.2.2 Comparison of classification results to geologic units
Comparison of our classification (Figure 7B) with previously published geological maps, such as that of Graettinger et al. (2013); Figure 1C, shows that our maximum likelihood classifier was able to detect and distinguish classes 2 and 5 as hydrothermally altered and less altered talus. The talus consists mainly of the basaltic tuffs and pumice deposits that form the caldera wall, and classes 6 and 3 as reddish oxidized and less oxidized basaltic lava and mafic pumice, respectively. The contours of the talus-covered areas and lava flows more or less correlate with those shown in the aforementioned geological maps. In particular, the outlines of the northern basaltic lava flow at Kvíslahraun (class 3) and the extent of the oxidation zone around the corresponding eruptive vent (class 6) are well reproduced by our classification and agree well with the outlines of the flow as shown Graettinger et al. (2013). However, the lava flows in our classification generally appear somewhat larger and are not as sharply defined as in Graettinger’s map because they are often surrounded by a variably wide halo of their own talus, which our classification does not distinguish from the bedrock parts of the flows. The southern lava flow in Sudurbotnahraun is also almost completely covered by a mixture of Class 5 unaltered talus from the 2014 landslide and Class 6 oxidized basaltic lava (eruptive vent material). In addition, the altered rhyolite dome in the landslide area is located in the large northern part of the landslide, which has been classified as Class 2 hydrothermally altered material, but whose pre-collapse contours can be reconstructed from its characteristic yellow-brown color on pre-landslide satellite imagery, as shown in Figures 3, 4. The rhyolite dome north of the Kvíslahraun basaltic lava flow, on the other hand, which according to Graettinger et al. (2013) consists of more fresh light-gray material, can only be inferred from its dome-like morphology and the distribution of loose material on top of the structure, both in the satellite imagery and in our orthomosaic and classification, respectively. The pumice cover is much more differentiated in our classification than in Graettinger’s map. Our classification distinguishes between light gray rhyolite pumice in class 7, brownish-gray basaltic pumice in class 3 and yellow-orange altered white pumice in class 2. The different types of basaltic tuff (porphyritic, non-porphyritic and subaerial basaltic tuff), which are the main source of the talus on the inner caldera flank, are not further distinguished.
Some minor misclassifications were identified mainly in areas that are covered by dirty snow which can also be seen already from the RGB image, if we zoom in or from our surveys in the field. In some areas, we can see a mixture of two or three classes that represent a new structure, such as thermal anomaly. For example, in the north-eastern part of the caldera surrounding the fumarolic vents, we can observe such a mixture of different classes comprising classes 2, 4, 5 and 6. In general, it is common around hydrothermally altered areas to see vegetation which in most cases is classified as class number two.
5.3 Alteration effects on the landslide mass
The Askja landslide occurred on an unstable slope. Specifically, the current understanding is that the stability and instability of volcanic slopes is highly variable, changing in time and space. Conceptually, three main drivers of slope instability can be considered, i) a too steep slope, ii) changes to the system by extrinsic triggers such as earthquakes, iii) a progressive intrinsic strength reduction of rocks. This is on one side, because volcanoes are made up by very different materials, such as the Askja caldera rim, including products from effusive and explosive eruptions and endogenous growth. Consequently, these materials encompass highly variable physical and mechanical properties (Heap and Violay, 2021).
In a traditional way of thinking, unconsolidated and weak deposits may provide the main sliding horizons that govern dimensions, dynamics, and directions of mass wasting events. Depicting these sliding horizons is essential, as this contributes to our understanding of the collapse process, which may have high societal interest, as partial flank collapses at some 200 volcanoes globally have caused over 20,000 fatalities (Rosas-Carbajal et al., 2016). At Askja, we could demonstrate that different rock types were involved in the landslide mass, whereby hydrothermally altered materials are especially widespread and detectable by our drone remote sensing techniques throughout the landslide deposits. The finding of hydrothermally altered rocks is of relevance for (i) the destabilization of the slope, and (ii) the dynamics of the mass movement. The alteration-induced destabilization is in line with new research elsewhere that suggests that hydrothermal alteration is strongly affecting the strength of volcanic rocks. Indeed, studies suggest that hydrothermal alteration weakens a volcanic slope, which can increase with time to promote sudden collapse (van Wyk de Vries et al., 2000; Watters et al., 2000; Voight et al., 2002; Heap and Violay, 2021). Case studies are found globally, where hydrothermally altered materials are integrated in debris-avalanche deposits resulting from partial flank collapse. For instance, the 26 December 1997 rockslide at Soufrière Hills volcano (Montserrat, Eastern Caribbean) showed a mixed (“varicolored”) and hydrothermally altered material integrated into the avalanche deposits, implying that these materials could have contributed to the collapse (Voight et al., 2002). Following a strong storm, a flank collapsed at Casita volcano (Nicaragua), where detailed field mapping revealed a mixed material that formed by hydrothermally altered materials that contributed to the instability and the collapse that killed about 2,500 people (van Wyk de Vries et al., 2000). Similarly, deposits from La Soufrière de Guadeloupe (Eastern Caribbean, France) also entrained hydrothermally altered rocks (Salaün et al., 2011). The answer for most of these documented collapses can be found in the mechanical changes associated with hydrothermal alteration, causing a change in porosity and a dramatic reduction of compressive and tensile strength values (Heap and Violay, 2021).
The hydrothermally altered rocks at Askja have also altered the dynamics of mass movement. Types of landslides are usually classified according to either the type of movement (falls, overturns, slides, spreads and flows) or the type of material (bedrock, coarse or fine soils), based on Varnes (1978); Cruden and Varnes (1996). On the steep slopes and sub-vertical cliffs we find large blocks, possibly rotated, indicating solid mass overturning and rockfalls. On the medium slopes towards the coast we find well mixed material, indicating unconsolidated material. Therefore, we find that the collapse involved characteristics of two types of materials, bedrock and weak material mass movements. The hydrothermally altered and weakened materials probably have an important role in this mobilization process, as they cause a high mobility and mixture of the heterogeneous rock types involved in the landslide. The finally deposited materials therefore bear complex characteristics resembling a rock slide avalanche (at higher levels) and also unconsolidated debris slides (at lower levels). Our remote sensing and classification work thus demonstrates that hydrothermal alteration materials have been incorporated in the landslide materials at Askja as well, developing a mixed (varicolored) material class. Therefore, by using our approach, a systematic search of hydrothermally active zones and regions becomes feasible, allowing (i) identification of those flanks that may be prone to alteration and mechanical weakening prior to collapse, and (ii) consideration of a higher mobility of the mixed materials capable of reaching coastal regions and triggering tsunami hazards. Also other regions at the Askja caldera wall, and at calderas elsewhere, display hydrothermal activity and may therefore lead to similar destabilization and mobilization processes. Future mechanical works are needed and might provide further insights into the degree of weakening of rocks (Heap et al., 2021) and the resulting mobilization of landslide materials.
5.4 Implications for hazard assessment and early detection of mixed materials
We found that multicolored mixed materials in the landslide area are largely hydrothermally altered rocks. Furthermore, data suggest that they became mobilized during the slide process (Figures 9A, B). Our post-landslide drone survey suggests that a large number of steep sloped sites still host a similar material class, possible fumaroles, and sites of hydrothermal activity. We speculate that these may be prone to future collapses. Indeed a number of failures occurred after the main 2014 landslide, as was reported based on a local seismic network and high-amplitude short-period events that lasted up to 1 minute (Schöpa et al., 2018), interpreted by these authors due to secondary failures that followed the main slide.
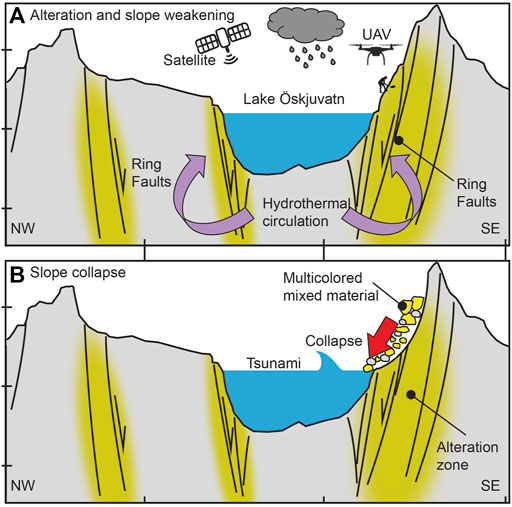
FIGURE 9. Conceptual model of collapsing mixed material. (A) Topographic profile and fault lines (shown as black lines) at the Askja caldera system. Hydrothermal circulation (yellow zones) includes meteoric waters and is inferred to be effective along the porous and permeable caldera rim that is dissected by abundant ring faults. Hydrothermal alteration of rocks is identified in satellite, drone and field hyperspectral data. (B) Collapse of the hydrothermally active flank into the lake produces a tsunami, and deposits characterized by alteration and multicolored materials. The cause of the collapse may be linked to the alteration zone, involving a lower permeability that results in pore fluid pressurization (after Heap et al., 2021). Instability of the SW flank and collapse into the lake was already described in Hartley and Thordarson (2012), profile and fault lines after Trippanera et al. (2018).
Understanding the mobility of landslide masses is of high relevance for simulations and predictions. For instance, landslides can now be modeled by granular porous media, and their effect when entering water bodies can be studied (Rauter et al., 2022). It is well known that basal shear resistance and topography initially control the mobility of landslide masses, where during the movement the material property and the interaction of the debris with the underlying substrate strongly control mobility (Aaron and McDougall, 2019).
We also speculate that material changes associated with hydrothermal alterations may significantly contribute to the landslide hazard and mobility. During alteration typically a significant reduction in permeability occurs, possibly by four orders of magnitude (Heap et al., 2021). This will modify, direct or even inhibit an effective fluid circulation inside the volcano and at the caldera rim (Figure 9A), leading to zones of high pore fluid pressure that may strongly affect slope stability (Heap et al., 2021). Furthermore, a landslide initiating at a hydrothermally weakened slope may incorporate additional masses of unaltered materials. These so-called erosional landslides may be particularly common at altered volcano slopes, and hence strongly influence the related and possible tsunamigenic energy budget of a moving mass with high mobility (Pudasaini and Krautblatter, 2021).
We conclude that porosity-decreasing alteration, explored here, and porosity-increasing alteration can both promote volcano instability and collapse, but by different mechanisms. Hydrothermal alteration should therefore be monitored at volcanoes worldwide and incorporated into hazard assessments. Especially during periods of unrest, occurrence of local earthquakes, deformation and increased fumarole activity, close monitoring of the steep and altered materials may save lives. At the time of this work, Askja is inflating, therefore a close watch and awareness rising is vital.
6 Conclusion
In this study, drone and satellite imagery allowed us to calculate and vectorise the extent of materials involved in the 2014 Askja landslide. Using PCA and classification approaches, we were able to distinguish different rock types and extract landslide materials that included hydrothermally altered source rocks. We find that the degree of altered rocks is high where the landslide has traveled far and is mixed, with a granular and light color. Comparison of classification results and hyperspectral measurements of the selected rock samples in the field further helped us to specify the rock characteristics in the studied area and to confirm the different alteration degrees of rocks in different classes. We find that oxidized materials incorporated into the landslide masses originate from the upper caldera rim. Based on these findings, we develop a conceptual model that takes into account hydrothermal alteration, mechanical weakening and flank instability. The landslide changed its mode of movement and material, with bedrock collapse, rockfall and overturning common in the upper caldera rim, and debris sliding and spreading of mixed altered materials in the farther reaches.
The shoreline in our study area retreated by 32,800 m2 between 2012 and 2014, and regained an area of 29,074 m2 between 2014 and 2019.46% of the approximately 0.8 km2 subaerial part of the landslide area is covered by altered material, which was previously about 33% of the same area. 54% of the landslide area is covered by unaltered material such as talus and basaltic lavas, compared to 67% of the same area before the landslide. The figures show us a 13% increase in altered material, which is consistent with our conceptual model.
Data availability statement
The raw data supporting the conclusion of this article will be made available by the authors, without undue reservation.
Author contributions
PM led the drone data acquisition in the field, coordinated the analysis of data and the writing of the manuscript. SB contributed to analyzing, geological interpretation and writing of the manuscript. TW supervised the project and contributed to the analysis and writing. FK acquired the hyperspectral data in the field and contributed to analyzing it. DM contributed to acquiring drone data. SC contributed in the analysis and writing. All authors contributed to writing and discussion of the results.
Funding
The Funding was partially provided by VOLCAPSE, a research project funded by the European Research Council under the European Union’s H2020 Programme/ERC consolidator grant ERC-CoG 646858. Travels were financially supported through GFZ expedition grants.
Acknowledgments
We are grateful for the kind help of Tanja Witt, Anne Schöpa, Bastian Steinke and Constantin Hildebrand during our fieldwork, and Heiko Woith and Magnus Tumi Gudmundsson for various discussions on Askja. Our acknowledgements to Planet Labs Education and Research Standard Program for providing us the PlanetScope/RapidEye imagery. We appreciate discussion and support by Magdalena Stefanova Vassileva and Mahdi Motagh from the GFZ Section 1.4 (Remote Sensing and Geoinformatics). We also appreciate the support by Ferdafelag Akureyrar for allowing hospitality and battery recharge at Dreki, and the Vatnajökull National Park for research and the exceptional drone permit.
Conflict of interest
The authors declare that the research was conducted in the absence of any commercial or financial relationships that could be construed as a potential conflict of interest.
Publisher’s note
All claims expressed in this article are solely those of the authors and do not necessarily represent those of their affiliated organizations, or those of the publisher, the editors and the reviewers. Any product that may be evaluated in this article, or claim that may be made by its manufacturer, is not guaranteed or endorsed by the publisher.
Supplementary material
The Supplementary Material for this article can be found online at: https://www.frontiersin.org/articles/10.3389/feart.2023.1083043/full#supplementary-material
References
Aaron, J., and McDougall, S. (2019). Rock avalanche mobility: The role of path material. Eng. Geol. 257, 105126. doi:10.1016/j.enggeo.2019.05.003
Aber, J. S., Marzolff, I., and Ries, J. (2010). Small-format aerial photography: Principles, techniques and geoscience applications. Town Amesterdam: Elsevier, 19–57.
Aguilera, F., Caro, J., and Layana, S. (2021). The evolution of peteroa volcano (Chile–Argentina) crater lakes between 1984 and 2020 based on Landsat and Planet Labs imagery analysis. Front. Earth Sci. 9, 722056. doi:10.3389/feart.2021.722056
Amici, S., Piscini, A., and Neri, M. (2014). Reflectance spectra measurements of Mt. Etna: A comparison with multispectral/hyperspectral satellite. Adv. Remote Sens. 03, 235–245. doi:10.4236/ars.2014.34016
Bedell, R., Crósta, A. P., and Grunsky, E. (2009). Remote sensing and spectral geology. Westminster, CO, United States. Society of Economic Geologists, Inc. 7811 Shaffer Parkway Littleton, CO, 80127. 978-1-934969-13-7.
Bedini, E. (2017). The use of hyperspectral remote sensing for mineral exploration: A review. J. Hyperspectral Remote Sens. 7 (4), 189–211. doi:10.29150/jhrs.v7.4.p189-211
Belousov, A., Walter, T. R., and Troll, V. R. (2005). Large-scale failures on domes and stratocones situated on caldera ring faults: Sand-box modeling of natural examples from Kamchatka, Russia. Bull. Volcanol. 67 (5), 457–468. doi:10.1007/s00445-004-0387-1
Brown, G. C., Everett, S. P., Rymer, H., McGarvie, D. W., and Foster, I. (1991). New light on caldera evolution—Askja, Iceland. Geology 19 (4), 352–355.10.1130/0091-7613(1991)019<0352:NLOCEA>2.3.CO;2
Canty, M. J. (2019). Image analysis, classification, and change detection in remote sensing: With algorithms for Python. 4th ed. Boca Raton, USA: CRC Press. 9780429464348. doi:10.1201/9780429464348
Clark, R. N., Swayze, G. A., Livo, K. E., Kokaly, R. F., Sutley, S. J., Dalton, J. B., et al. (2003). Imaging spectroscopy: Earth and planetary remote sensing with the USGS tetracorder and expert systems. J. Geophys. Res. Planets 108 (E12). doi:10.1029/2002JE001847
Crowley, J. K., and Zimbelman, D. R. (1997). Mapping hydrothermally altered rocks on Mount Rainier, Washington, with airborne visible/infrared imaging spectrometer (AVIRIS) data. Geology 25 (6), 559–562. doi:10.1130/0091-7613(1997)025<0559:MHAROM>2.3.CO;2
Cruden, D. M., and Varnes, D. J. (1996). “Landslide types and processes,” in Landslides-investigation and mitigation: Transportation research board, special report no. 247. Editors A. Keith Turner, and Robert L. Schuster (Washington, D.C.: National Research Council, National Academy Press), 36–75.
Cudahy, T., Caccetta, M., Thomas, M., Hewson, R., Abrams, M., Kato, M., et al. (2016). Satellite-derived mineral mapping and monitoring of weathering, deposition and erosion. Sci. Rep. 6 (1), 1–12. doi:10.1038/srep23702
Darmawan, H., Troll, V. R., Walter, T. R., Deegan, F. M., Geiger, H., Heap, M. J., et al. (2022). Hidden mechanical weaknesses within lava domes provided by buried high-porosity hydrothermal alteration zones. Sci. Rep. 12 (1), 3202. doi:10.1038/s41598-022-06765-9
Day, S. J., Carracedo, J. C., Guillou, H., and Gravestock, P. (1999). Recent structural evolution of the cumbre vieja volcano, La palma, canary islands: Volcanic rift zone reconfiguration as a precursor to volcano flank instability? J. Volcanol. Geotherm. Res. 94 (1-4), 135–167. doi:10.1016/s0377-0273(99)00101-8
de Zeeuw-van Dalfsen, E., Pedersen, R., Hooper, A., and Sigmundsson, F. (2012). Subsidence of Askja caldera 2000–2009: Modelling of deformation processes at an extensional plate boundary, constrained by time series InSAR analysis. J. Volcanol. Geotherm. Res. 213, 72–82. doi:10.1016/j.jvolgeores.2011.11.004
de Zeeuw-van Dalfsen, E., Rymer, H., Sigmundsson, F., and Sturkell, E. (2005). Net gravity decrease at Askja volcano, Iceland: Constraints on processes responsible for continuous caldera deflation, 1988–2003. J. Volcanol. Geotherm. Res. 139 (3-4), 227–239. doi:10.1016/j.jvolgeores.2004.08.008
de Zeeuw-van Dalfsen, E., Rymer, H., Sturkell, E., Pedersen, R., Hooper, A., Sigmundsson, F., et al. (2013). Geodetic data shed light on ongoing caldera subsidence at Askja, Iceland. Bull. Volcanol. 75 (5), 709–713. doi:10.1007/s00445-013-0709-2
Delaney, P. T. (1992). You can pile it only so high. Nature 357 (6375), 194–196. doi:10.1038/357194a0
Elíasson, J., and Sæmundsson, Þ. (2021). Physics and modeling of various hazardous landslides. Geosciences 11 (3), 108. doi:10.3390/geosciences11030108
Francis, P. W., and Wells, G. L. (1988). Landsat thematic mapper observations of debris avalanche deposits in the central andes. Bull. Volcanol. 50 (4), 258–278. doi:10.1007/BF01047488
Gee, M. J., Watts, A. B., Masson, D. G., and Mitchell, N. C. (2001). Landslides and the evolution of El Hierro in the canary islands. Mar. Geol. 177 (3-4), 271–293. doi:10.1016/S0025-3227(01)00153-0
Gholizadeh, A., Borůvka, L., Saberioon, M. M., Kozak, J., Vašát, R., and Němeček, K. (2015). Comparing different data preprocessing methods for monitoring soil heavy metals based on soil spectral features. Soil Water Res. 10 (4), 218–227. doi:10.17221/113/2015-SWR
Govil, H., Mishra, G., Gill, N., Taloor, A., and Diwan, P. (2021). Mapping hydrothermally altered minerals and gossans using hyperspectral data in eastern kumaon himalaya, India. Appl. Comput. Geosciences 9, 100054. doi:10.1016/j.acags.2021.100054
Graettinger, A. (2012). Building ice-age Askja: Processes, products, and paleoclimate. Pittsburgh. Doctoral dissertation, University of Pittsburgh, 462. http://d-scholarship.pitt.edu/13261/1/Graettinger_etd_2012_final.pdf.
Graettinger, A. H., Ellis, M. K., Skilling, I. P., Reath, K., Ramsey, M. S., Lee, R. J., et al. (2013). Remote sensing and geologic mapping of glaciovolcanic deposits in the region surrounding Askja (Dyngjufjöll) volcano, Iceland. Int. J. remote Sens. 34 (20), 7178–7198. doi:10.1080/01431161.2013.817716
Graettinger, A. H., McGarvie, D. W., Skilling, I. P., Höskuldsson, A. H., and Strand, K. (2019). Ice-confined construction of a large basaltic volcano—austurfjöll massif, Askja, Iceland. Bull. Volcanol. 81 (2), 9–23. doi:10.1007/s00445-019-1269-x
Greenfield, T., White, R. S., and Roecker, S. (2016). The magmatic plumbing system of the Askja central volcano, Iceland, as imaged by seismic tomography. J. Geophys. Res. Solid Earth 121 (10), 7211–7229. doi:10.1002/2016JB013163
Greenfield, T., White, R. S., Winder, T., and Ágústsdóttir, T. (2020). Seismicity of the Askja and Bárðarbunga volcanic systems of Iceland, 2009–2015. J. Volcanol. Geotherm. Res. 391, 106432. doi:10.1016/j.jvolgeores.2018.08.010
Gylfadóttir, S. S., Kim, J., Helgason, J. K., Brynjólfsson, S., Höskuldsson, Á., Jóhannesson, T., et al. (2017). The 2014 Lake Askja rockslide-induced tsunami: Optimization of numerical tsunami model using observed data. J. Geophys. Res. Oceans 122 (5), 4110–4122. doi:10.1002/2016JC012496
Gylfadóttir, S. S., Kim, J., Kristinn Helgason, J., Brynjólfsson, S., Höskuldsson, Á., Jóhannesson, T., et al. (2016). The 2014 Lake Askja rockslide tsunami-optimization of landslide parameters comparing numerical simulations with observed run-up. In EGU General Assembly Conference Abstracts (pp. EPSC2016-8927).
Hartley, M. E., Thordarson, T., and de Joux, A. (2016). Postglacial eruptive history of the Askja region, North Iceland. Bull. Volcanol. 78 (4), 28–18. doi:10.1007/s00445-016-1022-7
Hartley, M. E., and Thordarson, T. (2012). Formation of Öskjuvatn caldera at Askja, North Iceland: Mechanism of caldera collapse and implications for the lateral flow hypothesis. J. Volcanol. Geotherm. Res. 227, 85–101. doi:10.1016/j.jvolgeores.2012.02.009
Heap, M. J., Baumann, T., Gilg, H. A., Kolzenburg, S., Ryan, A. G., Villeneuve, M., et al. (2021). Hydrothermal alteration can result in pore pressurization and volcano instability. Geology 49 (11), 1348–1352. doi:10.1130/G49063.1
Heap, M. J., Troll, V. R., Kushnir, A. R., Gilg, H. A., Collinson, A. S., Deegan, F. M., et al. (2019). Hydrothermal alteration of andesitic lava domes can lead to explosive volcanic behaviour. Nat. Commun. 10 (1), 1–10. doi:10.1038/s41467-019-13102-8
Heap, M. J., and Violay, M. E. (2021). The mechanical behaviour and failure modes of volcanic rocks: A review. Bull. Volcanol. 83 (5), 33–47. doi:10.1007/s00445-021-01447-2
Helgason, J. K., Gylfadóttir, S. S., Brynjólfsson, S., Grímsdóttir, H., Höskuldsson, Á., Sæmundsson, Þ., et al. (2019). Berghlaupið í Öskju 21. júlí 2014. Náttúrufræðingurinn 89, 5–21. Availableat: https://www.vedur.is/gogn/snjoflod/vefgagnatilraun/skridufoll/NFR_2019_1-2-Askja.pdf.
Henderson, M. J. B., Horgan, B. H. N., Rowe, M. C., Wall, K. T., and Scudder, N. A. (2021). Determining the volcanic eruption style of tephra deposits from infrared spectroscopy. Earth Space Sci. 8 (2), e2019EA001013. doi:10.1029/2019EA001013
Hunt, G. R. (1977). Spectral signatures of particulate minerals in the visible and near infrared. Geophysics 42 (3), 501–513. doi:10.1190/1.1440721
Hürlimann, M., Turon, E., and Marti, J. (1999). Large landslides triggered by caldera collapse events in Tenerife, Canary Islands. Phys. Chem. Earth, Part A Solid Earth Geodesy 24 (10), 921–924. doi:10.1016/S1464-1895(99)00136-2
James, M. R., Robson, S., d'Oleire-Oltmanns, S., and Niethammer, U. (2018). Optimising UAV topographic surveys processed with structure-from-motion: Ground control quality, quantity and bundle adjustment. Geomorphology 280, 51–66. doi:10.1016/j.geomorph.2016.11.021
James, M. R., Robson, S., and Smith, M. W. (2017). 3-D uncertainty-based topographic change detection with structure-from-motion photogrammetry: Precision maps for ground control and directly georeferenced surveys. Earth Surf. Process. Landforms 42 (12), 1769–1788. doi:10.1002/esp.4125
Jóhannesson, T., Helgason, J. K., and Gylfadóttir, S. S. (2018). Comment on “dynamics of the Askja caldera july 2014 landslide, Iceland, from seismic signal analysis: Precursor, motion and aftermath” by Schöpa et al. Earth Surf. Dynam. 8, 173–175. doi:10.5194/esurf-8-173-2020
Jolliffe, I. T. (1986). “Principal components in regression analysis,” in Principal component analysis (New York, NY: Springer), 129–155.
Kempter, K. A., and Rowe, G. L. (2000). Leakage of Active Crater lake brine through the north flank at Rincón de la Vieja volcano, northwest Costa Rica, and implications for crater collapse. J. Volcanol. Geotherm. Res. 97 (1-4), 143–159. doi:10.1016/S0377-0273(99)00181-X
Kereszturi, G., Schaefer, L. N., Schleiffarth, W. K., Procter, J., Pullanagari, R. R., Mead, S., et al. (2018). Integrating airborne hyperspectral imagery and LiDAR for volcano mapping and monitoring through image classification. Int. J. Appl. Earth Observation Geoinformation 73, 323–339. doi:10.1016/j.jag.2018.07.006
Kerle, N., and De Vries, B. V. W. (2001). The 1998 debris avalanche at Casita volcano, Nicaragua—Investigation of structural deformation as the cause of slope instability using remote sensing. J. Volcanol. Geotherm. Res. 105 (1-2), 49–63. doi:10.1016/S0377-0273(00)00244-4
Lipman, P. W., and Mullineaux, D. R. (1981). The 1980 eruptions of Mount St. Helens. Washington: U.S. GPO. doi:10.3133/pp1250
López, D. L., and Williams, S. N. (1993). Catastrophic volcanic collapse: Relation to hydrothermal processes. Science 260 (5115), 1794–1796. doi:10.1126/science.260.5115.1794
Macdonald, R., Sparks, R. S. J., Sigurdsson, H., Mattey, D. P., McGarvie, D. W., and Smith, R. L. (1987). The 1875 eruption of Askja volcano, Iceland: Combined fractional crystallization and selective contamination in the generation of rhyolitic magma. Mineral. Mag. 51 (360), 183–202. doi:10.1180/minmag.1987.051.360.01
Madani, A. (2015). Spectroscopy of olivine basalts using FieldSpec and ASTER data: A case study from wadi natash volcanic field, south eastern desert, Egypt. J. Earth Syst.Sci. 124 (7), 1475–1486. doi:10.1007/s12040-015-06181
McGarvie, D. (2009). Rhyolitic volcano–ice interactions in Iceland. J. Volcanol. Geotherm. Res. 185 (4), 367–389. doi:10.1016/j.jvolgeores.2008.11.019
McGuire, W. J. (1996). volcano instability: A review of contemporary themes. Geol. Soc. Lond. Spec. Publ. 110 (1), 1–23. doi:10.1144/GSL.SP.1996.110.01.01
Mia, M. B., Fujimitsu, Y., and Nishijima, J. (2019). Exploration of hydrothermal alteration and monitoring of thermal activity using multi-source satellite images: A case study of the recently active kirishima volcano complex on kyushu island, Japan. Geothermics 79, 26–45. doi:10.1016/j.geothermics.2019.01.006
Müller, D., Bredemeyer, S., Zorn, E., De Paolo, E., and Walter, T. R. (2021). Surveying fumarole sites and hydrothermal alteration by unoccupied aircraft systems (UAS) at the La Fossa cone, Vulcano Island (Italy). J. Volcanol. Geotherm. Res. 413, 107208. doi:10.1016/j.jvolgeores.2021.107208
Norini, G., Bustos, E., Arnosio, M., Baez, W., Zuluaga, M. C., and Roverato, M. (2020). Unusual volcanic instability and sector collapse configuration at Chimpa volcano, central Andes. J. Volcanol. Geotherm. Res. 393, 106807. doi:10.1016/j.jvolgeores.2020.106807
Ohsawa, S., Saito, T., Yoshikawa, S., Mawatari, H., Yamada, M., Amita, K., et al. (2010). Color change of Lake water at the active crater lake of aso volcano, yudamari, Japan: Is it in response to change in water quality induced by volcanic activity? Limnology 11 (3), 207–215. doi:10.1007/s10201-009-0304-6
Pazand, K., Sarvestani, J. F., and Ravasan, M. R. S. (2013). Hydrothermal alteration mapping using ASTER data for reconnaissance porphyry copper mineralization in the Ahar area, NW Iran. J. Indian Soc. Remote Sens. 41 (2), 379–389. doi:10.1007/s12524-012-0229-0
Perlt, J., Heinert, M., and Niemeier, W. (2008). The continental margin in Iceland—a snapshot derived from combined GPS networks. Tectonophysics 447 (1-4), 155–166. doi:10.1016/j.tecto.2006.09.020
Pirajno, F. (1992). “Geological processes and hydrothermal mineralisation in plate tectonic settings—mineral exploration,” in Hydrothermal mineral deposits (Berlin, Heidelberg: Springer), 197–218. doi:10.1007/978-3-642-75671-9_7
Pudasaini, S. P., and Krautblatter, M. (2021). The mechanics of landslide mobility with erosion. Nat. Commun. 12 (1), 1–15. doi:10.1038/s41467-021-26959-5
Rader, E., Ackiss, S., Sehlke, A., Bishop, J., Orrill, B., Odegaard, K., et al. (2022). Average VNIR reflectance: A rapid, sample-free method to estimate glass content and crystallinity of fresh basaltic lava. Icarus 115084, 115084. doi:10.1016/j.icarus.2022.115084
Rajesh, H. M. (2004). Application of remote sensing and GIS in mineral resource mapping-An overview. J. mineralogical Petrological Sci. 99 (3), 83–103. doi:10.2465/jmps.99.83
Rauter, M., Viroulet, S., Gylfadóttir, S. S., Fellin, W., and Løvholt, F. (2022). Granular porous landslide tsunami modelling–the 2014 Lake Askja flank collapse. Nat. Commun. 13 (1), 1–13. doi:10.1038/s41467-022-28296-7
Reid, M. E., Sisson, T. W., and Brien, D. L. (2001). Volcano collapse promoted by hydrothermal alteration and edifice shape. Mt. Rainier, Wash. Geol. 29 (9), 779–782. doi:10.1130/0091-7613(2001)029<0779:VCPBHA>2.0.CO;2
Richards, J. A., and Richards, J. A. (1999). Remote sensing digital image analysis, 3. Berlin: Springer, 10–38.
Rosas-Carbajal, M., Komorowski, J. C., Nicollin, F., and Gibert, D. (2016). Volcano electrical tomography unveils edifice collapse hazard linked to hydrothermal system structure and dynamics. Sci. Rep. 6 (1), 1–11. doi:10.1038/srep29899
Saemundsson, T., Kristinn Helgason, J., Brynjolfsson, S., Hoskuldsson, A., Rut Hjartardottir, A., and Sigmundsson, F. (2015). The rockslide in the Askja caldera on the 21st of July 2014. In EGU General Assembly Conference Abstracts (p. 11734).
Salaün, A., Villemant, B., Gérard, M., Komorowski, J. C., and Michel, A. (2011). Hydrothermal alteration in andesitic volcanoes: trace element redistribution in active and ancient hydrothermal systems of Guadeloupe (Lesser Antilles). J. Geochem. Explor. 111 (3), 59–83. doi:10.1016/j.gexplo.2011.06.00
Schöpa, A., Chao, W. A., Lipovsky, B. P., Hovius, N., White, R. S., Green, R. G., et al. (2018). Dynamics of the Askja caldera july 2014 landslide, Iceland, from seismic signal analysis: Precursor, motion and aftermath. Earth Surf. Dyn. 6 (2), 467–485. doi:10.5194/esurf-6-467-2018
Schwartz, G., Eshel, G., and Ben Dor, E. (2011). Reflectance spectroscopy as a tool for monitoring contaminated soils. Rijeka, Croatia. Soil Contam, 6790.
Sekandari, M., Masoumi, I., Beiranvand Pour, A., M Muslim, A., Rahmani, O., Hashim, M., et al. (2020). Application of landsat-8, sentinel-2, ASTER and WorldView-3 spectral imagery for exploration of carbonate-hosted Pb-Zn deposits in the central Iranian terrane (CIT). Remote Sens. 12 (8), 1239. doi:10.3390/rs12081239
Self, S., and Sparks, R. S. J. (1978). Characteristics of widespread pyroclastic deposits formed by the interaction of silicic magma and water. Bull. Volcanol. 41 (3), 196–212. doi:10.1007/BF02597223
Siebert, L., Glicken, H., and Ui, T. (1987). Volcanic hazards from bezymianny-and bandai-type eruptions. Bull. Volcanol. 49 (1), 435–459. doi:10.1007/BF01046635
Siebert, L. (1984). Large volcanic debris avalanches: Characteristics of source areas, deposits, and associated eruptions. J. Volcanol. Geotherm. Res. 22 (3-4), 163–197. doi:10.1016/0377-0273(84)90002-7
Sigmundsson, F., Drouin, V., Parks, M., Dumont, S., Heimisson, E. R., Hjartardóttir, Á. R., et al. (2014). Deflation and deformation of the Askja caldera complex, Iceland, since 1983: Strain and stress development on caldera boundaries prior to tsunami generating rockslide in 2014 at Lake Öskjuvatn. In AGU Fall Meeting Abstracts 2014, V51A–V4715.
Sigmundsson, F., Einarsson, P., Hjartardóttir, Á. R., Drouin, V., Jónsdóttir, K., Arnadottir, T., et al. (2020). Geodynamics of Iceland and the signatures of plate spreading. J. Volcanol. Geotherm. Res. 391, 106436. doi:10.1016/j.jvolgeores.2018.08.014
Sigmundsson, F. (2006). Iceland geodynamics: Crustal deformation and divergent plate tectonics. Springer Science and Business Media.
Sigurdsson, H., and Sparks, R. S. J. (1981). Petrology of rhyolitic and mixed magma ejecta from the 1875 eruption of Askja, Iceland. J. Petrology 22 (1), 41–84. doi:10.1093/petrology/22.1.41
Sigvaldason, G. E. (1964). Some geochemical and hydrothermal aspects of the 1961 Askja eruption. Beiträge zur Mineral. Petrogr. 10 (3), 263–274. doi:10.1007/BF01081748
Sigvaldason, G. E. (2002). Volcanic and tectonic processes coinciding with glaciation and crustal rebound: An early holocene rhyolitic eruption in the Dyngjufjöll volcanic centre and the formation of the Askja caldera, north Iceland. Bull. Volcanol. 64 (3), 192–205. doi:10.1007/s00445-002-0204-7
Sparks, R. S. J., Wilson, L., and Sigurdsson, H. (1981). The pyroclastic deposits of the 1875 eruption of Askja, Iceland. Philosophical Trans. R. Soc. Lond. Ser. A, Math. Phys. Sci. 299 (1447), 241–273. doi:10.1098/rsta.1981.0023
Thorarinsson, S. (1968). On the rate of lava-and tephra production and the upward migration of magma in four Icelandic eruptions. Geol. Rundsch. 57 (3), 705–718. doi:10.1007/BF01845358
Thorarinsson, S., and Sigvaldason, G. E. (1962). The eruption in Askja, 1961; a preliminary report. Am. J. Sci. 260 (9), 641–651. doi:10.2475/ajs.260.9.641
Thordarson, T., and Larsen, G. (2007). Volcanism in Iceland in historical time: Volcano types, eruption styles and eruptive history. J. Geodyn. 43 (1), 118–152. doi:10.1016/j.jog.2006.09.005
Tompolidi, A. M., Sykioti, O., Koutroumbas, K., and Parcharidis, I. (2020). Spectral unmixing for mapping a hydrothermal field in a volcanic environment applied on ASTER, Landsat-8/OLI, and Sentinel-2 MSI Satellite Multispectral Data: The Nisyros (Greece) case study. Remote Sens. 12 (24), 4180. doi:10.3390/rs12244180
Trippanera, D., Ruch, J., Acocella, V., Thordarson, T., and Urbani, S. (2018). Interaction between central volcanoes and regional tectonics along divergent plate boundaries: Askja, Iceland. Bull. Volcanol. 80 (1), 1–19. doi:10.1007/s00445-017-1179-8
Van Der Meer, F. (2004). Analysis of spectral absorption features in hyperspectral imagery. Int. J. Appl. earth observation geoinformation 5 (1), 55–68. doi:10.1016/j.jag.2003.09.001
Van der Meer, F. D., Van der Werff, H. M., Van Ruitenbeek, F. J., Hecker, C. A., Bakker, W. H., Noomen, M. F., et al. (2012). Multi-and hyperspectral geologic remote sensing: A review. Int. J. Appl. Earth Observation Geoinformation 14 (1), 112–128. doi:10.1016/j.jag.2011.08.002
Van Wyk de Vries, B., and Davies, T. (2015). “Landslides, debris avalanches, and volcanic gravitational deformation,” in The encyclopedia of volcanoes (Academic Press), 665–685.
Van Wyk de Vries, B., and Delcamp, A. (2015). “Volcanic debris avalanches,” in Landslide hazards, risks, and disasters (Academic Press), 131–157.
Van Wyk de Vries, B., Kerle, N., and Petley, D. (2000). Sector collapse forming at Casita volcano, Nicaragua. Geology 28 (2), 167–170. doi:10.1130/0091-7613(2000)028<0167:scfacv>2.3.co;2
Van Wyk de Vries, B., Self, S., Francis, P. W., and Keszthelyi, L. (2001). A gravitational spreading origin for the Socompa debris avalanche. J. Volcanol. Geotherm. Res. 105 (3), 225–247. doi:10.1016/s0377-0273(00)00252-3
Varekamp, J. C., Ouimette, A. P., Herman, S. W., Bermúdez, A., and Delpino, D. (2001). Hydrothermal element fluxes from copahue, Argentina: A “beehive” volcano in turmoil. Geology 29 (11), 1059–1062. doi:10.1130/0091-7613(2001)029<1059:heffca>2.0.co;2
Varnes, D. J. (1978). “Slope movement types and processes,” in Landslides- analysis and control: Transportation research board special report 176. Editors R. L. Schuster, and R. J. Krizek (Washington, D.C.: National Research Council), 11–23.
Vidal, M., and Amigo, J. M. (2012). Pre-processing of hyperspectral images. Essential steps before image analysis. Chemom. Intelligent Laboratory Syst. 117, 138–148. doi:10.1016/j.chemolab.2012.05.009
Vogfjörd, K., Kristinn Helgason, J., Jonsdottir, K., Brynjolfsson, S., Grimsdottir, H., Johannesson, T., et al. (2015). The Askja rockslide and the associated tsunami in the caldera lake. In EGU General Assembly Conference Abstracts (p. 12128).
Voight, B., Komorowski, J. C., Norton, G. E., Belousov, A. B., Belousova, M., Boudon, G., et al. (2002)., 21. London, Memoirs, 363–407. doi:10.1144/gsl.mem.2002.021.01.17The 26 December (Boxing Day) 1997 sector collapse and debris avalanche at Soufriere Hills volcano, MontserratGeol. Soc.1
Walter, T. R., Haghshenas Haghighi, M., Schneider, F. M., Coppola, D., Motagh, M., Saul, J., et al. (2019). Complex hazard cascade culminating in the Anak Krakatau sector collapse. Nat. Commun. 10 (1), 1–11. doi:10.1038/s41467-019-12284-5
Ward, B., Williams-Jones, G., and Geertsema, M. (2020). Moving mountains: Landslides and volcanoes in a warming cryosphere. State of the mountains report 2020. Availableat: http://www.sfu.ca/volcanology/pdfs/Ward-State_of_the_Mtns_Rep'20.pdf.
Keywords: remote sensing, hydrothermal alteration, Askja landslide, PCA, classification, volcano hazards
Citation: Marzban P, Bredemeyer S, Walter TR, Kästner F, Müller D and Chabrillat S (2023) Hydrothermally altered deposits of 2014 Askja landslide, Iceland, identified by remote sensing imaging. Front. Earth Sci. 11:1083043. doi: 10.3389/feart.2023.1083043
Received: 28 October 2022; Accepted: 14 February 2023;
Published: 09 March 2023.
Edited by:
Yosuke Aoki, The University of Tokyo, JapanReviewed by:
Masaaki Morita, The University of Tokyo, JapanKaroly Nemeth, Institute of Earth Physics and Space Sciences, Hungary
Copyright © 2023 Marzban, Bredemeyer, Walter, Kästner, Müller and Chabrillat. This is an open-access article distributed under the terms of the Creative Commons Attribution License (CC BY). The use, distribution or reproduction in other forums is permitted, provided the original author(s) and the copyright owner(s) are credited and that the original publication in this journal is cited, in accordance with accepted academic practice. No use, distribution or reproduction is permitted which does not comply with these terms.
*Correspondence: Pouria Marzban, bWFyemJhbkBnZnotcG90c2RhbS5kZQ==