 Yuefeng Lu1,2,3*†
 Ying Sun1†
 Shuo Liu4,5Jing Li1Yanru Liu1Kaizhong Yao1
 Yanjun Wang3Zhongliang Fu6Shaofeng Lu7Shiwei Shao8,9*
- 1School of Civil and Architectural Engineering, Shandong University of Technology, Zibo, China
- 2State Key Laboratory of Resources and Environmental Information System, Institute of Geographical Sciences and Natural Resources Research, Chinese Academy of Sciences, Beijing, China
- 3Hunan Provincial Key Laboratory of Geo-Information Engineering in Surveying, Mapping and Remote Sensing, Hunan University of Science and Technology, Xiangtan, China
- 4China Transport Telecommunications and Information Center, Beijing, China
- 5Guojiao Spatial Information Technology (Beijing) Co., Ltd., Beijing, China
- 6School of Remote Sensing and Information Engineering, Wuhan University, Wuhan, China
- 7School of Computer Science and Engineering, Northeastern University, Shenyang, China
- 8Zhongzhi Software Technology Company Limited, Luoyang, China
- 9National-Local Joint Engineering Laboratory of Geo-Spatial Information Technology, Hunan University of Science and Technology, Xiangtan, Hunan, China
In the process of addressing, when people use words to express indistinctly, they often draw simple sketches to assist expression, which helps people to form a simple spatial scene in the brain and correspond to the actual scene one by one, and finally locate and find the target address. How to establish an one-to-one mapping relationship between the spatial objects in the hand-drawn sketch and in the vector map is the key to the realization of map addressing and location, and this process is also the process of map matching. This paper aims to address difficult problems associated with the features of hand-drawn sketches and vector map matching in order to improve the use of all potential matching points designed for application in hand-drawn sketches and spatial relation matrix structures of vector maps. To accomplish this, we use the N-queen problem solving process and improve the tabu search algorithm. In the matching process under the constraint of a single spatial relationship, and the hierarchical matching process under the constraint of multiple spatial relations, this study verifies the quality of the spatial relationship and the feasibility and effectiveness of the matching method of hand-drawn sketches and vector maps using the improved tabu search algorithm.
1 Introduction
In daily life, people often use “addressing” processes in order to discover the location of a certain target. The general “addressing” process involves the following: first, the use of human language and physical expression to describe the target, the reality of the entity and the description of the information with a one-by-one comparison and querying the process of the entity that conforms to the description of the information; secondly, by drawing a simple space scene map, and marking the location or scope, the drawn space scene and the real space scene in the real world have a one-to-one correspondence, to obtain the process of drawing the real space scene with the highest similarity to the drawing space scene; finally, the process of using text keywords or geographic coordinates for the retrieval of electronic maps and the realization of positioning in electronic maps, wherein the process of locating the target is achieved through the retrieval of the map, which is the process of “map addressing.” Map locating refers to the process of searching the entire extent of the map according to the input “search criteria” and querying the location of the content described in the “search criteria” in the map. At present, Baidu maps, Google Maps and other mainstream electronic maps widely use address as “search conditions” to find a location on their maps. However, when such text is unclear in the addressing process, people often use a simple sketch-map to assist in the process.
From a psychological perspective, the mental power of human beings to understand and manipulate the environment is called spatial cognitive ability, and the cognition of the environment essentially refers to psychological representation (cognitive mapping ability) and finding a way in the environment, and the main aspect of this is geospatial cognition (Lin, 2003). From a cartographic point of view, spatial cognition is “people’s knowledge of the environment in which they depend, including many of its things, phenomena and related locations, dependencies, and their changes and laws” (Gao, 2004). Maps are an important tool for people to perceive the environment, a model of the objective world, a carrier of information records and a “tool for spatial cognition and spatial thinking” (Chen, 2000; Gao, 2012). A mental map, or cognitive map, is an abstract map in the human brain and is one of the core concepts of map cognition (ZHENG and Xue’er, 2022). It refers to the formation of “abstract alternatives” in relation to the cognitive environment (space) in the mind after people obtain spatial information through a variety of means, reflecting a person’s spatial cognitive ability (Gao, 1992). Mental maps exist in a variety of forms, for example, the application of a method to reproduce the human brain’s impression of the surrounding environment, including shape, size or relative position (Gao, 1992). A hand-drawn map is one of physical form of a mental map, as an intuitive user interaction “language”; using its spatial relationship relative invariance, the spatial objects and the corresponding spatial objects in the vector map are mapped one by one. The establishment of this mapping relationship is the process of map matching but also the core step to achieving map positioning.
Hand-drawn sketches not only contain a lot of humanistic information in spatial information but also can be used to describe people’s daily travel habits. People can use hand-drawn sketches for travel addressing or path analysis to meet some of their daily needs (Rovine and Weisman, 1989; Son, 2005; Tu Huynh and Sean, 2007). As a graphical interaction method that vaguely approximates the user’s intention, hand-drawn sketching has the characteristics of intuitive and natural information input, and has been widely used in computer-aided design, virtual reality, visualization, artificial intelligence and other fields, and the relevant research focuses on the research of recognition technology of hand-drawn sketches (Schwering et al., 2014; Jan et al., 2015; Chipofya, 2016; Jan et al., 2017; Ali and Shahbazi, 2020).
However, the study of combining hand-drawn sketches with GIS is still in its infancy. Kettunen et al. (Kettunen et al., 2015) enabled people to combine cognitive recall and sketching of spatial scenes to the addressing process of night and day. Zardiny and Hakimpour (Zare Zardiny and Hakimpour, 2021) presented a new solution for matching routes from sketches to metric maps. It uses a genetic algorithm to measure the similarities between routes in two phases, and in each phase, a set of geometric/topological criteria is considered to improve the matching. Schwering and Wang (Schwering and Wang, 2010) developed an online system for matching hand-drawn sketches with metric maps, which combines hand-drawn sketch pre-processing, spatial relationship description and matching, providing an operational platform for subsequent research. Based on the research of Chipofya and other scholars on hand-drawn sketches, using the spatial relationship of each spatial object in the sketch as a registration condition with the measurement map, in the spatial relationship expression, the node is the spatial object, and the arc edge is the graph structure of the spatial relationship, and the registration process of the hand-drawn sketch and the measurement map is the map matching process (Yu et al., 2018; Dondi et al., 2020; Zhan et al., 2020; Hou et al., 2022; Hu et al., 2022).
Through the current research situation, it is understood that there is no clear concept or feature summary of the hand-drawn sketches applied in the field of geographic information, and there is no comprehensive classification summary of the types of spatial objects; the storage form of spatial relations in the computer is directly related to the efficiency of matching, and the current spatial relationship is mostly searched by tree structure, and its efficiency is low; the current graph matching method is based on the breadth priority and depth priority algorithm of the tree, which is improved or expanded, and its algorithm efficiency is low and occupies a large amount of memory. Furthermore, the matching accuracy rate cannot be guaranteed.
2 Optimized storage of spatial relationships for hand-drawn sketches
2.1 Hand-drawn sketches
Sketching by hand is the most primitive and natural way for people to communicate. Sketches may be drawn on paper or on smart devices (e.g., with drawing tools on mobile phones and tablets, the CogSketch application, etc.) to extract spatial objects through image recognition technology. Hand-drawn sketches range from simple “stick” drawings to complex blueprints, and serve to bring to mind the memory of a spatial scene. The sketch used in this study is a hand-drawn map. As the name implies, hand-drawn sketches (or maps) do not use professional observation equipment or mapping technology, and only memory will serve to deliver information (e.g., road network structure, landmark position, familiarity with the shape of the surface area and position, etc.) to draw on paper or intelligent display devices, finally obtaining a visual cognitive map. This is a personalized recognition of the space environment. Space scenes are reflected in the human brain (Zheng And Xue’er, 2022).
Hand-drawn sketches are easily and rapidly obtained, yet at the same time also expose the shortcomings of color simplification, being mostly black and white images that do not contain color and texture information. Furthermore, because of people’s cognitive distortion and schematization, hand-drawn sketching is highly abstract and exaggerated, such that the measurement information in hand-drawn sketching is largely invalid and contains no reference to geographic coordinates, as do standard directions and coordinates.
Figure 1 shows two examples of simple hand-drawn sketches. Both are largely drawn with simple black lines and simply marked ground objects. For example, the numbers in the left picture represent the corresponding dormitory building numbers, and the building name is abbreviated to the picture on the right. In hand-drawn sketching, people tend to abstract unnecessary details and aggregate a few objects that are typically more obscure or difficult to achieve by hand. In particular, road segments are one of the spatial objects that people habitually converge. According to investigations of hand-drawn sketching by Jia and Schwering (Wang and Schwering, 2009; Wang and Schwering, 2015), even with a high degree of aggregation and less professional and metric information, hand-drawn sketching contains many relatively invariable spatial relations, such as the relative position, size, orientation, and order of spatial objects. Similarly, according to Jan et al. (Jan et al., 2017), different person’s cognition of the same spatial scene has 90% consistency in terms of the expression of spatial information. Therefore, regardless of the degree of distortion of a person’s spatial cognition, the qualitative spatial relationship between spatial objects remains largely unchanged.
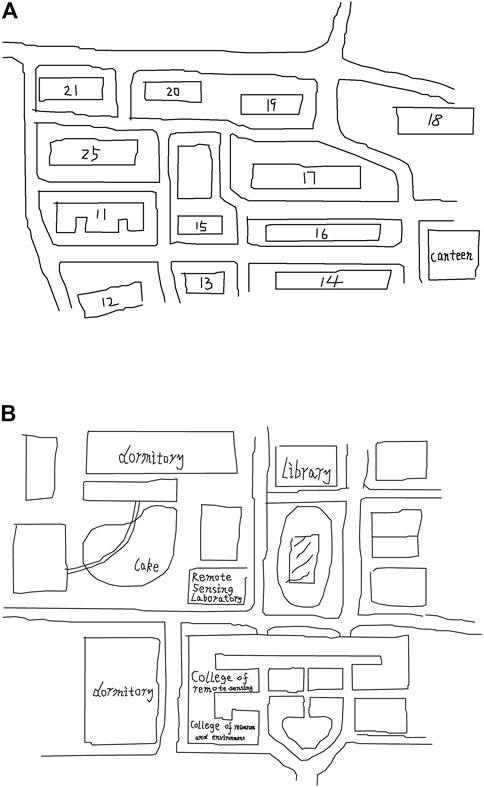
FIGURE 1. (A, B) Simple sketch examples.
Therefore, in the matching research of hand-drawn sketching, in order to match the hand-drawn map and vector map in this way, it is necessary to make full use of the qualitative spatial relations between the acquired spatial objects and make use of the constraints of single spatial relations or multiple spatial relations to match the hand-drawn map and the vector map.
Spatial objects are an objective reflection of space entities in human cognition. In this paper, space objects can be divided into roads, rivers, lakes, and other objects, and the shapes of entities can be divided into points, lines, and planes. A point is a spatial object that represents spatial location or location information, has no spatial scale, and is considered a 0-dimensional object. The locations of towns, shops, landmarks, by edges. Can be represented by points. Lines are represented by points connected sequentially, have no width, and are considered 1-dimensional objects. Rivers, roads, routes, etc. Can be represented by polylines or curves. A plane is a closed region belonging to a 2-dimensional object. Lakes, reservoirs, administrative areas, construction areas, green areas, and so on can be expressed by planes.
In this study, points, lines, and planes are taken as the basic objects of space,namely:
Recalling that points form lines and lines in turn form surfaces, relevant spatial data information can therefore be obtained from points. The hierarchical structure of the spatial objects is shown in Figure 2.
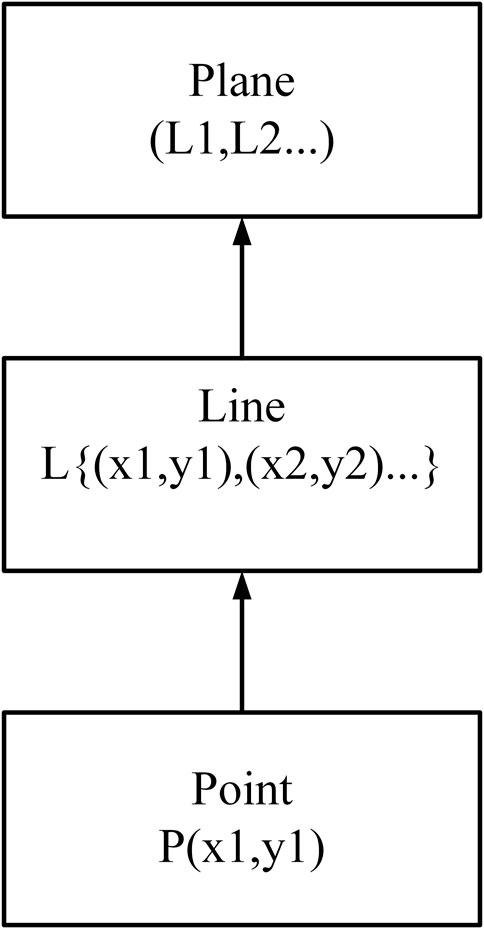
FIGURE 2. Spatial object hierarchy.
2.2 Spatial relations and expression methods in hand-drawn sketches
Interventionary studies involving animals or humans, and other studies that require ethical approval, must list the authority that provided approval and the corresponding ethical approval code.
Yingxinyang (Ying, 2003) analyzed spatial relations among spatial objects, including measurement relations (e.g., size, area, distance, angle, etc.), order relations (direction), and a variety of topological relations among points, lines, and planes. Considering the overall characteristics of hand-drawn sketches compared to the characteristics of the typical spatial object, hand-drawn sketches contain neither precise geometric features nor detailed semantic expressions. Therefore, prioritizing the topology relationship of spatial relations is invariant for hand-drawn sketches and vector maps. Spatial relations will become expressed through hand-drawn sketches by matching similarity measurements and matching the research focus of the vector map.
As mentioned earlier, standardized extraction and classification of spatial objects in hand-drawn sketches comprise three main types of spatial objects: points, lines and planes. The spatial relations expressed by different spatial objects are varied, and the detailed classifications and expressions are as follows:
(1) Topological relationships of road segments. The spatial relationship of roads generally includes the topological relationship of road segments, the connections between adjacent road segments, and the spatial relationship of fork points. At present, road section topological relationship models constructed based on the above feature space include the DRA7 (Oliver Wallgrün et al., 2010), DRA24 (Moratz and Ragni, 2008), and DRA72 (Moratz and Ragni, 2008) models, and the expression precision is successively from low to high.
(2) Spatial orientation relationship of road nodes. Orientation is a relative spatial relation; thus, it requires a certain frame of reference. Currently, the most widely used direction relation models are CM (cone model), two-dimensional character model, projection model and DRM (direction relation matrix). In terms of spatial cognition, the most familiar models are the 4-direction, 8-direction and 16-direction cone models. The 4-direction cone model takes the center of mass of the space object as the reference origin, and two straight lines perpendicular to each other divide the entire space into four unbounded regions, and assign a main direction to each unbounded region. The principal direction of the area in which the target space object resides is the relative orientation relative to the centroidal space object. The cone model has the flexibility to adjust the number of main directions. For example, the 8-direction and 16-direction cone models are based on the 4-direction, increasing the number of main directions, which are improved cone models that can judge more complex azimuth relationships.
(3) Relationship between ground features and road segments. Jan et al. (Jan et al., 2015) proposed a type of left-right model that can roughly express the relative position of the ground object and road section. This model contains six basic relations, which are the landmarks or ground objects along the road section titled: left_of, right, cross, crossed by, front_of, and back_of.
(4) Linear arrangement of ground objects along the road section. The linear arrangement relationship between ground features along the road and the road section refers to the sequence relationship of landmarks and ground features in the hand-drawn sketch along the direction of the road section. Jan et al. (Jan et al., 2017) mentioned that Allen’s interval algebra (IAS) was used to express the spatial relationship of the linear arrangement of ground objects along the path.
(5) Circulating arrangement of ground features at fork points. Osmani (Aomar, 1999) compensated the cycle time for the IAS relation and proposed a cycle time relation.
(6) Region topology relationships. The spatial logic method was proposed by Randle et al. (Randell et al., 1992) on the basis of the theory of regional connectivity, also known as the RCC (region connect calculate) model. RCC5 and RCC8 are the most widely used models. RCC5 and RCC8 distinguish five and eight different topological relationships, respectively, providing a flexible choice for application selection at different levels of granularity. Wenzheng et al. (Wenzheng, 2015) elaborated on the RCC8 relationship model, which specifies eight basic relationships between two spatial regions: DC (disjoint), EC (touch), PO (overlap), EQ (equal), TPP (cover) and
(7) Topological relationships between ground objects and regions. The RCC11 model is more sensitive to the boundary detection of spatial objects. However, sensitivity to boundary detection is not allowed for the expression of topological relations between ground objects (points) and regions (planes). Considering the time complexity of the algorithm, the sensitivity to boundary detection is used for the expression of topological relations between ground objects (points) and regions (planes). The RCC5 model satisfies the need for matching.
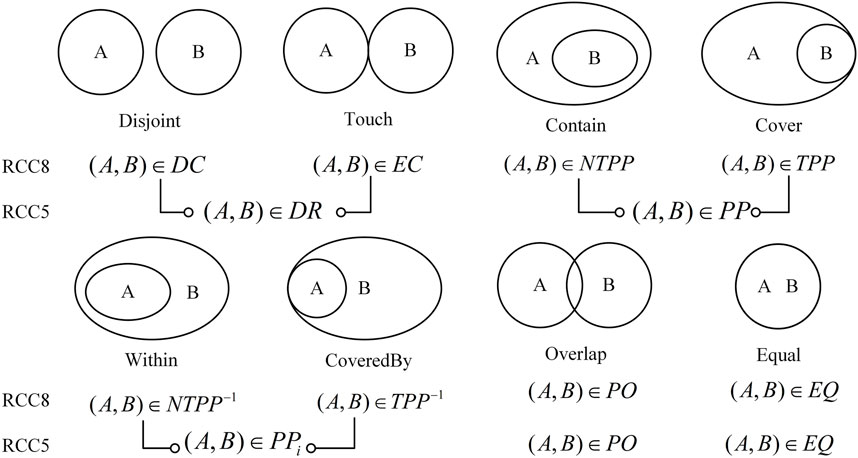
FIGURE 3. The basic topology relations based on RCC5 and RCC8.
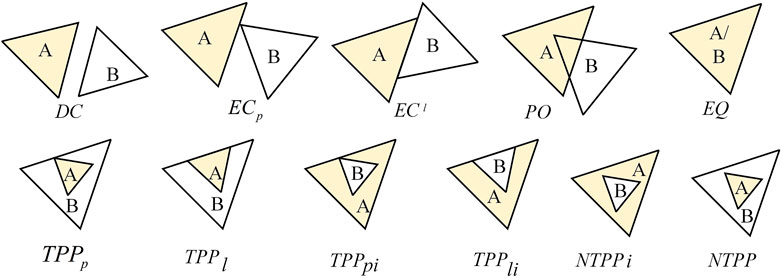
FIGURE 4. The 11 topological relations in RCC11.
The above seven spatial relations include topological relations, azimuth relations and sequence relations, and refer to ways in which the spatial relations in the hand-drawn sketch can be obtained in a more comprehensive way.
2.3 Spatial relation matrix
Suppose a graph has two basic representations: an adjacency list and an adjacency matrix. These two basic representations can be used to represent both undirected and directed graphs. The expression
A graph is a commonly used data structure in computers, and are considered to define many interesting computational problems. It can be assumed that the spatial relation obtained by hand-drawn sketching is the input graph, and the spatial relation in the vector map is the reference graph. Given an input graph and a target graph, the task of matching is to establish a one-to-one mapping relationship between all nodes in the input graph and nodes in the target graph.
Assume that R is the set of spatial relations, where N is the node, E is the edge of the graph, and I is the mapping function. The matching mapping function of the input graph (
Figure 5 shows a hand-drawn sketch near the south gate of the informatics department and its topological relationship based on RCC8 and the vector of the same area and its topological relationship based on RCC8. Spatial objects and qualitative spatial relations in hand-drawn sketches and vector maps are, respectively, expressed by an adjacency matrix, with spatial objects as nodes and qualitative spatial relations as the weight of edges. The expression results are shown in Tables 1, 2. However, it is very difficult to realize the matching process of graphs using two independent adjacency matrices. The essence of graph matching is that any point in the hand-drawn sketch and any node in the vector map forms a point pair to be matched. Further, it is also judged whether the weight of the corresponding edge of any two point pairs to be matched is consistent. If so, the two-point pair is considered to be matched.
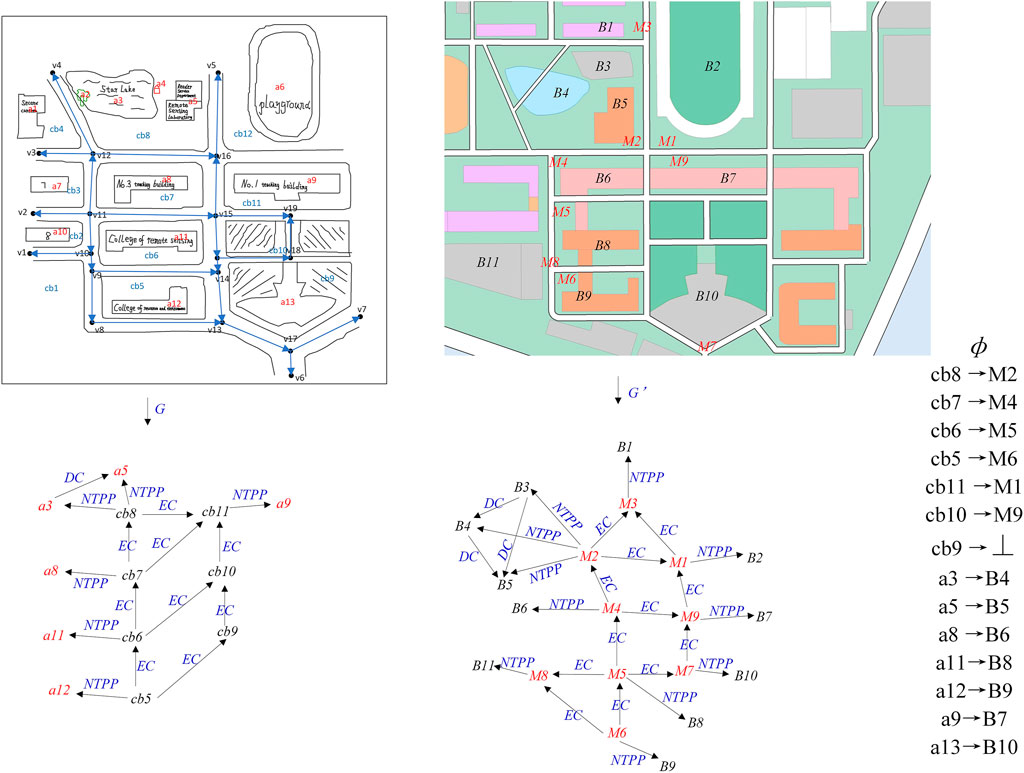
FIGURE 5. RCC8-based topological relationship both sketch map and vector maps near the south gate of the informatics department.
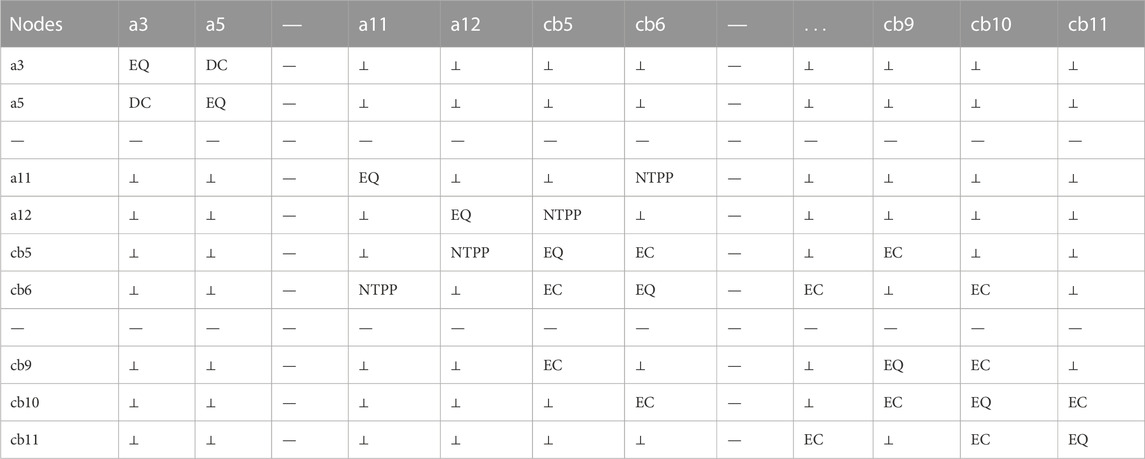
TABLE 1. The adjacency matrix of space relations of sketch maps in Figure 6.
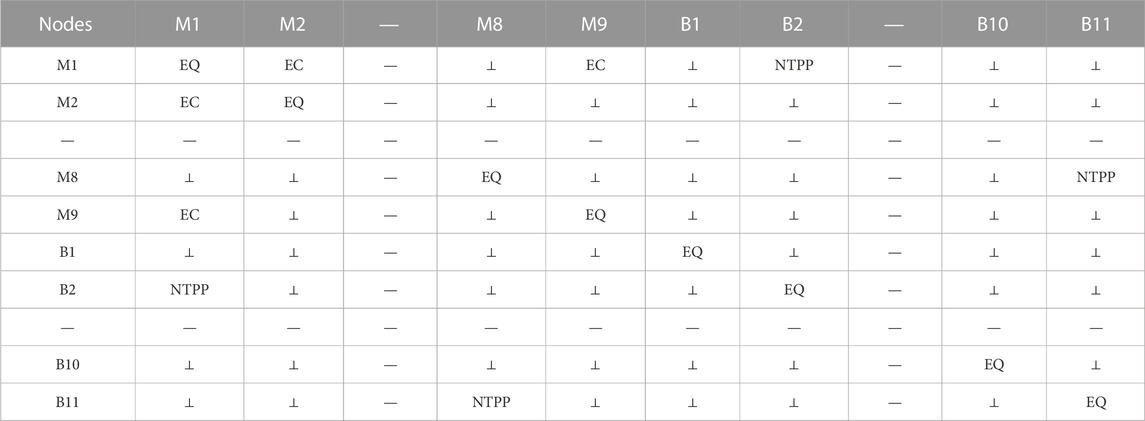
TABLE 2. The adjacency matrix of space relations of vector maps in Figure 6.
Notes: The node set of the input graph is expressed by:
In Figure 5, it is assumed that there are potential matching point pairs
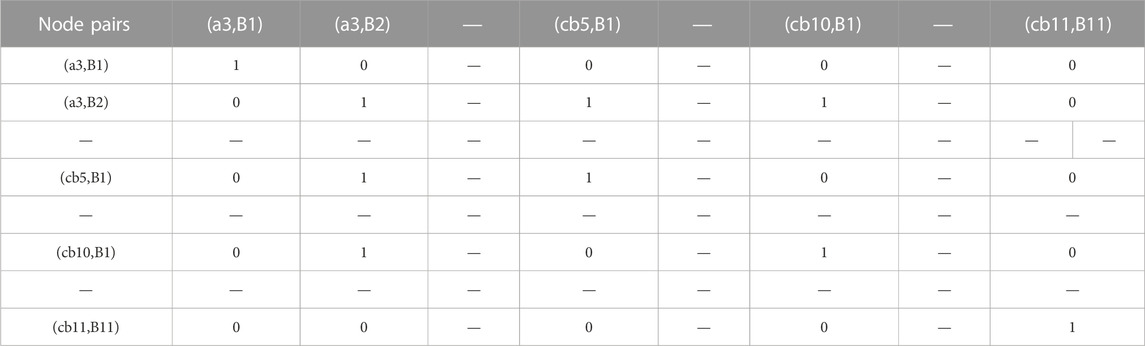
TABLE 3. Improved adjacency matrix.
Figure 6 shows the construction process of the improved adjacency matrix, including the analysis of its features, removal of the point pairs that do not have matching values, and making of the adjacency matrix sparse, so as to obtain further matching point pair combinations. Where Tables 1, 2 are the matrices corresponding to the marked portions in Figure 6.
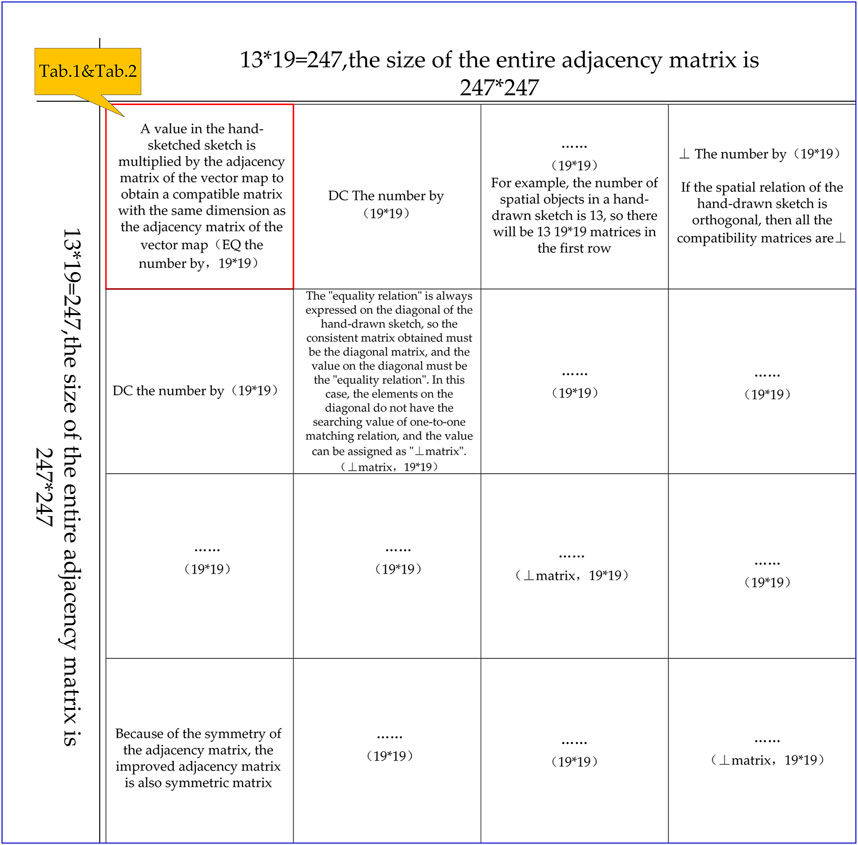
FIGURE 6. Characteristics and construction rules of the improved adjacency matrix.
The characteristics of the improved adjacency matrix are as follows:
(1) If the spatial relation of the hand-drawn sketch is orthogonal, then all the compatibility matrices are also orthogonal.
(2) Each square matrix is obtained by multiplying the value in the hand-drawn sketch by the adjacency matrix of the vector map. The matrix size is the same as the adjacency matrix of the vector map.
(3) The adjacency matrix of the hand-drawn sketch and vector map has symmetry, so the improved adjacency matrix also has symmetry.
(4) The diagonal direction of the hand-drawn sketch consistently represents the equality relation, thus it follows that the value on the diagonal is the equality relation. In this case, the elements on the diagonal do not have the searching value of one-to-one matching relation, thus the value can be assigned as the “orthogonal matrix” to make the matrix sparse.
(5) Let the number of spatial objects in the hand-drawn sketch be m, the number of spatial objects in the vector map be n, the improved adjacency moment be a square matrix, and the number of rows and columns are both
3 Matching method based on the improved tabu search (TS) algorithm
3.1 Tabu search algorithm principle
Glover proposed an algorithm based on local neighborhood search to achieve a global optimal search, the tabu search (TS) algorithm, which is considered as the best simulation of human brain activities and aims to solve typical optimization problems. The TS algorithm is based on two important basic theories: local search and tabu criterion. As a local search algorithm, the TS algorithm selects the optimal scheme for the current searched neighborhood in each iteration. In the TS algorithm, tabu criteria and a tabu table are introduced to avoid repeated searches, and then amnesty criteria are adopted to release the high-quality scheme of the tabu, thus the final global optimization is guaranteed. The TS algorithm is considered to have the closest functionality to human brain activity among the current intelligent optimization algorithms. By marking the local optimal solution and then iterating the search, tabu objects can be avoided as far as possible in the search process. However, through the amnesty criterion, tabu objects can be searched in a circular manner in order to realize the search for a global optimal solution. The basic search steps of the TS algorithm are as follows:
(1) Set the initial solution
(2) Take the current solution as
(3) Calculate the fitness function
(4) The current solution is moved to generate a neighborhood solution
(5) If
(6)
(7) Perform step 4 until the current solution of
3.2 Improving the matching process of the TS algorithm
In this study, the traditional tabu search algorithm is improved from the two aspects of the selection of the optimal initial solution and the setting of the adaptive value function, so as to make the TS algorithm more suitable for the process of graph matching, improve the matching efficiency, and obtain the optimal matching results. The two main steps used are described as follows:
(1) Select the initial solution. In order to avoid the low efficiency of the algorithm caused by improper selection of the initial solution, this study first randomly generated a group of initial solutions, then executed a complete matching process to obtain a group of effective solutions under the initial solution, and took the effective solution as the optimal initial solution for the formal matching process.
(2) Determine the adaptation value function setting. Generally, the improved adjacency matrix is constructed by the consistency of the spatial relation expression of all potential matching point pairs. In the matching process, to ensure the realization of a one-to-one matching relationship, there is only one effective matching point pair in the same row and column. If there are two or more valid point pairs to be matched in the same row and column, it is considered a “collision.” In this study, we needed to search the improved adjacency matrix to identify the point pair sequence that could guarantee a “no conflict” situation by referring to the queen placement method of the N queen problem. Let the number of conflicts of the effective point pairs corresponding to row i and column j be
Using the TS process, in this study the adjacency matrix of the hand-drawn sketch and vector map was first obtained as the original input matching data. According to the construction principle of the improved adjacency matrix, the corresponding improved adjacency matrix containing spatial relationship consistency information was constructed as the “checkerboard” of the tabu search. For the initial solution of the tabu search, a set of initial solutions were generated randomly for the first time, and an optimal solution under the initial solution was obtained according to the following steps of the tabu search, and the modified optimal solution was taken as the initial solution of the second matching process. The steps for the tabu search used in this study are as follows:
(1) The tabu list was emptied. The initialized tabu length L was the number of objects in the hand-drawn sketch, that is, the number of iterations of the tabu solution in the tabu list. The tabu length of the tabu solution in each iteration was correspondingly reduced by 1 and released from the tabu list until reaching 0. The tabu frequency was F, the number of objects in the hand-drawn sketch was multiplied by the number of objects in the vector map, that is, the number of tabu solutions appearing in the tabu list. When the tabu solution entered the tabu list, the number of tabu solutions entering the list was recorded. If this number was greater than F, it was considered to be a solution with a low matching result and would not be released again.
(2) The total number of collisions
(3) It was then judged whether the target number of overlapped reaches was reached, set as 10,000 in this study; if not, the process was continued. If the number of iterations was reached, the current solution was input, that is, the optimal matching point pair sequence, and the algorithm ended.
(4) The neighborhood solution of
(5) It was then judged whether a candidate solution existed in the tabu list. If so, the better solution in the above neighborhood solution was considered as the candidate solution
(6) It was determined whether the conflict number of the candidate solution was less than the conflict number of the current solution, that is
The specific matching method flow is shown in Figure 7.
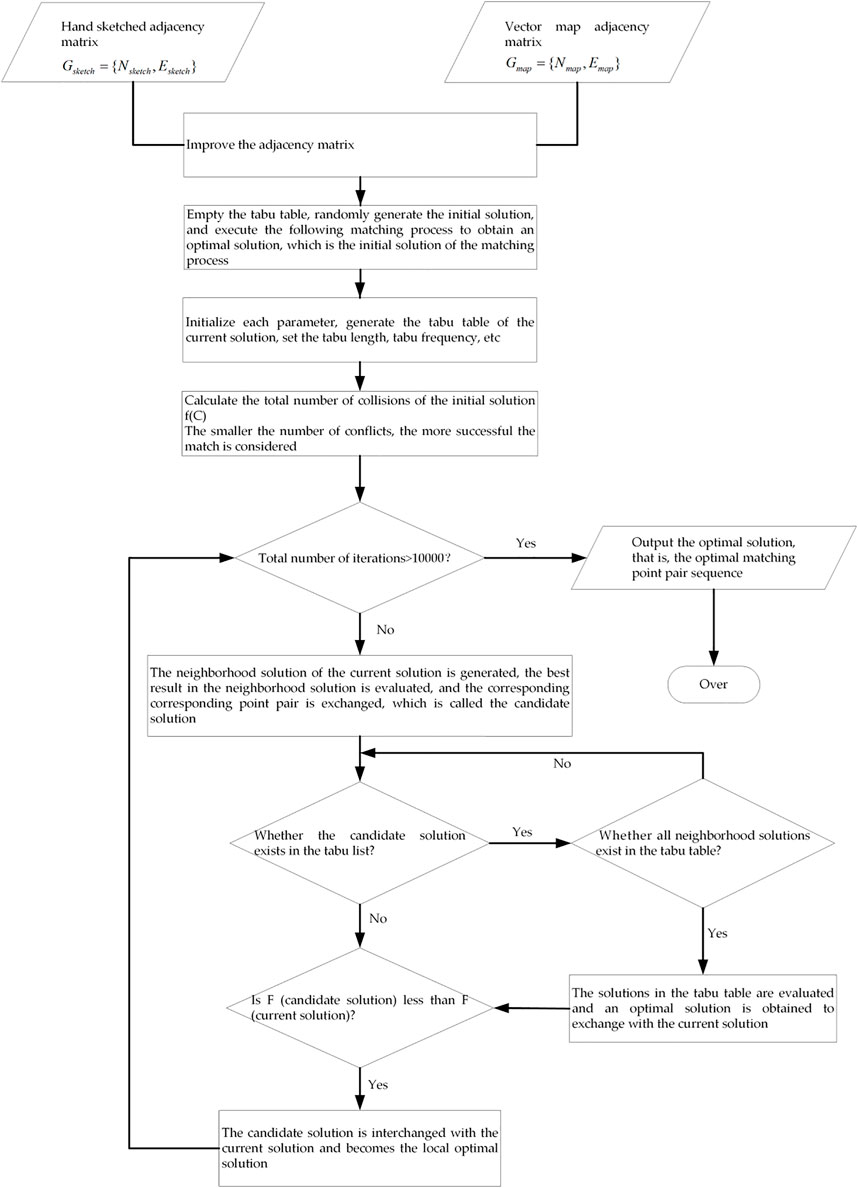
FIGURE 7. Flow chart of sketch and vector map matching methodology.
4 Experiment and analysis
The data of hand-drawn sketches in this study were collected on the campus of the Information Department of Wuhan University. The Information Department has a typical campus structure, in that the campus is surrounded by a commercial district, which contains a large number of iconic buildings and a complex road network. The campus features a network of roads, including vehicular roads, pedestrian paths, and ornamental walking paths, which are divided into teaching, dormitory, and residential areas, as well as landmarks such as iron towers and sculptures. A campus map is shown in Figure 8.
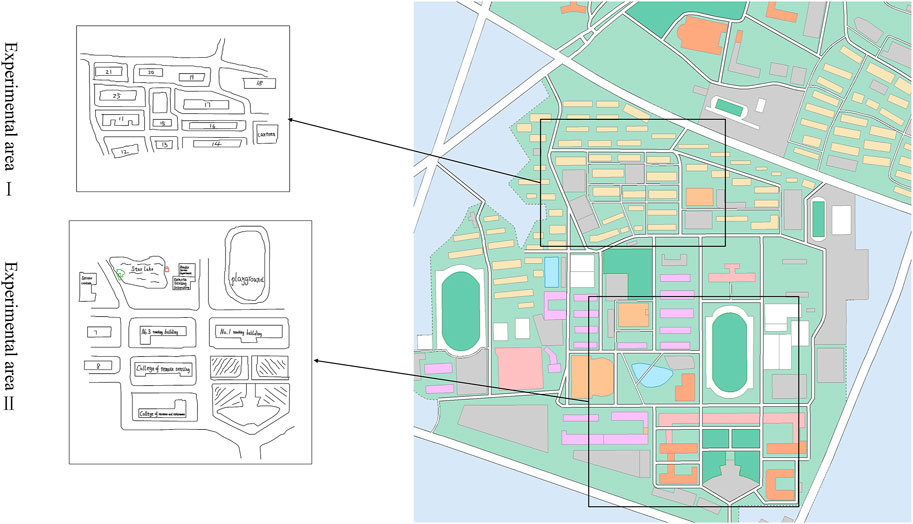
FIGURE 8. The range of sketch and vector maps.
Of the 20 sketches collected, eight were excluded because they contained insufficient spatial information, and the remaining 12 were determined as valid maps for the experiment. A total of 304 road segments, 278 landmarks, and 124 plane-like areas were identified in the 12 sketches collected. The experimental data diagram is shown in Figure 9. For evaluation of matching, first observe the matching rate, which is a direct evaluation of the quality of topological relations. Secondly, the running time of the algorithm is monitored to evaluate the efficiency of the algorithm. If there is only one model for a spatial relationship, only the standard deviation is used as the evaluation difference range. For two or more expression models under the same spatial relationship, in addition to the standard deviation, Mann Whitney U test is added to jointly test the reliability of the matching results.
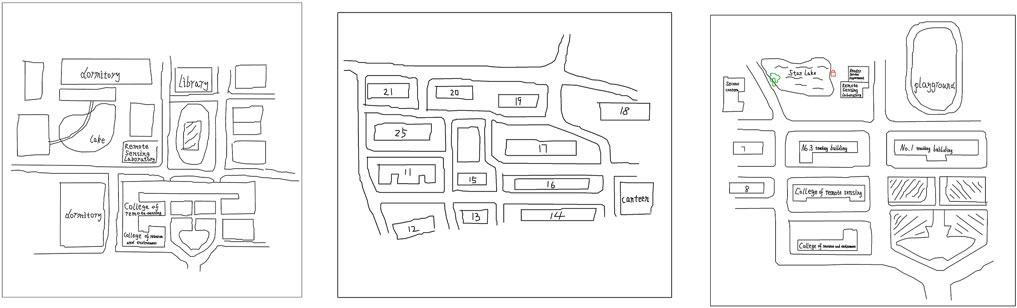
FIGURE 9. Experimental data diagrams.
4.1 Matching evaluation
Assuming that the spatial objects and their spatial relation diagram of
Standard deviation was used to identify the difference between the matching results. The larger the standard deviation, the larger the variance of the matching results and the greater the difference of the matching results. In this paper, matching experiments are carried on two spaces near the school gate and in the student dormitory area. Eight valid hand drawings are collected for experiment in each space. The
Assuming that for two projections of the same space, the same spatial objects and their spatial relations are present in each projection, and different qualitative expression models are used for the same spatial relationships, the purpose of the Mann–Whitney U test is to test the difference between different qualitative expression models under the same spatial relationship, and to judge whether there is a significant difference in matching results. According to cognitive research, people maintain 90% of the correct relationship between the drawn object and reality, thus the threshold of no significant difference given in this study is p=0.05. The specific process of the Mann–Whitney U test method in this study can be described as follows:
(1) Determine hypothesis
(2) Set the significant difference level p;
(3) Mix the two matching result sets, arrange them in ascending order, and arrange the rank.
If the values are the same, then the average value of each grade is calculated as follows:
(1) Calculate grades
(2) Calculate
(3) Select the minimum values of
4.2 Discussion
4.2.1 Matching based on topological relationship of road segments
For the topological relationship of road segments, this paper evaluates the DRA72 and DRA7 topological relationship qualitative expression models. DRA72 and DRA7 models are used to express the topological relationship of all road segments in the freehand sketch and vector map, which are represented as
According to Tables 4, 5, the average correct matching rate of DRA7 is 79.1%. The standard deviation and Mann–Whitney U test (
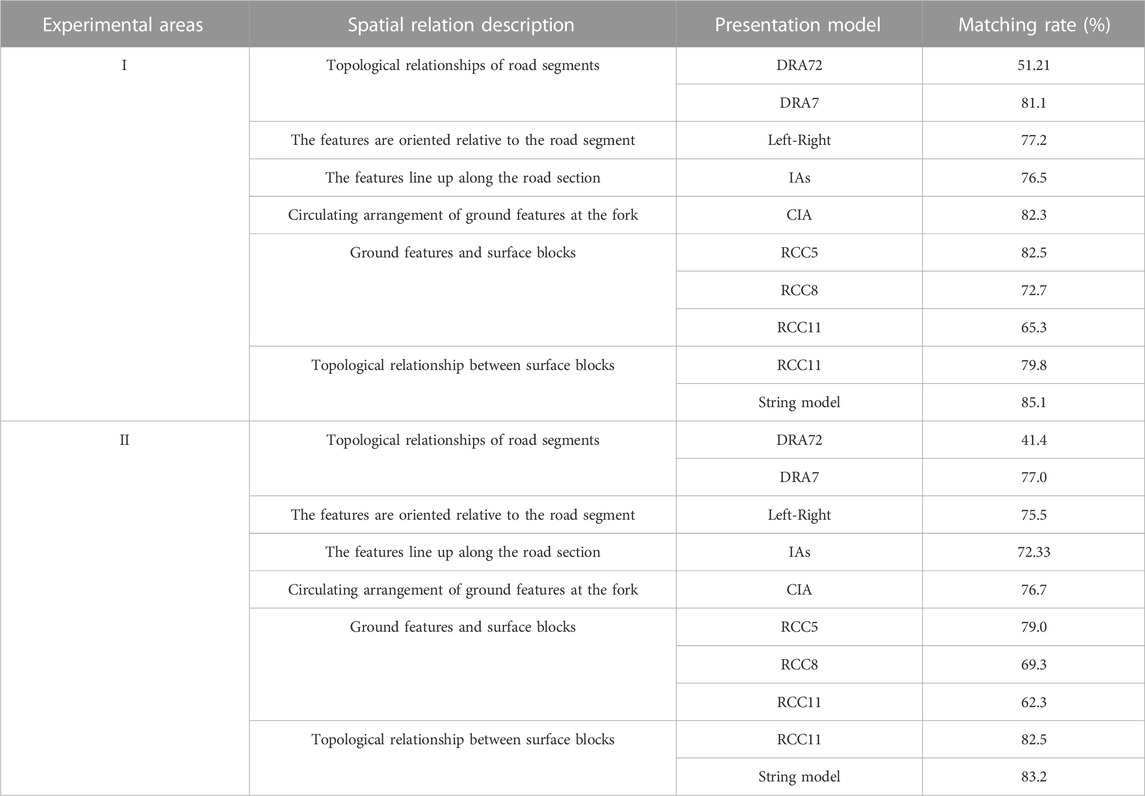
TABLE 4. Matching results and statistical calculation table based on different spatial relations.
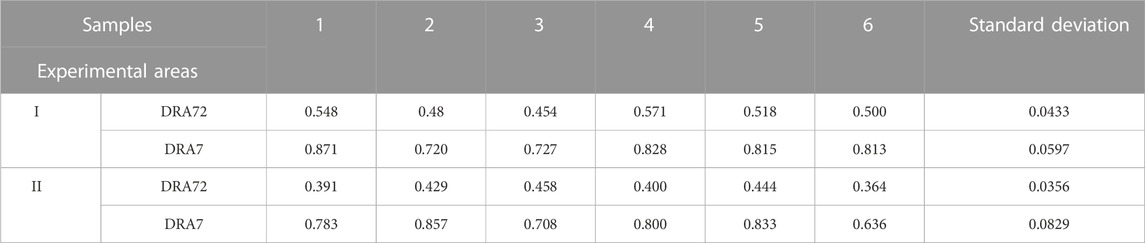
TABLE 5. Standard deviation based on DRA7&DRA72 of each data in experimental area I and II.
DRA72 is a detailed spatial relationship expression model, which contains both the topological relationship between road segments and the relative direction attribute. Therefore, when DRA72 model is used for matching, there are many wrong matching of road segments, and the matching rate is only 46.31%. The Mann–Whitney U test result of DRA72 is that
4.2.2 Matching based on ground figures and road segments
Left-Right indicates the relative orientation between the features and adjacent road sections, with an average matching rate of 76.7%. Left-Right will recognize the adjacent figures of the figure as the extended space object, and obtain the relative orientation relationship between them. Due to the high aggregation of people’s spatial cognition, the objects in the freehand sketch do not necessarily have one-to-one correspondence with the spatial objects in the corresponding vector map, which may be a one to many relationship. Therefore, the freehand sketch objects will have multiple matching correspondences in the vector map, reducing the accuracy of the matching.
According to the standard deviation in Table 6 and Mann–Whitney U test (
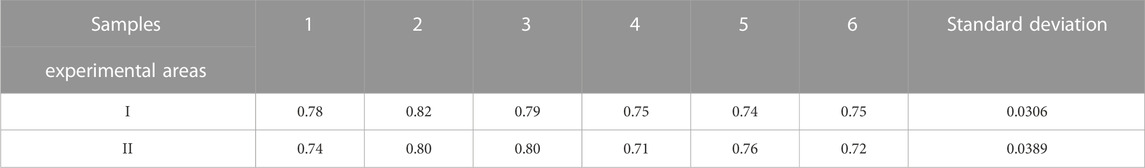
TABLE 6. Standard deviation based on Left-Right of each data in experimental area I and II.
4.2.3 Matching based on linear arrangement of figures
This section uses the rough IAs linear arrangement relationship to express the linear arrangement order relationship between adjacent figures along the road alignment and road segments. Table 4 shows the matching accuracy of experimental areas I and II and the running of the algorithm. It can be observed that the matching accuracy is about 75%, with a small gap. By calculating the standard deviation in Table 7 of the matching rate of experimental samples and the Mann–Whitney U test (
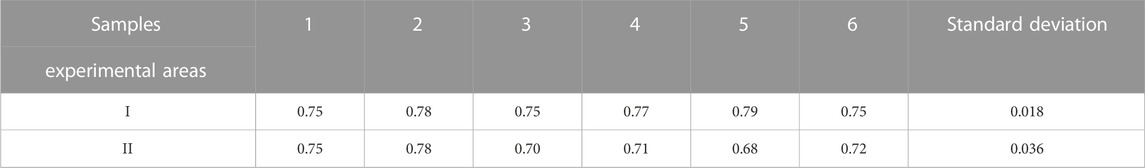
TABLE 7. Standard deviation based on IAs of each data in experimental area I and II.
It is precisely because the freehand sketch does not accurately describe the contour of the figure, compared with the spatial relationship of the corresponding spatial objects in the vector map, this uncertainty will lead to different mapping. Therefore, the clustering of spatial relations by rough IAs model is just conducive to keeping the two spatial relations consistent and improving the matching rate.
4.2.4 Matching based on figure loop relation
Because the adjacent ground objects at the fork show the characteristics of circular arrangement, this section uses the CIA circular relationship expression model to express the spatial relationship of the objects at the fork in hand drawn sketches and vector maps, and obtain a rough circular arrangement relationship. It can be seen from Tables 4, 8 that the average matching rate of CIA experimental area I and II is 79.5%, and the inconsistent matching results are caused by the inaccurate contour of the ground object and the dislocation of the adjacent ground object at the fork.
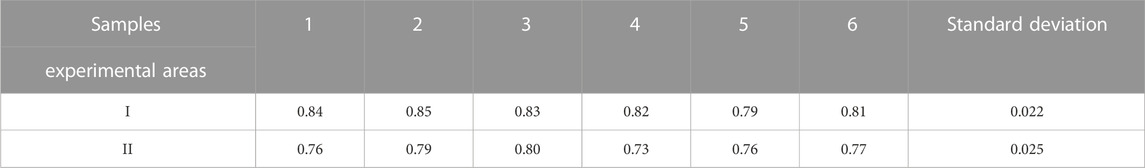
TABLE 8. Standard deviation based on CIA of each data in experimental area I and II.
4.2.5 Matching based on topological relationship between figures and blocks
For the topological relationship between the surface features and urban area blocks, this section uses three classical regional connection relationship models, RCC5, RCC8 and RCC11, to extract the spatial relationship, and compares the matching accuracy and significant difference level among the three. As shown in Table 4, RCC5 shows a high matching rate. This is because RCC5 ignores the boundary intersection between ground objects when acquiring topological relationships. This formal fuzzy relationship description overcomes the imprecise drawing of hand drawn sketches on the boundary. Compared with the other two relationship models, RCC5 is more suitable for matching topological relationships based on ground objects and area blocks.
According to the calculation of the Mann–Whitney U test values (7, 7.5 and 3.5 respectively) and the standard deviation in Table 9, RCC11 shows significant differences in the topological relationship between the surface features and the regional surface blocks in different regions, while RCC5 and RCC8 show no significant differences. Compared with the matching rate, RCC5 is relatively higher.
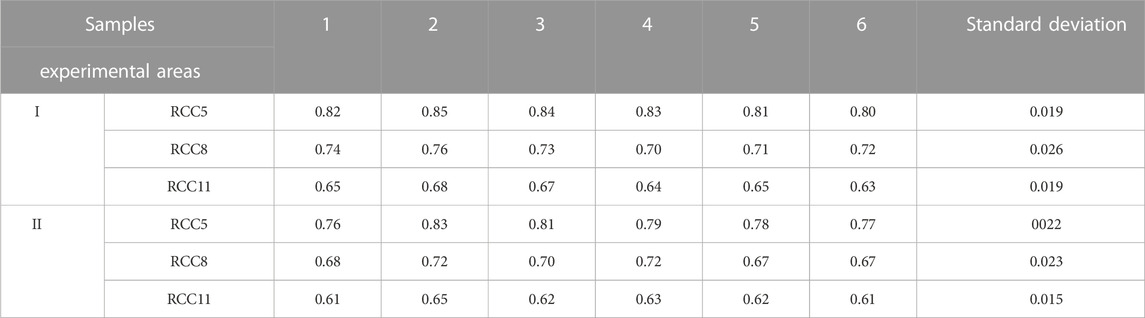
TABLE 9. Standard deviation based on RCC5/RCC8/RCC11 of each data in experimental area I and II.
4.2.6 Matching RCC11 and string based on topological relationship between blocks
Jan et al. (Jan et al., 2017) have verified that RCC11 has a high matching accuracy for the topological relationship between area blocks, and RCC and RCC8 models have lost significant topological structure, such as the distinction between line adjacency and point connection between area blocks, resulting in inconsistent and untrustworthy matching results. The string representation model with the same granularity as the RCC11 model has not been matched and verified in previous experiments. Table 4 shows that the average matching rate of RCC11 is 81.15%, and the average matching rate of strings is 84.15%. Therefore, the matching rate of the two remains at the same level.
As shown in Table 10, in terms of U test and standard deviation evaluation, the value of RCC11 is 3.5 and that of circular string is 10. Therefore, in terms of matching difference, circular string has significant difference in matching results.
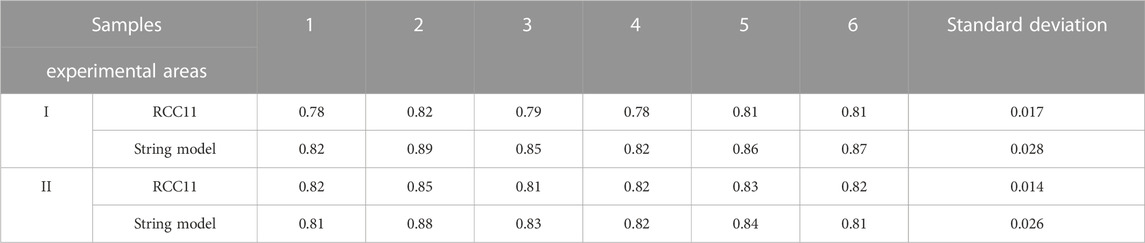
TABLE 10. Standard deviation based on RCC11 and String of each data in experimental area I and II.
A single spatial relationship was used as a constraint to carry out the matching experiment on each hand-drawn sketch. The following six spatial relationships, as well as the nine expression models, were analyzed. Table 11 shows a summary of their average matching rates in experimental areas I and II:
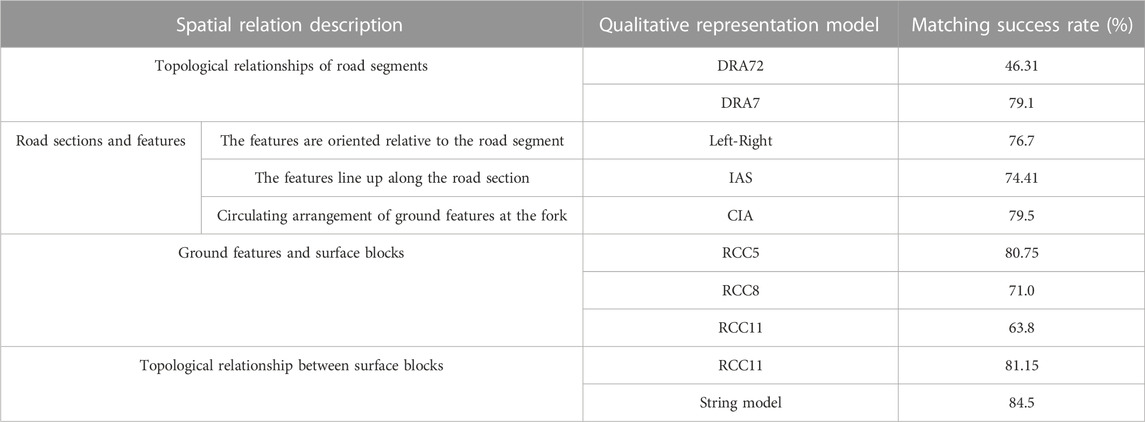
TABLE 11. Statistical table of the average matching rate of different spatial relations.
4.3 Hierarchical matching of multi-constraint relations
To improve the credibility of the matching result in practical applications, we did not select only one constraint relation for matching and instead usually used two or more spatial relations as constraints for the matching process.
Before selecting two or more spatial relationships for matching, the characteristics of the experimental area were analyzed. For experimental area I, near the south gate of the university, the road network relationship is complex and the road structure is irregular. Therefore, the topological relationship of the road segments was the main constraint condition for matching. For experimental area II, the student dormitory area, which mainly expresses the relative position relationship of the dormitory group, the road is relatively regular. Therefore, the relative order relationship between ground features and road sections and the topological relationship between ground features and regional surface blocks were selected as the main constraint conditions for matching.
To apply multiple spatial relations in the matching process, this study adopted the hierarchical method for matching; that is, multiple spatial relations were matched in turn.
Based on road segment priority matching, the left-right symmetric model was first used to match the adjacent ground features of adjacent road segments, and the selection of the best matching ground features was helpful in refining the topological relationship of streets. Then, the DRA7 model was used to strengthen the topological relationship of the road segments, and the road segments with the highest matching rate were identified as the basis for the next matching. Finally, according to the selected optimal and correctly matched road segments, the linear sequence of ground features along the road segment or the cyclic sequence of ground features at the fork could be matched. In this step, the relative positioning of the ground features could be performed to find the relatively correctly matched ground features. Matching process based on road is shown in Figure 10. And matching rate based on road segment matching process is shown in Table 12.

FIGURE 10. Street segment priority matching diagrams.
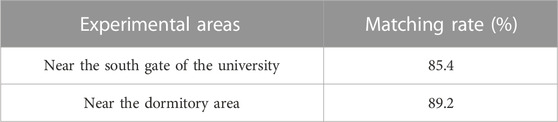
TABLE 12. Matching rate based on road segment matching process.
Based on the matching between ground objects and regional surface blocks, the RCC11 model had a good matching rate for the topological relationship between ground objects and the regional surface under a single constraint relationship. Therefore, basic matching could be performed based on the RCC11 model. First, the ground object with the highest matching rate was identified as the basis for the next matching. Then, the RCC5 model was used to match the regional surface blocks. Finally, the linear sequence relationship between ground objects and road segments and the cyclic sequence relationship at fork points were used for matching.
The above matching process involved four kinds of spatial relations to match in turn as constraint conditions, and each step selected the spatial object correctly matched in the previous step as the basis. Based on the matching process of landmark and city block priority is shown in Figure 11. The matching rate and algorithm complexity were further used to evaluate the matching process, as shown in Table 13.
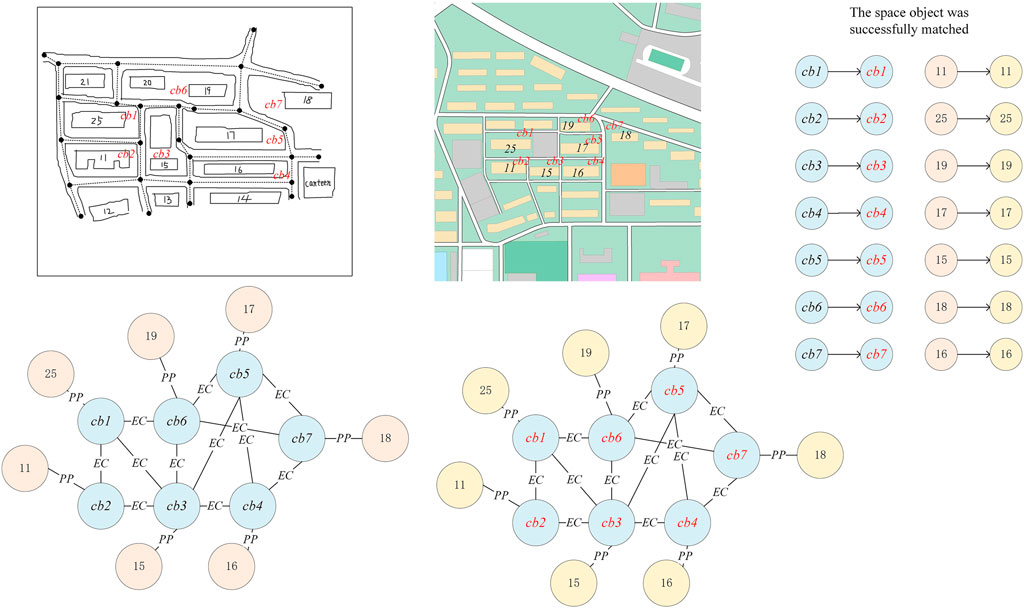
FIGURE 11. Landmark and city block priority matching diagrams.

TABLE 13. Matching rate based on the matching process between ground objects and regional surface blocks.
5 Conclusion
In this paper, the matching method of hand-drawn sketches and vector mapping was investigated. The characteristics and expression models of spatial relations under different dynamics are summarized from the perspective of cognitive distortion characteristics of hand-sketched sketches and the features of extracted spatial objects. According to the expression characteristics of spatial relations in the figures, the global and local spatial relation matrices were designed, and the dimension and quality of the local spatial relation matrix were evaluated, providing a search space for the matching method. Finally, according to the actual application of this study, the heuristic optimization (TS) algorithm was improved and applied in a number of matching experiments. The search process is optimized by obtaining the optimal initial solution through two matching processes. Based on the improved adjacency matrix, an adaptive function is designed to calculate the conflict number. The smaller the function value is, the better the matching sequence is. The results not only realized the matching between hand-drawn sketching and vector mapping, but also verified the effectiveness of the matching method. The disadvantage of this paper is that it only studies the matching of hand-drawn sketches and vector graphics when the sketches are more realistic, and does not specifically compare it with the existing technology, which will be the topic we will study next.
Data availability statement
The data analyzed in this study is subject to the following licenses/restrictions: The raw data supporting the conclusion of this article will be made available by the authors, without undue reservation. Requests to access these datasets should be directed to yflu@sdut.edu.cn.
Author contributions
Conceptualization, YuL; data curation, YaL and KY; methodology, YuL and ZF; project administration, YuL and YW; supervision, SaL and SS; writing—original draft, YS, SuL, and JL; writing—review and editing, YuL, YW, and ZF. All authors have read and agreed to the published version of the manuscript.
Funding
This research was funded by the Major Project of High Resolution Earth Observation System of China (No. GFZX0404130304); the Open Fund of Hunan Provincial Key Laboratory of Geo-Information Engineering in Surveying, Mapping and Remote Sensing, Hunan University of Science and Technology (No. E22201); a grant from State Key Laboratory of Resources and Environmental Information System; the Innovation Capability Improvement Project of Scientific and Technological Small and Medium-sized Enterprises in Shandong Province of China (No. 2021TSGC1056).
Acknowledgments
The authors are grateful to the editors and the referees for their valuable comments and suggestions.
Conflict of interest
Authors SuL and SS were employed by Guojiao Spatial Information Technology (Beijing) Co., Ltd. and Zhongzhi Software Technology Company Limited.
The remaining authors declare that the research was conducted in the absence of any commercial or financial relationships that could be construed as a potential conflict of interest.
Publisher’s note
All claims expressed in this article are solely those of the authors and do not necessarily represent those of their affiliated organizations, or those of the publisher, the editors and the reviewers. Any product that may be evaluated in this article, or claim that may be made by its manufacturer, is not guaranteed or endorsed by the publisher.
References
Aomar, O. (1999). “Introduction to reasoning about cyclic intervals,” in Proceedings of the International Conference on Industrial and Engineering Applications of Artificial Intelligence and Expert Systems: Multiple Approaches To Intelligent Systems, New Orleans, LA, USA, September 1999.
Chen, Y. (2000). Map spatial cognition theory research. Zhengzhou Information Engineering University. Zhengzhou, China.
Chipofya, M. (2016). “Matching qualitative constraint networks with online reinforcement learning,” in Proceedings of the 2nd Global Conference on Artificial Intelligence, Berlin, Germany, October 2016.
Clementini, E., Di Felice, P., and Van Oosterom, P. (1993). “A small set of formal topological relationships suitable for end-user interaction,” in Proceedings of the International Symposium on Advances in Spatial Databases, Singapore, June 1993.
Wenzheng, C.(2015). Consistent cuts of RCC8 and cutting algorithms. Comput. Eng. Appl. 51 (1), 143–150.
Dondi, R., Mauri, G., and Zoppis, I. (2020). “Complexity issues of string to graph approximate matching,” in language and automata theory and applications. LATA 2020. Editors A. Leporati, C. Martín-Vide, D. Shapira, and C. Zandron (Midtown Manhattan, NY, USA: Springer Cham), 12038.
Gao, J. (2004). Cartographic tetrahedron: Explanation of cartography in the digital era. Acta Geod. Cartogr. Sinica. 33 (1), 6–11.
Gao, J. (2012). Cartography tracking: Papers of academician Gao jun. Beijing, China: Serveying & Mapping Publishing House.
Gao, J. (1992). “Map cognition and cognitive cartography,” in Proceedings of the 4th Seminar on Cartography Theory and Method. Sinomaps, Cape Town, South Africa, August 1992.
Hou, J., Yuan, Y., He, Z., and Schwertfeger, S. (2022). Matching maps based on the area graph. Intel. Serv. Robot. 15, 69–94. doi:10.1007/s11370-021-00392-5
Hu, Y., Wang, W., and Yu, Y. (2022). Graph matching beyond perfectly-overlapping Erdős–Rényi random graphs. Stat. Comput. 32, 19. doi:10.1007/s11222-022-10079-1
Jan, S., Schwering, A., Schultz, C., and Chipofya, M. C. (2017). Cognitively plausible representations for the alignment of sketch and geo-referenced maps. J. Spat. Inf. Sci. 14, 31–59.
Jan, Sahib, Schultz, Carl, Schwering, Angela, and Chipofya, Malumbo (2015). “Spatial rules for capturing qualitatively equivalent configurations in sketch maps,” in Proceedings of the Workshop on Logics for Qualitative Modelling & Reasoning, Łódź, Poland, September 2015. doi:10.15439/2015F372
Kettunen, P., Putto, K., Gyselinck, V., Christina, M., and Sarjakoski, L. T. (2015). “Perception and recall of landmarks for personal navigation in nature at night versus day,” in Modern trends in cartography (Midtown Manhattan, NY, USA: Springer cham), 281–301.
Moratz, Reinhard, and Ragni, Marco (2008). Qualitative spatial reasoning about relative point position. J. Vis. Lang. Comput. 19 (1), 75–98. doi:10.1016/j.jvlc.2006.11.001
Oliver Wallgrün, J., Diedrich, W., and Richter, K. (2010). “Qualitative matching of spatial information,” in Proceedings of the ACM Sigspatial International Symposium on Advances in Geographic Information Systems, San Jose, CA, USA, November 2010.
Randell, D. A., Cui, Z., and Cohn, A. G. (1992). “An interval logic for space based on "connection",” in Proceedings of the European Conference on Artificial Intelligence, Vienna, Austria, August 1992.
Rovine, M. J., and Weisman, G. D. (1989). Sketch-map variables as predictors of way-finding performance. J. Environ. Psychol. 9 (3), 217–232. doi:10.1016/s0272-4944(89)80036-2
Schwering, A., Wang, J., Chipofya, M., Jan, S., Li, R., and Broelemann, K. (2014). SketchMapia: Qualitative representations for the alignment of sketch and metric maps. Spatial Cognition Comput. 14, 220–254. doi:10.1080/13875868.2014.917378
Schwering, A., and Wang, J. (2010). “SketchMapia–A framework for qualitative mapping of sketch maps and metric maps,” in Proceedings of the Las Navas Anniversary Meeting on Cognitive and Linguistic Aspects of Geographic Space, Las Navas, Spain, July 2010.
Son, A. (2005). The measurement of tourist destination image: Applying a sketch map technique. Int. J. Tour. Res. 7 (4-5), 279–294. doi:10.1002/jtr.532
Tu Huynh, N., and Sean, T. (2007). Digital sketch-map drawing as an instrument to collect data about spatial cognition. Cartogr. Int. J. Geogr. Inf. Geovisualization 42 (4), 285–296. doi:10.3138/carto.42.4.285
Wang, J., and Schwering, A. (2015). Invariant spatial information in sketch maps—A study of survey sketch maps of urban areas. J. Spatial Inf. Sci. 2015 (11).
Wang, J., and Schwering, A. (2009). “The accuracy of sketched spatial relations: How cognitive errors affect sketch representation,” in Proceedings of the Conference on Spatial Information Theory, Aber Wrac'h, France, July 2009.
Ying, X. (2003). Study on topological spatial relationship and spatial reasoning in geographic information system. Chongqing ,China: Chongqing University.
Yu, T., Yan, J., Liu, W., and Li, B. (2018). “Incremental multi-graph matching via diversity and randomness based graph clustering,” in Computer vision – ECCV 2018 lecture notes in computer science. Editors V. Ferrari, M. Hebert, C. Sminchisescu, and Y. Weiss (Midtown Manhattan, NY, USA: Springer Cham), 11217.
Ali, Z., and Shahbazi, M. (2020). Sketch maps for searching in spatial data. Trans. GIS 24, 780–808. doi:10.1111/tgis.12619
Zare Zardiny, A., and Hakimpour, F. (2021). Route matching in sketch and metric maps. J. Geogr. Syst. 23, 381–405. doi:10.1007/s10109-020-00343-1
Zhan, Y., Zhao, X., Lin, X., Liu, J., Liu, M., and Niu, D. (2020). Graph matching based on local and global information of the graph nodes. Multimed. Tools Appl. 79, 11567–11590. doi:10.1007/s11042-019-08516-x
Keywords: topological characteristics, qualitative spatial relation, hand sketching, vector map, matching
Citation: Lu Y, Sun Y, Liu S, Li J, Liu Y, Yao K, Wang Y, Fu Z, Lu S and Shao S (2023) Hand-drawn sketch and vector map matching based on topological features. Front. Earth Sci. 11:1081445. doi: 10.3389/feart.2023.1081445
Received: 27 October 2022; Accepted: 13 January 2023;
Published: 26 January 2023.
Edited by:
Wen Luo, Nanjing Normal University, ChinaReviewed by:
Yuanwei Yang, Yangtze University, ChinaÖMER EREM, Istanbul Technical University, Türkiye
Copyright © 2023 Lu, Sun, Liu, Li, Liu, Yao, Wang, Fu, Lu and Shao. This is an open-access article distributed under the terms of the Creative Commons Attribution License (CC BY). The use, distribution or reproduction in other forums is permitted, provided the original author(s) and the copyright owner(s) are credited and that the original publication in this journal is cited, in accordance with accepted academic practice. No use, distribution or reproduction is permitted which does not comply with these terms.
*Correspondence: Yuefeng Lu, eWZsdUBzZHV0LmVkdS5jbg==; Shiwei Shao, c2hhb3NoaXdlaUAxNjMuY29t
†These authors have contributed equally to this work and share first authorship