 Boyuan Zhang1
 Yongli He
 Shanshan Wang
 Xiaodan Guan
- 1Key Laboratory for Semi-Arid Climate Change of the Ministry of Education, College of Atmospheric Sciences, Lanzhou University, Lanzhou, Gansu, China
- 2Collaborative Innovation Center for Western Ecological Safety, Lanzhou, China
On the Tibetan Plateau (TP), precipitation intensity has shifted to heavy precipitation due to global warming. However, the influence of the precipitation recycling process on this phenomenon remains unknown. Using the Water Accounting Model-2layers (WAM2layers) model and ERA5 reanalysis, this study investigates the contributions of the precipitation recycling process to precipitation shifts over the TP during 1979–2019. The precipitation shift rate was proposed to quantify this process, and the results reveal that the positive precipitation shift (1.384 mm/41 years) over the TP consists of a positive shift over the western TP (5.666 mm/41 years) and a negative shift (−3.485 mm/41 years) over the eastern TP. Considering the source of moisture, either a local source or a remote source, precipitation was decomposed into internal and external cycles of the precipitation recycling process based on the WAM2layers model. Further analysis indicates that the internal cycle (87.2%) contributes more to the shift than the external cycle (12.8%) over the TP. The contributions of the precipitation recycling ratio (PRR) and precipitation amount to the precipitation shift rate induced by the internal cycle were further investigated. The results indicate that PRR changes contribute more to heavy precipitation over the TP, while precipitation amount changes contribute more to light precipitation. The precipitation recycling process contributes to the shift by increasing atmospheric moisture and increasing (decreasing) the dependency on local evaporation in heavy (light) precipitation. Increased dependence of heavy precipitation on evaporation increases the risk of extreme precipitation, and the government should take preventative actions to mitigate these adverse effects.
1 Introduction
Through the thermal and dynamic effects of high-elevation terrain, the Tibetan Plateau (TP), also known as the “Asian Water Tower” (Immerzeel et al., 2010; Cuo and Zhang, 2017; Immerzeel et al., 2020), greatly affects the water cycle and climate changes over Asia (Xu et al., 2008). Over the past few decades, the TP has experienced enhanced warming (Liu and Chen, 2000; Guo and Wang, 2012; Yan et al., 2020), which has resulted in a number of hydrological changes, such as dramatic lake expansion (Zhang et al., 2017; Brun et al., 2020), glacier melting (Yao et al., 2012; Dehecq et al., 2018; Yao et al., 2022), more intense precipitation (Xiong et al., 2019; Sun et al., 2021), less light precipitation (Ayantobo et al., 2022), and intensified precipitation recycling processes (An et al., 2017; He et al., 2021). The phenomenon of the shift toward heavy precipitation over the TP has been found (Tang et al., 2022) and is anticipated to continue into the foreseeable future as the risk of extreme precipitation rises (Na et al., 2021). According to the Clausius-Clapeyron (C-C) equation, atmospheric warming could raise the total column water vapor (TCWV) (O’Gorman and Muller, 2010; Wang et al., 2017; Nayak and Takemi, 2019), which could enhance the precipitation intensities and transform light precipitation to heavy precipitation. He et al. (2021) investigated the influence of precipitation recycling process on the variation of TCWV by dividing the precipitation recycling process into internal cycle and external cycle, corresponding to the precipitation from local evapotranspiration and the outside of this region, respectively. They found that the internal cycle of precipitation recycling process contributes more to the growth of TCWV than external cycle. The precipitation recycling process was significantly accelerated over the TP between 1979 and 2019, particularly in the western TP, where lake expansion contributes to increased evaporation. On the other hand, there has been a substantial decline in the amount of moisture transported from the Indian Ocean to the eastern TP, resulting in less precipitation. Therefore, how the precipitation recycling process influences the change in precipitation intensity deserves further investigation.
The precipitation recycling ratio (PRR), an indicator of the precipitation recycling process, has been investigated over the TP by different methods (Zhao and Zhou, 2021). For example, Kurita and Yamada. (2008) used isotopic analysis to investigate the PRR for a precipitation event over the central TP and found that the PRR may range from 30% to 80%. However, this method is unrealistic for large areas and long temporal ranges. Therefore, some researchers have used different statistical diagnosed PRR models (dynamic recycling model (DRM) or water accounting model-2layers (WAM2layers)) to investigate the interannual variability of PRR and find the PRR increase over the TP (Zhang, 2020; He et al., 2021), although these methods may ignore the effect of subgrid processes on PRR. The WRF-WVT (water vapor tracers) model may be better for the analysis of subgrid processes due to its high resolution (Gao et al., 2020). However, this tracer model is unsuitable for long periods over the TP due to the computationally intensive nature of high-resolution simulations; hence, statistically diagnosed PRR models are preferable to WRF-WVT simulations.
Due to the effect of different climate systems (Ma et al., 2018), PRR are varied over different parts of TP (Yang et al., 2022). For example, the southern TP and northern TP are affected by the Indian monsoon system and midlatitude westerlies, with PRRs of approximately 11.9% and 12.9%, respectively (Zhang et al., 2019). For the eastern TP, which is influenced by East Asian monsoon system, the PRR is around 10% (Sun and Wang, 2014). For the north east of TP, the PRR is about 5.7%–6.1%, which indicates that the recycled moisture accounted for 5.7%–6.1% of the precipitation (Guo et al., 2022). For the central TP, the PRR may rose to over 80% in August, indicating that most of the precipitation was recycled via local evapotranspiration in the summer (Gao et al., 2020). For the whole TP, the PRR is about 23% in the summer (Zhao and Zhou, 2021; Yang et al., 2022) reveal that the PRR should be no more than 40%. Although previous studies investigate PRR sufficiently over different parts of TP, it is unknown the effect of precipitation recycling process to the variations in precipitation intensity and the transition between different precipitation types over different parts of TP under significant hydrological changes. The transition between precipitation types is the transfer of precipitation amount from light to heavy precipitation or from heavy to light precipitation. Ma et al. (2020) indicated that precipitation recycling should not be ignored for extreme precipitation in the summer over the TP. Therefore, how the precipitation recycling process influence the transition of precipitation deserve further investigation.
The following topics are discussed in this study: 1) How can the transition rates between light and heavy precipitation be measured? 2) To what extent does the change in precipitation intensity depend on the internal and external cycles of the precipitation recycling process? 3) Does the change in internal cycles of precipitation depend more on PRR or precipitation amount? 4) Why do light precipitation and heavy precipitation respond differently to the increasing water vapor?
2 Data and methods
2.1 Reanalysis data
This study employed the European Centre for Medium-Range Weather Forecasts (ECMWF) reanalysis (ERA5) dataset, which spans the years 1979–2019 and has a horizontal resolution of 0.25°×0.25° (Hersbach et al., 2020). The ERA5 single level data and pressure levels data were used as the input to the Water Accounting Model-2layers (WAM2layers) models. The ERA5 single-level data include the 6-hourly surface pressure, total column water vapor and a set of vertically integrated moisture and flux variables (vertically integrated northward/eastward water fluxes in the forms of vapor, liquid, and ice). The hourly precipitation and evapotranspiration from ERA5 single-level data were also used as the input to the WAM2layers models. The ERA5 pressure level data include 6-hourly zonal wind, meridional wind and specific humidity at 16 pressure levels, which include 100, 200, 300, 400, 500, 600, 700, 800, 825, 850, 875, 900, 925, 950, 975, and 1,000 hPa. The surface temperature, convective precipitation and large-scale precipitation are also used to investigate the mechanism of the precipitation shift process. ERA5 has been compared to other reanalysis datasets, such as Modern-Era Retrospective Analysis for Research and Applications, version 2 (MERRA2) and High Asia Refined analysis version 2 (HARv2) and it has been shown that ERA5 outperforms other reanalysis datasets for long-term trends and can reasonably reflect the summer water vapor characteristics over the TP (He et al., 2021; Yuan et al., 2021). For further information about the selection of ERA5 dataset, please see the description of Figure 1 in He et al. (2021).
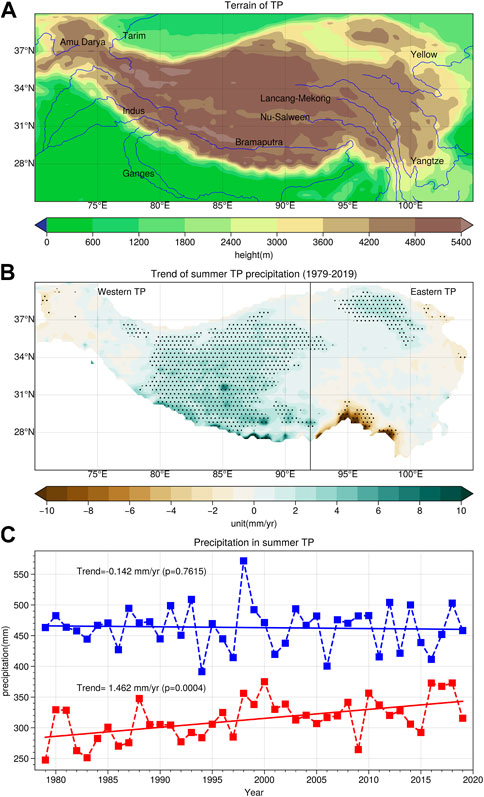
FIGURE 1. The spatial distribution and timeseries of precipitation over the TP and the terrain of the TP. In (A) the terrain and major rivers of the TP. In (B) the trend map of total precipitation in summer (June to August) over the TP during 1979–2019. The dotted areas indicate statistical significance exceeding 95%. In (C) the time series of summer precipitation over the eastern TP (blue lines) and western TP (red lines), which are separated by 92°E.
2.2 Definition of the shift rate of the precipitation intensity
To evaluate the transition from light to heavy precipitation, a new index was developed to measure the rate of change in precipitation intensity. In this study, a precipitation event is defined as a day with at least 0.1 mm/day of precipitation each day (Sun et al., 2007; Ma et al., 2015). Following previous studies (Shiu et al., 2012; Yu et al., 2022), based on precipitation percentiles at each grid, daily precipitation at each grid over the TP was ranked from light to heavy precipitation for the period 1979–2019. Then, 40 intensity bins are divided by the 0, 2.5th, 5th, 7.5th … 97.5th and 100th percentiles of daily precipitation for each individual grid, which represent an intensity interval of precipitation amount. Finally, regionally averaged precipitation histograms were constructed based on 40 intensity bins. The total number of days with precipitation events was used to calculate precipitation frequency, the average precipitation intensity of those events was used to calculate precipitation intensity, and the cumulative precipitation within each intensity interval was used to determine the total precipitation amount for each intensity bin. The slope of the histogram distribution of the precipitation amount trend was used to quantify the rate of intensity shift by least-square linear regression. This rate illustrates the transition from light precipitation to heavy precipitation. A positive slope value indicates a decrease or a relatively smaller increase in light precipitation and an increase in heavy precipitation. The negative value of slope indicates an increase in light precipitation and a decrease in heavy precipitation. Consistent with a previous study (Ma et al., 2017), we classified daily precipitation into three primary categories to make it easier to detect geophysical changes: light precipitation (less than 35%), moderate precipitation (35%–90%), and heavy precipitation (more than 90%). Due to the fixed threshold for these categories of precipitation, this classification may generate some uncertainty, but the basic characteristics of the precipitation trend across 40 intensity bins could support the conclusion.
2.3 Water accounting model-2layers
The WAM2layers model is an updated version of the Water Accounting model, which was developed by van der Ent (Ent et al., 2014). In the original WAM2layers model, the input data are suitable for the European Center for Medium-Range Weather Forecasts interim reanalysis dataset (ERA-Interim), which has a resolution of 1.5°×1.5° (Ent et al., 2014). The time step for the original WAM2layers model is reduced to 15 min to keep the computation stable. However, considering the higher spatial resolution of ERA5, a smaller time step is needed to make the computation stable. Therefore, Xiao and Cui. (2021) modified the original WAM2layers model and reduced the time step to 10 min to fit the ERA5 data. Compared with the original model, we use the modified WAM2layers to calculate the PRR, which is derived from the moisture balance equation for atmospheric water vapor (Eq. 1; Ent et al., 2014).
where, as stated by Eq. 2,
where
where
The WAM2layers model can track the moisture in both forward and backward directions. Using the forward tracking approach, the PRR in each grid was calculated. In this case, the moisture from the target region evaporates
Because the atmosphere is not fully mixed, which will cause the uncertainty of WAM2layers, especially in regions with strong wind shear (Goessling and Reick, 2013), Ent et al., 2013 showed that the results of WAM2layers are similar to a detailed 3D model (Ent et al., 2013). Both the Euler and Lagrangian methods have uncertainties in moisture tracking, but the WAM2layers can track the real precipitation falling on the ground compared with the Lagrangian methods, which only track the moisture released in the air (Huang and Cui, 2015). Furthermore, WAM2layers can make the “tagged water” conserved (Zhang et al., 2017), which means all evaporated moisture can be tracked forward to the precipitation. In addition, the WAM2layers model has been used in a number of studies to examine wet and dry changes, trace the origin of moisture, and investigate the precipitation recycling process (Zhang et al., 2017; Guo et al., 2019; Zhang et al., 2019; Zhang, 2020; Li et al., 2022). Considering the above characteristics of the WAM2layers, the WAM2layers were suitable for calculating the precipitation recycling ratio (PRR).
2.4 Decomposition of internal precipitation
The internal precipitation can be regarded as the product of precipitation and PRR, as stated by Eq. 5.
where
where the overbar represents the climatology of these three variables and
where
3 Results
3.1 The shift in precipitation intensity
Before examining the variations in precipitation intensity, the slope and trend map of precipitation over the TP were analyzed (Figure 1). Due to geography, the Brahmaputra Grand Canyon in the eastern TP is the principal moisture channel (Figure 1A). However, the trend map indicates that the increasing trend of precipitation over the TP is dominated by the increasing trend over the western TP and Qaidam Basin (Figure 1B). The decrease in precipitation in the eastern TP, particularly over the Brahmaputra Grand Canyon, is associated with the weakening of external water vapor transportation. As described in a recent study (He et al., 2021), the water vapor flux over the southern boundary of the TP exhibits contrasting changes between western and eastern 92°E. Timeseries of precipitation over the western TP and eastern TP suggest that precipitation increases significantly over the western TP at a rate of 1.462 mm/year and decreases insignificantly over the eastern TP at a rate of −0.142 mm/year (Figure 1C). Therefore, this study investigates the effect of the precipitation recycling process on the change in precipitation over the TP, eastern TP and western TP separately.
Based on observations and simulations, a few studies have demonstrated that the intensity of precipitation is shifting from light to heavy precipitation (Na et al., 2021; Tang et al., 2022). Hence, the trends in different intensity bins of precipitation are investigated over the TP, eastern TP and western TP. For the TP and western TP, precipitation intensity shows negative trends for intensity percentile bins below the 35th percentile and positive trends above the 35th percentile (Figures 2A, C). The most significant changes are found for percentiles between the 35th and 90th percentiles over the TP and western TP. For precipitation intensity percentile bins below the 35th percentile, the decreasing trends are significant over the western TP but not significant over the TP. The magnitude of the decreasing trend is much smaller than the increasing trend. For precipitation intensity bins above the 90th percentile, remarkable increasing trends are found over the TP and western TP, albeit they do not reach statistical significance over the TP. Precipitation intensity over the eastern TP increases below the 35th percentile and decreases above the 90th percentile, which is in contrast with the western TP (Figures 2C, E). The most significant increase is found between the 35th and 65th percentiles in the eastern TP. The increasing trends of percentiles below the 35th percentile are close to zero and do not pass the significance test. Over the eastern TP, precipitation decreases obviously above the 90th percentile. For example, heavy precipitation decreases by almost 0.4 mm/year.
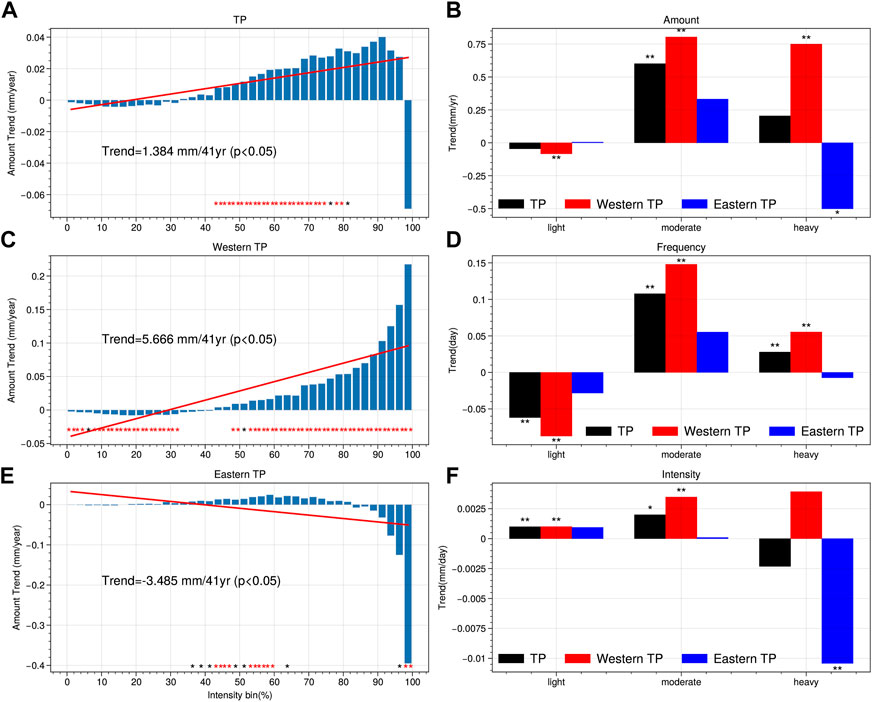
FIGURE 2. Distribution of trends in precipitation percentile intensity bins and precipitation characteristics for different categories of precipitation intensity during the summer of 1979–2019. In (A,C,E), linear trend (blue bars) of precipitation amount in the summer as a function of 40 precipitation percentile intensity bins during 1979–2019 averaged over the TP (A), western TP (C), and eastern TP (E). The red lines indicate the shift rates of precipitation intensity. In (B,D,F), linear trends of the amount (B), frequency (D) and intensity (F) of light precipitation, moderate precipitation, and heavy precipitation over the TP (black bars), western TP (red bars) and eastern TP (blue bars). The double stars and red stars indicate statistical significance exceeding 95%, and the single star and black star indicate statistical significance exceeding 90%.
To quantify the transition toward heavy precipitation, the rate of change in precipitation intensity was calculated (method details of the calculation of this index are described in Section 2.1). The shift rate for the entire TP is positive, with a rate of 1.384 mm/41 years (Figure 2A). This indicates that the precipitation intensity will transition 1.384 mm from light precipitation to heavy precipitation at the end of the 41-year record. The shift rate over the western TP is similar to that over the whole TP but with larger magnitudes, with rates of 5.666 mm/41 years (Figure 2C). In contrast to the TP and western TP, the eastern TP has a negative shift rate of −3.485 mm/41 years. The negative shift rate implies that heavy precipitation will decline over the eastern TP. Considering the consistent shift rates throughout the entire TP and the western TP, the western TP is more responsible for the shift in precipitation intensity over the TP than the eastern TP.
In this study, light, moderate and heavy precipitation are classified according to the precipitation histogram over the TP to enable discussion about precipitation features. The trends of precipitation amount, frequency, and intensity for light, moderate, and heavy precipitation were examined to better understand the characteristics of the change in precipitation intensity. The frequency of light precipitation is decreasing over the TP, western TP and eastern TP, whereas the frequency of moderate and heavy precipitation is increasing (Figure 2D). This tendency is consistent with the changes in precipitation amount (Figure 2B). The intensities all exhibit an increasing trend except for the eastern TP (Figure 2F), which is primarily caused by the decline in water vapor transfer from the Indian Ocean.
3.2 Quantifying the influence of the precipitation recycling process on the precipitation shift
A recent study indicated that the precipitation recycling process has a significant impact on the summertime water vapor over the TP (He et al., 2021). Therefore, the spatial-temporal distribution of total precipitation and the internal and external cycles of the precipitation recycling process for the three types of precipitation were further examined to determine the effect of the precipitation recycling process on the precipitation shift (Figures 3, 4). The results indicate that moderate precipitation and heavy precipitation dominate the precipitation over the western TP and eastern TP and that moderate precipitation contributes more than heavy precipitation (Figure 3). More specifically, the amount of moderate precipitation is approximately 150–250 mm/year and 250–350 mm/year over the western TP and eastern TP, respectively, and the amount of heavy precipitation is approximately 80–140 mm/year and 100–250 mm/year over the western TP and eastern TP, respectively (Figures 3D, E, G, H). Light precipitation contributes no more than 30 mm/year and 45 mm/year over the western TP and eastern TP, respectively (Figures 3A, B).The internal and external cycles both significantly influence the tendency of light precipitation to significantly decrease over the western TP. The internal cycle of precipitation greatly increases the amount of moderate and heavy precipitation over the western TP rather than over the eastern TP. In contrast, the external cycle of precipitation recycling causes a significant increase in moderate and heavy precipitation over the western TP and a substantial decrease over the eastern TP (Figures 3C, F, I; Figures 4G–I). The opposite influence of the external cycle results in a weak and insignificant impact on heavy precipitation over the TP. Further investigation of the spatial distribution of the three types of total precipitation and the internal and external cycles of the precipitation recycling process exhibits consistent results with Figure 3, except for the northern part and southern part of the eastern TP (Figures 4G–I). Specifically, the increase in light precipitation consists of an increase over the southern part of the eastern TP and a decrease over the northern part of the eastern TP (Figure 4A). The internal cycle contributes to a general increase in light precipitation over the eastern TP, and the external cycle contributes to a slight increase in light precipitation over the eastern TP (Figure 3C). For moderate precipitation, internal and external cycles of precipitation both contribute to the increase in moderate precipitation over the eastern TP. The heavy precipitation is opposite to the increase in light precipitation, and the decrease in heavy precipitation is composed of an increase over the northern part of the eastern TP and a decrease over the southern part of the eastern TP (Figure 4C). The internal cycle precipitation generally contributes to the increase in heavy precipitation over the eastern TP, but the external cycle exhibits a spatial distribution similar to that of heavy precipitation.
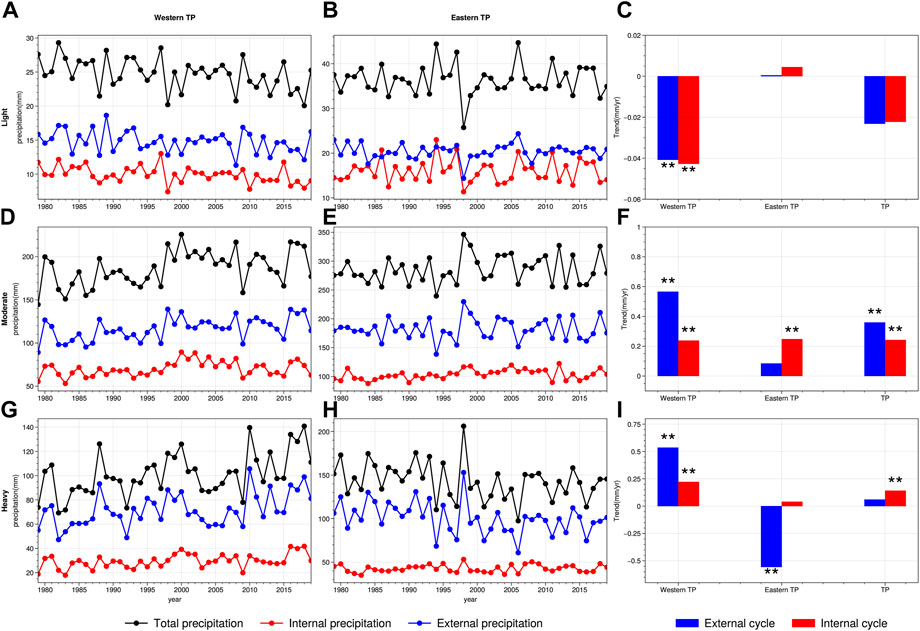
FIGURE 3. Time series of summer (June-August) total precipitation, external cycle precipitation and internal cycle precipitation and its corresponding trend. Black, red, and blue lines represent the total precipitation, internal cycle precipitation and external precipitation, respectively, for light (A,B), moderate (D,E) and heavy (G,H) precipitation over the western (left column) and eastern (middle column) TP. Blue bars and red bars in (C,F,I) represent the trends of the precipitation amount associated with the external cycle and internal cycle over the western TP, eastern TP and TP, respectively. The stars indicate statistical significance exceeding 95%.
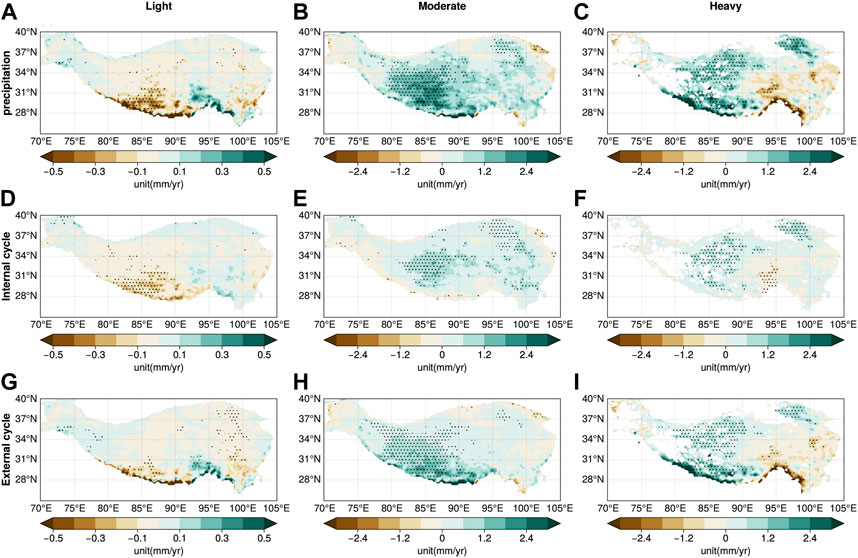
FIGURE 4. The trend map of total precipitation (A–C), precipitation associated with internal (D–F) and external (G–I) cycles for light (left column), moderate (middle column) and heavy precipitation (right column) over the TP. The dotted areas indicate statistical significance exceeding 95%.
To investigate the change in the internal and external cycles of the precipitation recycling process to the shift in precipitation intensity, the histogram of the trend in internal precipitation and external precipitation is calculated for the TP, western TP and eastern TP (Figure 5). The histogram of internal precipitation and external precipitation is similar to the histogram of total precipitation over the western TP and TP (Figures 5A–D). Both internal precipitation and external precipitation show obvious increasing trends above the 35th percentile, while they decrease below the 35th percentile over the TP and western TP. The magnitude of the decreasing trend is smaller than the magnitude of the increasing trend. However, for the eastern TP, the histograms of internal precipitation and external precipitation show contrasting distributions (Figures 5E, F). The internal precipitation increases across all percentile bins (Figure 5E). However, external precipitation increases slightly below the 80th percentile, which does not exceed the significance test, and decreases above the 80th percentile, especially above the 90th percentile.
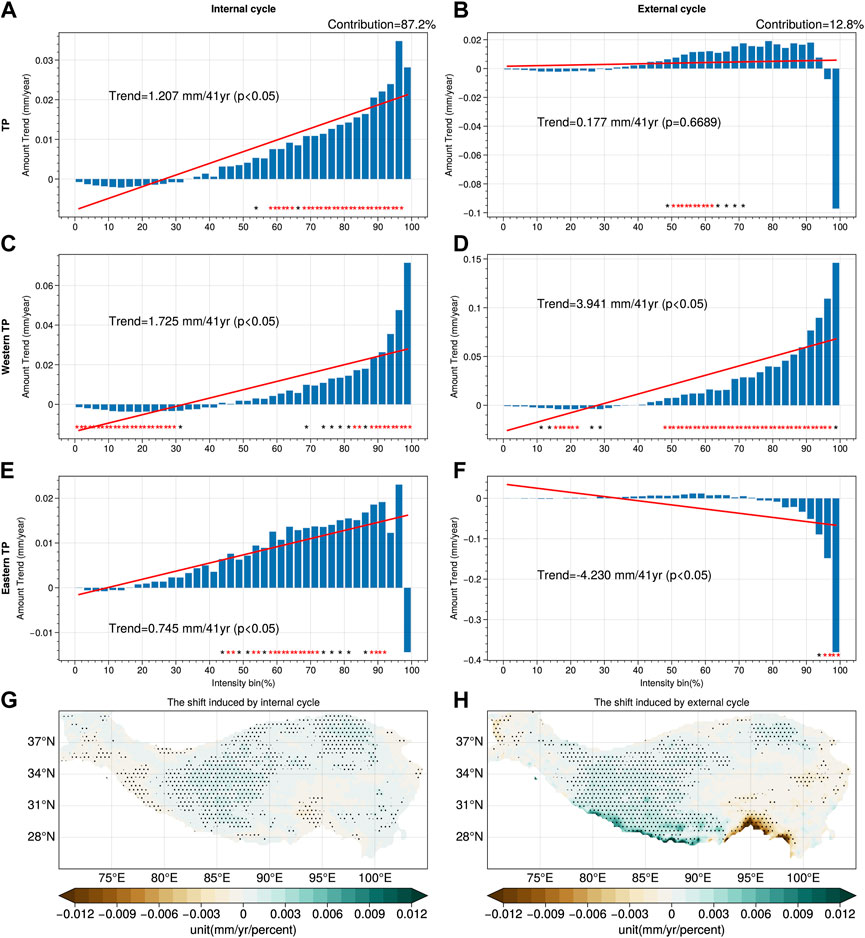
FIGURE 5. Distribution of precipitation trends in precipitation percentile intensity bins of precipitation and the spatial distribution of shift rates during the summer of 1979–2019 averaged over the TP. In (A–F), linear trend (blue bars) in precipitation associated with internal (left column) and external (right column) cycles as a function of 40 precipitation percentile intensity bins over the TP (A,B), western TP (C,D), and eastern TP (E,F). The red lines indicate the shift rates of precipitation intensity. In g and h, the trend map of the shift rate of precipitation intensity induced by the internal (G) and external (H) cycles on the TP. The dotted areas and red stars indicate statistical significance exceeding 95%. The black stars indicate statistical significance exceeding 90%.
Subsequently, to quantify the relative contribution of the internal and external cycles of the precipitation recycling process to the shift in precipitation intensity, the shift rate index is further calculated for the TP, western TP and eastern TP (Figure 5). The contribution was calculated by dividing the shift rate induced by internal and external cycles to the shift rate in total. This result suggests that the shift rate induced by the internal cycle is 1.207 mm/41 years (∼87.2%) and contributes more to the shift in precipitation intensity than the external cycle, which shifts at a rate of 0.177 mm/41 years (∼12.8%) (Figures 5A, B). Contribution was determined by dividing the shift rate of the internal or external cycle by the shift rate of precipitation. The shift rates of the internal cycle over the western TP and eastern TP show similar TP trends, with rates of 1.725 mm/41 years and 0.745 mm/41 years, respectively. However, the shift rates of the external cycle over the western TP and eastern TP are opposite, with rates of 3.941 mm/41 years and −4.23 mm/41 years, respectively.
Since the map of the precipitation intensity shift rate is more informative and crucial for authorities, the spatial distribution of the shift rate associated with the internal cycle and external cycles are further investigated in Figures 5G, H. The results show that the internal cycle strongly influences the shift in precipitation intensity over the western TP and the Qaidam Basin, while the shift rate generated by the external cycle increases west of the southern boundary but decreases east of the southern boundary (Figures 5G, H). The spatial maps of shift rates are consistent with the changes in light, moderate and heavy precipitation associated with internal cycle precipitation and external cycle precipitation (Figures 4D–I).
3.3 The dominant factor in the variation in internal precipitation
Considering the non-negligible contribution of internal precipitation to the shift in precipitation over the TP, western TP and eastern TP, the factors that affect the change in internal precipitation are further examined. As Section 2.4 states, the internal precipitation can be decomposed into the PRR term and precipitation term based on Eq. 5. Therefore, it is essential to comprehend the contribution of PRR and precipitation as a function of precipitation intensity to understand the change in internal precipitation under global warming.
The results suggest that the PRR term contributes more to heavy precipitation than to light precipitation (Figures 6, 7). For precipitation percentile bins above the 90th percentile, the PRR term and precipitation term both contribute to the increase in internal precipitation, and the magnitude of the PRR term exceeds the magnitude of the precipitation term over the TP (Figures 6A, B). More specifically, the PRR term contributes much more in the high percentile than in the low percentile, which indicates that the PRR term promotes the increase in heavy precipitation. For precipitation percentile bins between the 35th percentile and 90th percentile, the PRR term and precipitation term exhibit opposite contributions to the increase in internal precipitation over the TP. However, internal precipitation is more affected by the precipitation term since its magnitude is larger than that of the PRR term. For precipitation percentiles below the 35th percentile, both the PRR term and precipitation term cause a decrease in internal precipitation over the TP. For the western TP, the PRR term decreases across all precipitation intensity bins (Figure 7A), and the precipitation term decreases below the 35th percentile bins and increases above the 35th percentile bins (Figure 7B). Considering the magnitude of the PRR term and precipitation term, the precipitation term dominates the change in internal precipitation over the western TP. For the eastern TP, the PRR term increases across all precipitation intensity bins, and the precipitation term increases below the 80th percentile and decreases above the 80th percentile. In summary, the precipitation term dominates the decrease in internal precipitation in light precipitation, while the PRR term dominates the increase in internal precipitation in heavy precipitation over the TP.
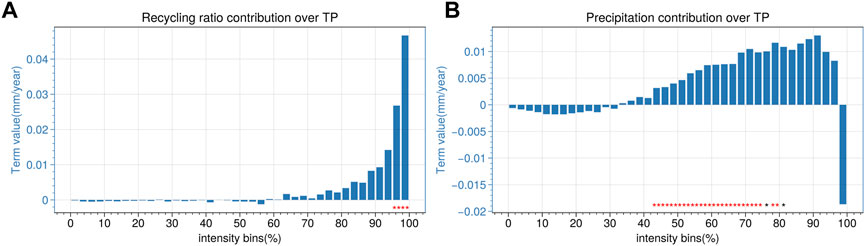
FIGURE 6. Decomposition of internal precipitation trends to the PRR and precipitation over the TP. In (A,B) histograms represent the contribution of PRR and precipitation to the internal precipitation over the TP. The red stars and black stars indicate statistical significance exceeding 95% and 90%, respectively.
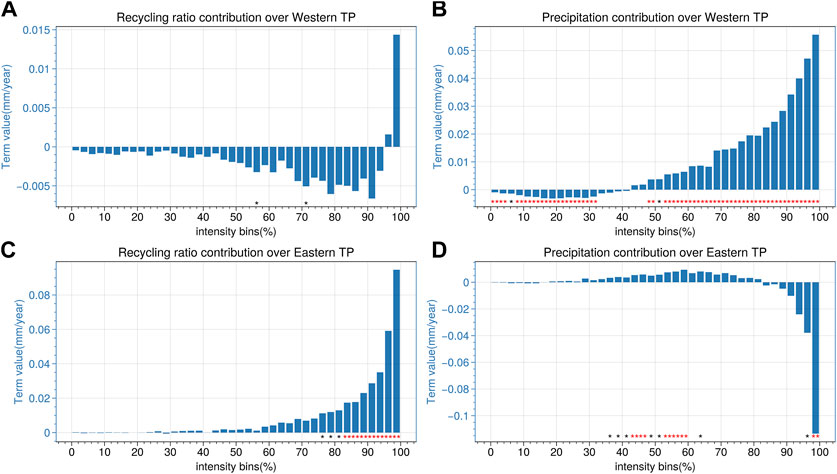
FIGURE 7. Decomposition of internal precipitation trends to the PRR and precipitation over the western TP and eastern TP. Linear trends of internal precipitation associated with PRR (A,C) and precipitation (B,D) over the western TP (A,B) and eastern TP (C,D). The red stars and black stars indicate statistical significance exceeding 95% and 90%, respectively.
3.4 Changes in the precipitation recycling process across precipitation intensity bins
In the summer, the average PRR over the TP is usually lower than 40% (Hua et al., 2015; Guo et al., 2018; Zhao and Zhou, 2021), showing that the internal cycle is far less than the external cycle. Non-etheless, the contribution of the internal cycle to the shift in precipitation intensity is larger than that of the external cycle. Therefore, it is essential to comprehend the variation in PRR as a function of the precipitation intensity to understand how the precipitation recycling process influences the shift.
Because surface temperature and evaporation are directly related to the precipitation recycling process (An et al., 2017), the linear trend of surface temperature and evaporation was evaluated as a function of precipitation intensity bins (Figures 8A, B). The result demonstrates that the surface temperature is increasing across all bins, with light precipitation experiencing the greatest increase. However, evaporation decreases with light precipitation and increases with moderate and heavy precipitation. The smaller increase in temperature during heavy precipitation can be partly explained by the evaporative cooling effect. The results also indicate that the precipitation recycling process weakens in light precipitation and strengthens in heavy precipitation, as shown in Figure 8C. More specifically, in the climatology of PRR, the climatological mean PRR of light precipitation (∼51%) is larger than that of heavy precipitation (∼35%), which indicates that the dependence of light precipitation on local evaporation is greater than that of heavy precipitation. However, the trend of PRR for light precipitation is negative, while it is positive for heavy precipitation, indicating that the dependence of light precipitation on local evaporation is decreasing, while the dependence of heavy precipitation is increasing (Figure 8C). Therefore, there exists an issue: why are the responses of light and heavy precipitation in contrast as the precipitation recycling process is strengthened?
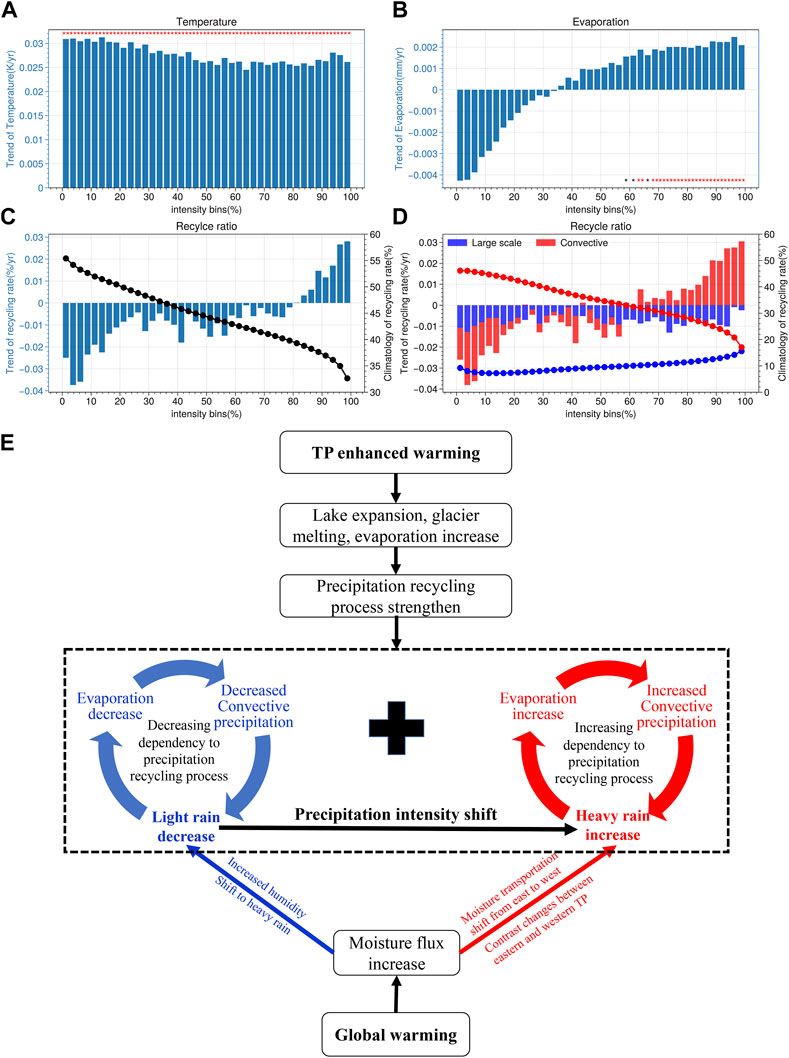
FIGURE 8. Distribution of trends (bars) in precipitation percentile intensity bins of temperature, evaporation, and recycling ratio during the summer of 1979–2019 over the TP and the schematic illustration. Bars show the linear trends of temperature (A), evaporation (B), precipitation recycling ratio (C) and precipitation recycling ratio corresponding to convective and large-scale precipitation (D). The black line in figure c shows the climatology of the precipitation recycling ratio. The red line and blue line in d show the climatology of the convective precipitation recycling ratio and large-scale precipitation recycling ratio, respectively. In (E) the schematic illustration of how precipitation recycling changes influence the shift of precipitation intensity over the TP. The red stars and black stars indicate statistical significance exceeding 95% and 90%, respectively.
To address this issue, convective and large-scale precipitation were separated from precipitation (more information is supplied in Supplementary Text S1). Convective precipitation has a larger PRR than large-scale precipitation and is a strong activator of the precipitation recycling process (Figure 8D). Consequently, Supplementary Figure S1 examines the influence of convective and large-scale precipitation on the shift in precipitation intensity. The results indicate that convective precipitation is more influential than large-scale precipitation on the shift. The trend of PRR for convective and large-scale precipitation over intensity bins (Figure 8D) reveals that convective precipitation has a consistent trend distribution in PRR with total precipitation, whereas large-scale precipitation does not differ significantly across intensity bins. More specifically, the large-scale precipitation PRR decreases across all intensity bins, and the convective precipitation PRR increases in heavy precipitation and decreases in light precipitation. Therefore, the changes in the PRR trend between light precipitation and heavy precipitation are mainly caused by convective precipitation.
4 Discussion
4.1 The mechanism of the precipitation recycling process influencing the shift to heavy precipitation
The mechanism responsible for the precipitation shift over the TP is summarized in the schematic diagram (Figure 8E). Global warming causes an increase in atmospheric moisture and water vapor flux around the TP, which leads to increasing humidity over the TP through the external cycle of the precipitation recycling process. As discussed in (He et al., 2021), the contrast trend between the western TP and eastern TP is positively correlated with the changes in moisture flux at the southern boundary. Moisture flux mainly flowing over the Brahmaputra Grand Canyon brought by the India Summer Monsoon (ISM) has declined (Bingyi, 2005; Zhao and Zhou, 2021). This has reduced the external cycle of heavy precipitation over the eastern TP. Due to the strengthening of the heating source (Xie and Wang, 2019) and the “up-and-over” process (Dong et al., 2016), the moisture flux near the southern boundary of the western TP is increasing (He et al., 2021). In addition, the enhanced warming over the TP has caused glacier melting, lake expansion and increasing evaporation, all of which promote the intensification of the precipitation recycling process. Increasing moisture induced by both the internal and external cycles would help the transition of light precipitation to heavy precipitation, resulting in a decrease in light precipitation and an increase in heavy precipitation.
Because precipitation dominates summer evapotranspiration over the TP (Wang et al., 2018; Ma and Zhang, 2022), decreased light precipitation and increased heavy precipitation would result in a different response to the precipitation recycling process. Positive feedback is formed when a decrease in light precipitation leads to a decrease in evapotranspiration, which in turn leads to a decrease in convective precipitation and a further decrease in light precipitation. The decreasing convective precipitation during the aforementioned process also decreases the PRR in light precipitation, thereby decreasing the dependence of light precipitation on local evaporation, despite the intensification of the precipitation recycling process under global warming. The convective precipitation that is enhanced by an increase in evaporation leads to an increase in heavy precipitation, forming positive feedback to increase heavy precipitation. Increasing convective precipitation during heavy precipitation also increases the PRR, indicating that heavy precipitation is increasingly dependent on local evaporation. The contrast changes in PRR between light and heavy precipitation have a positive effect on the shift in precipitation intensity.
Therefore, an intensified precipitation recycling process could facilitate the transition to heavy precipitation by increasing evaporation and adjusting the dependence of light and heavy precipitation on the precipitation recycling process. However, the contrast changes in the external cycle between the eastern and western TP result in a weaker contribution of the external cycle over the TP. Although the internal cycle only amplifies the effect of the external cycle on the shift, its contribution even exceeds that of the external cycle. Further divide the internal precipitation into the PRR term and precipitation term and find that the PRR term contributes more than the precipitation term, especially during heavy precipitation, which heavily amplifies the effect of the external cycle (Figure 6). The TP is projected to warm significantly in the future, which will significantly intensify the internal cycle; consequently, the influence of the internal cycle on the shift is anticipated to increase.
4.2 Implications of the shift in precipitation over the Tibetan Plateau under global warming
The internal cycle and external cycle are important components of the hydrological cycle over the TP. A better understanding of the internal and external cycles over the TP can contribute to the early response to disasters for facilities over the TP. The decrease in light precipitation may contribute to more frequent drought over the TP. It is important to note the amplification effect of the internal cycle, which amplifies heavy precipitation by increasing evaporation over the TP. The amplification of heavy precipitation may also increase the occurrence of extreme precipitation and flood disasters, which could damage the infrastructure over the TP. As internal precipitation amplifies the precipitation shift over the TP, we suggest that the government take measures to mitigate the adverse effects associated with this shift in a warming climate.
5 Conclusion
Due to global warming, the Tibetan Plateau has experienced a shift in precipitation intensity, such as an increase in heavy precipitation and a decrease in light precipitation, in recent decades. To quantify this process and clarify the effect of internal and external cycles of the precipitation recycling process, the concept of the precipitation shift rate was introduced, and the results show that the shift rates over the eastern and western TP are −3.485 mm/41 years and 5.666 mm/41 years, respectively. The impacts of the precipitation recycling process on the shift from light to heavy precipitation were further investigated over the Tibetan Plateau. Both the internal and external cycles have a positive influence on the shift toward heavy precipitation over the western TP, while the internal (external) cycle has a positive (negative) influence on the shift over the eastern TP. The results reveal that the internal (87.2%) and external cycles (12.8%) contribute to the precipitation intensity shift over the TP. The internal precipitation was further decomposed into the PRR term and precipitation term. The variations in internal precipitation were mutually impacted by the PRR term and precipitation term, where the PRR term impacts heavy precipitation more and the precipitation term impacts light precipitation more. The strong impact of the PRR term in heavy precipitation is consistent with the amplified effect of internal precipitation. Therefore, the mechanism of the influence of the precipitation recycling process on the shift was investigated from the perspective of the changes in PRR during light and heavy precipitation. The result reveals that light precipitation has a higher PRR climatology than heavy precipitation, indicating that the dependence of light precipitation on local evapotranspiration is greater than that of heavy precipitation. Under enhanced warming, the PRR increases during heavy precipitation and decreases during light precipitation, which is mostly due to the response of convective precipitation. The results suggest that heavy precipitation is more responsive to the intensified precipitation recycling process than light precipitation. Therefore, the intensified precipitation recycling process generated by the enhanced warming may contribute to the shift of precipitation intensity to heavy precipitation by adjusting the response of PRR. The increasing PRR in heavy precipitation increases the risk of extreme precipitation. This reminds us to pay more attention to the influence of the precipitation recycling process when projecting the changes in extreme precipitation in the future.
Data availability statement
The original contributions presented in the study are included in the article/Supplementary Material, further inquiries can be directed to the corresponding author. The ERA5 single level and pressure level data used for the calculation of the precipitation recycling process are available from https://doi.org/10.24381/cds.adbb2d47 and https://doi.org/10.24381/cds.bd0915c6, respectively. Figures are made with Proplot version 0.9.5 (Davis, 2021), available under the MIT license at https://github.com/proplot-dev/proplot. Modified WAM2layers for moisture tracking are licensed under GNU General Public License v2.0 and are available on Github https://github.com/xmingzh/Modified-WAM2layers (Xiao and Cui, 2021).
Author contributions
YH contributes to the conception and design of this study and develops the methodology for analysis. BZ runs WAM2layers, analyzes the results and write the draft. YH reviews the manuscript. YR, BH, YP, SW, and XG discuss the results and contribute to writing the manuscript.
Funding
This work was jointly supported by the Strategic Priority Research Program of Chinese Academy of Sciences (XDA2006010301), the National Science Foundation of China (42041004 and 91837209), the National Key Research and Development Program of China (No: 2019YFA0607104), and China 111 Project (B13045). This work was also supported by the Supercomputing Center of Lanzhou University.
Conflict of interest
The authors declare that the research was conducted in the absence of any commercial or financial relationships that could be construed as a potential conflict of interest.
Publisher’s note
All claims expressed in this article are solely those of the authors and do not necessarily represent those of their affiliated organizations, or those of the publisher, the editors and the reviewers. Any product that may be evaluated in this article, or claim that may be made by its manufacturer, is not guaranteed or endorsed by the publisher.
Supplementary material
The Supplementary Material for this article can be found online at: https://www.frontiersin.org/articles/10.3389/feart.2023.1078501/full#supplementary-material
References
An, W., Hou, S., Zhang, Q., Zhang, W., Wu, S., Xu, H., et al. (2017). Enhanced recent local moisture recycling on the northwestern Tibetan plateau deduced from ice core deuterium excess records. J. Geophys. Res. Atmos. 122 (23), 12541–12556. doi:10.1002/2017JD027235
Ayantobo, O. O., Wei, J., Li, Q., Hou, M., and Wang, G. (2022). Moderate rain intensity increased and contributes significantly to total rain change in recent decades over the Qinghai-Tibet Plateau. J. Hydrology Regional Stud. 39, 100984. doi:10.1016/j.ejrh.2021.100984
Bingyi, W. (2005). Weakening of Indian summer monsoon in recent decades. Adv. Atmos. Sci. 22 (1), 21–29. doi:10.1007/BF02930866
Brun, F., Treichler, D., Shean, D., and Immerzeel, W. W. (2020). Limited contribution of glacier mass loss to the recent increase in Tibetan plateau lake volume. Front. Earth Sci. 8, 582060. doi:10.3389/feart.2020.582060
Cuo, L., and Zhang, Y. (2017). Spatial patterns of wet season precipitation vertical gradients on the Tibetan Plateau and the surroundings. Sci. Rep. 7 (1), 5057. doi:10.1038/s41598-017-05345-6
Dehecq, A., Gourmelen, N., Gardner, A. S., Brun, F., Goldberg, D., Nienow, P. W., et al. (2018). Twenty-first century glacier slowdown driven by mass loss in High Mountain Asia. Nat. Geosci. 12 (1), 22–27. doi:10.1038/s41561-018-0271-9
Dong, W., Lin, Y., Wright, J. S., Ming, Y., Xie, Y., Wang, B., et al. (2016). Summer rainfall over the southwestern Tibetan Plateau controlled by deep convection over the Indian subcontinent. Nat. Commun. 7 (1), 10925. doi:10.1038/ncomms10925
Ent, R. J. V., Tuinenburg, O. A., Knoche, H. R., Kunstmann, H., and Savenije, H. H. G. (2013). Should we use a simple or complex model for moisture recycling and atmospheric moisture tracking? Hydrology Earth Syst. Sci. 17 (12), 4869–4884. doi:10.5194/hess-17-4869-2013
Ent, R. J. V., Wang-Erlandsson, L., Keys, P. W., and Savenije, H. H. G. (2014). Contrasting roles of interception and transpiration in the hydrological cycle – Part 2: Moisture recycling. Earth Syst. Dyn. 5 (2), 471–489. doi:10.5194/esd-5-471-2014
Gao, Y., Chen, F., Miguez-Macho, G., and Li, X. (2020). Understanding precipitation recycling over the Tibetan Plateau using tracer analysis with WRF. Clim. Dyn. 55 (9-10), 2921–2937. doi:10.1007/s00382-020-05426-9
Goessling, H. F., and Reick, C. H. (2013). On the "well-mixed" assumption and numerical 2-D tracing of atmospheric moisture. Atmos. Chem. Phys. 13, 5567–5585. doi:10.5194/acp-13-5567-2013
Guo, D., and Wang, H. (2012). The significant climate warming in the northern Tibetan Plateau and its possible causes. Int. J. Climatol. 32 (12), 1775–1781. doi:10.1002/joc.2388
Guo, L., Ent, R. J. V., Klingaman, N. P., Demory, M. E., Vidale, P. L., Turner, A. G., et al. (2019). Moisture sources for east Asian precipitation: Mean seasonal cycle and interannual variability. J. Hydrometeorol. 20 (4), 657–672. doi:10.1175/JHM-D-18-0188.1
Guo, L., Klingaman, N. P., Demory, M. E., Vidale, P. L., Turner, A. G., and Stephan, C. C. (2018). The contributions of local and remote atmospheric moisture fluxes to East Asian precipitation and its variability. Clim. Dyn. 51 (11-12), 4139–4156. doi:10.1007/s00382-017-4064-4
Guo, X., Feng, Q., Si, J., and Zhang, X. (2022). Considerable influences of recycled moistures and summer monsoons to local precipitation on the northeastern Tibetan Plateau. J. Hydrology 605, 127343. doi:10.1016/j.jhydrol.2021.127343
He, Y., Tian, W., Huang, J., Wang, G., Ren, Y., Yan, H., et al. (2021). The mechanism of increasing summer water vapor over the Tibetan plateau. J. Geophys. Res. Atmos. 126 (10), e2020JD034166. doi:10.1029/2020JD034166
Hersbach, H., Bell, B., Berrisford, P., Hirahara, S., Horányi, A., Muñoz-Sabater, J., et al. (2020). The ERA5 global reanalysis. Q. J. R. Meteorological Soc. 146 (730), 1999–2049. doi:10.1002/qj.3803
Hua, L., Zhong, L., and Ke, Z. (2015). Characteristics of the precipitation recycling ratio and its relationship with regional precipitation in China. Theor. Appl. Climatol. 127 (3-4), 513–531. doi:10.1007/s00704-015-1645-1
Huang, Y., and Cui, X. (2015). Moisture sources of an extreme precipitation event in Sichuan China, based on the Lagrangian method. Atmos. Sci. Lett. 16 (2), 177–183. doi:10.1002/asl2.562
Immerzeel, W. W., Beek, L. P. H. V., and Bierkens, M. F. P. (2010). Climate change will affect the asian water towers. Science 328 (5984), 1382–1385. doi:10.1126/science.1183188
Immerzeel, W. W., Lutz, A. F., Andrade, M., Bahl, A., Biemans, H., Bolch, T., et al. (2020). Importance and vulnerability of the world’s water towers. Nature 577 (7790), 364–369. doi:10.1038/s41586-019-1822-y
Kurita, N., and Yamada, H. (2008). The role of local moisture recycling evaluated using stable isotope data from over the middle of the Tibetan plateau during the monsoon season. J. Hydrometeorol. 9 (4), 760–775. doi:10.1175/2007jhm945.1
Li, Y., Su, F., Tang, Q., Gao, H., Yan, D., Peng, H., et al. (2022). Contributions of moisture sources to precipitation in the major drainage basins in the Tibetan Plateau. Sci. China Earth Sci. 65 (6), 1088–1103. doi:10.1007/s11430-021-9890-6
Liu, X., and Chen, B. (2000). Climatic warming in the Tibetan Plateau during recent decades. Int. J. Climatol. 20 (14), 1729–1742. doi:10.1002/1097-0088(20001130)20:14<1729:AID-JOC556>3.0.CO;2-Y
Ma, N., and Zhang, Y. (2022). Increasing Tibetan Plateau terrestrial evapotranspiration is primarily driven by precipitation. Agric. For. Meteorology 317, 108887. doi:10.1016/j.agrformet.2022.108887
Ma, S., Zhou, T., Dai, A., and Han, Z. (2015). Observed changes in the distributions of daily precipitation frequency and amount over China from 1960 to 2013. J. Clim. 28 (17), 6960–6978. doi:10.1175/JCLI-D-15-0011.1
Ma, S., Zhou, T., Stone, D. A., Polson, D., Dai, A., Stott, P. A., et al. (2017). Detectable anthropogenic shift toward heavy precipitation over eastern China. J. Clim. 30 (4), 1381–1396. doi:10.1175/JCLI-D-16-0311.1
Ma, Y., Lu, M., Bracken, C., and Chen, H. (2020). Spatially coherent clusters of summer precipitation extremes in the Tibetan Plateau: Where is the moisture from? Atmos. Res. 237, 104841. doi:10.1016/j.atmosres.2020.104841
Ma, Y., Lu, M., Chen, H., Pan, M., and Hong, Y. (2018). Atmospheric moisture transport versus precipitation across the Tibetan plateau: A mini-review and current challenges. Atmos. Res. 209, 50–58. doi:10.1016/j.atmosres.2018.03.015
Na, Y., Lu, R., Fu, Q., and Kodama, C. (2021). Precipitation characteristics and future changes over the southern slope of Tibetan plateau simulated by a high-resolution global nonhydrostatic model. J. Geophys. Res. Atmos. 126 (3), e2020JD033630. doi:10.1029/2020JD033630
Nayak, S., and Takemi, T. (2019). Dependence of extreme precipitable water events on temperature. Atmosfera 32 (2), 159–165. doi:10.20937/atm.2019.32.02.06
O’Gorman, P. A., and Muller, C. J. (2010). How closely do changes in surface and column water vapor follow Clausius–Clapeyron scaling in climate change simulations? Environ. Res. Lett. 5 (2), 025207. doi:10.1088/1748-9326/5/2/025207
Shiu, C. J., Liu, S. C., Fu, C., Dai, A., and Sun, Y. (2012). How much do precipitation extremes change in a warming climate? Changes in precipitation extremes. Geophys. Res. Lett., 39 (17), n/a. doi:10.1029/2012GL052762
Sun, B., and Wang, H. (2014). Moisture sources of semiarid grassland in China using the Lagrangian particle model FLEXPART. J. Clim. 27 (6), 2457–2474. doi:10.1175/jcli-d-13-00517.1
Sun, J., Yao, X., Deng, G., and Liu, Y. (2021). Characteristics and synoptic patterns of regional extreme rainfall over the central and eastern Tibetan plateau in boreal summer. Atmosphere 12 (3), 379. doi:10.3390/atmos12030379
Sun, Y., Solomon, S., Dai, A., and Portmann, R. W. (2007). How often will it rain? J. Clim. 20 (19), 4801–4818. doi:10.1175/JCLI4263.1
Tang, J., Guo, X., Chang, Y., Lu, G., and Qi, P. (2022). Long-term variations of clouds and precipitation on the Tibetan Plateau and its subregions and the associated mechanisms. Int. J. Climatol. 42, 9003–9022. doi:10.1002/joc.7792
Wang, G., Wang, D., Trenberth, K. E., Erfanian, A., Yu, M., Bosilovich, M. G., et al. (2017). The peak structure and future changes of the relationships between extreme precipitation and temperature. Nat. Clim. Change 7 (4), 268–274. doi:10.1038/nclimate3239
Wang, W., Li, J., Yu, Z., Ding, Y., Xing, W., and Lu, W. (2018). Satellite retrieval of actual evapotranspiration in the Tibetan Plateau: Components partitioning, multidecadal trends and dominated factors identifying. J. Hydrology 559, 471–485. doi:10.1016/j.jhydrol.2018.02.065
Xiao, M., and Cui, Y. (2021). Source of evaporation for the seasonal precipitation in the pearl river delta China. Water Resour. Res. 57 (8), e2020WR028564. doi:10.1029/2020wr028564
Xie, Z., and Wang, B. (2019). Summer atmospheric heat sources over the WesternCentral Tibetan plateau: An integrated analysis of multiple reanalysis and satellite datasets. J. Clim. 32 (4), 1181–1202. doi:10.1175/jcli-d-18-0176.1
Xiong, J., Yong, Z., Wang, Z., Cheng, W., Li, Y., Zhang, H., et al. (2019). Spatial and temporal patterns of the extreme precipitation across the Tibetan plateau (1986–2015). Water 11 (7), 1453. doi:10.3390/w11071453
Xu, X., Lu, C., Shi, X., and Gao, S. (2008). World water tower: An atmospheric perspective. Geophys. Res. Lett. 35 (20), L20815. doi:10.1029/2008GL035867
Yan, Y., You, Q., Wu, F., Pepin, N., and Kang, S. (2020). Surface mean temperature from the observational stations and multiple reanalyses over the Tibetan Plateau. Clim. Dyn. 55 (9-10), 2405–2419. doi:10.1007/s00382-020-05386-0
Yang, K., Tang, Q., and Lu, H. (2022). Surface mean temperature from the observational stations and multiple reanalyses over the Tibetan Plateau. Sci. China Earth Sci. 65, 584–588. doi:10.1007/s11430-021-9871-5
Yao, T., Bolch, T., Chen, D., Gao, J., Immerzeel, W., Piao, S., et al. (2022). The imbalance of the Asian water tower. Nat. Rev. Earth Environ. 3, 618–632. doi:10.1038/s43017-022-00299-4
Yao, T., Thompson, L., Yang, W., Yu, W., Gao, Y., Guo, X., et al. (2012). Different glacier status with atmospheric circulations in Tibetan Plateau and surroundings. Nat. Clim. Change 2 (9), 663–667. doi:10.1038/nclimate1580
Yu, X., Gu, X., Kong, D., Zhang, Q., Cao, Q., Slater, L. J., et al. (2022). Asymmetrical shift toward less light and more heavy precipitation in an urban agglomeration of east China: Intensification by urbanization. Geophys. Res. Lett. 49 (4), e2021GL097046. doi:10.1029/2021GL097046
Yuan, X., Yang, K., Lu, H., He, J., Sun, J., and Wang, Y. (2021). Characterizing the features of precipitation for the Tibetan Plateau among four gridded datasets: Detection accuracy and spatio-temporal variabilities. Atmos. Res. 264, 105875. doi:10.1016/j.atmosres.2021.105875
Zhang, C. (2020). Moisture source assessment and the varying characteristics for the Tibetan Plateau precipitation using TRMM. Environ. Res. Lett. 15 (10), 104003. doi:10.1088/1748-9326/abac78
Zhang, C., Tang, Q., Chen, D., Ent, R. J. V., Liu, X., Li, W., et al. (2019). Moisture source changes contributed to different precipitation changes over the northern and southern Tibetan plateau. J. Hydrometeorol. 20 (2), 217–229. doi:10.1175/JHM-D-18-0094.1
Zhang, C., Tang, Q., and Chen, D. (2017a). Recent changes in the moisture source of precipitation over the Tibetan plateau. J. Clim. 30 (5), 1807–1819. doi:10.1175/JCLI-D-15-0842.1
Zhang, G., Yao, T., Shum, C. K., Yi, S., Yang, K., Xie, H., et al. (2017b). Lake volume and groundwater storage variations in Tibetan Plateau’s endorheic basin. Geophys. Res. Lett. 44 (11), 5550–5560. doi:10.1002/2017GL073773
Keywords: precipitation recycling process, heavy precipitation, Tibetan plateau, precipitation intensity shift, summer precipitation
Citation: Zhang B, He Y, Ren Y, Huang B, Peng Y, Wang S and Guan X (2023) The influence of the precipitation recycling process on the shift to heavy precipitation over the Tibetan Plateau in the summer. Front. Earth Sci. 11:1078501. doi: 10.3389/feart.2023.1078501
Received: 24 October 2022; Accepted: 17 January 2023;
Published: 26 January 2023.
Edited by:
Er Lu, Nanjing University of Information Science and Technology, ChinaReviewed by:
Meirong Wang, Nanjing University of Information Science and Technology, ChinaQiaohong Sun, Nanjing University of Information Science and Technology, China
Copyright © 2023 Zhang, He, Ren, Huang, Peng, Wang and Guan. This is an open-access article distributed under the terms of the Creative Commons Attribution License (CC BY). The use, distribution or reproduction in other forums is permitted, provided the original author(s) and the copyright owner(s) are credited and that the original publication in this journal is cited, in accordance with accepted academic practice. No use, distribution or reproduction is permitted which does not comply with these terms.
*Correspondence: Yongli He, aGV5b25nbGlAbHp1LmVkdS5jbg==