 Roman Kozyrev
 Yu Umezawa
 Muneoki Yoh
- 1United Graduate School of Agricultural Science, Tokyo University of Agriculture and Technology, Fuchu, Japan
- 2Department of Environmental Science on Biosphere, Tokyo University of Agriculture and Technology, Fuchu, Japan
Phosphorus (P) is an essential element for the metabolism, growth, and development of living organisms, and it often limits primary production in freshwater ecosystems. During flood events, rivers can transport considerable amounts of particulate organic P (org-P) and inorganic P from the basin to the ocean. Understanding the transport mechanisms and changes in P distribution from upstream to downstream areas of rivers is crucial to estimate its flux to the ocean. However, the processes involved in P transformation and cycling among different forms in rivers are not well understood. To better understand P transformation and total P (TP) concentrations in river basins, this study examined various P forms in bottom sediments, river bank sediments, parent rock material, and soil samples along the Tone River, Japan. P forms such as org-P, Ca-bound phosphorus (apatite, Ca-P), P bound with iron oxides/hydroxides (Fe-P), bio unavailable non-apatite inorganic P (NAIP), and TP were analyzed. The results showed an increase in TP concentration in bottom and bank sediment samples along the course of the Tone River. This change in TP was mostly due to the increases in Fe-P and bioavailable org-P, while Ca-P and NAIP decreased toward the downstream area. Analysis of parent rock in three main mountain group areas (Mount Tanigawa, Mount Akagi, and Mount Tsukuba) showed their downstream impacts on TP and the distribution of P forms. Sediment grain size distribution analysis suggested that Fe-P and org-P fractions increased with decreasing sediment particle size, while Ca-P and NAIP were relatively evenly distributed among all grain sizes. The data revealed the transformation of P forms in sediments of the largest river in the Kanto region, Japan, which influence its flux to the Pacific Ocean. The results suggest that Fe-P and org-P may play a more significant role in P transport from river basins to the ocean than previously thought. The findings of this study can be useful for estimating P fluxes to the ocean and for the management of freshwater ecosystems.
1 Introduction
Phosphorus (P) is an essential and sometimes limiting nutrient in aquatic systems, controlling the growth rate of algae and aquatic plants. Photosynthesis (primary production) in aquatic ecosystems and the oceanic carbon cycle are also strongly dependent on nutrient elements, such as nitrogen (N) and P (Holland, 1984). In the eastern Mediterranean Sea (Krom et al., 1991; Krom et al., 2010; Lazarri et al., 2015) and other coastal areas (Fisher et al., 1992; Hayashi et al., 2000; Kubo et al., 2019), P is the limiting nutrient for primary production due to high N:P values in all external nutrient inputs. Therefore, understanding the process by which P is supplied to the terrestrial and aquatic ecosystems is an important issue.
In soils, Ca-bound phosphorus (apatite, Ca-P) is the dominant P-bearing primary mineral (Nezat et al., 2008). P mainly originates as apatite in bedrock or in uplifted sedimentary deposits. Several studies have been conducted on the dominant P form (apatite) in many parent materials (Williams, 1969; Kohler et al., 2005), but there has been little research regarding the characterization of P forms. Parent materials differ in P concentration, which may influence P availability across the whole area of a river basin. Furthermore, P weathering, leaching, and other processes are strictly dependent on the origin of P source in parent rocks, meaning that P flux is likely to differ in different geological systems (Hartmann et al., 2014). As with silicate minerals, the solubility of apatite is higher under acidic conditions, and it has been reported that the concentration of phosphate in stream water is higher in areas where the surface geology is andesite or basalt (Wakamatsu et al., 2006). Once P is released from apatite, dissolved phosphate ions can be transported via natural waters to the ocean. Along this path, P can be adsorbed onto inorganic particles or incorporated into various metabolic reactions and pathways (Ruttenberg, 2004).
In aquatic systems, P occurs in a number of basic forms, including dissolved inorganic P (IP, readily reactive P, which is immediately bioavailable), dissolved organic P (org-P), particulate organic P (detritus and living biomass), and particulate inorganic P (mostly represented by Fe/Al-bound P). The availability of P in water is influenced by various physical and chemical transformations as well as biological processes. The adsorption of P onto sediment particles plays a key role in P cycling, especially in streams and rivers affected by agricultural land use (Withers and Jarvie, 2008; Weigelhofer et al., 2018). Particle-bound P settles in retention zones of rivers, such as pools, floodplain lakes, and impounded sections, and can then be released into the water column. The amount of P in the sediments is strongly dependent on grain size, and is highest in mud (<63 µm) and fine sand (63–250 µm) and decreases with increasing grain size (Reddy et al., 1999; Mainstone and Parr, 2002; Peng et al., 2021). Therefore, it is necessary to gain an understanding of the changes in P forms and grain sizes from upstream to downstream areas of the rivers.
Phosphorus speciation in sediment provides useful information on the reactivity and potential bioavailability of P in the aquatic ecosystem. However, most experimental studies on phosphate release from sediments have focused on static release in lakes or estuaries, but there are not many studies about P in river sediments. There is a need for more research on the interactions between different forms of P, its spatial variability and other chemical, and physical factors in the river sediments and water column.
This study was performed to determine the spatial variability of P in bottom sediment and bank sediment along the Tone River, Japan, to understand grain size changes from the upstream to downstream areas of the Tone River, and to identify and compare different P forms and their interactions, and changes in the sediment, with reference to its tributary zones with different surface geology.
2 Materials and methods
2.1 Study site
A field survey was conducted along the Tone River, the largest river in the Kanto region, which includes Tokyo, Japan. The river is 322 km long and has a drainage area of 16,840 km2. The mean annual discharge of the Tone River varies depending on the year and the season, however, the long-term average annual discharge is approximately 20.5 × 10⁹ m3/year.
The land in the Tone River basin consists of about 62% mountainous land mostly covered with forest, 23% agricultural land, such as rice paddies and fields, around 7% is urban land, such as residential land, and 8% of water surfaces, mainly represented by the Lake Kasumigaura (Ministry of Land, Infrastructure, Transport, and Tourism, 2011). Therefore, the supply of P-bearing parent rock is important over a wide area, in addition to the supply of phosphate and org-P through treated sewage water as possible local sources of P. As of 1 October 2022, the estimated total population of prefectures within the Tone River basin is approximately 15.9 million people (Ministry of Internal Affairs and Communications, Japan).
The upper reaches of the Tone River basin are mostly represented by two groups of parent rock material, i.e., dacite and rhyolite with relatively low P concentrations, and andesite group rocks with high P concentrations (Figure 1). Mount Tanigawa is mainly represented by relatively low-P rhyolite and dacite (mean P concentration is 14.2 and 27.2 µmol/g respectively), while Mount Akagi, located to the southwest, consists almost entirely of andesite and basaltic-andesite rocks with mean P content of 37.1 and 50.1 µmol/g respectively (National Institute of Advanced Industrial Science and Technology Geological Survey of Japan, GeomapNavi, 2018).
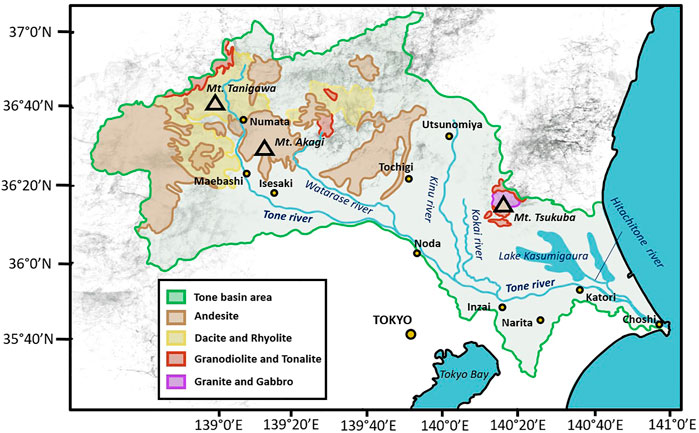
FIGURE 1. Geological map of the Tone River basin.
The downstream area is represented by plains covered by tablelands consisting of unconsolidated agglomerates of shallow marine sediments (Okamoto and Ikeda, 2000). River valley lowlands separate the hills and tablelands into independent sections. While upstream reaches of the valleys are gravelly and rather dry, the middle- and downstream portions become deltaic, wet, and swampy. Decomposed red-brown volcanic ash soil, called Kanto loam, covers the flat-topped tablelands. Mount Tsukuba, one of the sources of P in the lower reaches of the Tone River basin, is located to the north of the downstream area of the Tone River and northwest of Lake Kasumigaura. Mount Tsukuba consists of granitic and gabbroic rocks (mean P concentration is 31.1 and 26.1 µmol/g respectively), which have relatively high P contents. Data from whole-rock analyses obtained from the EarthChem website (www.earthchem.org).
2.2 Sampling
Samples of sediments were taken at 23 sampling sites in the Tone River basin (Supplementary Table S1). Sampling sites 1–3 represent upstream areas; sites 1 and 2 are located at Mount Tanigawa, site 3 is located in the Tone River area close to Maebashi City, and sites 3-2 and 3-3 are located at Mount Akagi. Sample 3-2 was taken in the western part of Mount Akagi at the Akagishirakawa River. Sample 3-3 was taken southeast of Mount Akagi, at the Kasugawa River. Both the Akagishirakawa River and Kasugawa River join the Tone River via the Watarase River. The middle-stream area is represented by sampling sites 4–6. Sites 4 and 5 are located downstream from Isesaki City. Site 6 is located after the mixing of the Tone River and Watarase River. The downstream area is represented by sampling sites 7–9. Site 7 is located after the Kinugawa River merges with the Tone River, site 8 after the Kokai River, and site 9 is located close to Katori City. Sampling areas 10–12 represent a mixing zone of the Tone River that is influenced by the salty water from the Pacific Ocean with salinity ranging from 6.5 at site 10–9.1 at site 9. Sampling site 10 is located downstream of the mixing of the Tone River and Hitachitone River, site 11 is approximately 10 km from the estuary, and site 12 is about 5 km from the estuary. Four samples (K1–K4) of bottom sediment (0–10 cm depth) from Lake Kasumigaura were collected using an Ekman grab from a boat with the help of the National Institute for Environment Studies. Sample K5 was also taken using Ekman grab at the Hitachitone River, which connects Lake Kasumigaura and the Tone River.
Stream bank erosion is one of the main sources of suspended sediments in stream water, and may be a source of P during flood periods (Rahutomo et al., 2019). Therefore, nine bank sediment samples—six from the Tone River (1, 2, 4–7), three from tributaries of the Tone River (3-2, 3-3, and K5) —were collected by hand from single point of surficial material, representing only modern depositional surfaces. After collection, bottom sediment and bank sediment samples were transported in cooling boxes to the laboratory and frozen until analysis. Similar to bank sediments, soil sediment samples were taken from four sites as potential P sources. T1 represents Mount Tsukuba, AL-1 and AL-2 are soil samples from agricultural lands located to the southwest of the main body of Lake Kasumigaura in the downstream area of the Tone River, and soil sample K3-2 was taken from one of the bays of Lake Kasumigaura. These samples were collected by hand.
The three largest mountain groups along the river course were sampled for parent rock material, consisting of one sampling site at Mount Tanigawa (R1–R3), two sampling sites at Mount Akagi close to the Akagishirakawa River (R4) and Kasugawa River (R5), and one site at Mount Tsukuba (R6 and R7), which is one of the main P sources in the Kasumigaura area connected to the Tone River by the Hitachitone River. Locations of sampling sites are shown on the map in Figure 2.
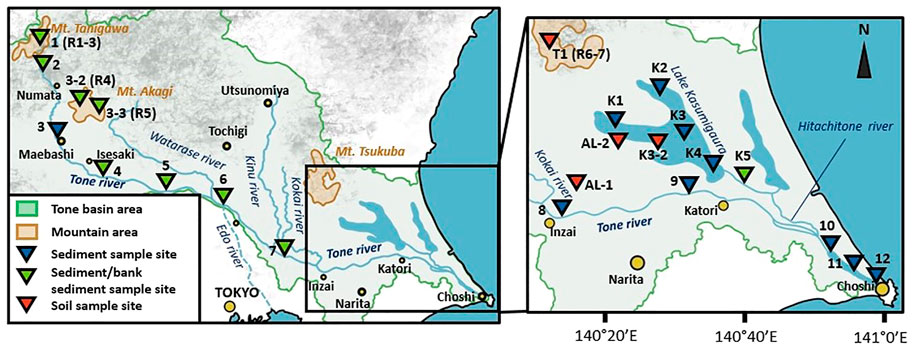
FIGURE 2. Locations of sampling sites in the Tone River basin. R1–R7 indicate the locations of parent rock sampling sites.
2.3 Analytical methods
Bottom sediment, bank sediment, soil, and parent rock samples were dried for 3 days at 105°C and then ground using a tungsten mortar and pestle. These samples were divided into four subsamples, and different forms of P were quantified as P bound with Fe oxides/hydroxides (Fe-P), apatite P (Ca-P, CaCO3-P and possibly some residual of Fe-, Al-, Mn-bound P), and non-apatite inorganic P (NAIP), representing some hardly extractable P and silica-bound P. The first subsample was extracted with citrate-dithionite-bicarbonate solution at pH 7.6; this fraction represents Fe-P. The second subsample was ashed for 6 h at 550°C and then extracted with 1 M HCl. The difference between subsample 1 and 2 represented the apatite P fraction. The third subsample was also extracted with 1 M HCl but without ashing. The difference between these two subsamples (2 and 3) represented the org-P fraction (Ruttenberg, 1992). Subsample 4, was extracted with hydrogen fluoride (HF) digestion with HNO3 and HClO4 pretreatment, and represents total P (TP). The difference between hydrogen fluoride and HCl 550°C subsamples represented NAIP. Phosphate in solution, after filtration, was analyzed by the standard molybdate-blue spectrophotometric method using a spectrophotometer (U-1500; Hitachi, Tokyo, Japan).
Although the SEDEX method (Ruttenberg, 1992) was originally developed for use with marine sediments, this method is often used for sequential extraction of P from freshwater sediments (Filippelli et al., 2006; Wang L. et al., 2013; Simon et al., 2009). For example, Liu et al. (2018) and Zheng et al. (2016) used a modified method with higher acid concentrations and longer extraction times. The reason for using higher acid concentrations (or stronger acids) is that river sediments can contain more mineral phases, such as iron and aluminum oxides/hydroxides, and apatite-P, that can adsorb or precipitate phosphorus, making it less available for extraction with original Ruttenberg’s method. Using a stronger acid can help dissolve these mineral phases and release the P that can bind with them. Therefore, in this study, an additional phase of HF digestion was performed. The standard deviation of replicate measurements for each P form was less than 10% of the mean.
The non-ground subsample was used for grain size analyses. First, subsamples were weighed and put into a sieving machine (MVS-1; AS ONE, Osaka, Japan) with four sieves with mesh sizes ranging from 4 mm to 250 µm to separate the gravel and coarse sand fractions. All fractions were then weighed and the fraction with grain size <250 µm was put into a separate container for further laser analysis using a laser diffraction particle size analyzer (SALD-2300; Shimadzu, Kyoto, Japan). The sieved fraction was put into a glass container with purified water and left to stabilize with stirring for 5 min before analysis. The obtained data were tabulated with data for other grain sizes from the first step, and the overall grain size distribution was calculated with weight-based method.
3 Results
3.1 Grain size distribution in the bottom sediments along the Tone River
The upstream portion of the Tone River was mainly represented by gravel sediment: 91.4% at sampling site 1, 72.7% at site 2, and 58.8% at site 3. Approaching the middle-stream region of the Tone River, sediment grain size changed from gravel to sand. Sediments at sites 4–6 were composed mainly of the middle fraction of sand (1,000–500 µm), at around 73%, and contained only about 9% and 8% coarse sand and fine sand fractions, respectively. In the downstream area (sites 7–9), sediments were composed mainly of the middle sand fraction (59.7% on average), and contained 1% coarse sand and 36.8% fine sand. Among downstream samples, site 8 had the highest proportion of the middle sand fraction, while site 9 had the highest proportion of coarse sand. The mixing zone showed the most rapid change in sediment grain size stratification. While site 10 (mixing area of the Tone and Hitachitone rivers) mostly consisted of fine sand (grain size: 63–250 μm; 75.1%), site 11 had only 36.6% fine sand and 51% middle sand and 10.8% mud (grain size: <63 μm, i.e., silt and clay). Among mixing zone sites, site 12, the closest to the ocean, had the highest percentage of mud (26.8%), although fine sand was the main fraction (53.8%); the middle sand fraction was lowest at this site (17%) (Figure 3; Supplementary Table S2).
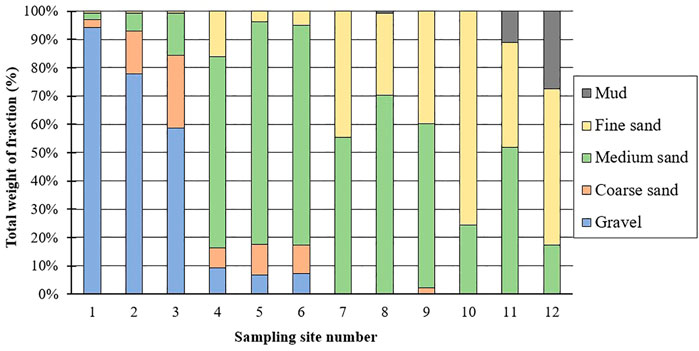
FIGURE 3. Grain size distribution in the bottom sediments of the Tone River.
3.2 Changes in TP concentration in the Tone River basin
An notable increase in P concentration was observed between Mount Tanigawa (sites 1 and 2) and Mount Akagi (sites 3–5), resulting in an elevation of TP content in the bottom sediment from the upper reaches of the Tone River to the downstream area. The mean TP in the Tanigawa and Akagi areas were 9.7 and 14.5 µmol/g, respectively, representing an almost 5 µmol/g increase in TP in the latter (Figure 4A). From the middle-stream area, TP continued to increase smoothly by about 1.5–2.5 µmol/g among sampling sites. A decrease in total phosphorus (TP) content of 7 µmol/g was observed at site 9 compared to site 8, and a decrease of almost 10 µmol/g was observed at site 9 compared to site 10. On the other hand, the sampling sites in the mixing zone, including sites 10, 11, and 12, exhibited the highest TP contents, measuring 22.6, 25.7, and 26.6 µmol/g respectively.
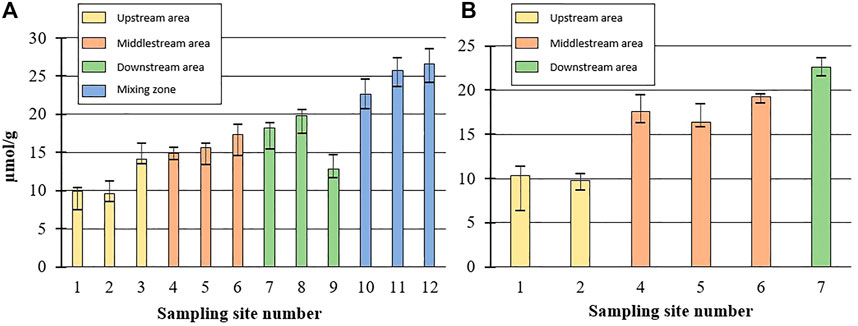
FIGURE 4. (A) TP changes in bottom sediments of Tone River. (B) TP changes in bank sediments of Tone River.
Bottom sediment samples from the Lake Kasumigaura (K1–K5) showed a slight increase in TP concentration at sampling sites K1–K3, with an increase from 26.5 µmol/g to 30.3 µmol/g (a 3.8 µmol/g increase). Subsequently, there was a marked decrease in TP concentration towards sites K4–K5 (15.9 and 15.1 µmol/g respectively; Supplementary Figure S1A). Interestingly, site K3 also showed the greatest sediment thickness among all sites (about 100 cm) (GSI, 2021; Supplementary Figure S1B).
Similar to the bottom sediment samples, bank sediment TP showed notable increases between Mount Tanigawa and Mount Akagi (average of sites 1 and 2: 10.9 µmol/g; average of sites 4–6: 17 µmol/g) (Figure 4B). Parent rocks also showed differences in TP levels from Mount Tanigawa to Mount Akagi and Mount Tsukuba. The mean TP concentrations at Mount Tanigawa (samples R1–R3) were in the range of 12.7–22.7 µmol/g, with a maximum TP concentration of 23.9 µmol/g in dacite rocks. The mean TP at Mount Akagi (R4–R5) showed higher P contents compared to both Mount Tanigawa and Mount Tsukuba (35.7 and 36.2 µmol/g, respectively), with a maximum TP content of 37.4 µmol/g at site R5, which also corresponded to the mean TP content in andesite rocks. The mean TP concentration in parent rock samples of Mount Tsukuba was 25.8 µmol/g (range: 23.1–28.2 µmol/g) (Table 1). The TP concentration in soil samples varied markedly over the course of the river, with the minimum concentration observed at site K3-2 (14.2 µmol/g) and the maximum at site AL-1, representing agricultural land (32.4 µmol/g).
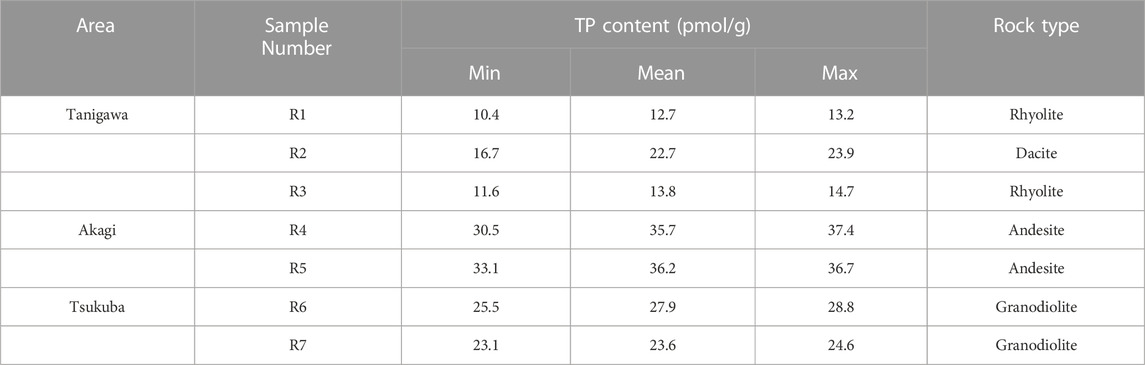
TABLE 1. TP contents in parent rocks in the Tone River basin.
3.3 Changes in P forms in the Tone River basin
TP was dominated by inorganic forms (apatite-P, NAIP, and Fe-P), which represented about 90% of the TP in the sediment samples of the Tone River. The mean concentrations of Apatite-P (Ca-P), Fe-P, NAIP, and org-P in bottom sediments along the course of the Tone River were 5.2, 3.7, 4.1 and 1.4 µmol/g, respectively. This P form distribution was also observed in parent rocks and bank sediments, where the most dominant form was apatite-P, followed in order by NAIP, Fe-P, and org-P (Figure 5).
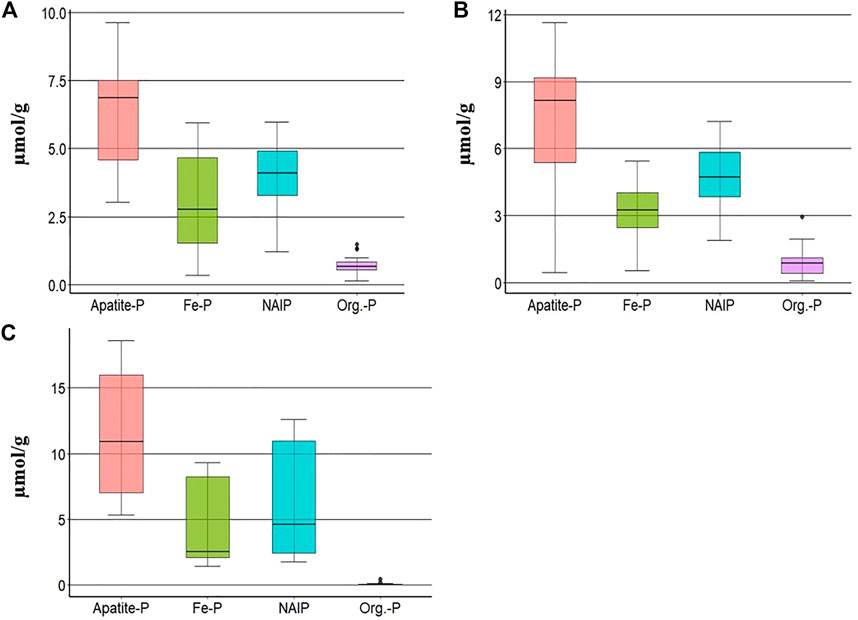
FIGURE 5. Mean concentrations (range) of different forms of P in (A) bottom sediments (n = 54), (B) bank sediments (n = 27), and (C) parent rocks (n = 21), where n = number of samples.
Upper and lower error bars represent the largest value within 1.5 times interquartile range above 75th percentile and the smallest value below 25th percentile. Top and bottom of the boxplot stand for 75th and 25th percentile respectively. 50th percentile (median) shown as the horizontal bold line inside of the boxplot.
The percentage of Ca-P decreased from the upper reaches of the Tone River (46%) toward the downstream area (4% at site 12); similarly, NAIP decreased from about 29% to only 3%, except at sites 9 and 10 in the downstream area, where the proportion of NAIP increased to around 37%. In the mixing zone, NAIP showed the lowest concentration and continued to decrease toward site 12, where it reached a minimum of 0.2% of total IP. Meanwhile, Fe-P and org-P showed increasing trends, from 12% in the upper reaches to 37% in the mixing zone for Fe-P, and from 7% to almost 50% in the mixing zone for org-P (Figure 6).
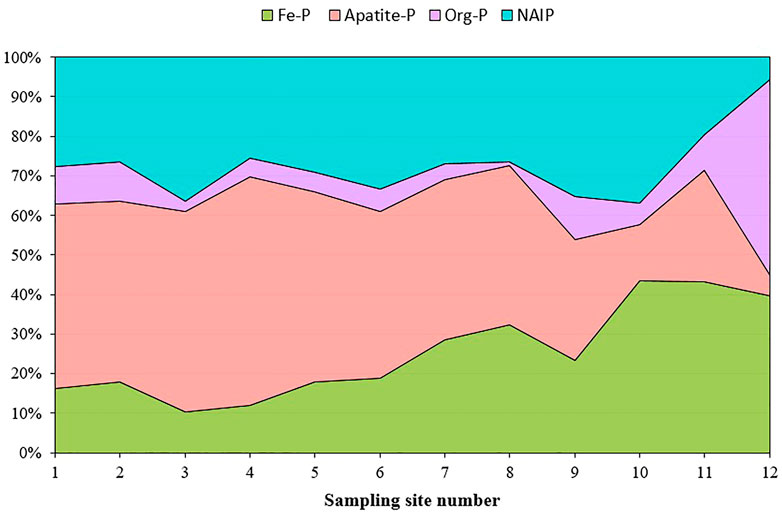
FIGURE 6. Stacked area plot of the percent change of different types of phosphorus within the Tone River flow.
Comparison of P concentrations in the bottom sediment between the mixing zone and other areas of the river showed that the increase in TP was due to the increases in Fe-P (7.3 µmol/g increase) and org-P (4.2 µmol/g increase) (Figure 7A). In contrast to the increases in Fe-P and org-P, the Ca-P fraction in the mixing zone was 2.8 µmol/g less than that in river bottom sediments. NAIP was relatively stable and did not show a marked change (0.3 µmol/g increase in the mixing zone).
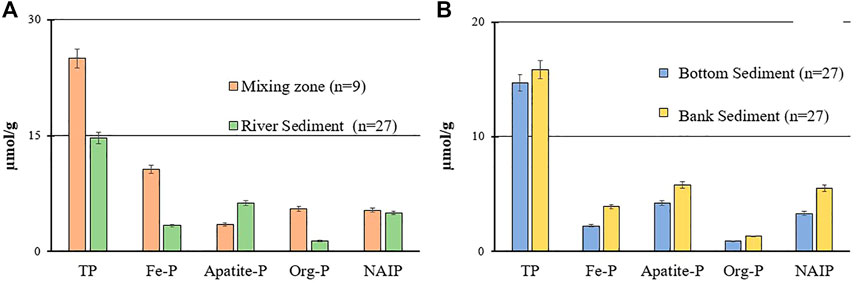
FIGURE 7. (A) Comparison of the mean concentrations of different P forms between the river bottom sediment samples and sediments deposited in the mixing zone area of the Tone River. (B) Comparison of the mean concentrations of different forms of P between Tone River sediment samples and riverbank samples (only sampling sites where both bottom and bank sediments samples were collected), where n = number of samples.
There were small increases in all P forms in the bank sediments compared to bottom sediment samples, and the TP increase was mostly due to the inorganic forms (Figure 7B).
Soil samples collected in the downstream area of the Tone River showed relatively high org-P concentrations compared to the bottom and bank sediments along the entire course of the river (4.9 µmol/g on average, with lowest org-P of 3.2 µmol/g at site K3-2 and highest of 5.5 µmol/g at T1). Fe-P and Ca-P fractions varied significantly among soil samples. Fe-P concentrations were 3.6, 15.2, 8.2, and 4.1 µmol/g for sites T1, AL-1, AL-2, and K3-2, respectively. Ca-P ranged from 1.9 µmol/g at K3-2 to 10.6 µmol/g at AL-1, with a mean concentration of 5.2 µmol/g. NAIP was mostly stable across all soil samples, with a mean concentration of 5.5 µmol/g.
4 Discussion
4.1 Influence of parent rock type on TP concentration in Tone River sediments
The TP concentration in parent rock material in the Tone River basin ranged from 9.7 µmol/g at Mount Tanigawa to a maximum of 38.9 µmol/g at Mount Akagi. These values were consistent with previous reports that average P concentration ranges between 7.2 and 55 µmol/g in igneous basaltic rocks, and between 0.9 and 27 µmol/g in sedimentary rocks (Reinmann and de Caritas, 1998). One reason for the increase of 5 µmol/g in TP from Mount Tanigawa to Mount Akagi in bottom sediments could be the different origins of the parent rocks in these areas. The bottom sediments in sites downstream of Mount Akagi showed higher overall IP concentrations than sites 1 and 2, resulting in an increase in TP. Furthermore, parent rock samples and bottom sediments showed similar Ca-P and NAIP distributions. For the Mount Tanigawa area, the mean Ca-P/IP ratios in bottom sediments and parent rock material were 51.1% and 51.7%, respectively, and the mean NAIP/IP ratios were 28.4% and 26.5%, respectively. For Mount Akagi, the mean Ca-P/IP ratios in bottom sediments and parent rocks were 49.6% and 45.9%, respectively, and the mean NAIP/IP ratios were 31.6% and 30.9%, respectively (Figure 8). These data suggest that the P in parent rock can impact TP and P form distribution in sediments located downstream of the mountains (Wakamatsu et al., 2006).
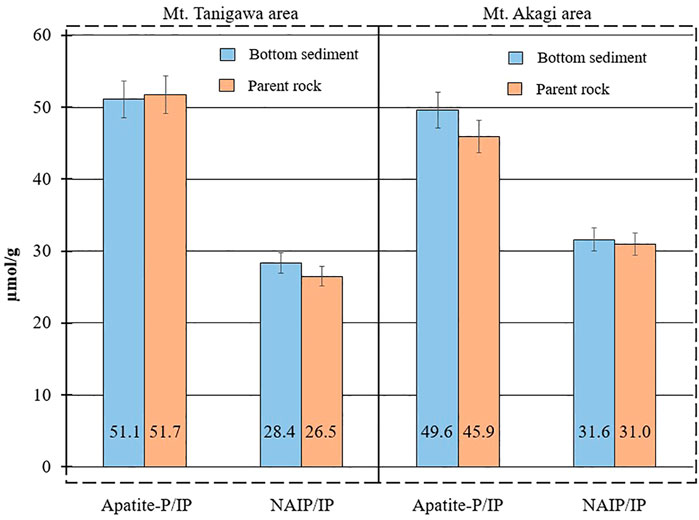
FIGURE 8. Ca-P and NAIP distributions in the bottom sediments and parent rock material in Mount Tanigawa and Mount Akagi areas.
4.2 Changes in P forms and dependence on grain size
Phosphate rocks are the main natural source of P, where it mostly exists as insoluble Ca-P, also known as apatite. In this study, the mean percentage of Ca-P contained in the bed sediments from the upper to the lower reaches of the Tone River was about 45%, and that in the bank sediments was 38%. The Ca-P/Fe-P ratio in the Tone River bottom sediments showed a negative correlation (r2 = 0.81) (Figure 9). Although the sum of Fe-P and Ca-P showed no significant changes, the percentage ratio of the sum (Fe-P and Ca-P) to IP in the bottom sediment samples of the Tone River ranged from 57% to 64%. Ca-P seemed to be controlled by chemisorption on colloidal ferric and aluminum oxides/hydroxides adsorbed on the surface of the Ca-containing particles. The pH-dependent Ca-P variations were reflected by the Fe-P fraction (Oxmann et al., 2008; Oxmann et al., 2010; Golterman, 2001). Similar to this study, Oxmann et al. (2008) showed that Al/Fe-P mirrored Ca-P in the pH range 4–8, and the sum of these fractions remained mostly unchanged.
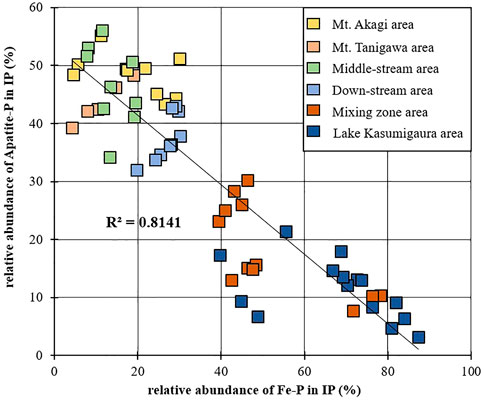
FIGURE 9. Correlation between the relative abundance of Fe-P and Apatite-P in IP (%) within the bottom sediments of the Tone River basin.
Several studies have examined the relationships of different forms of inorganic P to sediment grain size (Andrieux-Loyer and Aminot, 2001; Rao and Berner, 1997), and the Al/Fe-P form was shown to be related to fine-grained sediments. In this study, Al/Fe-bound P was also closely related to fine-grained particles (Table 2); therefore, the concentrations in the upstream and middle-stream areas, where the sediments were mostly represented by gravels (grain size: 4–16 mm), were the lowest compared to the downstream area of the Tone River where the range of the Fe-P form was between 0.3 and 10.9 µmol/g. In contrast to Fe-P, Ca-P was relatively evenly distributed among different grain size classes (Andrieux-Loyer and Aminot, 2001), leading to relatively smooth spread of Ca-P.
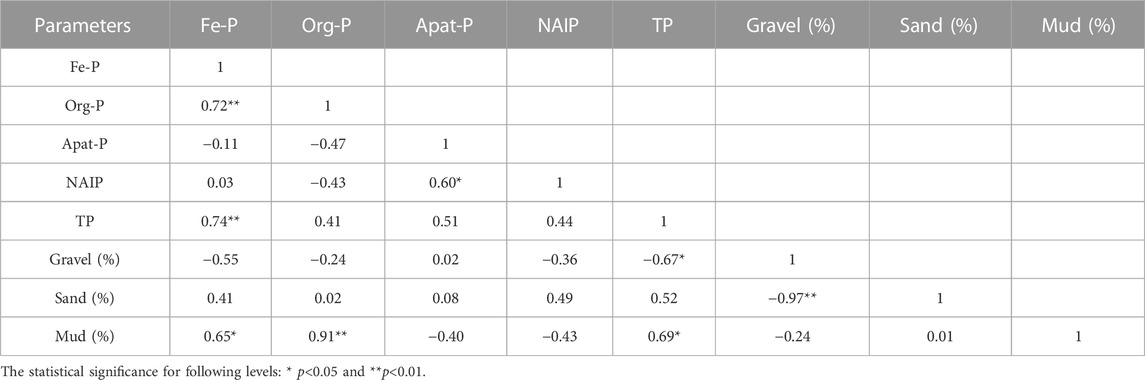
TABLE 2. Correlation matrix for grain size and P species in bottom sediments of the Tone River.
The NAIP fraction was relatively stable throughout all of the samples and sampling sites from upstream to downstream areas of the Tone River. The ratio of NAIP to total IP (NAIP/IP) was in the range of 14%–38%. This fraction did not show any significant correlation to any other P form or grain size.
Despite the paucity of studies on the relationships between org-P and sediment grain size, some reports have agreed that organic matter is preferentially adsorbed in muddy sediments (Turner et al., 1994; Vilas et al., 2005). Sediments of smaller grain sizes have relatively large specific surface area, which can enhance the adsorption of metals, organic matter, and other contaminants (Turner et al., 1994). Moreover, some portion of mud-sized sediment is thought to be derived from bacterial and phytoplankton remains, which are rich in organic carbon and org-P (Coppola et al., 2005; Coppola et al., 2007). Org-P is often the dominant component of the TP content in silt and clay fractions (i.e., mud), while in sandy fractions the org-P/TP ratio varies significantly (Makarov et al., 2002). Finer sediments are normally localized to areas with lower hydrodynamic forcing, such as the deepest points of estuaries. Similar results were obtained in this study; the org-P/TP ratio increased toward the mixing zone of the Tone River, where the sediment grain size was smaller, from around 5% to around 50% at sampling site 12, which was high in silty sediments.
4.3 Phosphorus forms change mechanisms in sediments along the Tone River flow
The Tone River is one of the major river systems in Japan that plays a critical role in the transport of nutrients, including phosphorus. P is often the rate-limiting element for primary production, especially in freshwater ecosystems compared to marine ecosystems (Doering et al., 1995). Therefore, it is important to understand the supply of phosphate to the water column and the underlying mechanisms. As water flows downstream, the P concentration and binding forms in the bottom sediments may undergo significant changes due to various biogeochemical processes. There are several studies conducted on temperature, pH, salinity, and dissolved oxygen (DO) effect on release of phosphate from sediments into the water column (Bidle et al., 2002; Zhang et al., 2012; Koriyama et al., 2013; Muta et al., 2019). However, not many researches are conducted on spatial distribution and changes of P forms in the river bodies. The distribution of P in the river bottom sediments can change from the up-stream to the down-stream due to various natural and anthropogenic factors. This study focused on understanding the longitudinal changes in the total concentration and binding forms of phosphorus (apatite-P, Fe-P, NAIP and org-P) in the bottom sediments of the Tone River.
In the upper reaches of the Tone River, phosphorus in the sediments is typically dominated by mineral-bound P forms, such as apatite and iron-bound P, which are less bioavailable to aquatic organisms. This is due to the geology of the watershed, which is dominated by granitic and metamorphic rocks (dacite, rhyolite) that are relatively low in organic matter and P. The total P concentration in the sediments is also relatively low, reflecting low inputs from anthropogenic sources. This study showed that TP concentration in the river bottom sediments in the up-stream area is almost fully depending on the geological condition of the area (net concentration of apatite-P in the parent rocks).
In the mid-lower reaches of the Tone River, the sediment P forms content is shifting from apatite-P dominated towards Fe- and Al-bound P (in this study Fe-P). This is due to the presence of iron and aluminum-rich soils in the watershed, as well as inputs from wastewater treatment plants and other point sources. Another reason for this shift is that apatite-P can be converted to iron-bound P through several steps (diagenesis). In general, this process involves the dissolution of apatite particles, which releases the P, followed by the precipitation of iron oxide/hydroxide minerals that bind the P (Palmer-Felgate et al., 2011). The dissolution of apatite particles can be influenced by a number of factors, including pH, temperature, and the concentration of other ions in the water (Yang et al., 2017; Shi et al., 2020). The surface area-to-volume ratio of the river bottom sediment particles can also play an important role in the dissolution process. Finer sediment particles have a greater surface area per unit volume than coarser sediment particles, which means that they can potentially dissolve more apatite particles and release more P into the water (Green et al., 2014; Liao et al., 2015; Zhou et al., 2019), this was also observed in this study.
As the Tone River flows downstream towards the estuary, inputs of organic matter and nutrients from agricultural and urban sources lead to an increase in the organic- P fraction in the sediments. While the bottom sediments in the up-, middle- and downstream of the Tone River were dominated by inorganic P forms, the mixing zone was dominated by org-P form. This change occurs due to a variety of factors. Water chemistry can influence the transformation of P forms. Changes in pH, redox potential, and the concentration of other ions, such as iron and aluminium can affect the solubility and reactivity of P compounds. For example, under reducing conditions, iron-bound phosphorus (Fe-P) can be converted to organic phosphorus (Org-P) through microbial processes such as microbial degradation of organic matter and/or microbial reduction of Fe(III) to Fe(II). The microbial processes result in the formation of organic molecules that incorporate phosphorus in their structure and contribute to the build-up of organic phosphorus in soils and sediments (Reddy and DeLaune, 2008; Chen et al., 2017; Liu et al., 2021). Sedimentation processes can also play a role in the transformation of P forms. The accumulation of organic matter and other sediment components can create anoxic conditions that promote the conversion of inorganic P to organic P. Land use and management practices can have a significant impact on P transformation in aquatic systems. Human activities such as agriculture, urbanization, and wastewater treatment can introduce organic matter and nutrients to aquatic systems, which can promote the formation of organic P (Sharpley et al., 2000; Schindler et al., 2008).
Lake Kasumigaura is also an important source of P to the Tone River. Several studies have shown that Lake Kasumigaura is a major source of dissolved reactive phosphorus (DRP) to the Tone River. The DRP inputs from Lake Kasumigaura can have a significant impact on downstream P dynamics, especially during periods of high flow and low dilution capacity in the river (Fujimoto et al., 2017; Nagano et al., 2020). This study showed that in addition to DRP, Lake Kasumigaura can also be a source of particulate phosphorus (PP) to the Tone River. PP is a less bioavailable form of P that is bound to sediment particles and can be transported downstream during high-flow events. While PP is generally considered to be less of a concern for eutrophication than DRP, it can still contribute to sediment accumulation and enhance P forms change in the downstream portion of the Tone River.
In summary, understanding the changes in phosphorus forms in the Tone River is critical for managing its water quality and the associated ecological impacts. This study highlights the importance of considering natural factors, such as geology and sediment particle size, as well as anthropogenic factors, such as land use and wastewater inputs, in understanding the distribution and transformation of phosphorus forms in the river. This knowledge can help inform effective management strategies to reduce nutrient pollution and maintain the health of the river ecosystem.
Data availability statement
The raw data supporting the conclusion of this article will be made available by the authors, without undue reservation.
Author contributions
RK designed the study, generated and analyzed the datasets, and wrote the manuscript. YU and MY designed the study, joined field surveys, and revised the manuscript.
Funding
This work was supported by JSPS KAKENHI project (22A402), MacroCoast (Macro coastal oceanography: integrated simulation for the material dynamics from the land through the open ocean).
Acknowledgments
We express our gratitude to Y. Arata for the assistance provided with sediment grain size analysis, and to Captain Hidaka for facilitating the collection of river sediments. We are also grateful to Y. Tashiro, M. Inada, R. Ueba for supporting field research and sample analyses in the laboratory. Furthermore, we would like to thank Editor and Reviewers for their valuable contribution towards enhancing the quality of this manuscript.
Conflict of interest
The authors declare that the research was conducted in the absence of any commercial or financial relationships that could be construed as a potential conflict of interest.
Publisher’s note
All claims expressed in this article are solely those of the authors and do not necessarily represent those of their affiliated organizations, or those of the publisher, the editors and the reviewers. Any product that may be evaluated in this article, or claim that may be made by its manufacturer, is not guaranteed or endorsed by the publisher.
Supplementary material
The Supplementary Material for this article can be found online at: https://www.frontiersin.org/articles/10.3389/feart.2023.1060312/full#supplementary-material
SUPPLEMENTARY TABLE S1 | Sampling site information.
SUPPLEMENTARY TABLE S2 | Grain size distribution in bottom sediments of the Tone River.
SUPPLEMENTARY FIGURE S1 | (A) TP changes in Lake Kasumigaura. (B) Lake Kasumigaura sediment accumulation.
References
Andrieux-Loyer, F., and Aminot, A. (2001). Phosphorus forms related to sediment grain size and geochemical characteristics in French coastal areas. Estuar. Coast. Shelf Sci. 52, 617–629. doi:10.1006/ecss.2001.0766
Bidle, K. D., Manganelli, M., and Azam, F. (2002). Regulation of Oceanic silicon and carbon preservation by temperature control on bacteria. Science 298, 1980–1984. doi:10.1126/science.1076076
Chen, C., Huang, C., Wong, M. H., Wong, J. T. F., and Sun, W. (2017). Microbial conversion of inorganic phosphorus to organic forms in soils: Progress and prospects. Chemosphere 184, 594–600. doi:10.1016/j.chemosphere.2017.06.025
Coppola, L., Gustafsson, O., Andersson, P., and Axelsson, P. (2005). Fractionation of surface sediment fines based on a coupled sieve-SPLITT (split flow thin cell) method. Water Res. 39, 1935–1945. doi:10.1016/j.watres.2005.04.005
Coppola, L., Gustafsson, O., Andersson, P., Eglinton, T. I., Uchida, M., and Dickens, A. F. (2007). The importance of ultrafine particles as a control on the distribution of organic carbon in Washington Margin and Cascadia Basin sediments. Chem. Geol. 243, 142–156. doi:10.1016/j.chemgeo.2007.05.020
Doering, P. H., Oviatt, C. A., Nowicki, B. L., Klos, E. G., and Reed, L. W. (1995). Phosphorus and nitrogen limitation of primary production in a simulated estuarine gradient. Mar. Ecol. Prog. Ser. 124, 271–287. doi:10.3354/meps124271
Filippelli, G. M., Souch, C., Menounos, B., Slater-Atwater, S., Jull, A. J. T., and andSlaymaker, O. (2006). Alpine lake sediment records of the impact of glaciation and climate change on the biogeochemical cycling of soil nutrients. Quat. Res. 66, 158–166. doi:10.1016/j.yqres.2006.03.009
Fisher, T. R., Peele, E. R., Ammerman, J. W., and Harding, L. W. (1992). Nutrient limitation of phytoplankton in chesapeake bay. Mar. Ecol. Prog. Ser. 82, 51–63. doi:10.3354/meps082051
Fujimoto, K., Ito, S., Otsuka, S., and Nakamura, T. (2017). Spatial and temporal variations in the phosphorus distribution in the Tone River basin, Japan. J. Hydro-environment Res. 16, 1–16. doi:10.1007/s11356-017-9361-1
Golterman, H. L. (2001). Phosphate release from anoxic sediments or ‘What did Mortimer really write? Hydrobiologia 450, 99–106. doi:10.1023/a:1017559903404
Green, S. A., Stott, A. W., Ritsema, C. J., and Geissen, V. (2014). The dissolution of apatite in soils: A review of mechanisms, modelling approaches and controlling factors. Earth-Science Rev. 139, 47–58. doi:10.1016/j.earscirev.2014.09.001
GSI (2021). Geospatial information authority of Japan. Available at: https://www.gsi.go.jp/kankyochiri/kanto-kasumigaura.html (Accessed December, 2021).
Hartmann, J., Moosdorf, N., Leuerwald, R., Hinderer, M., and West, A. J. (2014). Global chemical weathering and associated p-release — The role of lithology, temperature and soil properties. Chem. Geol. 363, 145–163. doi:10.1016/j.chemgeo.2013.10.025
Hayashi, M., Yanagi, T., and Hashimoto, T. (2000). Standing stock ratios of nitrogen and phosphorus in the Seto Inland Sea. Oceanogr. Jpn. 9, 83–89. doi:10.5928/kaiyou.9.83
Holland, H. D. (1984). The chemical evolution of the atmosphere and oceans. Princeton, New Jersey, United States: Princeton University Press.
Kohler, J., Hilt, S., Adrian, R., Nicklisch, A., Kozerski, H. P., and Walz, N. (2005). Long-term response of a shallow, moderately flushed lake to reduced external phosphorus and nitrogen loading. Freshw. Biol. 50, 1639–1650. doi:10.1111/j.1365-2427.2005.01430.x
Koriyama, M., Hayami, Y., Koga, A., Yamamoto, K., Insasetyo, A., Hamada, T., et al. (2013). Seasonal variations of water column nutrients in the inner area of Ariake Bay, Japan: The role of muddy sediments. Environ. Monit. Assess. 185, 6831–6846. doi:10.1007/s10661-013-3068-8
Krom, M. D., Brenner, S., Kress, N., and Gordon, L. I. (1991). Phosphorus limitation of primary productivity in the eastern Mediterranean Sea. Limnol. Oceanogr. 36, 424–432. doi:10.4319/lo.1991.36.3.0424
Krom, M. D., Emeis, K. C., and Van Cappellen, P. (2010). Why is the Eastern Mediterranean phosphorus limited? Prog. Oceanogr. 85, 236–244. doi:10.1016/j.pocean.2010.03.003
Kubo, A., Hashihama, F., Kanda, J., Horimoto-Miyazaki, N., and Ishimaru, T. (2019). Long-term variability of nutrient and dissolved organic matter concentrations in Tokyo Bay between 1989 and 2015. Limnol. Oceanogr. 64, 209–222. doi:10.1002/lno.10796
Lazarri, P., Solidoro, C., Salon, S., and Bolzon, G. (2015). Spatial variability of phosphate and nitrate in the Mediterranean Sea: A modeling approach. Deep Sea Res. Part I Oceanogr. Res. Pap. 108, 39–52. doi:10.1016/j.dsr.2015.12.006
Liao, Q., Xie, X., and Huang, Q. (2015). Effects of sediment grain size on the characteristics of phosphorus release from sediments in a eutrophic lake. Environ. Sci. Pollut. Res. 22 (13), 10027–10035. doi:10.1007/s11356-015-4347-x
Liu, B., Gao, C., Zeng, Q., and Huang, Q. (2021). The role of microorganisms in the transformation of iron-bound phosphorus in paddy soils: A review. J. Soils Sediments 21 (6), 2496–2509. doi:10.1007/s11368-020-02607-2
Liu, S., Wang, X., Zhang, L., Zhang, Y., and Yang, Y. (2018). Effects of extraction conditions on different forms of phosphorus in sediments of three Chinese shallow lakes. J. Soils Sediments 18 (1), 283–291. doi:10.1007/s11368-017-1754-4
Mainstone, C., and Parr, W. (2002). Phosphorus in rivers – ecology and management. Sci. Total Environ. 282, 25–47. doi:10.1016/S0048-9697(01)00937-8
Makarov, M. I., Haumaier, L., and Zech, W. (2002). Nature of soil organic phosphorus: An assessment of peak assignments in the diester region of 31P NMR spectra. Soil Biol. Biochem. 34, 1467–1477. doi:10.1016/S0038-0717(02)00091-3
Muta, N., Umezawa, Y., Yamaguchi, A., Suzaki, H., Wada, M., Nakata, H., et al. (2019). Estimation of spatiotemporal variations in nutrient fluxes from sediments in the seasonally hypoxic Omura Bay, Japan. Limnology 21, 341–356. doi:10.1007/s10201-019-00591-1
Nagano, M., Yoshimura, C., Hayashi, K., and Tsuda, R. (2020). Importance of Lake Kasumigaura as a phosphorus source to the Tone River during baseflow conditions. Limnology 21 (1), 67–77. doi:10.1007/s10201-019-00617-6
Nezat, C. A., Blum, J. D., Yanai, R. D., and Park, B. B. (2008). Mineral sources of calcium and phosphorus in soils of the northeastern United States. Soil Sci. Soc. Am. J. 72, 1786–1794. doi:10.2136/sssaj2007.0344
Okamoto, T., and Ikeda, H. (2000). Origins of the silt bed section at the down-stream area of the Tone river. Bull. Terr. Environ. Res. Cent. Univ. Tsukuba 1, 35–41.
Oxmann, J. F., Pham, Q. H., and Lara, R. J. (2008). Quantification of individual phosphorus species in sediment: A sequential conversion and extraction method. Eur. J. Soil Sci. 59, 1177–1190. doi:10.1111/j.1365-2389.2008.01062.x
Oxmann, J. F., Pham, Q. H., Schwendenmann, L., Stellman, J. M., and Lara, R. J. (2010). Mangrove reforestation in Vietnam: The effect of sediment physicochemical properties on nutrient cycling. Plant Soil 326, 225–241. doi:10.1007/s11104-009-0003-4
Palmer-Felgate, E. J., Bowes, M. J., Stratford, C., Neal, C., and MacKenzie, S. (2011). Phosphorus release from sediments in a treatment wetland: Contrast between DET and EPC0 methodologies. Ecol. Eng. 37, 826–832. doi:10.1016/j.ecoleng.2010.12.024
Peng, H., Jiang, A., and Wang, H. (2021). Adsorption and desorption characteristics of phosphorus on sediments in Panzhihua section of Jinsha River, China. IOP Conf. Ser. Earth Environ. Sci. 651, 042059. doi:10.1088/1755-1315/651/4/042059
Rahutomo, S., Kovar, J. L., and Thompson, M. L. (2019). Phosphorus transformations in stream bank sediments in Iowa, USA, at varying redox potentials. J. Soils Sediments 19, 1029–1039. doi:10.1007/s11368-018-2139-4
Rao, Ji-L., and Berner, R. A. (1997). Time variations of phosphorus and sources of sediments beneath the chang jiang (yangtze river). Mar. Geol. 139, 95–108. doi:10.1016/s0025-3227(96)00100-4
Reddy, K. R., Kadlec, R. H., Flaig, E., and Gale, P. M. (1999). Phosphorus retention in streams and wetlands: A review. Crit. Rev. Environ. Sci. Technol. 29, 83–146. doi:10.1080/10643389991259182
Reddy, K. R., and DeLaune, R. D. (2008). Biogeochemistry of wetlands: Science and applications. Boca Raton, Florida, United States: CRC Press. ISBN: 9781420053521.
Reimann, C., and de Caritas, P. (1998). Chemical elements in the environment. Berlin-Heidelberg: Springer-Verlag, 398.
Ruttenberg, K. C. (1992). Development of a sequential extraction method for different forms of phosphorus in marine sediments. Limnol. Oceanogr. 37, 1460–1482. doi:10.4319/lo.1992.37.7.1460
Ruttenberg, K. C. (2004). The global phosphorus cycle. Treatise Geochem. 8, 585–643. doi:10.1016/B0-08-043751-6/08114-0
Schindler, D. W., Hecky, R. E., Findlay, D. L., Stainton, M. P., Parker, B. R., Paterson, M. J., et al. (2008). Eutrophication of lakes cannot be controlled by reducing nitrogen input: Results of a 37-year whole-ecosystem experiment. Proc. Natl. Acad. Sci. 105 (32), 11254–11258. doi:10.1073/pnas.0805108105
Sharpley, A., Metcalf, J. A., and Withers, P. J. A. (2000). Phosphorus inputs and eutrophication of receiving waters: A review. J. Environ. Qual. 29 (1), 28–36. doi:10.2134/jeq2000.00472425002900010005x
Shi, L., Wang, D., Qian, L., Hellio, C., Fauchon, M., Trepos, R., et al. (2020). Reduction of potential ennoblement of stainless steel in natural seawater by an ecofriendly biopolymer. J. Environ. Chem. Eng. 8 (1), 103609. doi:10.1016/j.jece.2019.103609
Simon, N. S., Lynch, D., and Gallaher, T. N. (2009). Phosphorus fractionation in sediment cores collected in 2005 before and after onset of an Aphanizomenon flos-aquae bloom in upper Klamath Lake, OR, USA. Water Air Soil Pollut. 204, 139–153. doi:10.1007/s11270-009-0033-9
Turner, S. J., Flindell, P. A., Hendri, D., Hardjana, I., Lauricella, P. F., Lindsay, R. P., et al. (1994). Sediment-hosted gold mineralisation in the ratatotok district, north sulawesi, Indonesia. J. Geochem. Explor. 50, 317–336. doi:10.1016/0375-6742(94)90029-9
Vilas, F., Bernabeu, A. M., and Mendez, G. (2005). Sediment distribution pattern in the rias baixas (NW Spain): Main facies and hydrodynamic dependence. J. Mar. Syst. 54, 261–276. doi:10.1016/j.jmarsys.2004.07.016
Wakamatsu, T., Konohira, E., Shindo, J., Yoshioka, T., Okamoto, K., Itaya, A., et al. (2006). Dissolved inorganic phosphate concentration in stream water in Japan and factors controlling the concentration. J. Jpn. Soc. Water Environ. 29, 679–686. doi:10.2965/jswe.29.679
Wang, L., Ye, M., Li, Q., Zou, H., and Zhou, Y. (2013). Phosphorus speciation in wetland sediments of Zhujiang (Pearl) river estuary, China. Chin. Geogr. Sci. 23, 574–583. doi:10.1007/s11769-013-0627-4
Weigelhofer, G., Hein, T., and Bondar-Kunze, E. (2018). Phosphorus and nitrogen dynamics in riverine systems: Human impacts and management options. Riverine ecosystem management. Aquat. Ecol. Ser. 8, 187–202. doi:10.1007/978-3-319-73250-3_10
Williams, P. M. (1969). Organic and inorganic constituents of the amazon river. Nature 218, 937–938. doi:10.1038/218937a0
Withers, P., and Jarvie, H. (2008). Delivery and cycling of phosphorus in rivers: A review. Sci. Total Environ. 400, 379–395. doi:10.1016/j.scitotenv.2008.08.002
Yang, J., Li, J., Li, M., and Zhou, Q. (2017). The effect of pH and temperature on the dissolution of hydroxyapatite nanoparticles in aqueous solution. J. Environ. Sci. 51, 109–118. doi:10.1016/j.jes.2016.06.018
Zhang, K., Cheng, P., Zhong, B., and Wang, D. (2012). Total phosphorus release from bottom sediments in flowing water. J. Hydrodynamics, Ser. B 24, 589–594. doi:10.1016/S1001-6058(11)60281-3
Zheng, M., Zhu, B., Han, X., and Morgenroth, E. (2016). Formation of aerobic granules for the treatment of real and low-strength municipal wastewater using a sequencing batch reactor operated at constant volume. Water Res. 106, 341–350. doi:10.1016/j.watres.2016.09.007
Keywords: phosphorus, surface sediments, parent rock, sediment transport, grain size
Citation: Kozyrev R, Umezawa Y and Yoh M (2023) Total phosphorus and phosphorus forms change in sediments along the Tone River. Front. Earth Sci. 11:1060312. doi: 10.3389/feart.2023.1060312
Received: 03 October 2022; Accepted: 16 March 2023;
Published: 28 March 2023.
Edited by:
Youhei Yamashita, Hokkaido University, JapanReviewed by:
Bernhard Wehrli, ETH Zürich, SwitzerlandTakeshi Yoshimura, Hokkaido University, Japan
Richard James Cooper, University of East Anglia, United Kingdom
Copyright © 2023 Kozyrev, Umezawa and Yoh. This is an open-access article distributed under the terms of the Creative Commons Attribution License (CC BY). The use, distribution or reproduction in other forums is permitted, provided the original author(s) and the copyright owner(s) are credited and that the original publication in this journal is cited, in accordance with accepted academic practice. No use, distribution or reproduction is permitted which does not comply with these terms.
*Correspondence: Yu Umezawa, dW1lemF3YUBtZS50dWF0LmFjLmpw