- 1Earth and Environmental Science Area, Lawrence Berkeley National Laboratory, Berkeley, CA, United States
- 2Department of Earth, Environmental and Planetary Sciences, Rice University, Houston, TX, United States
Standard rock physics models are formulated to describe the behavior of porous sedimentary reservoirs, with clean sandstones being the archetypal system; however, many situations demand geophysical monitoring of rocks with significantly different structures, such as low porosity, fractured reservoirs. Conventional models also suggest that these “stiff” reservoirs can be challenging to monitor seismically due to small fluid substitution effects, but the presence of fractures leads to stress dependence which may be leveraged for remote monitoring purposes. Using samples from the Duperow Formation (dolostone) obtained from the Danielson test well in Kevin Dome, MT, we conducted ultrasonic and multi-scale structural (profilometry, synchrotron micro-tomography, pressure sensitive film) measurements on naturally fractured core in order to characterize the effects of fluid substitution and effective stress on the acoustic response of fractured reservoir rock with a focus in particular on the textural and seismic characteristics of natural fractures. We find that changes in effective stress can yield changes in velocity of up to 20% and changes in attenuation up to 200%. Measured fluid substitution effects are resolvable, but stress effects dominate. These measurements provide insight into the physical processes controlling acoustic response of fractured rocks in general and can also be used to inform monitoring efforts in fractured reservoirs.
1 Introduction
1.1 Background
The overarching goal of rock physics is to use physical data to create mechanistic models relating geophysical measurements to useful information about the properties of subsurface materials; what information is deemed “useful” is a matter of which questions are asked. Historically, rock physics has been used primarily to detect and map hydrocarbon reservoirs (e.g., Wyllie et al., 1956; Raymer et al., 1980; Mavko et al., 2009, many others; Dvorkin, 2020 for an excellent review), which are generally housed in sedimentary rocks. Conventional reservoirs are often characterized by high porosity and permeability (selected for their viability as economic resources), these properties are relatively isotropically distributed within formations, and the pore fluids are in equilibrium with the formation and therefore unreactive. As a result, the important parameters for producing effective rock physics models are intrinsic quantities like bulk porosity, mineralogy, the relative amounts of pore fluids, and the physical properties of those fluids. As subsurface engineering technologies have developed, so have the complexity of rock physics models, with descriptions of effects like anisotropy and stress dependence accounted for, albeit as second order corrections, to better fit the observations. However, as rock physics moves out of the oil patch, we begin to be faced with new challenges and are forced to ask different questions. When the target formations defy common assumptions, e.g., have low, anisotropic porosity and permeability, when fluids are out of equilibrium and reactive, nontraditional effects begin to dominate. Lower injectivity can lead to higher pumping pressures and low effective stresses. In this paper, we present a case study of the acoustic response of a nontraditional reservoir rock, a naturally fractured dolomite. The data indicate that under certain conditions, particularly at low effective stress, the state of stress exerts primary control of the acoustic response of the sample.
Our study focuses on core samples from Kevin Dome, Montana. The particular rock we study is the Duperow dolomite, a relatively low porosity carbonate with pre-existing fractures. This sample location was chosen because it was the site of a pilot geological carbon storage (GCS) project and the unconventional characteristics of the potential reservoir illustrate the challenges of interpreting the physical behavior of such materials for advanced subsurface engineering efforts such as GCS. The focus of this study was to make high quality measurements of a single naturally fractured sample accompanied by extensive characterization of the fracture. The power of this approach is that it allows us to test hypotheses about the mechanism of changes in velocity and attenuation with stress. The results of this study should be seen as complementary to less microstructurally detailed studies with larger numbers of samples measure.
In this paper, we present the results of a suite of ultrasonic tests to investigate the role of pore fluid substitution and changes in effective stress on the seismic characteristics of fractured carbonate rock. We also investigate the role of natural fracture features, e.g., asperity distribution, permeability, on the acoustic response of the system as a function of stress and fluid properties. Anisotropy of both shear wave velocity and shear attenuation are also measured. Our results show that at low effective stress, nonlinear stress effects dominate fluid effects, suggesting strategies for using seismic data to infer stress state in the subsurface.
1.2 Sample description
As mentioned previously, this study focuses on samples from the Kevin Dome site near Kevin, MT, evaluated by the Big Sky Carbon Sequestration Partnership (BSCSP) as part of a broader study. The project focused on potential CO2 storage in the Devonian age Duperow Formation, a marine carbonate unit dominated by dolostones. The Duperow formation also contains natural accumulations of CO2 at some locations at the crest of Kevin Dome, likely sourced from intrusive igneous activity in the nearby Sweetgrass Hills. The test site and broader structure were also the target of a 3D 9C characterization survey as documented by Clochard et al. (2018), the baseline of a proposed 4D 9C dataset.
At the test location, the Duperow has multiple seals including the tight upper Duperow and the Potlach Anhydrite, a ∼53 m thick regional seal. The Duperow formation sits above the Souris River and below the Niskiu Limestone at. Samples were obtained from two test wells drilled by BSCSP, the Danielson 33–17 well (test producer) and the Wallewein 22-1 well (test injector), both of which terminated in the Souris River formation. Extensive continuous core was acquired from both wells in addition to an extensive log suite (Spangler et al., 2020). A key goal in selection of samples from each well was to explore the seismic response of natural fractures in the Duperow that would be relevant to 4D seismic response, i.e., fractures with as close to intact morphologies as possible. Since the Middle Duperow was the proposed injection target, our study focused on naturally fractured sections of this subunit; Omosebi et al. (2018) provides a broader description of the Duperow at the site and the associated depositional setting.
In order to find candidate samples, cores from the Danielson and Wallewein wells were inspected. We identified a natural fracture at 1,029.9 m (3,379 ft) in core from the Danielson well (Figures 1C, D). A 38 mm diameter by 25.4 mm long subcore and several 8 mm by 25.4 mm subcores that intersect the natural fracture were cored and precision ground to assure planar, parallel faces (Figure 1E). The fracture appears partially mineralized, but came apart easily. An additional 38 mm diameter by 25.4 mm long subcore of intact rock was also made and analyzed for comparison to the fractured sample.
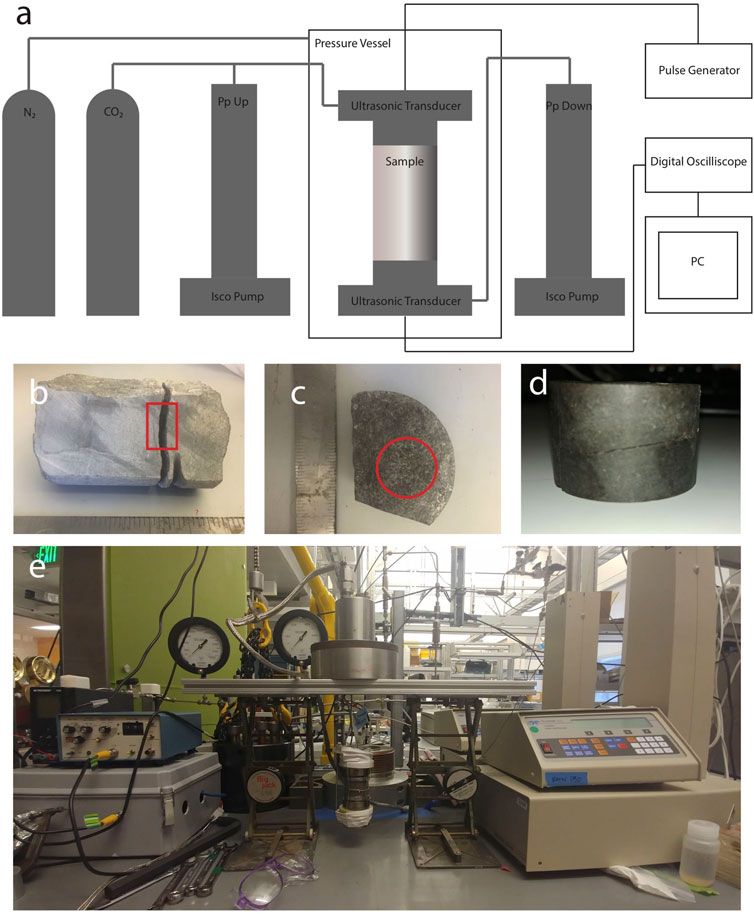
FIGURE 1. Experimental apparatus and sample. (A) Schematic of high-pressure ultrasonic setup, (B) side view of naturally fractured core from Danielson well, red outline indicates the location the sub-sample was taken from, (C) top view of the core with sub-sample location in red, (D) final 38.1 mm diameter sub-core with square, polished ends showing natural, through-going fracture, (E) picture of jacketed sample and experimental apparatus.
The carbonate matrix for the samples was dense; processed density and neutron logs indicated a bulk porosity near the core from which the sample was taken of 3.6%. A non-fractured plug taken near this sample 1,029.5 m (3,377.61 ft) exhibited a gas permeability of 0.01 mD under 2.76 MPa (400 psi) of confinement and a helium porosity of 3.41% (Spangler et al., 2020). Both secondary measurements suggest that any flow in this section of the Duperow would likely be dominated by fracture rather than matrix permeability.
2 Methods
2.1 Profilometry
Once machined, the cores were imaged using a white light profilometer to characterize the structural characteristics of the surface. Surface topography was directly measured using an optical scanning profilometer (Nanovea PS50∕ 3000 μm optical pen). The spatial resolution was 50 μm along the fracture surface and 0.5 μm in height. Once collected, the data was imported into MATLAB (MathWorks) for analysis. The natural fracture from the large sample was rough with a relief of ∼4 mm, and was very well mated.
2.2 Pressure sensitive film
Pressure sensitive film was used to measure the changing real contact area and local stress with normal stress on the fracture, similar to the approach of Saltiel et al. (2017). The same sample used for ultrasonic tests was put in a uniaxial press and Fujifilm Prescale medium range (12–50 MPa) pressure-sensitive film placed in the fracture. A nominal normal stress of 0.1–15 MPa was applied to the sample and held for 5 min. The imprint left on the film was then digitized and a calibration applied (Selvadurai and Glaser, 2015) to quantify the local stress on asperities. Beyond 6 MPa, the local stress at asperities saturated (>50 MPa) and accurate measurements could not be made. The calibration and data analysis were performed using MATLAB.
2.3 Synchrotron x-ray microtomography
Synchrotron x-ray microtomography was performed at beamline 8.3.2 at the Advanced Light Source (ALS). The sample was scanned using white light and an optical chain consisting of a 500 mm Ce-doped LuAG scintillator (Crytur), 2x Mitutoyo objective lenses with long working distance (0.055 numerical aperture), and a pco.edge 2,560 pixel × 2,160 pixel sCMOS detector, resulting in a pixel size of 3.22 microns with a lateral FOV of 8.24 mm. Small (8 mm) cores from the same fracture used for ultrasonic tests were measured. Samples were jacked and put in an X-ray transparent triaxial pressure vessel (e.g., Voltolini et al., 2017) and subjected to hydrostatic pressures from 0 to 15 MPa. Scans were collected after steps of several MPa to capture high resolution images of changes in the fracture aperture with confining stress. Once the data was reconstructed, an anisotropic diffusion filter was applied using ImageJ to reduce noise and the fracture was thresholded out from the solid carbonate. The data was then imported into MATLAB for further analysis.
2.4 Ultrasonic tests
The high-pressure ultrasonic system consists of a bolted closure pressure vessel (High Pressure Equipment) with several electrical feed-throughs (Connex), within which high-pressure ultrasonic transducer assemblies (New England Research) are installed. A schematic of the experimental apparatus is presented in Figure 1A. The ultrasonic transducers have a central frequency between 500 kHz and 1 MHz and are capable of recording P-waves and two orthogonally polarized S-waves and are driven by a high voltage pulser (Panametrics 5077 PR) at 100 V. Waveforms are captured with a digital oscilloscope (Tektronix DPO3014) and transferred to MATLAB for analysis. The coreholders are plumbed to two high-pressure syringe pumps (ISCO HP500) allowing upstream and downstream pore fluid pressure control and well as allowing for flow through and pore fluid replacement at high pressure. Confining pressure is provided by a pressurized nitrogen gas cylinder and regulator.
The sample was jacketed with compliant rubber and loaded into the pressure vessel with ultrasonic transducers and a thermocouple. Assuming a lithostatic overburden (27 MPa) and hydrostatic pore pressure (10 MPa), the approximate in situ effective stress at 1,029.9 m would be 17 MPa. While dry, the sample was loaded to 17 MPa effective stress at a rate of 0.7 MPa/minute. The pressurization caused an increase in pressure vessel temperature, so the sample was then allowed to equilibrate until thermal equilibrium was reached for at least 10 min. Ultrasonic velocity measurements were made at several effective stress during a depressurization cycle. Measurements were made only after thermal equilibrium from depressurization steps was complete. The sample was then flooded with 200 ppm NaCl brine and air bubbles purged using a vacuum pump. Maintaining an effective stress of 1 MPa, the pore pressure and confining pressure were then raised to 10 and 11 MPa, respectively. The pore pressure was then held constant as the confining pressure was raised to 27 MPa and the temperature allowed to equilibrate. Ultrasonic measurements were made at several effective stresses during a depressurization cycle and the sample was allowed to equilibrate thermally between each step. The brine was then replaced by carbon dioxide until the sample was thoroughly dry. Maintaining an effective stress of 1 MPa, the pore pressure and confining pressure were once again raised to 10 and 11 MPa, respectively. At room temperature (22°C) and 10 MPa, carbon dioxide is a liquid. The pore pressure was again held constant as the confining pressure was raised to 27 MPa and the temperature allowed to equilibrate. Ultrasonic measurements were made at several effective stresses during a depressurization cycle and the sample was allowed to equilibrate thermally b1etween each step. On the timescales of these measurements, it is unlikely a significant proportion of the scant pore space within the un-fractured matrix of the fractured sample is saturated. The unfractured core was measured using the same loading procedure, but with no pore fluid. An example of the data collected during a single pressure cycle is presented in Figure 2.
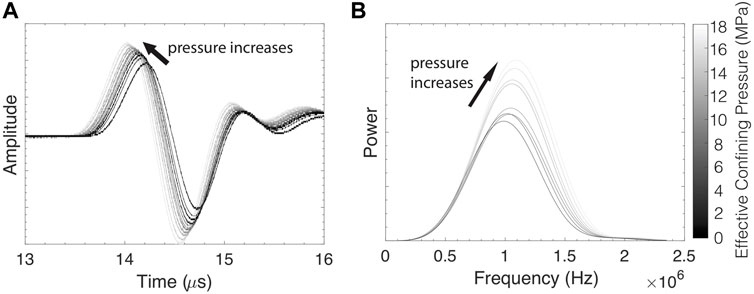
FIGURE 2. (A) P-waves and (B) power spectra from 0.2 MPa to 17 MPa effective stress for the sample saturated with brine. Both quantities are presented in arbitrary units. Darker shades indicate lower pressures. Increasing pressure leads to a systematic reduction of the first arrival time and an increase in the spectral centroid and maximum amplitude.
2.5 Waveform analysis
512 waveforms were collected and averaged at each condition. Collected data was of high quality (high signal-to-noise ratio), so no filters were applied to waveforms prior to analysis. Waveform first arrivals were determined by manually picking a first arrival for the highest effective stress and using a cross-correlation method to determine successive lags. The largest uncertainty in calculated velocities is from the single manual pick, which we estimate to be ±10 m/s and would be systematic at every stress condition. Velocities were calculated using the measured sample length and assuming the length was constant during experiments.
We calculate Q using the spectral centroid shift method (Quan and Harris, 1997) using an aluminum sample as a high-Q standard for spectral comparison. The attenuation coefficient,
where
where v is the wave velocity.
Spectral analysis was performed using only the first arriving waveform and windowed using a half-cosine taper, following the method of Pyrak-Nolte et al., 1990. VS anisotropy is presented as the ratio of the fast polarization to the slow polarization and QS anisotropy is presented as the ratio of the high-Q polarization to the low-Q polarization.
3 Results
3.1 Effect of pore fluid
The Duperow dolomite is generally a low porosity formation, as is this sample in particular, so the amount of fluid injected per unit volume is small. As such, the effect of fluid substitution is expected to be small. Our observations show this to be true; however, measurable differences between the response of the sample saturated with different fluids types do exist. Plots of the ultrasonic velocities as a function of effective stress are presented in Figure 3. Consistently, the sample saturated with atmospheric pressure air has the slowest velocities. This is true for both VP and both polarizations of VS (Figures 3A, B). The sample saturated with liquid carbon dioxide at 10 MPa has intermediate velocities and the sample saturated with brine has the highest velocities. The pore fluid has no discernable effect on VP/VS (Figure 3C) or shear anisotropy (Figure 3D) in the fractured sample.
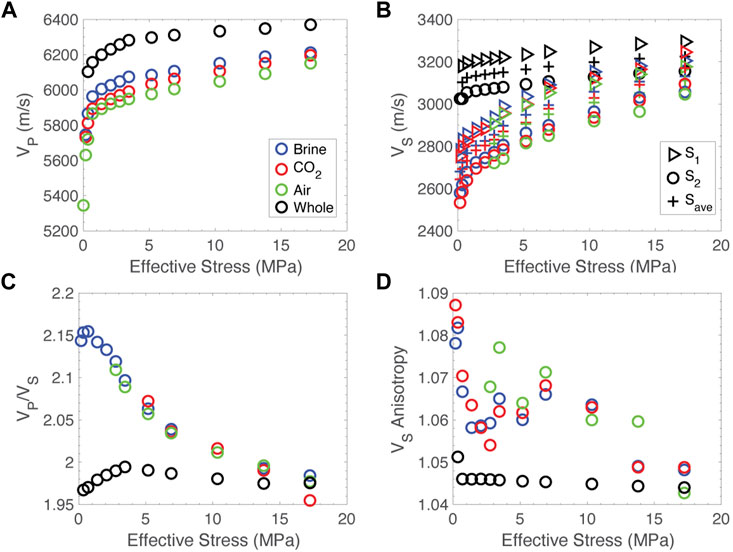
FIGURE 3. Velocity data for all experiments. Data from the fractured sample saturated with air are in green, carbon dioxide in red and brine in blue. Data from the whole core are in black. (A) P-wave velocity versus effective stress, (B) S-wave velocity versus effective stress. S1 is triangular symbols, S2 is circles and the average of the two is crosses. (C) VP/VS versus effective stress. (D) Shear velocity anisotropy versus effective stress.
More information can be gained by looking at the attenuation or quality factor, Q, of the samples. Q data are presented in Figure 4. Similar to velocity, the fractured sample saturated with air has the lowest Q, carbon dioxide intermediate and brine the highest. This is consistent for both QP and both polarizations of QS (Figures 4A, B). The sample saturated with air shows slightly elevated QP/QS compared to carbon dioxide and brine, which show very similar values (Figure 4C). For most pressures measured, the sample saturated with air and carbon dioxide exhibits slightly elevated QS anisotropy compared to the sample saturated with brine (Figure 4D).
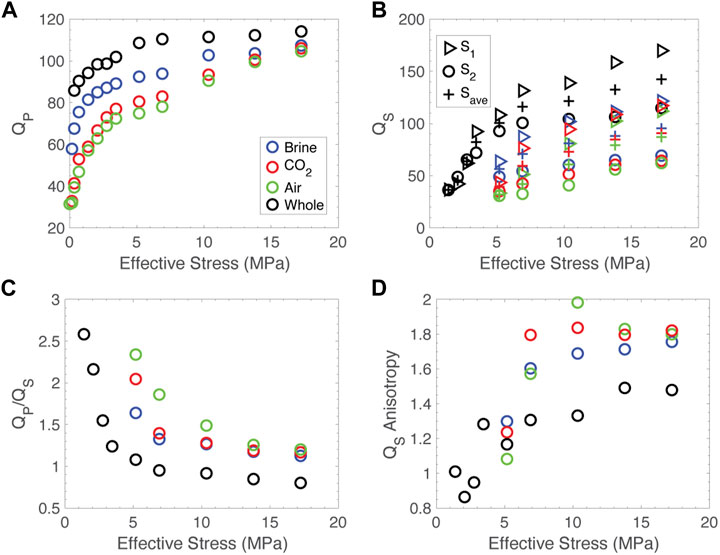
FIGURE 4. Q data for all experiments. Data from the fractured sample saturated with air are in green, carbon dioxide in red and brine in blue. Data from the whole core are in black. (A) QP versus effective stress, (B) QS versus effective stress. S1 is triangular symbols, S2 is circles and the average of the two are crosses. (C) QP/QS versus effective stress. (D) QS anisotropy versus effective stress.
3.2 Effect of effective stress
The large fracture in the sample is appreciably more compliant than the low porosity matrix and pressure dependence of wave velocities are consistent with closure and stiffening of that feature. VP increases by ∼10% between 0 and in-situ stress conditions while VS increases by ∼20% across the pressure range. The largest changes in velocity occur between 0 and 5 MPa, though velocities continue to increase up to in situ stress conditions and the slope of the velocity-pressure curves are near constant between 5 and 17 MPa, indicating that the crack continues to stiffen. Comparison of the data from the fractured sample to the intact sample shows that both VP and VS are faster in the intact sample (Figures 1A, B). The qualitative effective stress dependence of VP in the intact sample is similar to the fractured sample, although there is slightly less stress dependence at the higher stresses. The stress dependence of VS in the intact sample is different than that of the fractured sample, showing less stress dependence over the entire measured stress range. In the fractured sample, VP/VS is reduced as pressure increases. VS is more sensitive to the state of the fracture than VP, so the reduction of VP/VS with pressure is consistent with fracture closure and stiffening. There appears to be a break in the slope of the VP/VS-pressure curve around 5 MPa, which suggests a change in the nature of the crack closure at that point. The intact sample show much less stress dependence in VP/VS with a generally positive trend. The data from the intact sample have the same slope break around 5 MPa, suggesting that this represents a closure stress for microcracks or open grain boundaries. In the fractured sample, VS anisotropy is reduced from near 9% at low pressure to between 4% and 5% at 17 MPa. There is more scatter in this data, but there also appears to be a transition from high pressure dependence to low pressure dependence around 5 MPa. The intact sample shows no stress dependence to shear anisotropy.
Attenuation exhibits similar stress dependence to velocity, though results vary by saturating fluid. In the brine saturated experiment, QP increases from 60 to 100 from 0 to 17 MPa, while air and CO2 saturated samples exhibit a larger increase from initially lower values, from 30 to 100. The whole sample increases from 85 to 110 across the same stress range. QS varies less between saturating fluids, with all fractured samples increasing from ∼50 to 80 between 5 and 17 MPa effective stress. Below 5 MPa, the signals from S-waves in the fractured sample were swamped by converted energy from the P-wave, making it impossible to recover the spectral information necessary to compute QS; however, this observation in itself attests to the substantial reduction of QS below this 5 MPa threshold. The whole sample increases from 40 to 130 over the stress range 2–17 MPa. QP/QS is reduced as pressure is increased for all samples. Without QS values below 5 MPa, we cannot calculate this ratio for very low stress, but stress-dependence is reduced as stress increases. Interestingly, QS anisotropy exhibits the opposite trend to VS anisotropy and increases with stress. Consistently, the stress dependence appears to be greater at low stress. The intact sample exhibits higher QP and QS than the fractured sample at all stresses and consistently lower QP/QS and anisotropy.
4 Discussion
4.1 Comparison to literature
Data from this study are consistent with ultrasonic velocities of dolostones from the literature, but the further information garnered from documenting stress dependence and shear wave anisotropy offer additional insight into the physical processes at play. The ranges of velocities observed in this study, ∼5,600–6,200 m/s for VP and ∼2,500–3,200 m/s for VS, are typical for dolostones with low porosity (Nur and Simmons, 1969; Baechle et al., 2008). However, the pressure dependence of our samples is substantially greater than typically measured. For example, a compilation of ultrasonic velocity pressure dependence data for several carbonate rocks by Anselmetti and Eberli (1993), found changes in velocity of 2%–5% across a similar pressure range, compared to the changes in VP of 10% and VS of up to 20% in our sample. This is likely due to the orientation and compliance of the single fracture in our experiment compared to distributed fractures and equant pores more typical of samples used for ultrasonic characterization. Utilizing similar sample geometry, but loading the sample axially instead of hydrostatically, Pyrak-Nolte et al. (1990) found changes in both VP and VS of 10%–20% across the pressure range 1.4–85 MPa. This is generally comparable to our results, as the stress dependence of velocity is significantly decreased above 10 MPa, although the effect of differences in loading geometry is difficult to assess.
The maximum measured VP/VS in our fractured sample when using an average VS is 2.15, which is observed a low effective stress. This in close agreement with measurements of thermally cracked granite, marble and sandstone (Wang et al., 2012). Rock physics modelling of their data suggested that VP/VS could be in excess of 2.15 in the event of significant fracture anisotropy, although their experimental did not have the data to test this. Using the slow polarization of VS, we recover VP/VS equal to ∼2.25 for the fractured sample, confirming their prediction.
Data on seismic attenuation across single fractures are sparser, but the values we recover are of the same order of previously reported values with some notable exceptions. Comparison of our data to that in the literature suggests discrepancies may be due to methods of data analysis. The spectral ratio method is typically used to calculate attenuation from ultrasonic data. This method requires the selection of an appropriate frequency band across which the spectral ratio of a sample and a known sample are a linear function of frequency. Using this method, values of QP of 46 for salt (Sears and Bonner, 1981), 25 for sandy sediment (Prasad, 2002), and 30 for high porosity carbonates (Adam et al., 2009). Corresponding QS values are 10 for salt, 20 for sediment, and 50 for carbonates. However, it is often the case that a sufficiently linear frequency band cannot be identified and this method cannot be used accurately. Pyrak-Nolte et al. (1990) report this to be the case in their analysis, and therefore apply a slightly modified method to recover values between 8 and 39 for QP and between 12 and 71 for QS.
A recent study of ultrasonic wave propagation across a single joint used a similar modified method to recover QP values between 6 and 13 (Yang et al., 2019). If the original and modified spectral ratio methods of analysis are consistent, that means that more energy is attenuated across a single fracture in an otherwise intact rock sample than in loosely consolidated sediments. It seems possible that this modified method produces artificially low Q values. We also were not able to find a sufficiently linear frequency band across which to calculate Q, so chose instead to use the frequency shift method (Quan and Harris, 1997). This method requires a priori knowledge of the source spectra, but this is easily achievable in the lab, and the results are remarkably consistent and stable without the need to choose a particular frequency band for the analysis. Using this method, we recover values of QP and QS similar to sediments and high porosity carbonates at low pressure when the fracture is open and values more typical of stiff, low porosity rocks at higher pressures when the fracture is closed.
4.2 Fracture microstructures
Close investigation of the physical state of the fracture yields some clues as to the mechanism of the observed changes. Profilometry data from the initial characterization are presented in Figure 5. Initial inspection of the profilometry scan shows that the fracture is slightly inclined, being slightly higher in the upper right quadrant and slightly lower in the lower left quadrant as shown in Figure 5. Additionally, there a linear trend to the topography from the upper left to the lower right. Line profiles parallel and normal to this trend show that the fracture is generally rougher in the lineation normal direction than in the lineation parallel direction. This intrinsic geometric anisotropy is likely what results in the observed anisotropic wave propagation, but still the opposite pressure dependences of attenuation and velocity anisotropy suggest that these two behaviors are the result of different mechanisms.
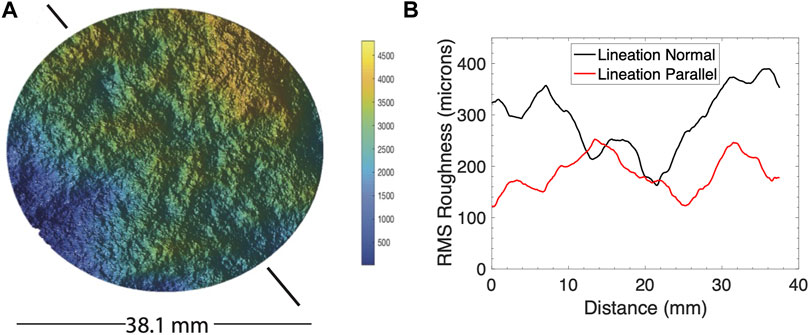
FIGURE 5. Profilometry data. (A) Data from the entire surface shows total relief of nearly 4.5 mm. A lineation is indicated by the black lines extending from the top left to bottom right of the map. (B) Line profiles parallel and normal to the lineation direction show increased roughness normal to the lineation.
As pressure is increased and the fracture deforms, there are two main structural changes: changes in asperities and changes in fracture aperture. To look at changes in asperity geometry and stress state, pressure sensitive film measurements were made at a small range of pressures (Figure 6). Analysis of pressure sensitive film data are presented in Figure 7. It can clearly be seen that both the number and size of asperities grows as stress increases, as would be expected (Figures 7A, B). This in itself does not contain information about anisotropy. Previous theoretical work has suggested that elliptical asperity shape can lead to elastic anisotropy (Misra, 1999). We use asperity shape data from the pressure sensitive film to test this hypothesis. First the asperities are segmented and watershed partitioning used to separate individual asperities. When a best fit ellipse is fit to each asperity, it can be seen that mean asperity eccentricity decreases as the fracture closes (Figure 7C). The evolution of asperity geometry is consistent with the trend we observe in velocity anisotropy. As shear waves do not propagate through fluid-filled voids, it follows that shear waves propagate through asperities, and therefore will be sensitive to the shape of those asperities.
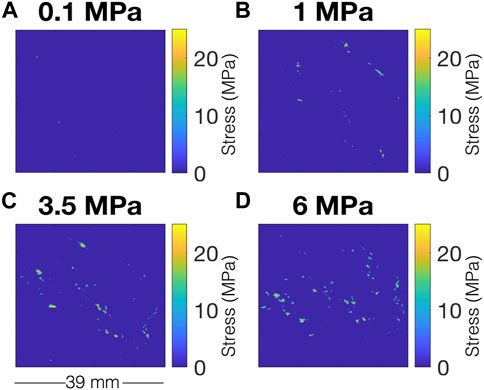
FIGURE 6. Data from pressure sensitive film at (A) 0.1 MPa, (B) 1 MPa, (C) 3.5 MPa and (D) 6 MPa nominal normal stress on the fracture. Colorbar indicates stress in MPa. Real area of contact is a relatively low percentage of the nominal area of the fracture and asperities exhibit significant stress intensification at all nominal stresses.
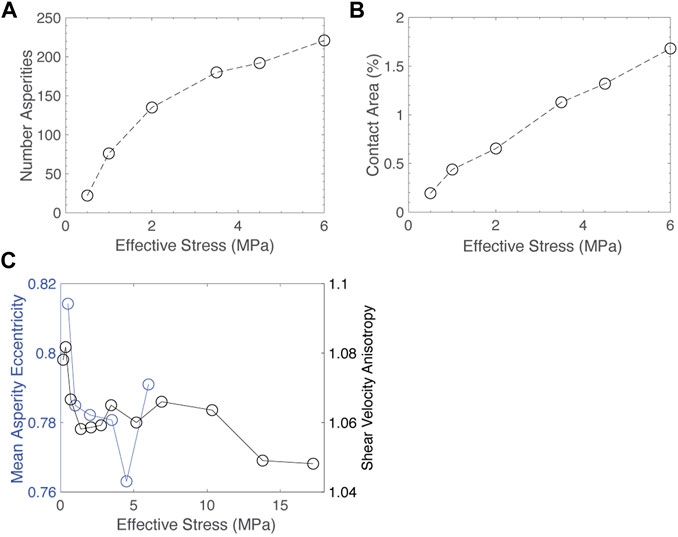
FIGURE 7. Analysis of pressure sensitive film data. (A) Number of asperities versus effective normal stress, (B) Percent real contact area versus effective normal stress and (C) Mean asperity eccentricity versus effective normal stress. Shear anisotropy versus effective stress from ultrasonic experiments is also plotted for reference, using effective effective stress to approximate effective normal stress.
As the fracture closes and asperities grow and evolve, the fracture aperture is also shrinking and its structure evolving. To quantify the changes in the fracture aperture under pressure, we subjected a sample from the same fracture measured in ultrasonic experiments to a range of effective stresss while imaging using synchrotron X-ray microCT. The subcores used for microtomography experiments were displaced roughly 1 cm laterally along the natural from the subcore used for ultrasonic measurement. Using these data, we can measure the structural changes in the fracture during deformation. Aperture maps and quantification of the data are presented in Figures 8, 9. The mean aperture is reduced as confining stress increases and the fracture closes, but several deep channels remain open. The mean aperture is reduced roughly linearly with pressure (Figure 9A), but that cannot explain the changes in attenuation anisotropy. The preferred orientation that was observed from profilometry can be seen in tomography data as well. To assess the effect of this change in structure with pressure, the tomography data was used to set up digital flow simulations and the results were used to calculate the permeability anisotropy of the fracture with pressure (e.g., Zuo et al., 2017). For the purposes of the digital flow simulation, the permeability of the matrix outside the fracture was assumed to be negligible. Permeability anisotropy is increased as pressure is increased and aperture is reduced as more flow is focused in open channels. This effect is greatest at low pressure and levels off at higher pressure. The trend of evolution in permeability anisotropy with pressure is consistent with the trend of shear attenuation anisotropy (Figure 9B). The majority of the attenuation at ultrasonic frequencies is due to scattering of structures comparable in size the wavelength of passing waves, so it is likely the large acoustic impedance contrast between the solid rock and open fracture channels results in this correlation between attenuation and permeability. While the observed shear attenuation in our samples is likely due to scattering, we cannot rule out some degree of poroelastic attenuation in our fractured and saturated experiments. This correlation between shear attenuation and permeability has been predicted by rock physics models (Lissa et al., 2021), although this effect should dominate at lower frequencies.
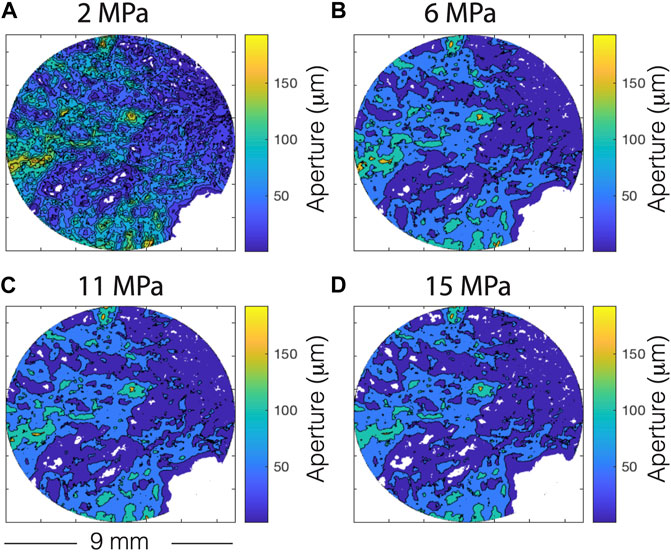
FIGURE 8. Fracture aperture as measured from synchrotron micro-CT at (A) 2 MPa, (B) 6 MPa, (C) 11 MPa and (D) 15 MPa. Colorbar is aperture in microns. White patches are asperities. Sample diameter is 8.92 mm. As pressure increases, asperities grow and the aperture becomes more channelized.
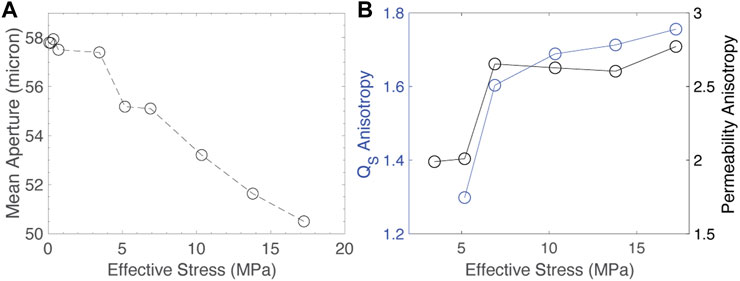
FIGURE 9. Analysis of tomography data. (A) Fracture aperture versus effective stress. (B) Permeability anisotropy from Stokes flow simulations versus effective stress. QS anisotropy versus effective stress from ultrasonic experiments is also plotted for reference.
4.3 Isolated fracture properties
Data from the intact and fractured samples can be used to isolate the properties of the fracture itself, by which we mean the measurable effects the large, single fracture has on the behavior of our sample. These properties are calculated by removing the response of our unfractured sample from that of our fractured sample. First, the velocity data are used to calculate elastic moduli. The expressions for shear modulus, μ, and Young’s modulus, E, are
We use our experimental data to calculate the moduli as a function of effective stress, presented in Figure 10. The shear and Young’s moduli of the intact sample are both greater than those of the fractured sample. The stress dependence of both moduli is lower in the intact sample. In the fractured sample, the brine and carbon dioxide saturated Young’s moduli are very similar, while the moduli of the air saturated sample are consistently lower. This is likely due to the higher compressibility of air compared to liquid brine and carbon dioxide. Interestingly, the shear moduli show greater variation due to different pore fluids. This is contrary to common assumptions about the effect of fluids on shear deformation, although this deviation has been observed before (i.e., Adam et al., 2006).
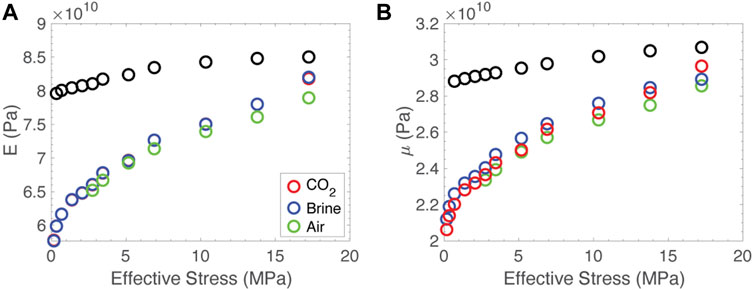
FIGURE 10. Elastic moduli calculated from velocity data. (A) Young’s modulus, E, and (B) shear modulus, μ.
The moduli are related to the inverse of the sample compliance. If we assume the compliance of the intact sample represents the compliance of the matrix, this can be subtracted from the fractured sample compliance to recover the fracture compliance itself. Using the sample geometry, this compliance can be converted to a stiffness. Analogously, the quality factors are the inverse of sample attenuation. If we subtract the attenuation in the intact sample, we can recover the attenuation introduced by the fracture. Fracture-specific stiffness and quality factor are presented in Figure 11. With the exception of the data points at the highest effective stress, both the shear and normal stiffness of the fracture show a quasi-linear trend with effective stress. It is unclear why the data show such large deviation at the highest effective stress, but the brine and carbon dioxide experiments were performed after the air experiment, so we cannot rule out the possibility that the sample was somehow plastically deformed due to the repetitive loading. Neglecting this data, the normal stiffness shows very little variation due to different pore fluids at all stresses. The shear stiffness, however, does appear to exhibit more variation with different pore fluids, again pointing to some nontraditional interaction between the pore fluid and the solid. The ratio of normal to shear stiffness is relatively constant between ∼0.3–0.5 across our effective stress range, consistent with measurements in dry fractured sandstone (Lubbe et al., 2008).
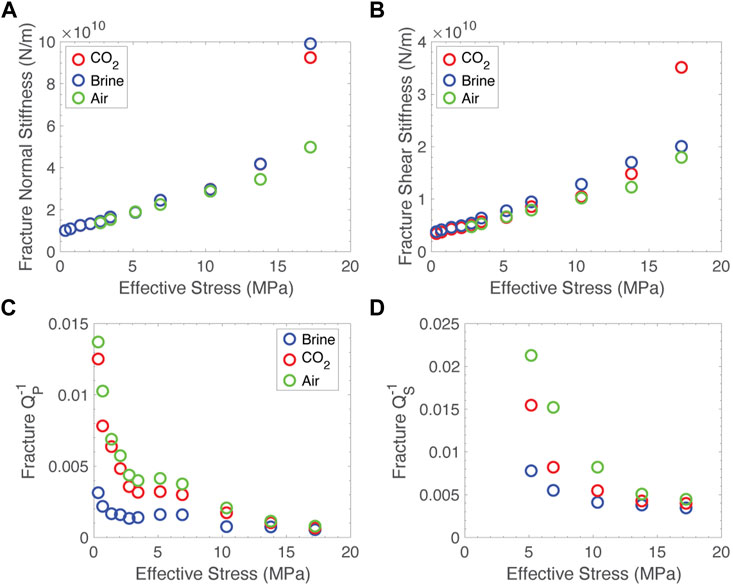
FIGURE 11. Fracture specific properties as a function of effective stress. (A) Normal stiffness, (B) shear stiffness, (C) compressional attenuation, (D) shear attenuation.
Among the fracture specific properties. Attenuation is a better indicator of fluid composition than stiffness. Compressional attenuation is higher in the carbon dioxide saturated sample than the brine saturated sample at low effective stress, but this effect is minimized at elevated stress. Assuming the majority of attenuation is due to scattering, this observation is consistent with variations in acoustic impedance of the different fluids leading to different amounts of scattering. Shear attenuation also discriminated between the brine sample and the carbon dioxide sample at low effective stress. This effect is harder to explain. Because shear waves do not propagate in fluids, the shear impedance of each fluid is the same, so variations in scattering cannot be attributed to variations in impedance. This suggests that whatever mechanism is leading to changes in shear modulus is also leading to changes in dissipation. This is an observation that deserves further inquiry.
4.4 Fracture reflectivity
If we are to apply our laboratory data to the field, we need to produce a quantity that can be observed using common techniques. Fractures are common interpretations of scatterers in seismic data. After Pyrak-Nolte et al., 1990, we can use our fracture stiffness data to calculate fracture reflectivity, R
where ω is the angular frequency, k is the stiffness and Z is the acoustic impedance. Assuming minimal dispersion, we can use this to plot reflectivity at 1 Hz as a function of effective stress for our sample, presented in Figure 12.
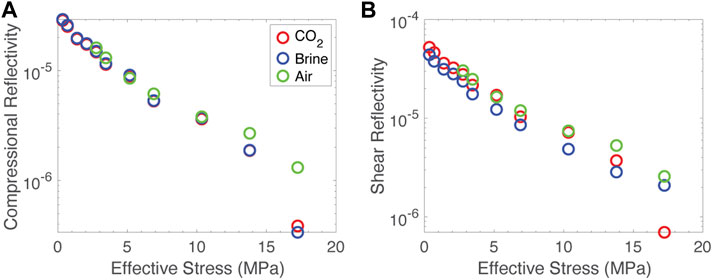
FIGURE 12. Reflectivity calculated from fracture specific stiffness values. (A) Compressional reflectivity versus effective stress, (B) shear reflectivity versus effective stress. Data from the fractured sample saturated with air are in green, carbon dioxide in red and brine in blue.
These data indicate that changes in stress, perhaps those due to injection or other related activities, lead to greater changes in reflectivity than changes in fluid composition. It is clear that changes in fluid composition result in little change in compressional reflectivity. There is a slightly larger effect of fluids on shear reflectivity, but the effect is still in the range of a few percent. For both compressional and shear reflectivity, the increase or reductions of a few MPa of stress can result in half and order or magnitude or more change in reflectivity. This can be a tool for monitoring the interrelated processes of fluid migration and geomechanical response in the subsurface. It also suggests that caution should be used when interpreting seismic data in fractured reservoirs. Changes in seismic response due to stress could easily be mis-interpreted as fluid-substitution effects.
4.5 Nonlinearity
Our data suggest another possible tool for monitoring stress in the subsurface nonlinearity. Both velocity and attenuation are highly stress dependent, particularly at low effective stress. This if particularly evident if you look at the stress dependence by taking a numerical derivative of the data as a function of effective stress, presented in Figure 13.
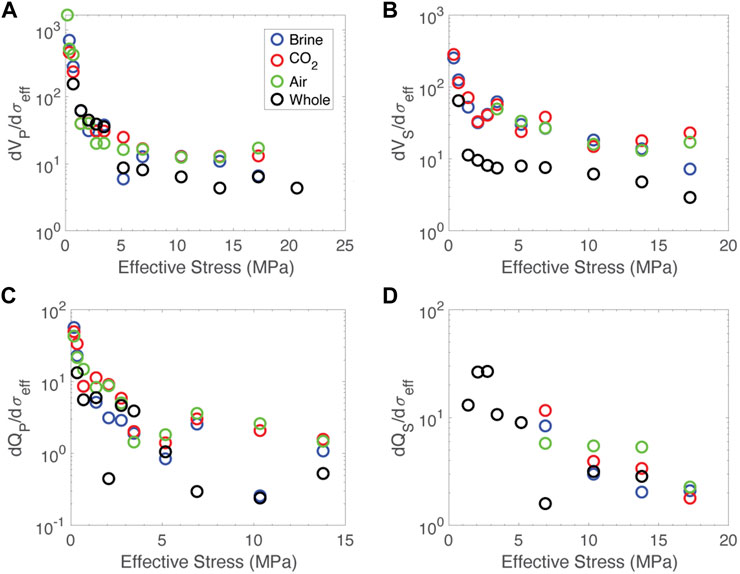
FIGURE 13. Effective stress dependence of acoustic properties. Effective stress derivative of (A) compressional velocity, (B) shear velocity, (C) compressional quality factor, (D) shear quality factor as a function of effective stress. Data from the fractured sample saturated with air are in green, carbon dioxide in red and brine in blue. Data from the whole core are in black.
The effective stress dependence of the acoustic properties could be leveraged to infer stress state in the subsurface. The stress dependence of both velocities and attenuations is roughly constant above about 10 MPa, but below this threshold, there is significant nonlinear behavior. If observations are made over time and there is some variation in effective stress, this behavior would result in changes in velocity and attenuation. Naturally occurring cyclic variations in stress could be leveraged for this purpose. Recent work has used tidal stress changes to map nonlinearity as a function of azimuth in order to infer stress orientation in areas where no other data are available, yielding very promising results (Delorey et al., 2021). This technique is relatively immature, but may prove an invaluable noninvasive tool for monitoring the evolution of stress in fractured rock.
5 Conclusion
We conducted ultrasonic velocity measurements on intact and naturally fractured dolostone samples from Kevin Dome, Montana, while saturated with brine, air and carbon dioxide to assess the relative effects of fluid substitution and stress variation on acoustic response. Across the measured effective stress range, Vp increases by ∼10% while Vs increases by ∼20%. Both Qp and Qs increase by ∼200%. Fluid substitution yields changes in Vp between 1% and 2% and Vs nearly 1% while Qp changes up to 35% and Qs, 30%. The experiments also show substantial changes in shear anisotropy due to changes in pressure. Shear velocity anisotropy correlates closely with asperity geometry and shear attenuation anisotropy correlates with changes in aperture. Over the conditions measured, the effect of stress dominates the effect of fluid composition for our sample. At low effective stress, both velocity and attenuation are nonlinear, a property that should be explored in greater detail. The results of this study emphasize that in low porosity, fractured rocks, the state of stress must be understood to properly understand the physical properties of the rocks.
Data availability statement
The original contributions presented in the study are included in the article/Supplementary material, further inquiries can be directed to the corresponding author.
Author contributions
HL and JA-F conceived of and designed the experiments as well as contributed to the preparation of the manuscript. HL performed the experiments and analysed the data. All authors contributed to the article and approved the submitted version.
Funding
All core samples discussed were acquired by the Big Sky Carbon Sequestration Partnership, funded under DOE Award Number DE-FC26-05NT42587. Research presented was funded in part by the Big Sky Carbon Sequestration Partnership (BSCSP) by the U.S. Department of Energy and the National Energy Technology Laboratory through award number DE-FC26-05NT42587 and in part by the U.S. Department of Energy, Office of Science, Office of Basic Energy Sciences, Chemical Sciences, Geosciences, and Biosciences Division, through its Geoscience program at LBNL under Contract DEAC02-05CH11231. Parts of this research used resources of the Advanced Light Source, which is a DOE Office of Science User Facility under contract no. DE-AC02-05CH11231.
Acknowledgments
The authors would like to thank Paul Cook and Todd Wood for technical assistance with the ultrasonic equipment, Seiji Nakagawa for assistance in performing the profilometry, Seth Saltiel and Paul Salvadurai for providing guidance on pressure sensitive film measurements, Marco Voltolini, Alastair MacDowell and Dula Parkinson for assistance running microtomography experiments and permeability simulations, Thomas Tamarkin for sample preparation and Brian Bonner for general laboratory expertise.
Conflict of interest
The authors declare that the research was conducted in the absence of any commercial or financial relationships that could be construed as a potential conflict of interest.
Publisher’s note
All claims expressed in this article are solely those of the authors and do not necessarily represent those of their affiliated organizations, or those of the publisher, the editors and the reviewers. Any product that may be evaluated in this article, or claim that may be made by its manufacturer, is not guaranteed or endorsed by the publisher.
References
Adam, L., Batzle, M., and Brevik, I. (2006). Gassmann's fluid substitution and shear modulus variability in carbonates at laboratory seismic and ultrasonic frequencies. Geophysics 71 (6), F173–F183. doi:10.1190/1.2358494
Adam, L., Batzle, M., Lewallen, K. T., and van Wijk, K. (2009). Seismic wave attenuation in carbonates. J. Geophys. Res. Solid Earth 114 (B6), B06208. doi:10.1029/2008jb005890
Anselmetti, F. S., and Eberli, G. P. (1993). Controls on sonic velocity in carbonates. Pure Appl. Geophys. 141 (2), 287–323. doi:10.1007/bf00998333
Baechle, G. T., Colpaert, A., Eberli, G. P., and Weger, R. J. (2008). Effects of microporosity on sonic velocity in carbonate rocks. Lead. edge 27 (8), 1012–1018. doi:10.1190/1.2967554
Batzle, M., and Wang, Z. (1992). Seismic properties of pore fluids. Geophysics 57 (11), 1396–1408. doi:10.1190/1.1443207
Delorey, A. A., Bokelmann, G. H., Johnson, C. W., and Johnson, P. A. (2021). Estimation of the orientation of stress in the Earth’s crust without earthquake or borehole data. Commun. Earth Environ. 2 (1), 190. doi:10.1038/s43247-021-00244-1
Dvorkin, J. (2020). “Rock physics Recent history and advances,” in Geophysics and ocean waves studies (London, England IntechOpen).
Gassmann, F. (1951). Elasticity of porous media. Vierteljahr. Naturforschenden Gesselschaft 96 (1-23), 1–23.
Lissa, S., Barbosa, N. D., and Quintal, B. (2021). Fluid pressure diffusion in fractured media The role played by the geometry of real fractures. J. Geophys. Res. Solid Earth 126 (10), e2021JB022233. doi:10.1029/2021jb022233
Lubbe, R., Sothcott, J., Worthington, M. H., and McCann, C. (2008). Laboratory estimates of normal and shear fracture compliance. Geophys. Prospect. 56 (2), 239–247. doi:10.1111/j.1365-2478.2007.00688.x
Mavko, G., Mukerji, T., and Dvorkin, J. (2009). The rock physics handbook Tools for seismic analysis of porous media. Cambridge, England Cambridge University Press.
Misra, A. (1999). Micromechanical model for anisotropic rock joints. J. Geophys. Res. Solid Earth 104 (B10), 23175–23187. doi:10.1029/1999jb900210
Nur, A., and Simmons, G. (1969). Stress-induced velocity anisotropy in rock An experimental study. J. Geophys. Res. 74 (27), 6667–6674. doi:10.1029/jb074i027p06667
Omosebi, O., Shaw, C., Thrane, L., and Spangler, L. “Characterization of different depositional facies of rocks from the Kevin Dome for carbon sequestration,” in Proceedings of the 14th Greenhouse Gas Control Technologies Conference Melbourne, Cheltenham, UK, 2018, October, 21–26.
Prasad, M. (2002). Acoustic measurements in unconsolidated sands at low effective pressure and overpressure detection. Geophysics 67 (2), 405–412. doi:10.1190/1.1468600
Pyrak-Nolte, L. J., Myer, L. R., and Cook, N. G. (1990). Transmission of seismic waves across single natural fractures. J. Geophys. Res. Solid Earth 95 (B6), 8617–8638. doi:10.1029/jb095ib06p08617
Quan, Y., and Harris, J. M. (1997). Seismic attenuation tomography using the frequency shift method. Geophysics 62 (3), 895–905. doi:10.1190/1.1444197
Raymer, L. L., Hunt, E. R., and Gardner, J. S. (1980). “July). An improved sonic transit time-to-porosity transform,” in SPWLA 21st annual logging symposium (Richardson, Texas, USA OnePetro).
Rubino, J. G., Müller, T. M., Guarracino, L., Milani, M., and Holliger, K. (2014). Seismoacoustic signatures of fracture connectivity. J. Geophys. Res. Solid Earth 119 (3), 2252–2271. doi:10.1002/2013jb010567
Saltiel, S., Selvadurai, P. A., Bonner, B. P., Glaser, S. D., and Ajo-Franklin, J. B. (2017). Experimental development of low-frequency shear modulus and attenuation measurements in mated rock fractures Shear mechanics due to asperity contact area changes with normal stress. Geophysics 82 (2), M19–M36. doi:10.1190/geo2016-0199.1
Sears, F. M., and Bonner, B. P. (1981). Ultrasonic attenuation measurement by spectral ratios utilizing signal processing techniques. IEEE Trans. Geoscience Remote Sens. (2), 95–99. doi:10.1109/tgrs.1981.350359
Selvadurai, P. A., and Glaser, S. D. (2015). Novel monitoring techniques for characterizing frictional interfaces in the laboratory. Sensors 15 (5), 9791–9814. doi:10.3390/s150509791
Smith, T. M., Sondergeld, C. H., and Rai, C. S. (2003). Gassmann fluid substitutions A tutorial. Geophysics 68 (2), 430–440. doi:10.1190/1.1567211
Spangler, L. H., Cihan, A., Winkelman, B., DeVault, B. C., Chang, C., Shaw, C. A., and Kneafsey, T. J. (2020). Big Sky regional carbon sequestration partnership (phase III final scientific/technical report) (No. DOE-MontanaStateUniversity-2587). Bozeman, MT, United States Montana State Univ.
Voltolini, M., Kwon, T. H., and Ajo-Franklin, J. (2017). Visualization and prediction of supercritical CO2 distribution in sandstones during drainage An in situ synchrotron X-ray micro-computed tomography study. Int. J. Greenh. Gas Control 66, 230–245. doi:10.1016/j.ijggc.2017.10.002
Wang, X. Q., Schubnel, A., Fortin, J., David, E. C., Guéguen, Y., and Ge, H. K. (2012). High Vp/Vs ratio Saturated cracks or anisotropy effects? Geophys. Res. Lett. 39 (11). doi:10.1029/2012gl051742
Wyllie, M. R. J., Gregory, A. R., and Gardner, L. W. (1956). Elastic wave velocities in heterogeneous and porous media. Geophysics 21 (1), 41–70. doi:10.1190/1.1438217
Yang, H., Duan, H. F., and Zhu, J. B. (2019). Ultrasonic P-wave propagation through water-filled rock joint An experimental investigation. J. Appl. Geophys. 169, 1–14. doi:10.1016/j.jappgeo.2019.06.014
Keywords: rock physics, ultrasonics, fractures, carbon dioxide, nonlinear behavior, stress dependence, fluid substitution, attenuation
Citation: Lisabeth HP and Ajo-Franklin J (2023) The role of stress and fluid saturation on the acoustic response of fractured rock. Front. Earth Sci. 11:1058984. doi: 10.3389/feart.2023.1058984
Received: 30 September 2022; Accepted: 04 August 2023;
Published: 15 August 2023.
Edited by:
Alba Zappone, ETH Zürich, SwitzerlandReviewed by:
Marian Hertrich, ETH Zürich, SwitzerlandSamuel Chapman, École Normale Supérieure, France
Copyright © 2023 Lisabeth and Ajo-Franklin. This is an open-access article distributed under the terms of the Creative Commons Attribution License (CC BY). The use, distribution or reproduction in other forums is permitted, provided the original author(s) and the copyright owner(s) are credited and that the original publication in this journal is cited, in accordance with accepted academic practice. No use, distribution or reproduction is permitted which does not comply with these terms.
*Correspondence: Harrison P. Lisabeth, aGxpc2FiZXRoQGxibC5nb3Y=
 Harrison P. Lisabeth
 Jonathan Ajo-Franklin