 Katherine M. Whidden
 Gesa M. Petersen
 Maria Mesimeri
 Kristine L. Pankow1
- 1University of Utah Seismograph Stations, Salt Lake City, UT, United States
- 2Swiss Seismological Service, ETH Zurich, Zurich, Switzerland
An earthquake swarm occurred in Spring 2021 in south-central Utah near the town of Milford. The University of Utah Seismograph Stations located 125 earthquakes between March 19 and May 10 with magnitudes ranging from 0.5 to 3.2. We implement a matched-filter technique in order to identify additional earthquakes that went undetected during the routine network location. The 125 network-located earthquakes are used as templates and are cross-correlated with continuous data for the dates Feb 17—June 10. This time period corresponds to approximately 1 month before the earthquake swarm began through 1 month after it ended. For the matched-filter analysis, we rely heavily on station FOR1, which is located within 5 km of most template events. Four other stations within 20–30 km of most template events provide a supplement to the closest station. The matched-filter implementation results in the detection of over 600 earthquakes in addition to the original 125 catalog events. This is one of the largest swarms ever recorded in Utah, and no previous large swarms have been recorded in this location. We use HypoDD to obtain relative double-difference locations of the catalog events. Both routine locations and HypoDD relocations of the catalog events suggest a fault dipping west beneath the mountain range, opposite of typical Basin and Range normal faults that dip beneath alluvial valleys. Moment tensors for the largest five events show normal faulting consistent with the west-dipping fault seen in the seismicity. Hydrothermal features in the area, including a geothermal power plant, suggest that fluids may be a contributing factor to the earthquake swarm triggering. We examine the role of fluids by exploring bounds on diffusion parameters and investigating spatial migration characteristics of the swarm seismicity. We conclude that this swarm is the result of heterogenous stress conditions in a prefractured region.
Introduction
Whether you define a seismic sequence based on number of events occurring within a fixed time and distance from a main event or with clustering algorithms and statistics, swarms comprise 40%–50% of Utah seismic sequences (Arabasz et al., 2007; Mesimeri and Pankow, 2022). In general, these swarms locate primarily in south-central Utah and are bursts of tens to about one hundred or so small magnitude earthquakes (Zandt et al., 1982; Arabasz and Julander, 1986; Smith and Arabasz, 1991; Arabasz et al., 2007; Mesimeri et al., 2021; Mesimeri and Pankow, 2022). Two notable exceptions are a swarm of ∼1400 earthquakes in 1981 that located under the Mineral Mountains (Zandt et al., 1982) and, the topic of this paper, a swarm of >650 earthquakes in 2021 that locate at the northern end of the Escalante Desert.
The Escalante Desert is a geographic feature spatially coincident with concentrated earthquake activity along a southwest bifurcation of the prominent north-south trending Intermountain Seismic Belt (ISB; Smith and Arabasz, 1991). The ISB is the main zone of seismicity defining the eastern extent of the Basin and Range and extends from southern Montana to northern Arizona. At ∼38.5° N, the ISB broadens with branches that extend and link into the Southern Nevada Shear Zone (Figure 1; Pankow et al., 2009; Kreemer et al., 2010). Geologically, the region is complex. The northern Escalante Desert is on the western flank of the Mineral Mountain batholith. This batholith is thought to have tilted ∼40° as part of the Mineral Mountains core complex formation (Coleman and Walker, 1994; Bartley, 2019). As a result of this tilting, once approximate vertical structures dip shallowly to the west. However, local gravity studies within the Escalante Desert indicate northeast-southwest oriented Basin and Range-like structures that include grabens (Pe, 1980; Klauk and Gourley, 1983). The Escalante Desert is transected by the Blue Ribbon, Timpahute and Helene Transverse structures (Rowley et al., 1998). These east-west oriented structures extend into Nevada and are thought to accommodate east-west extension in the Basin and Range in a similar fashion to transfer faults in spreading centers (e.g., Duebendorfer and Black, 1992). Within the Escalante Desert both strike-slip and normal faulting moment tensors have been determined (e.g., Pankow et al., 2009; Whidden and Pankow, 2012) illustrating the tectonic complexity in the area.
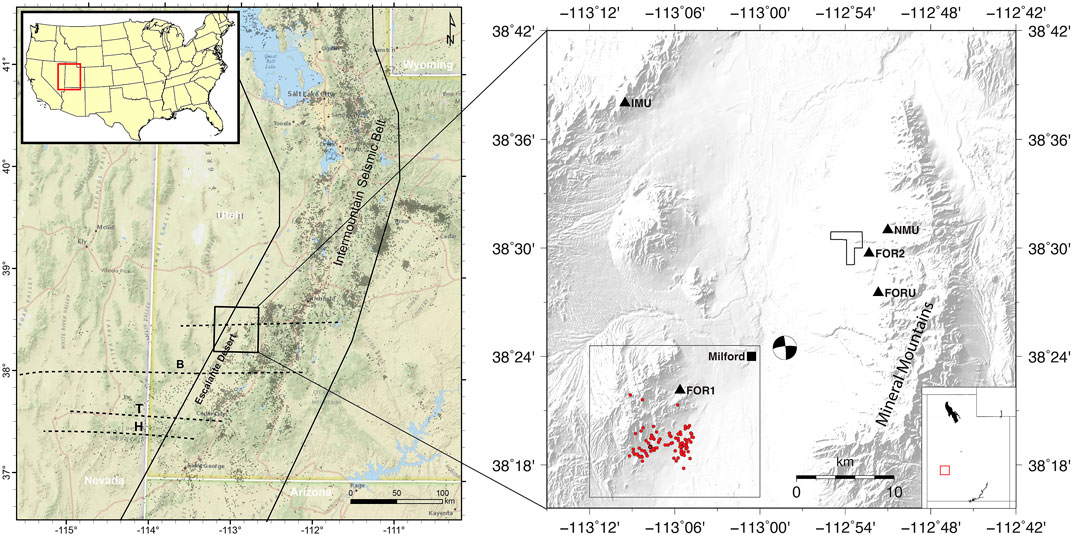
FIGURE 1. Maps of the study area. Left: Large scale features within Utah including the Intermountain Seismic Belt and Escalante Desert. Dashed lines are transverse lineaments mentioned in text (B: Blue Ribbon, T: Timpahute, H: Helene). Box near center is right map area. Right: Study area map showing stations used in the matched-filter (triangles), the town of Milford (square), and relocated 2021 swarm UUSS catalog earthquakes (red circles). The focal mechanism is an historic 1998 event from the UUSS moment tensor catalog. Polygon east of center is the footprint of the Utah FORGE geothermal project. Southwest box shows area in Figure 6.
While there is concentrated seismic activity located within the Escalante Desert and swarms have been identified nearby to the north (Mesimeri and Pankow, 2022), no swarms have previously been identified within the Escalante Desert itself. In fact, historic seismicity is sparse in this area and consists mainly of isolated events (Figure 2). There are a few exceptions: a group of twelve events in the Fall of 1998 and smaller event groupings of 5-6 events in more recent years. However, these seemingly low seismicity rates might be a consequence of sparse seismic station coverage. Before November 2016, when a local seismic array was installed to monitor the Utah Frontier Observatory for Research in Geothermal Energy (FORGE) site (Moore et al., 2020; Pankow et al., 2020), the magnitude of completeness in this area was ∼1.7 and hypocentral control was poor (Pankow et al., 2009). The Utah FORGE network added a single station (FOR1) to the Escalante Desert and several stations to the northeast closer to the Utah FORGE footprint (Figure 1). The added seismic coverage improved monitoring capabilities in the northern part of the Escalante Desert. It is likely that the installation of the Utah FORGE network together with an expansion of the University of Utah Seismograph Stations (UUSS) network to southern Utah in 2007 (Pankow et al., 2019) has led to an increased detection threshold in the Escalante Desert, allowing us to see swarms of events that were previously only visible to us as smaller sequences or single events.
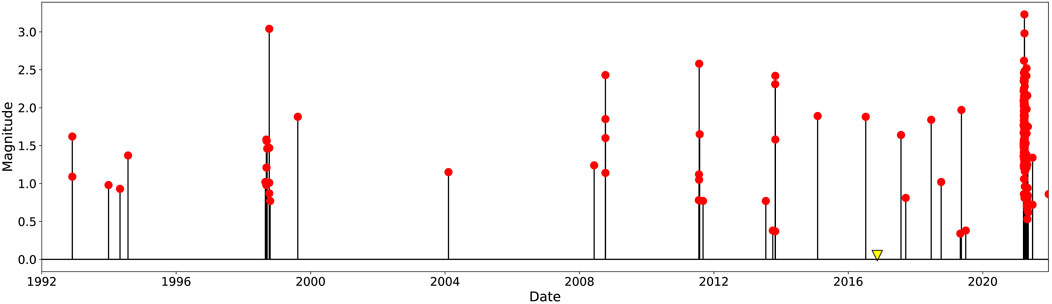
FIGURE 2. Magnitude-time plot for the entire UUSS catalog of the Milford area, corresponding to the map area plotted in Figure 6. There are few earthquakes recorded in this area, and no earthquakes prior to 1992. Yellow triangle marks the installation of station FOR1. Other FORGE stations to the northeast of Milford were installed starting around the same time. Seismicity is sparse but includes a group of twelve events in 1998, and smaller groups from 2008, 2011, and 2013.
In this study, we analyze the 2021 swarm. We start with the catalog of 125 events determined by the UUSS (Pankow et al., 2019). This catalog is relocated with HypoDD and then used as templates for a matched-filter analysis. Using the enhanced catalog we define the time progression of the swarm and look at space-time migration patterns. Additionally, we use two methods to determine six moment tensors for the five largest events in the sequence and compare their fault planes to the hypocenter distribution obtained from the relocated events.
Data and methods
During the study period, UUSS detected and located 125 events in the Escalante Desert using the HYPOINVERSE (Klein, 2002) software and the Bjarnason and Pechmann (1989) 1D velocity model. The events are well-located with a mean RMS travel time residual of 0.15 s (95% confidence interval 0.14–0.16 s), mean horizontal error of 1.15 km (95% confidence interval 0.99–1.31 km), and mean vertical error of 2.14 km (95% confidence interval 1.75–2.52 km). Local magnitude (ML) is calculated for larger events, and coda duration magnitude (mc) is calculated for nearly all events (e.g., Burlacu et al., 2022).
Matched-filter
We use five stations from the UUSS network: three three-component broadbands (FOR1, FOR2, FORU), one three-component short-period (NMU) and one vertical short-period (IMU) (Figure 1). Most swarm events are located within 5 km of the closest station, FOR1. Stations FOR2 and FORU are about 25 km away from the swarm, and IMU and NMU are 30 km. Given the close proximity to the swarm, FOR1 has the most picked phases for the catalog events.
We use the 125 UUSS catalog events from the 2021 Milford Swarm as templates in a matched-filter analysis as outlined in Mesimeri et al. (2021), which follows from Ross et al. (2019) and Shelly (2020). We cross correlate the templates across continuous data during the time period February 17-June 10, corresponding to approximately 1 month before the swarm start and 1 month after its end. Data was not available at all stations during the complete time period. FOR1 and FORU were available for the full 114 days, FOR2 was available for a total of 72 days with two multi-day time periods missing, and IMU and NMU were available for 49 continuous days at the end of the study period.
Event templates consist of 90 s long waveforms beginning at the origin time for each event at each station and component. We remove the trend, taper, decimate to 50 Hz, and bandpass filter at 1.5–15 Hz. We then cut smaller windows around P and S for the templates: 0.1 s before and 0.9 s after the P pick, and 0.1 s before and 1.9 s after the S pick. Continuous data in day-long segments for each station and component are processed identically to the template data. We cross correlate each day-long waveform with its corresponding template, and the resulting correlation-coefficient time series is shifted by the template’s arrival time. The correlation-coefficient time series for each template are then summed across all stations and components, resulting in a stacked correlation-coefficient time series for each day and event template. When the correlation coefficient in the stack exceeds nine times the median absolute deviation (9*MAD), a detection is declared. The new detection receives the location coordinates and relative arrival time from the highest correlated event template. Magnitudes of the new detections are based on amplitudes relative to the event template (Peng and Zhao, 2009). We refer the reader to Mesimeri et al. (2021) for further details of the matched-filter method.
The matched-filter returned a large number of detections. In order to eliminate false detections and cull the catalog, we require that detections have a cross correlation coefficient of 0.6 at the closest station FOR1 and a magnitude of at least 0.5. These criteria are chosen because they result in a sufficient number of events for a catalog analysis and also preserve characteristics of the swarm that are lost when a higher cross correlation coefficient is chosen (Figure 3). Such characteristics include sudden increases in seismicity rates.
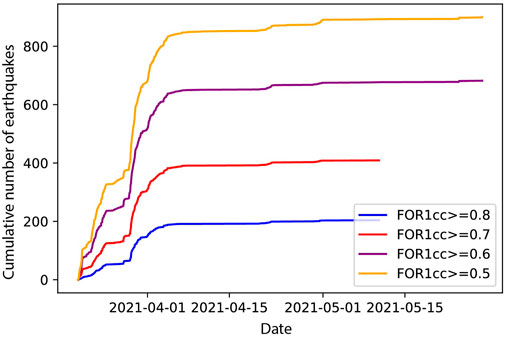
FIGURE 3. Cumulative number of detection earthquakes for various minimum cross correlation values at station FOR1 and with M ≥ 0.5. FOR1cc ≥ 0.6 (purple line) preserves details of the swarm such as jumps in seismicity and contains enough events for further analysis.
Double-difference relocation
We relocate the UUSS catalog events with HypoDD, a double-difference relocation algorithm that uses both catalog travel times and cross correlation lag times (Waldhauser and Ellsworth, 2000). Double-difference algorithms take advantage of the fact that seismic events in close proximity have similar ray paths to the same stations by minimizing the residual of the differences in travel times from clusters of events to the same station.
We cross correlate all catalog events against each other to obtain cross correlation coefficients and lag times which are used as input to HypoDD along with phase picks. Waveforms are filtered from 0.5 to 10 Hz and time windows are cut from the waveforms starting at the phase pick and ending 1.0 s after P and 2.0 s after S. The minimum required cross correlation coefficient is 0.8. In HypoDD, we require 6 phase pick observations per pair in order to form a cluster. No minimum number of cross correlation observations is required for clustering. For the 125 catalog events, total input to HypoDD includes 9212 and 7945 P and S phase picks, respectively, and 415 and 953 P and S cross correlation observations, respectively. The double difference residuals are minimized over four iterations. The first two iterations emphasize the phase picks, and the second two emphasize the cross correlations. We use the Wasatch front velocity model used at UUSS for catalog locations in this area (Bjarnason and Pechmann, 1989).
Moment tensors
We calculate moment tensors for the largest events using two methods. First is Time Domain Moment Tensor (TDMT), a regional, time-domain, full waveform inversion (Minson and Dreger, 2008) and the method used for routine moment tensors at UUSS (Whidden and Pankow, 2012). Full waveforms from broadband three-component data are instrument corrected, downsampled to 1 sample/s, and filtered from 0.05–0.1 Hz. We apply the same processing to synthetic waveforms. Full data processing details can be found in Whidden and Pankow (2012). With this method we calculate a deviatoric moment tensor consisting of double-couple and compensated linear vector dipole components for the largest event in the sequence, an Mw 3.53 on March 29, 2021. We also calculate a full moment tensor but find that the isotropic component is small and statistically insignificant. Moment tensors for other events in the sequence were attempted with TDMT but they proved too small to get a reliable solution, unsurprising as ∼Mw3.5 is typically the lowest magnitude possible with TDMT for earthquakes in Utah (Whidden and Pankow, 2012).
The second moment tensor method employed here is the probabilistic full waveform inversion tool Grond (Heimann et al., 2018; Kühn et al., 2020). While TDMT typically is able to calculate moment tensors down to M3.5-4, Grond often can go a bit lower, as was the case here. Grond is a flexible inversion tool which allows the combination of various input data types (see e.g., Petersen et al., 2021). For the two larger events, we used: 1) displacement waveforms (vertical, radial, and transverse components) and 2) amplitude spectra of five stations in 25–150 km distance, filtered between 0.05–0.1 Hz to emphasize surface waves. In case of the remaining three smaller events, surface waveforms were not observed. Therefore, we relied on: 1) Displacement waveforms (vertical and transverse components) of five stations within 30 km distance filtered between 0.25 and 0.5 Hz; and 2) amplitude spectra of stations within 80 km distance filtered between 0.25 and 0.5 Hz. Bandpass filters were chosen based on visual inspections of the waveform data. Arrival times were picked manually to define the start of the time windows for the inversion. All time windows span the time between the first arriving P phase and a theoretical arrival of a wave with a velocity of 2.5 km/s plus a taper to both sides. This results in time windows of ∼8.5–22 s for the body waves and up to 90 s for the surface wave time windows. Seismic stations within the first 30 km to the events are unfavourably distributed for performing moment tensor inversions. Station FOR1 is located at less than 5 km distance. The other FORGE stations (23–28 km distant) are all situated within a narrow azimuthal band of ∼40°–60°.
Synthetic data is forward modelled using a pre-calculated Green’s function database, created from a 1D P and S wave velocity model of the crust2 database (Bassin et al., 2000; https://igppweb.ucsd.edu/∼gabi/crust2.html, last access: August 2022). The Green’s functions were calculated using the qseis code from Wang (1999) as implemented in the fomosto software (Heimann et al., 2019). Each inversion was executed in 101 independent bootstrap chains with different random weightings on the station-component-based misfits. The results of all bootstrap chains are considered to evaluate the stability of the results.
b-value
We employ the b-positive method of van der Elst (2021) to determine the b-value of the sequence. The b-value is a measure of the relative number of small to large earthquakes in a sequence, and is usually calculated as the slope of the frequency-magnitude distribution (Ishimoto and Iida, 1939; Gutenberg and Richter, 1944). b-positive aims to measure the same quantity but in contrast to a traditional b-value is calculated with positive differences in sequential earthquake magnitudes. Advantages of b-positive include insensitivity to transient changes in catalog completeness, and no requirement for data windowing. It also appears to converge to more stable values with fewer events (Dzubay et al., 2022). Because b-positive is insensitive to magnitude of completeness, a minimum magnitude difference (dMc) is used instead. We include both templates and detections in the b-positive calculation.
Results
The matched-filter returns 27,154 detections. This large number of detections is an interesting result on its own. However, given the sparse station coverage, we elect to reduce the number of detections in our dataset using magnitude (>0.5) and correlation coefficient at closest station FOR1 (>0.6) thresholds, thereby reducing the number of detections to 683. Of these, all but four are determined by visual inspection to be real detections, leaving us with a final detection dataset of 679 events. The two broadband stations on hard rock, FOR1 and FORU, overwhelmingly dominate the detections. Nearly all detections (677) are seen at FOR1, most at FORU (541), and a negligible amount at the remaining stations FOR2 (2), IMU (1), and NMU (1).
Seismicity occurs in several bursts over the study time period: one in the first 3 days, another that ends within the first 2 weeks and is followed by an approximate 2 week quiet period, and a final, smaller burst of seismicity 1 month after the swarm onset (Figure 4). Detections are concentrated in periods of high catalog seismicity. The first period of seismicity (amber background color, Figure 4) has the highest concentration of events with 38 catalog earthquakes and 237 detections over approximately 6 days. We were able to calculate a moment tensor for one event in this period, an Mw 2.89 on 2021-03-24 12:57:07 (UTC; Table 1). The second period of seismicity contains the most events with 67 catalog events and 410 detections over 14 days (green background, Figure4A, B). There are three moment tensors calculated during the second period ranging 2.61≤Mw≤3.68 (Table 1). There is a break in seismicity for both catalog events and detections between the second and third seismicity periods from approximately 2021-04-08 to 2021-04-20. During this quiet period there are only one catalog event and one detection. The third period of seismicity beginning on 2021-04-20 has a lower activity rate compared to the other time periods with 20 catalog events and 32 detections over about 20 days as the swarm dies down (blue background, Figure 4A). There is one moment tensor event during the third time period, an Mw 2.67 on 2021-04-21 05:56:35 (UTC; Table 1). There are no detections before the first catalog event or after the last catalog event.
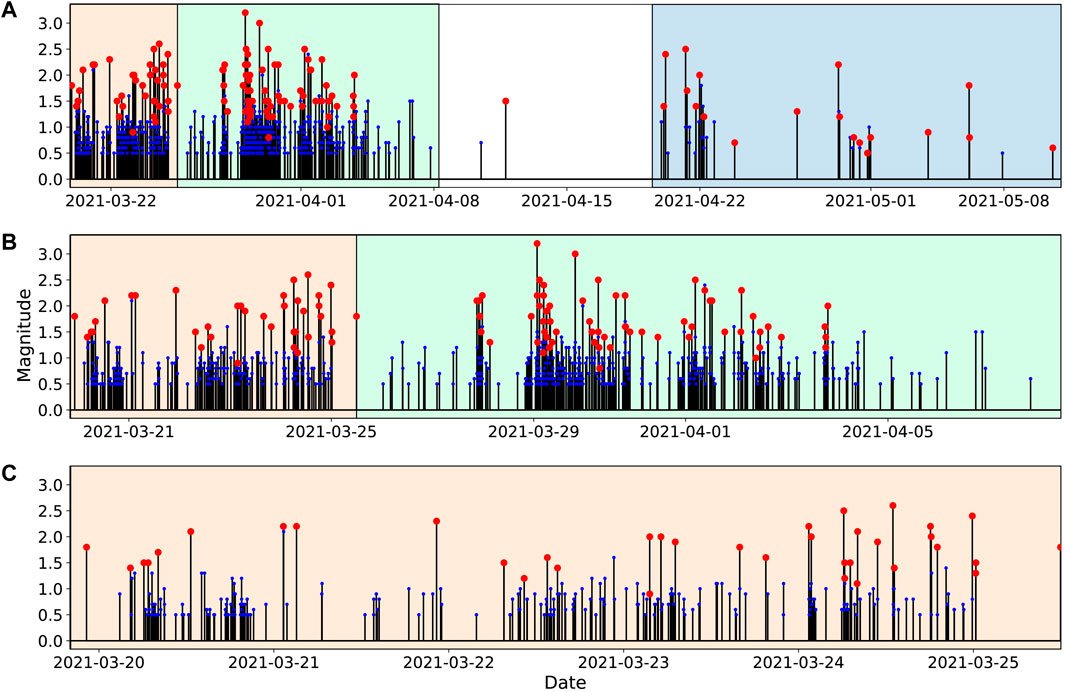
FIGURE 4. Magnitude-time plots for the 2021 Milford swarm at various time scales. Background colors represent a constant time period. Red dots are UUSS catalog events and blue dots are detections. Only detections with M > 0.5 are shown. (A) Full time period for which seismicity was detected, 2021-03-19 to 2021-05-11. (B) First and second time periods, 2021-03-19 20:00:00 to 2021-04-08. (C) First time period, 2021-03-19 to 2021-03-25.
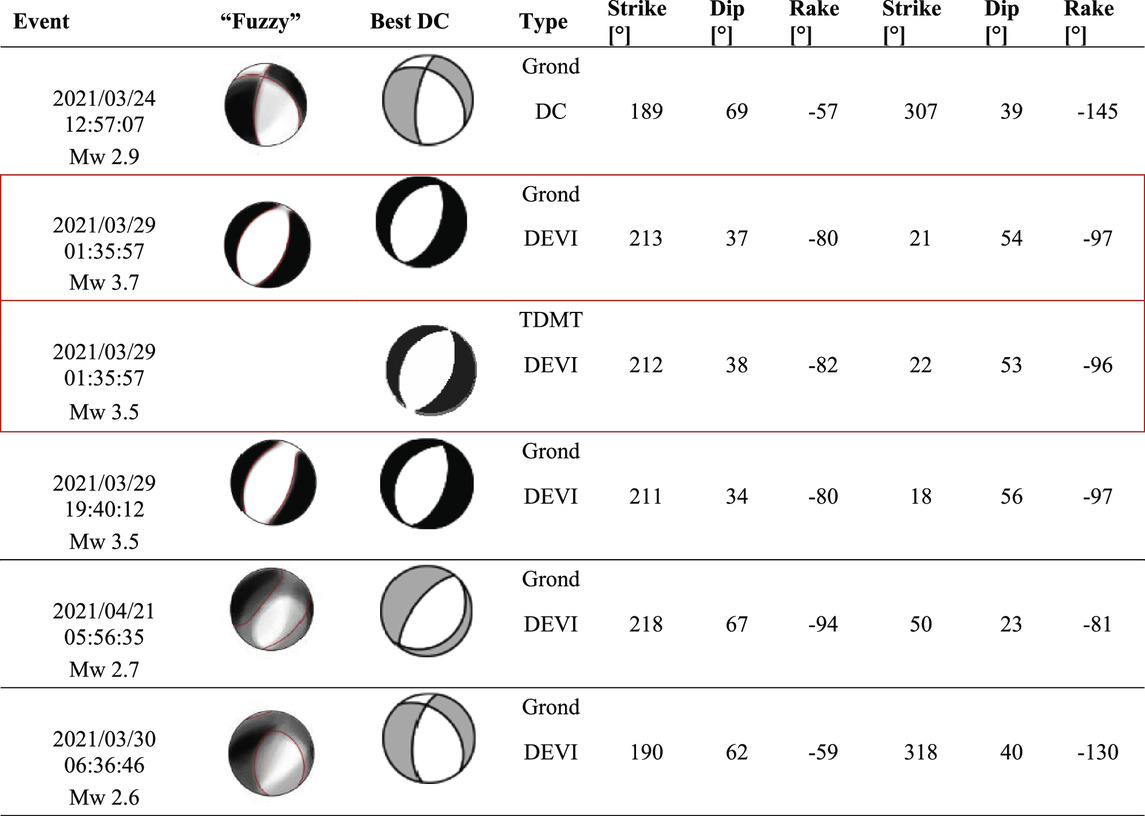
TABLE 1. Results of the Moment Tensor Inversions for the largest five events. For the Grond solutions, the plots in the second column show the “fuzzy” beachball. The fuzzy moment tensor is composed of the superimposed P radiation pattern of the ensemble of solutions from the bootstrap chains. The third column shows the best fitting double-couple mechanism for all solutions. DC = best double couple, DEVI = deviatoric solution. Strike, dip, and rake come from the best double couple solution. Red box indicates the TDMT and Grond solutions for the largest event in the swarm. The smaller magnitude moment tensors should be interpreted with caution.
Using the b-positive method (van der Elst, 2021), we find a b-value of 0.99 and a dMc of 0.4 for the combined template and detection catalog (n>750). This result should be interpreted with some caution because b-value is a calculation based on magnitudes and our detection magnitudes are estimates based on the relative amplitudes of their templates. A traditional Gutenberg-Richter distribution for the same dataset gives a similar b-value of 0.93 and a magnitude of completeness (Mc) of 0.7 (Figure 5). Both dMc and Mc are stable across a range of magnitude differences and magnitudes, respectively (Figure 5 inset). A b-value of 1.0 is consistent with an area of tectonic stress (Frolich and Davis, 1993) rather than one of volcanic or fluid-induced seismicity for which b-values tend to be higher (e.g., McNutt, 2005; Farrell et al., 2009).
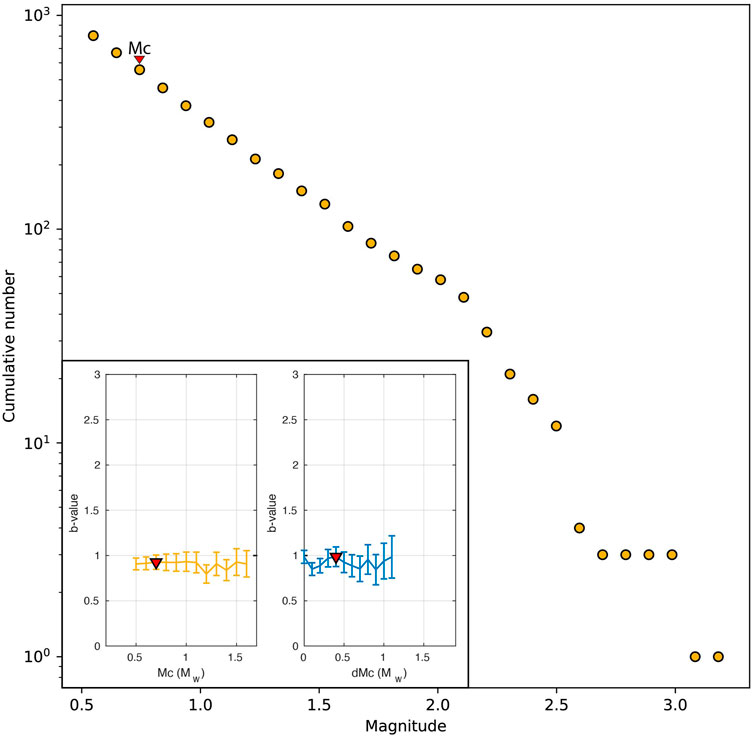
FIGURE 5. Gutenberg-Richter distribution of magnitudes for templates and detections with Mc=0.7. Inset left: Mc for a range of magnitudes with the best fit at 0.7. Inset right: dMc for a range of magnitude differences with a best fit at 0.4. Both Mc and dMc are stable.
We relocate the UUSS catalog events with the double-difference relocation algorithm HypoDD. Of the 125 UUSS catalog events, 100 grouped into 5 clusters while 25 events were not clustered and not relocated. Over the relocation process, 8 events and 2 clusters were dropped resulting in 92 total relocations with the majority (82) in a single cluster. A HypoDD run without clustering relocated all 125 catalog events, but the resulting relocations formed a more diffuse plane outlining the west-dipping structure. We prefer the relocation solution utilizing fewer events but outlining a sharper structure. The detections were not relocatable in HypoDD or other location algorithms because >99% of the events were only seen on one or two stations. HypoDD returns high precision relative locations for groups of events. We therefore tie the absolute locations to the best located catalog event (2021-04-29 06:58:54 UTC). Among the catalog events, this best event has the lowest horizontal error (erh = 0.35 km) and highest number of phases (28) used in the location, as well as a low RMS error (rms = 0.15) and a small azimuthal gap (gap = 63°). The depth uncertainty is often high for earthquakes located by regional networks, but we have confidence in the depth of this event because the closest station is within one focal depth (4 km vs. 5.24 km, respectively), and the vertical error is acceptable (erz = 0.75 km). Relative distances between the relocated earthquakes are preserved, and all event locations are shifted so that the relocated best event rests at its catalog location.
The relocations of the catalog events reveal a northwest-dipping fault plane, similar to the plane outlined by the original catalog locations (Figure 6). Cross sections A-A′ and B-B′ are centered on the location of the largest event in the sequence, which although not relocated in HypoDD, can be compared to the relocated seismicity because of the shift to the best-located catalog event. The focal mechanism for this largest event is also plotted in the map and cross sections. Cross section A-A′ is perpendicular to the 212° strike of the west dipping plane of this moment tensor, and B-B’ is along strike. We use principal component analysis to fit a plane to the relocated events and find a N-S striking plane dipping 43° to the west. The plane is close to the west-dipping planes of focal mechanisms for the largest two events in the sequence, which have strike directions of 213° and 211° and dip angles of 37° and 34°, respectively. With strike directions between 189° and 218° and steeper dips of 62°–67° even the less well resolved moment tensors of the three smaller events show a general agreement (Table 1).
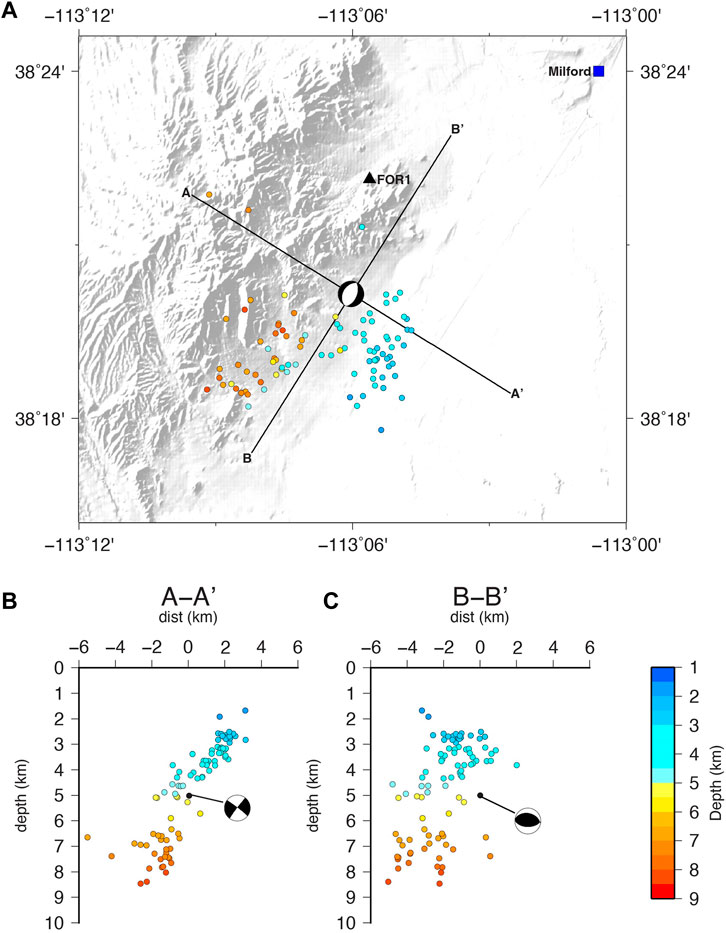
FIGURE 6. Map (A) and cross sections perpendicular to strike (B) and along strike (C) of UUSS catalog seismicity. Events are relocated, shifted, and colored by depth. The focal mechanism is the TDMT solution for the largest event in the sequence on 2021-03-29 01:35:57. This event was not relocated.
Table 1 summarizes the results of the moment tensor analyses. The largest event on March 29 was calculated with two different velocity models and moment tensor methods: TDMT (Mw 3.53) and Grond (Mw 3.68). The focal mechanisms are nearly identical, indicating normal faulting with NNE striking nodal planes. Double couple components of about 95% point towards a tectonic origin of the event. Moment tensors for the next four largest events are calculated with Grond (2.61≤Mw≤3.53). The second largest event, a Mw 3.5 event in the evening of March 29, has an almost identical mechanism to the first event.
For the three smallest events, (2.6≤Mw≤2.9), caution is required when interpreting details of the mechanisms, but looking at them in aggregate can give insights into the faulting processes within the swarm. All events show normal faulting with roughly N-S striking nodal planes. All mechanisms share a similar NNE-striking nodal plane that dips to the west and is in general agreement with the plane defined by the relocated seismicity.
Discussion
Tectonic setting
Most normal-faulting in the Basin and Range province are characteristic horst and graben structures where faults that abut mountain ranges dip away from the mountains underneath the alluvial valley. The fault imaged by the Milford swarm parallels the strike of the mountain range but dips underneath the mountains rather than towards the valley. This fault orientation is consistent with the model proposed by Bartley (2019) for this area where vertical joints created either pre- or early-Basin and Range formation were followed by a ∼40° eastward tilt during the formation of the Basin and Range. The fault outlined here dips 38° west by focal mechanism and ∼43° west by plane-fitting to the relocated seismicity. These are shallow dip values for a normal fault, which should theoretically be closer to 60° (Anderson, 1951). Interestingly, there is a break in seismicity with depth that is visible both as a spatial gap and as a change in dip (Figure 6). Above approximately 5.8 km depth, the structure outlined by the seismicity dips more shallowly than that below. These deeper events are also spatially segregated to the southwest. These differences in dip are suggestive of a complicated geometry with perhaps multiple structures being activated.
Event migration
Earthquake swarms are frequently associated with crustal fluid movements (e.g., Vidale et al., 2006; Farrell et al., 2009; Ruhl et al., 2016; Ross et al., 2020), and fluids are known to be close to the study area, for example, at the Blundell and Thermo Geothermal Power Plants to the northeast and south, respectively, and related to earthquake swarms in the Mineral Mountains (Mesimeri et al., 2021). Earthquakes in this swarm start at shallow depth (to the east), and progress down dip (to the west and southwest) (Figure 7). The progression from updip to downdip and the rapid versus gradual rate is not what is typically seen in swarms triggered by fluid diffusion (Shelly et al., 2016).
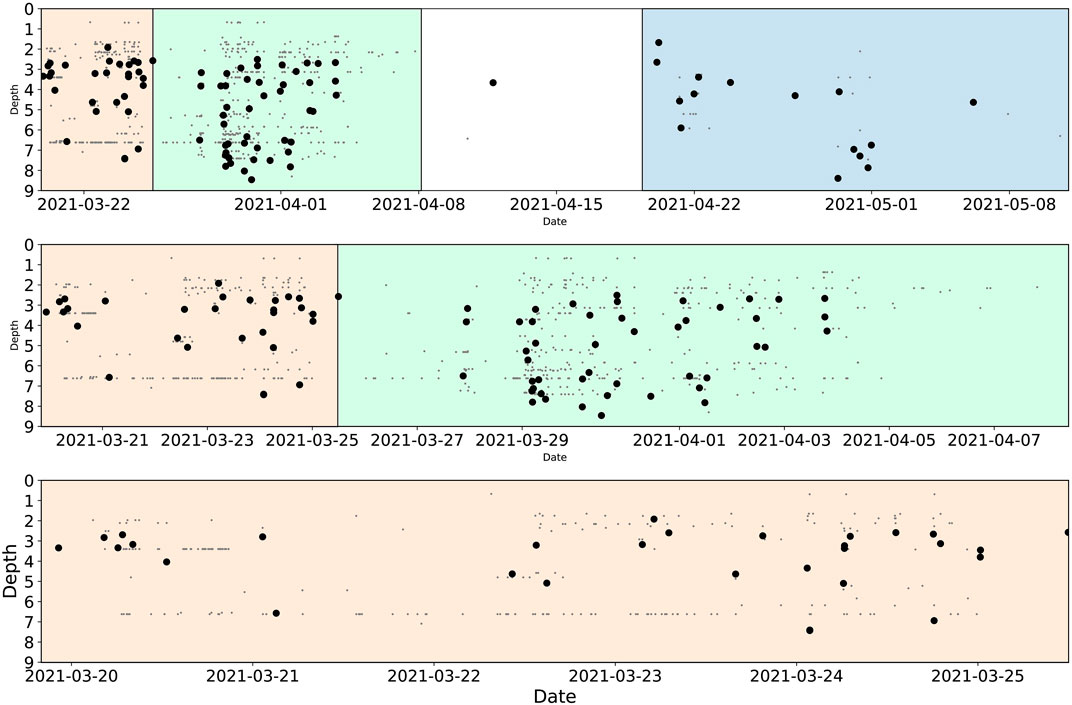
FIGURE 7. Depth-time plots for the 2021 Milford swarm at various time scales, similar to Figure 4. Background colors represent constant time periods. Large dots are template events and small gray dots are detections located at their highest-correlated template. Events start shallow and quickly progress downdip.
However, given the known presence of fluids in the area, we look at space-time migration patterns in the relocated UUSS catalog to investigate if hydraulic diffusivity (Shapiro, 2015) may play a role as a triggering process (Figure 8). The template dataset suggests a hydraulic diffusivity of 5 to >10 m2/s. These values are higher than those found in studies of similar tectonic environments (e.g., Hill and Prejean, 2005; Shelly et al., 2013; Shelly et al., 2016; Mesimeri et al., 2021) and similar to those found in studies of reservoir filling (e.g., Talwani and Acree, 1984; Simpson et al., 1988; Scholz, 2019) and fluid injection (Holland, 2013). Aseismic slip is an alternate mechanism for swarm triggering (Vidale et al., 2006; Lohman and McGuire, 2007) where the migration of events occurs at much higher rates (>1 km/h). For the Milford swarm the rates seem on the high end for fluid diffusion in a tectonic environment, but on the low end for aseismic slip.
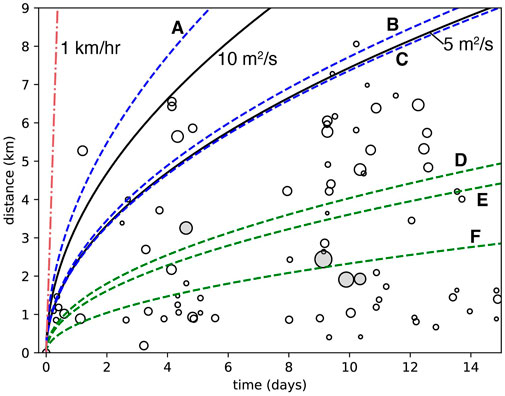
FIGURE 8. Earthquake migration of UUSS catalog events over space and time for the first 2 weeks of the 2021 swarm. Distances are hypocentral (in three dimensions) from the first event. Symbol size is scaled by magnitude. Filled circles are events for which we have calculated moment tensors. Black curves are estimated migration curves with diffusivity rates (Shaprio, 2015) that may be appropriate for this swarm. Dashed curves show mean diffusivity rates for other studies with induced seismicity environments in blue and natural systems in green: A, Holland, 2013; B, Simpson et al., 1988; C, Talwani and Acree, 1984; D, Shelly et al., 2013 and Shelly et al., 2016; E, Mesimeri et al., 2021; F, Hill and Prejean, 2005. Red dot-dash curve shows a migration of 1 km/h, typical of aseismic slip environments.
Other recently documented sequences have shown that triggering mechanisms can vary within the same sequences. For example, Ross et al. (2017) showed that aftershocks of the 2010 Mw 7.2 El Mayor-Cucapah earthquake were driven by both aseismic slip and fluid pressure sweeping through the fault network; Koper et al. (2018) concluded that the aseismic slip generated from the 2017 Mw 5.3 mainshock triggered a secondary swarm sequence; and just to the north of the Milford swarm in the Mineral Mountains, Mesimeri et al. (2021) found evidence for both aseismic slip and fluid diffusion triggering in a single swarmgenic region. One of the conclusions of Koper et al. (2018) was that sub-sequences are consistent with changes in fault morphology.
Given the relatively small size of the relocated catalog, it is hard to form definitive conclusions regarding the triggering mechanism. The diffusivity rates are higher than what would be expected in bulk rock implying that the diffusivity is controlled by large, preexisting fractures (Simpson et al., 1988). Exposure of the bedrock in the Mineral Mountains to the north shows a highly fractured mass (Bartley, 2019). However, previous documented cases of such high diffusivities have been observed for induced seismic sequences. We, thus, hesitate to equate the diffusivity values of this swarm to those in dissimilar environments, but neither can we rule out pore pressure diffusion as a cause of the Milford swarm based on its diffusivity and event migration patterns.
Station density
While we have not observed swarms southwest of Milford in the entire UUSS catalog history before the 2021 swarm, we consider whether swarms occur regularly in this area and if it is our recent station installations related to the Utah FORGE project, and particularly station FOR1, that have reduced our detection threshold in the Escalante Desert and brought these swarms to our attention. The small sequences in 2008, 2011, and 2013 (Figure 2) consist of only 5-6 events each with maximum magnitudes of −2.5 during a time when the magnitude of completeness was about 1.7. The 2021 swarm has 56 UUSS catalog events above M 1.7, so these three sequences really are smaller and less energetic than the 2021 swarm rather than larger sequences that were missed due to a lack of station coverage. The 1998 sequence is more difficult to evaluate because station coverage was even sparser and magnitude of completeness higher, yet this 1998 sequence has the largest number of events until the 2021 swarm studied here. Two factors suggest that the 1998 sequence may have been a foreshock-mainshock-aftershock sequence rather than a swarm. First, the difference between the largest and second largest event in the sequence is >1 magnitude unit, and second, the largest event occurred late in the sequence at number 9 of 12 events. Foreshock-mainshock-aftershock sequences can occur in an intermediate stress regime between the endmembers of swarms in areas of heterogenous stresses and mainshock-aftershock sequences in tectonic settings with homogeneous stresses (Mogi, 1963). The evidence here of both swarms and foreshock-mainshock-aftershock sequences suggest a more heterogenous stress regime which is consistent with the complex tectonics of the Escalante Desert.
If we assume the 1998 sequence was similar to the 2021 swarm and that the smaller number of events is due to a lack of station coverage, the UUSS network would have recorded 11 events with M<1.8 and missed all events in the range 1.8<M<3.0, though there were 41 such events in 2021. This scenario is unlikely and we conclude that for the duration of the UUSS catalog (1981-2022), despite a past lack of stations in this area, the 2021 swarm is unique in the large number of events recorded by the UUSS network.
The recent station installations, especially FOR1, allowed us to use a matched-filter to detect many more earthquakes than were recorded by the UUSS network. However, there still are not enough stations in the area to record these small events and allow independent locations. We find ourselves grateful for the new stations we have, and also frustrated that they are insufficient.
Conclusion
We analyze the 2021 Milford swarm with a matched-filter detection algorithm and expand the UUSS catalog of 125 events to a study catalog of 679 detections. Notably, the matched-filter analysis found over 27,000 detections. We conclude that the 2021 Milford swarm is larger than any previously recorded in the area and among the largest swarms recorded in Utah. While we would have liked to analyze a larger subset of the events station coverage was insufficient. However, we are confident that we capture the overall characteristics of the swarm based on cumulative seismicity with different detection thresholds. Double-difference relocations of 92 of the 125 catalog events reveal a roughly N-S striking plane dipping to the west at 38°–43° beneath the nearby mountain range, consistent with moment tensor solutions of the five largest events. This orientation is consistent with proposed structures in the area that formed from ∼40° westward tilting of pre-Basin and Range structures. The event migration patterns are inconclusive, but close hydrothermal sites suggest that fluids may play a role in the triggering process. Moment tensors and hypocenter locations suggest the re-activation of a pre-existing structure. There is also at least one past foreshock-mainshock-aftershock sequence in the immediate area. Given the available evidence, our preferred interpretation is this swarm is the result of a heterogeneous stress conditions in a pre-fractured region.
Data availability statement
Publicly available datasets were analyzed in this study. This data can be found here: https://www.iris.edu/.
Author contributions
KW and KP contributed to conception and design of the study. MM developed the matched-filter methodology. GP calculated moment tensors. KW performed data analysis and wrote the first draft of the manuscript. KP and GP wrote sections of the manuscript. All authors contributed to manuscript revision, read, and approved the submitted version.
Funding
Funding was provided by DOE EERE Geothermal Technologies Office under Project DE-EE0007080 Enhanced Geothermal System Concept Testing and Development at the Milford City, Utah Frontier Observatory for Research in Geothermal Energy (FORGE) site and the State of Utah.
Acknowledgments
We thank Paul Roberson for assistance with figures. We also thank three reviewers whose comments and suggestions improved the manuscript. The support and resources from the Center for High Performance Computing at the University of Utah are gratefully acknowledged.
Conflict of interest
The authors declare that the research was conducted in the absence of any commercial or financial relationships that could be construed as a potential conflict of interest.
Publisher’s note
All claims expressed in this article are solely those of the authors and do not necessarily represent those of their affiliated organizations, or those of the publisher, the editors and the reviewers. Any product that may be evaluated in this article, or claim that may be made by its manufacturer, is not guaranteed or endorsed by the publisher.
References
Arabasz, W. J., Burlacu, R., and Pankow, K. L. (2007). “An overview of historical and contemporary seismicity in Central Utah,” in Central Utah-diverse geology of a dynamic landscape. Editors G. C. Willis, M. D. Hylland, D. L. Clark, and T. C. J. Chidshey, 237–253. Utah Geological Association Publication 36.
Arabasz, W. J., and Julander, D. R. (1986). “Geometry of seismically active faults and crustal deformation within the Basin and Range-Colorado Plateau transition in Utah,” in Extensional tectonics of the southwestern United States - a perspective on process and kinematics: Geological Society of America Special Paper. Editor I. Mayer, 208, 43–47.
Bartley, J. M. (2019). “Joint patterns in the Mineral Mountains intrusive complex and their roles in subsequent deformation and magmatism,” in Geothermal characteristics of the Roosevelt Hot Springs system and adjacent FORGE EGS site. Editors R. Allis, and J. Moore (Milford: Utah). Utah Geological Survey Misc. Pub. 169-C, 13 p., 1 appendix. doi:10.34191/MP-169
Bassin, C., Laske, G., and Masters, G. (2000). The current limits of resolution for surface wave tomography in North America. Eos, Trans. Am. Geophys. Union 81, F897. EOS Trans AGU.
Bjarnason, I. T., and Pechmann, J. C. (1989). Contemporary tectonics of the Wasatch front region, Utah, from earthquake focal mechanisms. Bull. Seism. Soc. Am. 79 (3), 731–755. doi:10.1785/BSSA0790030731
Burlacu, R., Roberson, P. M., Hale, J. M., and Claerhout, Z. (2022). Earthquake activity in the Utah region. Retrieved from: https://quake.utah.edu/wp-content/uploads/2022Q1.pdf.
Coleman, D. S., and Walker, J. D. (1994). Modes of tilting during extensional core complex development. Science 263, 215–218. doi:10.1126/science.263.5144.215
Duebendorfer, E. M., and Black, R. A. (1992). Kinematic role of transverse structures in continental extension–An example from the Las Vegas Valley shear zone, Nevada. Geology 20, 1107–1110. doi:10.1130/0091-7613(1992)020<1107:krotsi>2.3.co;2
Dzubay, A., Mesimeri, M., Whidden, K. M., Wells, D., and Pankow, K. (2022). “Developing a comprehensive seismic cataolog using a matched-filter detector during a 2019 stimulation at Utah FORGE,” in Proceedings, 47th workshop on geothermal reservoir engineering (Stanford University), 8. CA February 7-9.
Farrell, J., Husen, S., and Smith, R. B. (2009). Earthquake swarm and b-value characterization of the Yellowstone volcano-tectonic system. J. Volcanol. Geotherm. Res. 188, 260–276. doi:10.1016/j.jvolgeores.2009.08.008
Frolich, C., and Davis, S. D. (1993). Teleseismic b-values: Or, much ado about 1.0. J. Geophys. Res. 98, 631–644. doi:10.1029/92jb01891
Gutenberg, B., and Richter, C. F. (1944). Frequency of earthquakes in California. Bull. Seismol. Soc. Am. 34, 185–188. doi:10.1785/bssa0340040185
Holland, A. A. (2013). Earthquakes triggered by hydraulic fracturing in South-Central Oklahoma. Bull. Seismol. Soc. Am. 103 (3), 1784–1792. doi:10.1785/0120120109
Heimann, S., Isken, M., Kühn, D., Sudhaus, H., Steinberg, A., Daout, S., et al. (2018). Grond - a probabilistic earthquake source inversion framework V. 1.0. GFZ Data Serv. doi:10.5880/GFZ.2.1.2018.003
Heimann, S., Vasyura-BathkeSudhaus, H., Isken, M. P., Kriegerowski, M., Steinberg, A., and Dahm, T. (2019). A Python framework for efficient use of pre-computed Green's functions in seismological and other physical forward and inverse source problems,. Solid earth. 10 (6), 1921–1935. doi:10.5194/se-10-1921-2019
Hill, D. P., and Prejean, S. (2005). Magmatic unrest beneath mammoth mountain, California. J. Volcanol. Geotherm. Res. 146, 257–283. doi:10.1016/j.jvolgeores.2005.03.002
Ishimoto, M., and Iida, K. (1939). Observations of earthquakes registered with the microseismograph constructed recently. Bull. Earthq. Res. Inst. Univ. Tokyo 17, 443–478.
Klauk, R. H., and Gourley, C. (1983). Geothermal assessment of a portion of the Escalante valley, Utah. Utah Geol. Surv. Spec. Study 63, 64.
Klein, F. W. (2002). User’s guide to HYPOINVERSE-2000, a Fortran program to solve earthquakes locations and magnitudes. U.S. Geol. Surv., 02–171. doi:10.3133/ofr02171
Koper, K. D., Pankow, K. L., Pechmann, J. C., Hale, J. M., Burlacu, R., Yeck, W. L., et al. (2018). Afterslip enhanced aftershock activity during the 2017 earthquake sequence near Sulphur Peak, Idaho. Geophys. Res. Lett. 45, 5352–5361. doi:10.1029/2018gl078196
Kreemer, C., Blewitt, G., and Hammond, W. C. (2010). Evidence for an active shear zone in southern Nevada linking the Wasatch fault to the Eastern California shear zone. Geology 38, 475–478. doi:10.1130/g30477.1
Kühn, D., Heimann, S., Isken, M. P., Ruigrok, E., and Dost, B. (2020). Probabilistic moment tensor inversion for hydrocarbon-induced seismicity in the groningen gas field, The Netherlands, Part 1: Testing. Bull. Seism. Soc. Am. 110 (5), 2095–2111. doi:10.1785/0120200099
Lohman, R. B., and McGuire, J. J. (2007). Earthquake swarms driven by aseismic creep in the Salton Trough, California. J. Geophys. Res. 112. doi:10.1029/2006JB004596
McNutt, S. R. (2005). Volcanic seismology. Annu. Rev. Earth Planet. Sci. 33, 461–491. doi:10.1146/annurev.earth.33.092203.122459
Mesimeri, M., and Pankow, K. L. (2022). Revisiting operational aftershock forecasting in the eastern Intermountain West. Seis. Res. Lett. 93 (4), 2259–2267. doi:10.1785/0220210327
Mesimeri, M., Pankow, K. L., Baker, B., and Hale, J. M. (2021). Episodic earthquake swarms in the Mineral Mountains, Utah driven by the Roosevelt hydrothermal system, J. Geophys. Res. 126, e2021JB021659. doi:10.1029/2021jb021659
Minson, S. E., and Dreger, D. S. (2008). Stable inversions for complete moment tensors. Geophys. J. Int. 174, 585–592. doi:10.1111/j.1365-246x.2008.03797.x
Mogi, K. (1963). Some discussions on aftershocks, foreshocks and earthquake swarms: The fracture of a semi-infinite body caused by an inner stress origin and its relation to the earthquake phenomena (third paper). Bull. Earthq. Res. Inst. Univ. Tokyo 41 (3), 615–658.
Moore, J., McLennan, J., Pankow, K. L., Podgorney, R., Simmons, S., Wannamaker, P., et al. (2020). “Overview of Utah FORGE results in 2019,” in Proceedings, 45th workshop on geothermal reservoir engineering (Stanford University), 10. CA February 10-12.
Pankow, K. L., Arabasz, W. J., and Burlacu, R. (2009). “Seismicity and seismotectonic issues of western Utah,,” in Geology and geologic resources and issues of western Utah. Editors B. T. Tripp, K. Krahulec, and J. L. Jordan (Salt Lake City, UT: Utah Geological Association Pub), 38, 1–15.
Pankow, K. L., Stickney, M., Ben-Horin, J. Y., Litherland, M., Payne, S., Koper, K. D., et al. (2019). Regional seismic network monitoring in the eastern Intermountain west. Seism. Res. Lett. 91, 631–646. doi:10.1785/0220190209
Pankow, K., Mesimeri, M., McLennan, J., Wannamaker, P., and Moore, J. (2020). “Seismic monitoring at the Utah frontier observatory for research in geothermal Energy,” in Proceedings, 45th workshop on geothermal reservoir engineering (Stanford University), 9. CA February 10-12.
Pe, W. (1980). Gravity survey of the Escalante Desert and vicinity in iron and Washington counties, Utah. Salt Lake City: University of Utah. M. S. Thesis, 151.
Peng, Z., and Zhao, P. (2009). Migration of early aftershocks following the 2004 Parkfield earthquake. Nat. Geosci. 2 (12), 877–881. doi:10.1038/ngeo697
Petersen, G. M., Cesca, S., Heimann, S., Niemz, P., Dahm, T., Kühn, D., et al. (2021). Regional centroid moment tensor inversion of small to moderate earthquakes in the alps using the dense AlpArray seismic network: Challenges and seismotectonic insights. Solid earth. 12 (6), 1233–1257. doi:10.5194/se-12-1233-2021
Ross, Z. E., Cochran, E. S., Trugman, D. T., and Smith, J. D. (2020). 3D fault architecture controls the dynamism of earthquake swarms. Science 1361, 1357–1361. doi:10.1126/science.abb0779
Ross, Z. E., Rollins, C., Cochran, E. S., Hauksson, E., Avouac, J.-P., and Ben-Zion, Y. (2017). Aftershocks driven by afterslip and fluid pressure sweeping through a fault-fracture mesh. Geophys. Res. Lett. 44, 8260–8267. doi:10.1002/2017gl074634
Ross, Z. E., Trugman, D. T., Hauksson, E., and Shearer, P. M. (2019). Searching for hidden earthquakes in Southern California. Science 364, 767–771. doi:10.1126/science.aaw6888
Rowley, P. D., Cunningham, C. G., Steven, T. A., Mehnert, H. H., and Naeser, N. W. (1998). “Cenozoic igneous and tectonic setting of the Marysvale volcanic field and its relation to other igneous centers in Utah and Nevada,” in Laccolith complexes of southeastern Utah: Time of emplacement and tectonic setting; workshop proceedings. Editors J. D. Friedman, and A. C. J. Huffman (Denver, CO: U. S. Geological Survey Bulletin), 2158, 167–201.
Ruhl, C. J., Abercrombie, R. E., Smith, K. D., and Zaliapin, I. (2016). Complex spatiotemporal evolution of the 2008 Mw 4.9 Mogul earthquake swarm (Reno, Nevada): Interplay of fluid and faulting. J. Geophys. Res. 121 (11), 8196–8216. doi:10.1002/2016jb013399
Scholz, C. (2019). The mechanics of earthquakes and faulting 3rd ed. Cambridge: Cambridge University Press. doi:10.1017/9781316681473
Shapiro, S. (2015). Fluid-induced seismicity. Cambridge University Press. doi:10.1017/cbo9781139051132A
Shelly, D. R. (2020). A high-resolution seismic catalog for the initial 2019 ridgecrest earthquake sequence: Foreshocks, aftershocks, and faulting complexity. Seis. Res. Lett. 91, 1971–1978. doi:10.1785/0220190309
Shelly, D. R., Ellsworth, W. L., and Hill, D. P. (2016). Fluid-faulting evolution in high definition: Connecting fault structure and frequency-magnitude variations during the 2014 Long Valley Caldera, California, earthquake swarm. J. Geophys. Res. Solid Earth 121, 1776–1795. doi:10.1002/2015jb012719
Shelly, D. R., Hill, D. P., Massin, F., Farrell, J., Smith, R. B., and Taira, T. (2013). A fluid-driven earthquake swarm on the margin of the Yellowstone caldera,. J. Geophys. Res. Solid Earth 118, 4872–4886. doi:10.1002/jgrb.50362
Simpson, D. W., Leith, W. S., and Scholz, C. H. (1988). Two types of reservoir-induced seismicity. Bull. Seis. Soc. Am. 78, 2025–2040. doi:10.1785/bssa0780062025
Smith, R. B., and Arabasz, W. J. (1991). “Seismicity of the Intermountain seismic belt,” in Neotectonics of north America. Editors D. B. Slemmons, E. R. Engdahl, M. D. Zoback, and D. D. Blackwell (Boulder, CO: Geological Society of America), 1, 185–228. Decade Map Volume.
Talwani, P., and Acree, S. (1984). Pore pressure diffusion and the mechanism of reservoir-induced seismicity. PAGEOPH 122, 947–965. doi:10.1007/bf00876395
van der Elst, N. J. (2021). B-positive: A robust estimator of aftershock magnitude distribution in transiently incomplete catalogs,. J. Geophys. Res. 126, e2020JB021027. doi:10.1029/2020jb021027
Vidale, J. E., Boyle, K. L., and Shearer, P. M. (2006). Crustal earthquake bursts in California and Japan: Their patterns and relation to volcanoes. Geophys. Res. Lett. 33, L20313. doi:10.1029/2006GL027723
Waldhauser, F., and Ellsworth, W. L. (2000). A double-difference earthquake location algorithm: Method and application to the northern Hayward Fault, California,. Bull. Seism. Soc. Am. 90 (6), 1353–1368. doi:10.1785/0120000006
Wang, R. (1999). A simple orthonormalization method for stable and efficient computation of Green's functions,. Bull. Seism. Soc. Am. 89 (3), 733–741. doi:10.1785/bssa0890030733
Whidden, K. M., and Pankow, K. L. (2012). A catalog of regional moment tensors in Utah from 1998 to 2011. Seismol. Res. Lett. 83, 775–783. doi:10.1785/0220120046
Keywords: seismology, swarm, Utah, intermountain seismic belt, diffusivity, matched-filter, relative relocation, moment tensor
Citation: Whidden KM, Petersen GM, Mesimeri M and Pankow KL (2023) Analysis of the 2021 Milford, Utah earthquake swarm: Enhanced earthquake catalog and migration patterns. Front. Earth Sci. 11:1057982. doi: 10.3389/feart.2023.1057982
Received: 30 September 2022; Accepted: 10 January 2023;
Published: 01 February 2023.
Edited by:
Nicola Alessandro Pino, National Institute of Geophysics and Volcanology (INGV), ItalyReviewed by:
Filippos Vallianatos, National and Kapodistrian University of Athens, GreeceYijian Zhou, University of California, Riverside, United States
Luisa Valoroso, Istituto Nazionale di Geofisica e Vulcanologia (INGV), Italy
Copyright © 2023 Whidden, Petersen, Mesimeri and Pankow. This is an open-access article distributed under the terms of the Creative Commons Attribution License (CC BY). The use, distribution or reproduction in other forums is permitted, provided the original author(s) and the copyright owner(s) are credited and that the original publication in this journal is cited, in accordance with accepted academic practice. No use, distribution or reproduction is permitted which does not comply with these terms.
*Correspondence: Katherine M. Whidden, a2F0aGVyaW5lLndoaWRkZW5AdXRhaC5lZHU=
†Present address: Gesa M. Petersen, GFZ German Research Centre for Geosciences, Potsdam, Germany