- Rock and Geomaterials Laboratory, Stanford University, Stanford, CA, United States
Brittle deformation is prevalent in both geological processes and engineered structures, so probing its actions is an important task as much for Earth materials and engineered ones. To characterize brittle deformation, acoustic waves are especially useful in revealing deformation processes. To promote the use of acoustic techniques, we present an integrated characterization approach that includes both acoustic data collection and analysis. By customizing a rock sample and acoustic sensor assembly, we incorporate acoustic data acquisition into a core holder system that accommodates relatively small samples (2.54 cm diameter) under triaxial loading. Along with fast and high-resolution acoustic waveform recording, the compact design facilitates convenient collection of high-quality acoustic data. To meet the challenge of efficiently and accurately picking P-wave arrivals for hundreds of thousands of acoustic waveforms, we modified and implemented a deep neural network model from the seismology literature called PhaseNet. After training with an augmented dataset of manually-picked arrivals (a total of around 50,000 waveforms), the modified PhaseNet model achieved more than 88% (96%) picking accuracy within ±1 μs (±2 μs) time residual relative to manual picks. This demonstrates the potential of integrating deep learning techniques into the workflow of acoustic data analysis for rapid and accurate extraction of valuable information from a large acoustic dataset. Finally, we conducted high-resolution micro-computed tomography (micro-CT) to inform and complement acoustic characterization at micron- and centimeter-scales. Microscopic observations validate the spatial development of two macroscopic fractures, and suggest that deformation-induced changes in velocity need to be incorporated for accurately locating microcracking events. Thus, integrating acoustic monitoring, a deep neural network, and micro-CT imaging offers an effective means to understand brittle deformation from micro to centimeter scales.
1 Introduction
Brittle deformation, including microcracking, fracturing, and frictional sliding, is prevalent in both geological processes and engineered structures. This mode of localized deformation favors low pressure and low temperature conditions and typically occurs above Earth’s surface or at shallow depths, where humans and the Earth system share the strongest interactions. For example, landslide and earthquake constantly shape landscapes and impose hazards to human populations; extracting resources and storing fluids in rock formations are vital means to sustaining humanity. In particular, geological storage of green-house gases (e.g., CO2) and clean energy media (e.g., H2) can serve as an effective tool in fighting climate change. Therefore, characterizing and probing brittle deformation have always been important tasks for geoscientists.
Among various methods, acoustic characterization remains a powerful nondestructive technique for studying brittle deformation. When used in passive mode, this technique involves collecting acoustic waves emitted during the energy release of brittle deformation such as microcracking. By studying these elastic waves, one can investigate brittle failure in terms of microcrack locations, source mechanisms, and energy release. Acoustic characterization can also be utilized in active mode by deliberately sending acoustic waves to rocks or geomaterials and sensing reflected or transmitted waves that contain rich information on material properties. In the field, seismic monitoring utilizing both active (e.g., surface seismic) and passive (e.g., microseismic) waves has enabled us to map geological structures and quantify formation properties (Verdon et al., 2009; Maxwell et al., 2010; Raeesi et al., 2012; Porritt et al., 2014; Byerley et al., 2018). Geophysical imaging through velocity tomography has advanced from 2D to 3D, and to time-lapse 3D (i.e., 4D), which has considerably enhanced our knowledge of the subsurface and its changes through time (Lumley, 2001; Vanorio et al., 2005; Ajo-Franklin et al., 2013; De Landro et al., 2020). Under the well-controlled conditions in the laboratory, our understanding of brittle deformation has been significantly improved. From acoustic emission (AE) experiments, the complex brittle failure processes involving microcrack initiation, propagation, coalescence, and frictional sliding are documented (Lockner et al., 1992; Lei et al., 2000a; Fortin et al., 2006; Browning et al., 2017; Guo and Zhao, 2022). These laboratory observations have advanced our understanding of geological phenomena at a much larger scale, such as faulting and earthquakes (Lockner, 1993; Lei et al., 2000b; Johnson et al., 2013; Aben et al., 2019). Similarly, active acoustic characterization such as the pulse-echo and pulse-transmission techniques has allowed us to quantify rock properties and detect inhomogeneities (Lockner et al., 1977; Pyrak-Nolte et al., 1990; Espinoza and Santamarina, 2011; Knuth et al., 2013; Modiriasari et al., 2017; Geremia and David, 2021). Laboratory-scale velocity tomography, although quite challenging, has provided a precious opportunity to observe deformation over time (Falls et al., 1992; Brantut, 2018; Aben et al., 2019; Zhu et al., 2021). These findings have enhanced the interpretation of seismic data from the field (Meadows and Winterstein, 1994; Verdon and Wüstefeld, 2013; Cai et al., 2014).
Although laboratory acoustic techniques lend us a rich perspective of brittle deformation, there are still challenges for its utilization. Laboratory acoustic systems are rather complex, which often involves a large loading frame and typically accommodates relatively large samples (diameters greater than 5.08 cm) (e.g., Alkan et al., 2007; Thompson et al., 2009; Xie et al., 2011; Aker et al., 2014; Kim et al., 2015; Ye and Ghassemi, 2020). This limitation leads to only a small number of acoustic systems in research laboratories worldwide. Moreover, acoustic experiments often generate very large datasets. Commonly, one AE experiment can record hundreds of thousands acoustic waveforms, posing a challenge for efficiently processing data. The basic task of manually picking first-arrivals has quickly become impractical. Yet it is critical to achieve efficient and accurate arrival-picking as this fundamental step has a direct impact on the efficiency and error of the overall acoustic data analysis (e.g., velocity tomography, event location) (Lei, 2017; Brantut, 2018). Feature- and statistics-based automated approaches are most commonly used, such as the short-term average/long-term average/method (STA/LTA; Allen, 1978) and the Akaike’s Information Criterion (AIC; Akaike, 1998). However, they are still not accurate enough for noisy data (Sharma et al., 2010; Akram and Eaton, 2016). In recent years, deep-learning based algorithms, such as convolution neural networks (Ross et al., 2018; Yuan et al., 2018; Chen et al., 2019; Wang et al., 2019; Zhu and Beroza, 2019), have showed promise for picking seismographs. However, very few deep learning models have been developed for picking laboratory acoustic data (Zheng et al., 2018; Guo et al., 2020), and none have exhibited metrics matching those in the field of seismology. Finally, although acoustic characterization nondestructively probes brittle deformation within rocks or geomaterials, direct observations such as those from microscopic images are necessary to validate and improve the interpretation of acoustic data. In particular, high-resolution imaging reveals key microscopic features and processes that control bulk behavior and properties. Therefore, an approach that integrates a compact acoustic system, efficient data analysis, and detailed imaging at the micro- and macro-scales is valuable for studying brittle deformation.
In this paper, we present an integrated acoustic characterization approach that includes both acoustic data collection and analysis. First, we developed a compact and adaptable acoustic system under triaxial conditions that can be readily instrumented in rock physics laboratories and allows for collecting high-quality acoustic data. Then, we modified and implemented a deep neural network model from the seismology literature (PhaseNet by Zhu and Beroza, 2019) to efficiently and accurately pick P-wave arrivals. Finally, we utilized high-resolution micro-CT imaging to inform and complement acoustic characterization of fracturing processes. By integrating acoustic monitoring, a deep neural network, and micro-CT imaging, we propose an effective means to probe brittle deformation from micro to centimeter scales.
2 Methods
2.1 Triaxial and acoustic system
2.1.1 Triaxial loading vessel
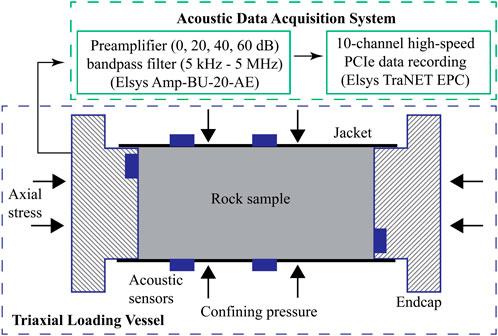
Triaxial loading is applied on 2.54 cm diameter and 5.08 cm length cylindrical rock samples using a Core Laboratories HCH-1.0-AC core holder with a confining pressure rating of 69.0 MPa and a maximum axial stress of approximately 200 MPa (Figure 1). Axial stress and confining pressure in the radial direction are controlled independently by a Quizix QX-6000 dual piston pump. While confining pressure is maintained at a constant hydraulic oil pressure, axial stress is applied by moving one loading piston at a constant flow rate ranging from 0.001 to 50 mL/min. Thus, adjusting flow rate allows application of different strain rates on samples. Changes in sample length due to stress are measured using three linear potentiometers mounted on the outside of the loading piston.
2.1.2 Acoustic jacket
A total of ten piezoelectric sensors are utilized in the acoustic measurements. These sensors are PZT-5A P-wave ceramic crystals (Boston Piezo-Optics Inc.) with 0.38 cm diameter and 1.5 MHz resonance frequency (Figure 2A). Two sensors are embedded in the endcaps and eight are mounted on a customized nitrile rubber jacket. To protect sensors on the jacket during mechanical loading, they are placed within custom-built bronze housings (Figure 2A). The metal housing protects acoustic sensors and its connection during rock deformation so they can record data continuously and be used repeatedly. One end of the housing is machined in a concaved shape to match the sample curvature. These housings are glued into pre-drilled holes of the acoustic jacket using high shear-strength epoxy and connected to a high-pressure feedthrough (Figure 2B). Acoustic sensors are arranged in a manner to maximize acoustic wave coverage (Figure 2C). The acoustic jacket is highly customizable in terms of the number and type of sensors and their relative locations. It can be used multiple times and only the nitrile rubber needs to be replaced for long-term use.
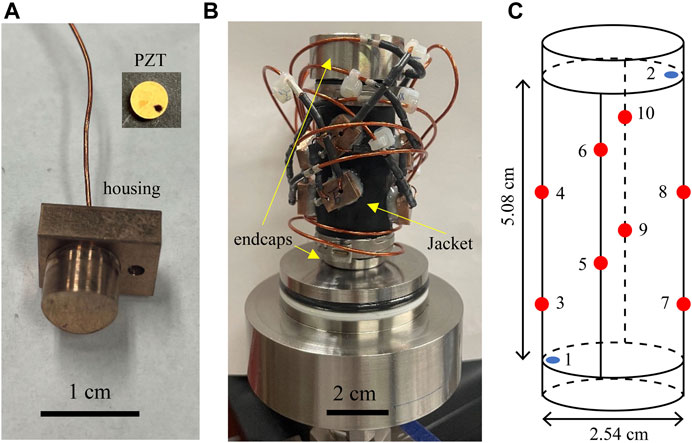
FIGURE 2. Photographs of (A) acoustic sensor and housing, (B) acoustic sensor-rock sample assembly including black acoustic jacket, and (C) schematic of acoustic sensor locations in the jacket. Red dots in (C) signify sensors mounted on the jacket. Blue dots are the sensors installed on endcaps that are partially inserted into the jacket at the top and bottom.
2.1.3 Acoustic system data acquisition
Acoustic signals are first amplified by a preamplifier (Elsys Amp-BU-20-AE) and then recorded by a PCIe data acquisition system (Elsys TraNET EPC) (Figure 1). The system is currently equipped with 10 channels and allows expansion up to 64 channels in single-ended mode. All channels can be triggered independently by acoustic events and each channel can be configured to a maximum sampling rate of 240 MS/s (million samples per second) with 16-bit resolution in voltage. Up to 128 million data points can be recorded by onboard memory per channel to facilitate rapid waveform recording. The system is capable of two modes of data acquisition: active pulsing and passive listening. In the active pulsing mode, the preamplifier can be used to sequentially excite each of the acoustic sensors, while the non-excited sensors record the actively generated acoustic waves. In the passive listening mode, all acoustic sensors passively listen to acoustic waves generated either by rock deformation processes or an external pulser.
2.2 Experiment
To test the acoustic system and develop a workflow that allows for an effective and robust acoustic characterization, we conducted a triaxial test on a Berea sandstone sample. As a common test sample in rock mechanics experiments, Berea sandstone is primarily composed of well-sorted and well-rounded quartz grains (85%—90%) and minor feldspar grains (3%—6%). These grains range in size between 70 and 400 μm and are cemented by quartz, dolomite (1%-2%), and clays (6%-8%) (Churcher et al., 1991). The sample has a porosity of 18.3% and a permeability of 64 mD. While subjecting the sample to a constant confining pressure of 5 MPa at room temperature, axial stress was applied by the Quizix pump at 0.1 mL/min to achieve a strain rate of 10-5/s strain rate. The sample was deformed to generate macroscopic fractures and subsequently underwent fictional sliding along the fractures. Throughout the deformation test, acoustic emission was monitored at 5 MHz sampling rate and 40 dB pre-amplification (with bandpass filtering at 5 kHz—2 MHz). Acoustic data were recorded by events, which are defined as the set of acoustic signals associated with the same source. Each event was saved in a single ASCII file containing all 10 waveforms, one for each of the piezoelectric sensors.
2.3 P-wave first-arrival picking using a deep neural network
2.3.1 Modified PhaseNet model
Since each test generates hundreds of thousands of acoustic waveforms, it poses a major challenge for efficiently and accurately processing acoustic data. This is especially the case for determining acoustic event locations, which heavily depends on the accuracy of picking first-arrivals. In recent years, various deep learning models have been explored to tackle this challenge at field (Ross et al., 2018; Zhu and Beroza, 2019) and laboratory (Zheng et al., 2018; Guo et al., 2020) scales. A promising deep neural network model from the seismology literature called PhaseNet has achieved high accuracy of first-arrival picking for both P- and S-waves (Zhu and Beroza, 2019). We modified the PhaseNet model for easy application to laboratory P-wave data (Figure 3). The first adaptation was to collapse the input from three channels to one. The second was to remove one convolution-plus-stride layer in order to avoid having too few points left in the one-dimensional feature maps prior to deconvolution (i.e., transpose convolution). Lastly, we built our modified PhaseNet (mPhaseNet) model in Python using the simple, high-level Keras API. Given the very different data input from that used to train PhaseNet, we trained our model with a subset of manually-picked first-arrivals from the experiment. Like Zhu and Beroza’s model, mPhaseNet outputs the probability of the first-arrival for any input waveform. The first-arrival can then be obtained as the time associated with the highest probability.
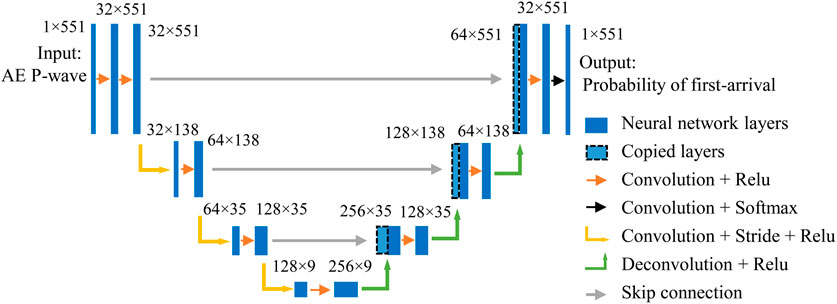
FIGURE 3. Schematic of the architecture for the modified PhaseNet model. The deep neural network model takes in acoustic P-wave data and outputs the probability of the first-arrival. Blue rectangles represent neural network layers. Data structure is labeled for each layer in the form of number of channels × number of data points. Arrows indicate mathematical operations between neural network layers. The figure is adapted from the scheme in Zhu and Beroza. (2019).
2.3.2 Acoustic data processing
First, we applied an AIC algorithm to approximate the arrival-times of P-waves (Akaike, 1998). AE events require at least four picks for computing locations. However, for several events for which we could manually pick ten first-arrivals, we observed much higher consistency among source locations obtained using multiple combinations of five or more arrivals than those only using combinations of four arrivals. Hence, we only retained AE events with five or more AIC-generated picks. This led to a total of 14,587 events. Then, we manually checked and adjusted the arrivals for 581 events, which gave a total of approximately 3500 waveforms with confident P-wave first-arrival picks. This manually-picked and unfiltered dataset was split 70:15:15 and respectively used to train, validate, and test the mPhaseNet model, which consisted of 458,337 trainable parameters.
One challenge of training neural networks is that they can often contain many parameters such that large datasets are required to prevent overfitting (Bejani and Ghatee, 2021). To combat this problem, we utilized data augmentation for the training data. First, we duplicated each waveform and flipped its sign, essentially doubling the dataset. Then, we duplicated each of these 10 times and translated each copy in time by a randomly generated amount within a window of −40 to +5 μs. In the end, our training dataset size was enhanced by a factor of 20 (i.e., ∼50,000 waveforms). In contrast, the validation and test sets (which were not augmented) contained just over 500 waveforms.
2.4 Micro-CT imaging
We performed X-ray micro-CT imaging on the failed sample to characterize microcracks associated with the fracturing process. Using a ZEISS Xradia 520 Versa, the whole sample was scanned at a resolution of 57 μm and interior regions of fractures were scanned at a higher resolution of 5 μm. With a polychromatic beam centered at 140 kV, the lower and higher resolution scans utilized optical magnifications of 0.4X and 4X and ZEISS “HE1” and “HE2” filters, respectively. Using the supplied ZEISS software, 3D microstructures were reconstructed after optimizing the center shift and beam hardening constants. Data exploration and analysis were conducted using Dragonfly 2021 software (Dragonfly, 2021).
3 Results
3.1 Stress strain and cumulative AE events
Differential stress (axial stress minus confining pressure) on Berea sandstone increased monotonically with time before reaching peak stress (Figure 4A). During this period, there were very few AE events. Once differential stress started deviating from the linear trend, that is, when Berea sandstone started yielding, the cumulative number of AE events increased rapidly (see Figure 4B for an example of an AE waveform). After reaching peak stress, the Berea sandstone experienced two instantaneous stress drops, reflecting two macroscopic fracturing processes (Figure 4C). This was accompanied by two drastic increases in AE counts. After the second instantaneous stress drop, the differential stress increased slowly over time. At this stage, the cumulative number of AE events continued to rapidly increase.
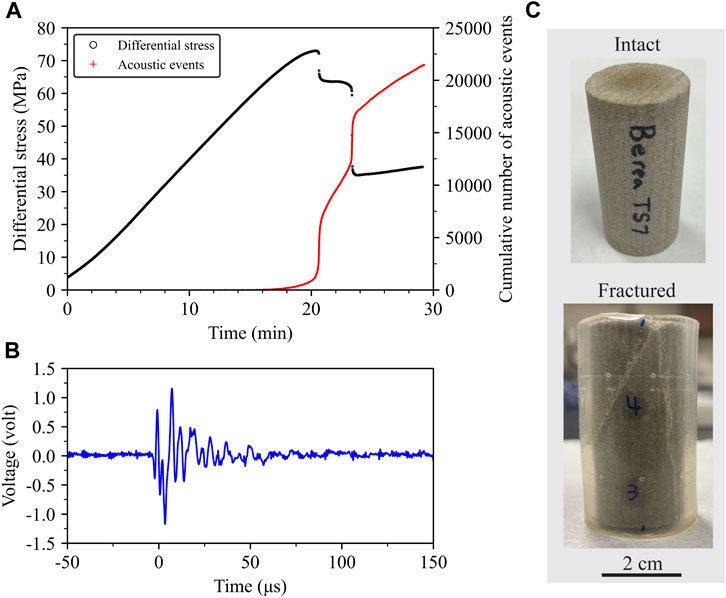
FIGURE 4. (A) Plots of differential stress and cumulative number of acoustic events versus time, (B) an example of an AE waveform, and (C) photographs of the Berea sandstone sample before and after the triaxial experiment.
3.2 P-wave first-arrival picking
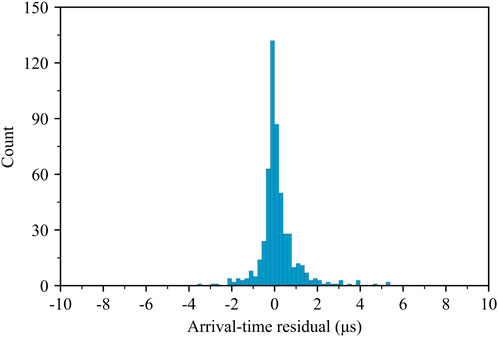
The mPhaseNet model is capable of accurately picking first-arrivals for both clean and noisy AE waveforms (Figure 5). Nearly all picks from the deep neural network model fall within +/– 2 μs of the manual picks (Figure 6). To quantitatively assess performance, we define three evaluation metrics as the following:
where P, R, and F1 are precision, recall, and F1 score, respectively; Tp is the number of true positives, Fp is the number of false positives, and Fn is the number of false negatives. We define the arrival-time residual (Δt) as the arrival-time difference between mPhaseNet and manual picks (i.e., mPhaseNet pick minus manual pick). True positives are defined as picks with arrival-time residuals within a preset threshold k (i.e., -k < Δt < k). False positives are the picks with arrival-time residuals less than -k (i.e., Δt < -k). Finally, those picks with arrival-time residuals greater than k (i.e., Δt > k) are counted as false negatives. Note that, in our use case, we have defined Fp and Fn (and consequently, P, R, and F1) differently from Zhu and Beroza (2019). Based on the above definitions, true positives are satisfactory picks for a given acceptable residual, false positives represent unsatisfactory early picks, and false negatives are unsatisfactory late picks. While precision evaluates the percentage of satisfactory picks among all satisfactory and early picks, recall assesses the proportion of satisfactory picks among satisfactory and late picks. F1 score offers a balanced evaluation between precision and recall. For an arrival-time threshold of 2 μs, all three metrics are close to 100% (Table 1). For a lower threshold of 1 μs, which represents a stricter acceptable residual, all three metrics are still around 90%. In both cases, F1 score is above 90%. Precision is higher than recall indicating that mPhaseNet tends to pick late more often than early.
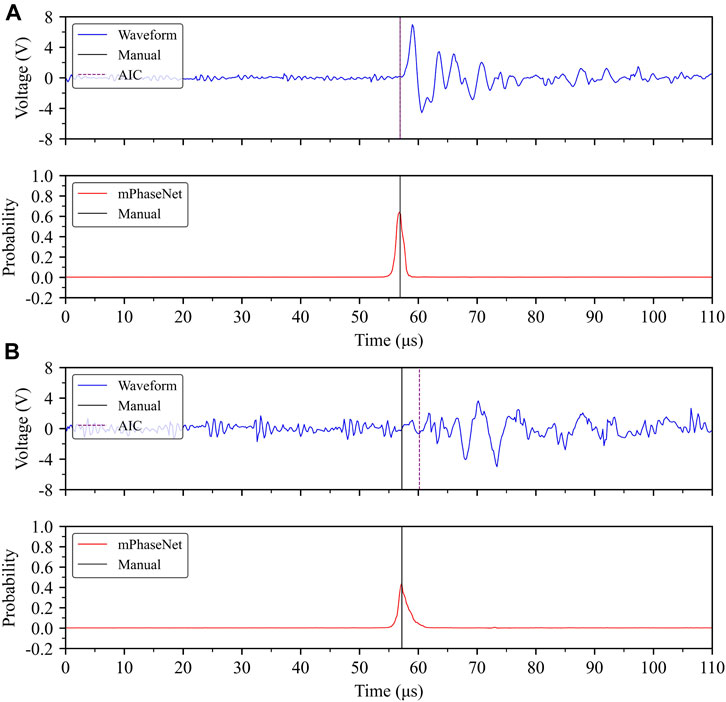
FIGURE 5. Examples of (A) clean and (B) noisy AE waveforms with first-arrival picks by mPhaseNet, AIC, and manual picking.
3.3 Event locations
The mPhaseNet model was used to pick first-arrivals for the rest of the acoustic dataset (i.e., waveforms that were not manually picked). Then, all picks were used to determine acoustic event locations. We applied a constant P-wave velocity of 3151 m/s which was measured on a benchtop acoustic system before the triaxial experiment. Previous works have shown that a simplified velocity model allows for capturing key brittle processes (e.g., Scholz, 1968; Sondergeld and Estey, 1981; Ingraham et al., 2013). In solving for event locations, we applied the Nelder-Mead simplex algorithm (Nelder and Mead, 1965) to minimize the difference between observed and predicted arrival times of acoustic waves. Figure 7 shows event locations overlaid on micro-CT images. The bulk sample is shown in Figure 7A at 57 μm resolution, whereas Figure 7B shows in detail part of a fracture at a higher resolution of 5 μm. Both images are sliced from the center of the sample. Acoustic event locations are also center slices with a thickness of 4 mm. These events follow the two fractures, although there appears to be a systematic offset in the location of the longer fracture. Based on the time sequence of these events, it is evident that the short fracture formed first and was followed by the formation of the long fracture.
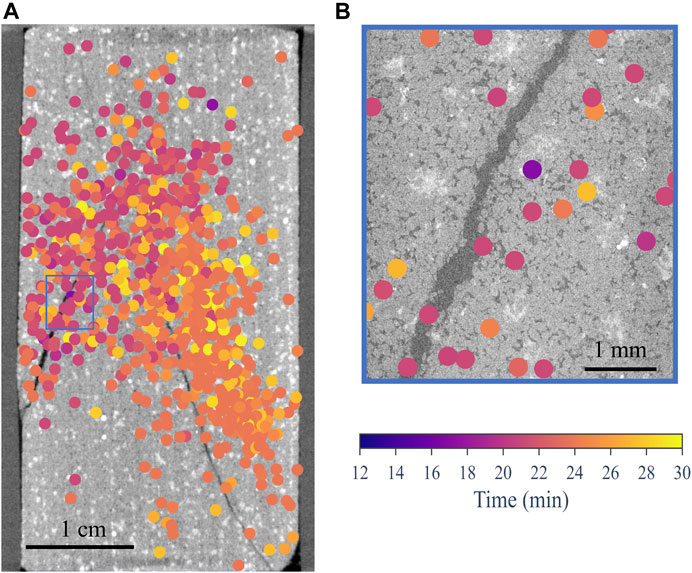
FIGURE 7. Micro-CT slices of (A) the bulk sample at a resolution of 57 μm, (B) interior tomography of part of a fracture at a resolution of 5 μm. The location of the interior tomograph is shown in (A) with a blue rectangle. Both slices are from the center of the sample. Color dots represent acoustic event locations, which are sliced from the center of the sample with a thickness of 4 mm. Event locations are color-coded by the elapsed time during the experiment.
4 Discussion
The developed acoustic system proves to be a useful tool for studying brittle deformation. As shown in our experiment, most of the acoustic events are associated with macroscopic fracturing and subsequent sliding along the macro-fractures (Figure 4). By analyzing hundreds of thousands of acoustic waveforms, we can investigate locations, source mechanisms, and energy release of brittle failures as well as measure the acoustic velocity field. Despite the valuable information an acoustic system can provide, acoustic measurements are not routinely performed due partly to the complexity of setting up such a system. Our acoustic system demonstrates an example of utilizing a core holder that is commonly equipped in the laboratories studying rocks and geomaterials. The customized sample-sensor assembly accommodates relatively small samples (2.54 cm diameter), which allows for convenient integration into a core holder. This avoids the need of a large, complicated, and expensive loading system. Additionally, the sample-sensor assembly offers great adaptability by customizing sensor types (P- and S-wave sensors) and position based upon experimental needs. Therefore, a compact and adaptable acoustic system as shown here can be readily instrumented in rock physics laboratories and allows for collecting high-quality acoustic data.
Another obstacle for utilizing acoustic measurements is the challenge of analyzing a large dataset, which typically contains hundreds of thousands of acoustic waveforms. A good example is the picking of wave arrivals for determining acoustic velocity and event locations. Manual picking by experienced analysts gives the highest accuracy, but it is unfeasible to do this on a routine basis with the large amount of data produced in tests like ours. Although many automatic picking algorithms have been developed, it is still difficult to accurately pick noisy waveforms (Sharma et al., 2010; Akram and Eaton, 2016). In this context, deep-learning based approaches have the greatest potential by integrating some manual picking and intelligent feature-extraction algorithms. The mPhaseNet model demonstrates promising first-arrival picking accuracy with around 3500 manual picks (Figures 5, 6). Although deep learning models typically require much larger training datasets (e.g., millions of manually-picked seismographs for the PhaseNet model), our results show that by properly augmenting a few thousand manual picks, it is possible to achieve a higher picking accuracy than the conventional picking algorithm AIC, which has been the recommended technique for picking laboratory acoustic data (Grosse et al., 2021). In fact, our manually-picked dataset was based on the checking and adjustment of AIC-generated picks. Applying the AIC picker significantly accelerated the preparation of the manually-picked dataset. For high signal-to-noise ratio (SNR) waveforms, the AIC picker typically produced accurate picks (although there were exceptions). From the test dataset, Figure 5A shows an example of an AIC pick that we accepted as the manual pick, and how mPhaseNet reproduced the accurate pick. However, we noticed that the AIC picks for low SNR waveforms are much less reliable. Therefore, adjustments were often needed to find accurate first-arrivals; Figure 5B shows an example of an AIC pick that is later than the actual first-arrival. Due to its intelligent feature-extraction algorithm, mPhaseNet is capable of achieving accurate picks for noisy data. In fact, no noise filtering was necessary for model training and inference, as in the case of the original PhaseNet (Zhu and Beroza, 2019). To investigate the impact of these two picking algorithms on AE data analysis, we determined event locations using fist-arrival picks from both mPhaseNet and AIC. For the entire dataset, mPhaseNet picks located 3% more events than AIC picks within physical boundaries of sample. In Figure 8, events were sliced from the center of the sample and overlaid on top of the center micro-CT image. The thickness of the event slice was set to the location uncertainty of 4 mm. When plotting all locatable events by each algorithm (Figures 8A,B), mPhaseNet-based event locations more clearly delineate the two macroscopic fractures, whereas AIC-based locations are more scattered. In addition, AIC picks produced many event locations close to the end of the experiment (see yellow dots in Figure 8B). These events are associated with frictional sliding of the two fractures. However, most of these events are not aligned with fractures. For comparison, mPhaseNet-based event locations are primarily associated with the formation of the two fractures when most acoustic events were generated (see Figure 4A and purple and orange dots in Figure 8A). When plotting the same events from both algorithms (Figures 8C,D), mPhaseNet-based locations still more clearly delineate the two fractures, especially the long fracture. These observations suggest that mPhaseNet achieves more accurate first-arrival picking than AIC, such that events are more accurately located. Therefore, deep-learning based approaches have the potential to increase the accuracy of first-arrival picking for laboratory acoustic data. This is especially due to its accurate picking of low SNR acoustic waves. Currently, mPhaseNet can be further improved, for example, by increasing the training dataset manually or through further data augmentation (e.g., expanding and contracting waveforms). For similar experiments, such as those on the same lithology under similar pressure conditions, the mPhaseNet model may only need to be trained once. This will further accelerate the speed of acoustic data analysis. Nevertheless, our results show the high potential of utilizing deep-learning based models for more efficient and accurate acoustic data analysis.
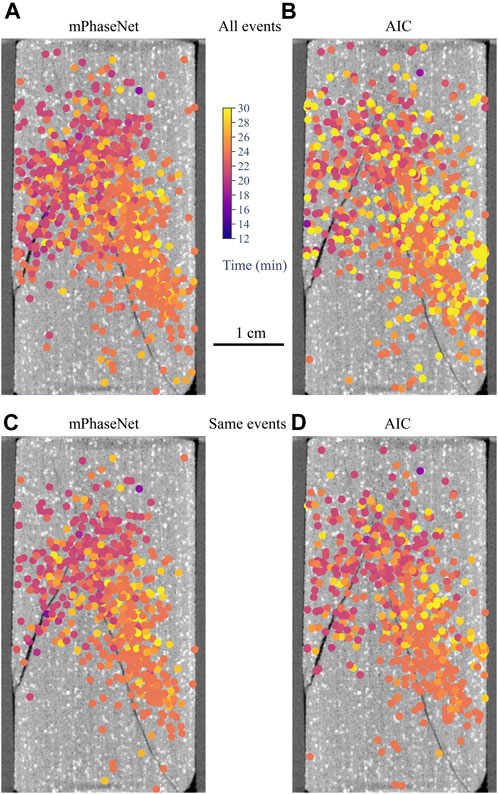
FIGURE 8. Comparison of acoustic event locations derived from mPhaseNet and AIC first-arrival picks. All events are shown for (A) mPhaseNet-based locations and (B) AIC-based locations. Same events are shown for (C) mPhaseNet-based locations and (D) AIC-based locations after removing those that are located by only one of the two picking algorithms. Color dots represent acoustic event locations, which are sliced from the center of the sample with a thickness of 4 mm. Event locations are color-coded by the elapsed time during the experiment. Micro-CT slices are from the center of the fractured sample.
As an indirect technique for understanding brittle deformation, acoustic measurements can be greatly complemented by direct observations from high-resolution imaging. While acoustic characterization allows us to reconstruct brittle processes (e.g., microcracking, fracturing), microscopic observations offer physical evidence to validate and refine the understandings we gain from acoustic characterization. After our experiment, we observed two macroscopic fractures as a result of brittle failure. Through acoustic analysis, we reconstructed the spatial and temporal sequence of these two fracturing processes. Comparing to the micro-CT image, we verified that acoustic events are approximately aligned with these two fractures. There are still many events scattered around the fractures which could be due to: 1) microcracking away from the main fracture and/or 2) uncertainty of event locations that are associated with changing velocity field during deformation. The latter is consistent with the observation that the systematic offset between fracture and events is more extreme for the second fracture, for which the velocity field is particularly different from its starting value. For simplicity, we used a constant velocity for calculating event locations. In reality, acoustic velocity changes with deformation (e.g., Nur and Simmons, 1969; Sayers and Kachanov, 1995; Stanchits et al., 2006; Browning et al., 2017). To account for this effect, one can perform active pulsing throughout loading to record velocity. By updating velocity for different stages of deformation, event locations can be determined more accurately (Stanchits et al., 2011; Wang et al., 2020). We are working on utilizing the active pulsing function to improve location accuracy.
To make the best use of the power of acoustic characterization, an integrated approach is necessary for efficient and accurate analysis. In this paper, we show an approach that integrates a compact and adaptable acoustic system, a deep neural network, and micro-CT imaging. It allows us to conveniently collect high-quality acoustic data, efficiently perform data analysis, and enhance interpretation with microscopic observations. Such an approach can be a useful tool for characterizing brittle deformation across scales (i.e., from micrometers to centimeters). In particular, the integrated approach can be incorporated into the urgently needed application of geo-storage technology. This includes quantifying microcracks and fractures for caprock seal integrity and measuring velocity fields for mapping fluid distributions. Thus, the integrated acoustic characterization could play a role in improving knowledge and technology for successful geo-storage applications.
Data availability statement
The raw data supporting the conclusion of this article will be made available by the authors, without undue reservation.
Author contributions
TV conceived and supervised the research project. JD and AC designed and set up the acoustic system, carried out the experiments. AC developed the mPhaseNet model. JD performed micro-CT imaging. JD and AC processed the data. JD, AC, and TV interpreted the data. JD wrote the manuscript. AC and TV revised the manuscript. All authors listed have made a substantial, direct, and intellectual contribution to the work and approved it for publication.
Funding
This work was supported by the Stanford Rock and Geomaterials Affiliates Program and the Stanford Doerr School of Sustainability.
Acknowledgments
The authors would like to thank Saied Mighani for the initial setup of the acoustic system. Part of this work was performed at the Stanford Nano Shared Facilities (SNSF), supported by the National Science Foundation under award ECCS-2026822.
Conflict of interest
The authors declare that the research was conducted in the absence of any commercial or financial relationships that could be construed as a potential conflict of interest.
Publisher’s note
All claims expressed in this article are solely those of the authors and do not necessarily represent those of their affiliated organizations, or those of the publisher, the editors and the reviewers. Any product that may be evaluated in this article, or claim that may be made by its manufacturer, is not guaranteed or endorsed by the publisher.
References
Aben, F. M., Brantut, N., Mitchell, T. M., and David, E. C. (2019). Rupture energetics in crustal rock from laboratory-scale seismic tomography. Geophys. Res. Lett. 46 (13), 7337–7344. doi:10.1029/2019GL083040
Ajo-Franklin, J. B., Peterson, J., Doetsch, J., and Daley, T. M. (2013). High-resolution characterization of a CO2 plume using crosswell seismic tomography: Cranfield, MS, USA. Int. J. Greenh. Gas Control 18, 497–509. doi:10.1016/j.ijggc.2012.12.018
Akaike, H. (1998). “Information theory and an extension of the maximum likelihood principle,” in Selected papers of hirotugu Akaike. Editors E. Parzen, K. Tanabe, and G. Kitagawa (New York: Springer), 199–213.
Aker, E., Kühn, D., Vavryčuk, V., Soldal, M., and Oye, V. (2014). Experimental investigation of acoustic emissions and their moment tensors in rock during failure. Int. J. Rock Mech. Min. Sci. 70, 286–295. doi:10.1016/j.ijrmms.2014.05.003
Akram, J., and Eaton, D. W. (2016). A review and appraisal of arrival-time picking methods for downhole microseismic data. Geophysics 81 (2), KS71–KS91. doi:10.1190/GEO2014-0500.1
Alkan, H., Cinar, Y., and Pusch, G. (2007). Rock salt dilatancy boundary from combined acoustic emission and triaxial compression tests. Int. J. Rock Mech. Min. Sci. 44 (1), 108–119. doi:10.1016/j.ijrmms.2006.05.003
Allen, R. V. (1978). Automatic earthquake recognition and timing from single traces. Bull. Seismol. Soc. Am. 68 (5), 1521–1532. doi:10.1785/BSSA0680051521
Bejani, M. M., and Ghatee, M. (2021). A systematic review on overfitting control in shallow and deep neural networks. Artif. Intell. Rev. 54 (8), 6391–6438. doi:10.1007/s10462-021-09975-1
Brantut, N. (2018). Time-resolved tomography using acoustic emissions in the laboratory, and application to sandstone compaction. Geophys. J. Int. 213 (3), 2177–2192. doi:10.1093/gji/ggy068
Browning, J., Meredith, P. G., Stuart, C. E., Healy, D., Harland, S., and Mitchell, T. M. (2017). Acoustic characterization of crack damage evolution in sandstone deformed under conventional and true triaxial loading. J. Geophys. Res. Solid Earth 122 (6), 4395–4412. doi:10.1002/2016jb013646
Byerley, G., Monk, D., Aaron, P., and Yates, M. (2018). Time-lapse seismic monitoring of individual hydraulic frac stages using a downhole DAS array. Lead. Edge 37 (11), 802–810. doi:10.1190/tle37110802.1
Cai, W., Dou, L., Cao, A., Gong, S., and Li, Z. (2014). Application of seismic velocity tomography in underground coal mines: A case study of yima mining area, henan, China. J. Appl. Geophys. 109, 140–149. doi:10.1016/j.jappgeo.2014.07.021
Chen, Y., Zhang, G., Bai, M., Zu, S., Guan, Z., and Zhang, M. (2019). Automatic waveform classification and arrival picking based on convolutional neural network. Earth Space Sci. 6 (7), 1244–1261. doi:10.1029/2018EA000466
Churcher, P. L., French, P. R., Shaw, J. C., and Schramm, L. L. (1991). “Rock properties of Berea sandstone, Baker dolomite, and Indiana limestone,” in SPE international symposium on oilfield chemistry (Houston: Society of Petroleum Engineers (SPE)).
De Landro, G., Amoroso, O., Russo, G., and Zollo, A. (2020). 4d travel-time tomography as a tool for tracking fluid-driven medium changes in offshore oil–gas exploitation areas. Energies 13 (22), 5878. doi:10.3390/en13225878
Dragonfly (2021). Montreal, Canada: Object research systems (ORS) Inc. Available: http://www.theobjects.com/dragonfly (Accessed September 1, 2021).
Espinoza, D. N., and Santamarina, J. C. (2011). P-wave monitoring of hydrate-bearing sand during CH4–CO2 replacement. Int. J. Greenh. Gas Control 5 (4), 1031–1038. doi:10.1016/j.ijggc.2011.02.006
Falls, S. D., Young, R. P., Carlson, S. R., and Chow, T. (1992). Ultrasonic tomography and acoustic emission in hydraulically fractured Lac du Bonnet grey granite. J. Geophys. Res. Solid Earth 97 (B5), 6867–6884. doi:10.1029/92JB00041
Fortin, J., Stanchits, S., Dresen, G., and Guéguen, Y. (2006). Acoustic emission and velocities associated with the formation of compaction bands in sandstone. J. Geophys. Res. Solid Earth 111 (B10), B10203. doi:10.1029/2005JB003854
Geremia, D., and David, C. (2021). Continuous recording of viscoelastic relaxation processes at a constant ultrasonic frequency due to wave-induced fluid flow in a microporous carbonate rock. Geophys. Res. Lett. 48 (19), e2021GL095244. doi:10.1029/2021GL095244
Grosse, C. U., Ohtsu, M., Aggelis, D. G., and Shiotani, T. (2021). Acoustic emission testing: Basics for research – applications in engineering. Berlin: Springer Nature.
Guo, C., Zhu, T., Gao, Y., Wu, S., and Sun, J. (2020). Aenet: Automatic picking of p-wave first arrivals using deep learning. IEEE Trans. Geoscience Remote Sens. 59 (6), 5293–5303. doi:10.1109/TGRS.2020.3010541
Guo, T. Y., and Zhao, Q. (2022). Acoustic emission characteristics during the microcracking processes of granite, marble and sandstone under mode I loading. Rock Mech. Rock Eng. 55 (9), 5467–5489. doi:10.1007/s00603-022-02937-1
Ingraham, M. D., Issen, K. A., and Holcomb, D. J. (2013). Use of acoustic emissions to investigate localization in high-porosity sandstone subjected to true triaxial stresses. Acta Geotech. 8, 645–663. doi:10.1007/s11440-013-0275-y
Johnson, P. A., Ferdowsi, B., Kaproth, B. M., Scuderi, M., Griffa, M., Carmeliet, J., et al. (2013). Acoustic emission and microslip precursors to stick-slip failure in sheared granular material. Geophys. Res. Lett. 40 (21), 5627–5631. doi:10.1002/2013gl057848
Kim, J. S., Lee, K. S., Cho, W. J., Choi, H. J., and Cho, G. C. (2015). A comparative evaluation of stress–strain and acoustic emission methods for quantitative damage assessments of brittle rock. Rock Mech. Rock Eng. 48 (2), 495–508. doi:10.1007/s00603-014-0590-0
Knuth, M. W., Tobin, H. J., and Marone, C. (2013). Evolution of ultrasonic velocity and dynamic elastic moduli with shear strain in granular layers. Granul. Matter 15 (5), 499–515. doi:10.1007/s10035-013-0420-1
Lei, X. L., Kusunose, K., Nishizawa, O., Cho, A., and Satoh, T. (2000a). On the spatio-temporal distribution of acoustic emissions in two granitic rocks under triaxial compression: The role of pre-existing cracks. Geophys. Res. Lett. 27 (13), 1997–2000. doi:10.1029/1999GL011190
Lei, X. L., Kusunose, K., Rao, M. V. M. S., Nishizawa, O., and Satoh, T. (2000b). Quasi-static fault growth and cracking in homogeneous brittle rock under triaxial compression using acoustic emission monitoring. J. Geophys. Res. Solid Earth 105 (B3), 6127–6139. doi:10.1029/1999JB900385
Lei, X. L. (2017). “Laboratory acoustic emission study review,” in Rock mechanics and engineering. Editor X. T. Feng (Boca Raton, FL: CRC Press), 127–164.
Lockner, D. A., Byerlee, J. D., Kuksenko, V., Ponomarev, A., and Sidorin, A. (1992). “Observations of quasistatic fault growth from acoustic emissions,” in International Geophysics. Editors B. Evans, and T. F. Wong (Cambridge, MA: Academic Press), 3–31.
Lockner, D. A. (1993). The role of acoustic emission in the study of rock fracture. Int. J. Rock Mech. Min. Sci. Geomechanics Abstr. 30 (7), 883–899. doi:10.1016/0148-9062(93)90041-B
Lockner, D. A., Walsh, J. B., and Byerlee, J. D. (1977). Changes in seismic velocity and attenuation during deformation of granite. J. Geophys. Res. 82 (33), 5374–5378. doi:10.1029/JB082i033p05374
Lumley, D. E. (2001). Time-lapse seismic reservoir monitoring. Geophysics 66 (1), 50–53. doi:10.1190/1.1444921
Maxwell, S. C., Rutledge, J., Jones, R., and Fehler, M. (2010). Petroleum reservoir characterization using downhole microseismic monitoring. Geophysics 75 (5), 75A129–75A137. doi:10.1190/1.3477966
Meadows, M. A., and Winterstein, D. F. (1994). Seismic detection of a hydraulic fracture from shear-wave VSP data at Lost Hills Field, California. Geophysics 59 (1), 11–26. doi:10.1190/1.1443523
Modiriasari, A., Bobet, A., and Pyrak-Nolte, L. J. (2017). Active seismic monitoring of crack initiation, propagation, and coalescence in rock. Rock Mech. Rock Eng. 50 (9), 2311–2325. doi:10.1007/s00603-017-1235-x
Nelder, J. A., and Mead, R. (1965). A simplex method for function minimization. Comput. J. 7 (4), 308–313. doi:10.1093/comjnl/7.4.308
Nur, A., and Simmons, G. (1969). Stress-induced velocity anisotropy in rock: An experimental study. J. Geophys. Res. 74 (27), 6667–6674. doi:10.1029/JB074i027p06667
Porritt, R. W., Allen, R. M., and Pollitz, F. F. (2014). Seismic imaging east of the rocky mountains with USArray. Earth Planet. Sci. Lett. 402, 16–25. doi:10.1016/j.epsl.2013.10.034
Pyrak-Nolte, L. J., Myer, L. R., and Cook, N. G. W. (1990). Transmission of seismic waves across single natural fractures. J. Geophys. Res. 95 (B6), 8617. doi:10.1029/JB095iB06p08617
Raeesi, M., Moradzadeh, A., Ardejani, F. D., and Rahimi, M. (2012). Classification and identification of hydrocarbon reservoir lithofacies and their heterogeneity using seismic attributes, logs data and artificial neural networks. J. Petroleum Sci. Eng. 82, 151–165. doi:10.1016/j.petrol.2012.01.012
Ross, Z. E., Meier, M. A., and Hauksson, E. (2018). P wave arrival picking and first-motion polarity determination with deep learning. J. Geophys. Res. Solid Earth 123 (6), 5120–5129. doi:10.1029/2017JB015251
Sayers, C. M., and Kachanov, M. (1995). Microcrack-induced elastic wave anisotropy of brittle rocks. J. Geophys. Res. Solid Earth 100 (B3), 4149–4156. doi:10.1029/94jb03134
Scholz, C. (1968). Experimental study of the fracturing process in brittle rock. J. Geophys. Res. 73 (4), 1447–1454. doi:10.1029/JB073i004p01447
Sharma, B. K., Kumar, A., and Murthy, V. M. (2010). Evaluation of seismic events detection algorithms. J. Geol. Soc. India 75 (3), 533–538. doi:10.1007/s12594-010-0042-8
Sondergeld, C. H., and Estey, L. H. (1981). Acoustic emission study of microfracturing during the cyclic loading of Westerly granite. J. Geophys. Res. Solid Earth 86 (B4), 2915–2924. doi:10.1029/JB086iB04p02915
Stanchits, S., Mayr, S., Shapiro, S., and Dresen, G. (2011). Fracturing of porous rock induced by fluid injection. Tectonophysics 503 (1-2), 129–145. doi:10.1016/j.tecto.2010.09.022
Stanchits, S., Vinciguerra, S., and Dresen, G. (2006). Ultrasonic velocities, acoustic emission characteristics and crack damage of basalt and granite. Pure Appl. Geophys. 163 (5), 975–994. doi:10.1007/s00024-006-0059-5
Thompson, B. D., Young, R. P., and Lockner, D. A. (2009). Premonitory acoustic emissions and stick-slip in natural and smooth-faulted Westerly granite. J. Geophys. Res. Solid Earth 114 (B2), B02205. doi:10.1029/2008JB005753
Vanorio, T., Virieux, J., Capuano, P., and Russo, G. (2005). Three-dimensional seismic tomography from P wave and S wave microearthquake travel times and rock physics characterization of the Campi Flegrei Caldera. J. Geophys. Res. Solid Earth 110 (B3), B03201. doi:10.1029/2004JB003102
Verdon, J. P., Kendall, J. M., and Wüstefeld, A. (2009). Imaging fractures and sedimentary fabrics using shear wave splitting measurements made on passive seismic data. Geophys. J. Int. 179 (2), 1245–1254. doi:10.1111/j.1365-246X.2009.04347.x
Verdon, J. P., and Wüstefeld, A. (2013). Measurement of the normal/tangential fracture compliance ratio (Z<i>N</i>/Z<i>T</i>) during hydraulic fracture stimulation using S-wave splitting data: Measuring ZN/ZT using S-wave splitting. Geophys. Prospect. 61 (1), 461–475. doi:10.1111/j.1365-2478.2012.01132.x
Wang, J., Xiao, Z., Liu, C., Zhao, D., and Yao, Z. (2019). Deep learning for picking seismic arrival times. J. Geophys. Res. Solid Earth 124 (7), 6612–6624. doi:10.1029/2019JB017536
Wang, L., Kwiatek, G., Rybacki, E., Bonnelye, A., Bohnhoff, M., and Dresen, G. (2020). Laboratory study on fluid-induced fault slip behavior: The role of fluid pressurization rate. Geophys. Res. Lett. 47 (6), e2019GL086627. doi:10.1029/2019GL086627
Xie, H. P., Liu, J. F., Ju, Y., Li, J. G., and Xie, L. Z. (2011). Fractal property of spatial distribution of acoustic emissions during the failure process of bedded rock salt. Int. J. Rock Mech. Min. Sci. 48 (8), 1344–1351. doi:10.1016/j.ijrmms.2011.09.014
Ye, Z., and Ghassemi, A. (2020). Heterogeneous fracture slip and aseismic-seismic transition in a triaxial injection test. Geophys. Res. Lett. 47 (14), e2020GL087739. doi:10.1029/2020GL087739
Yuan, S., Liu, J., Wang, S., Wang, T., and Shi, P. (2018). Seismic waveform classification and first-break picking using convolution neural networks. IEEE Geoscience Remote Sens. Lett. 15 (2), 272–276. doi:10.1109/LGRS.2017.2785834
Zheng, J., Lu, J., Peng, S., and Jiang, T. (2018). An automatic microseismic or acoustic emission arrival identification scheme with deep recurrent neural networks. Geophys. J. Int. 212 (2), 1389–1397. doi:10.1093/gji/ggx487
Zhu, W., and Beroza, G. C. (2019). PhaseNet: A deep-neural-network-based seismic arrival-time picking method. Geophys. J. Int. 216 (1), 261–273. doi:10.1093/gji/ggy423
Keywords: acoustic emission, deep neural network, P-wave velocity, acoustic event location, micro-CT imaging, brittle deformation
Citation: Ding J, Clark AC and Vanorio T (2023) Integrating laboratory acoustic measurements, deep neural networks, and micro-CT imaging for characterizing rock brittle deformation. Front. Earth Sci. 11:1052431. doi: 10.3389/feart.2023.1052431
Received: 23 September 2022; Accepted: 02 May 2023;
Published: 11 May 2023.
Edited by:
Alba Zappone, ETH Zürich, SwitzerlandReviewed by:
Polina Lemenkova, Université libre de Bruxelles, BelgiumSerhii Lozovyi, SINTEF Industry, Norway
Copyright © 2023 Ding, Clark and Vanorio. This is an open-access article distributed under the terms of the Creative Commons Attribution License (CC BY). The use, distribution or reproduction in other forums is permitted, provided the original author(s) and the copyright owner(s) are credited and that the original publication in this journal is cited, in accordance with accepted academic practice. No use, distribution or reproduction is permitted which does not comply with these terms.
*Correspondence: Jihui Ding, amlodWlkQHN0YW5mb3JkLmVkdQ==
 Jihui Ding
 Anthony C. Clark
 Tiziana Vanorio