- 1School of Civil Engineering, Southwest Jiaotong University, Chengdu, China
- 2Institute of Mountain Hazard and Environment, Chinese Academy of Sciences, Chengdu, China
The upper reaches of the Jinsha River, with their complex terrain and active tectonic movements, are vulnerable to landslide-induced hazard chain events, which endanger the safety of residents and infrastructure construction. Based on the analysis of the development background of the hazard chain in the upstream area of the Jinsha River, five factors, including the lithology, distance to faults, distance to rivers, peak ground acceleration, and slope degree, were selected to identify the critical landslide-prone areas. Principal component and grey correlation analyses were then conducted to determine the contributions of these different factors. Based on ArcGIS, the study zone was categorized into five classes of landslide susceptibility: very high, high, moderate, low, and very low. The identification of the critical target areas for landslide hazard chain formation showed satisfactory accuracy. The very high- and high-susceptibility areas are concentrated along the Jinsha River. The dynamic process of a typical landslide in a very high-susceptibility area was numerically simulated using OpenLISEM. The high-precision Baige landslide data of the study area were used to calibrate the practicality of the input mass parameters, including cohesion, internal friction angle, D50, and D90. The movement and accumulation processes of a typical landslide were then numerically simulated with the verified data. The entire landslide accumulation covers an area of 0.45
1 Introduction
Due to the compressed active fault zone and severe erosion of the valley shear, the Jinsha River basin exhibits unique fold mountains and deep valley geomorphology (Xu et al., 2018; Zhu et al., 2021). With the complicated lithology and steep slope degree, the upper reaches of the Jinsha River are vulnerable to landslide–dam breach–flood hazard chain events, e.g., the Baige (Fan et al., 2020), Sela (Zhu et al., 2021), Temi (Chen et al., 2021), and Guili (Xu et al., 2022) landslides, which threaten the safety of people and property upstream and downstream (Wei and Siming, 2020; Jin, 2021; Li et al., 2021). Therefore, the identification of critical areas and simulation of the dynamic processes of landslide hazard chain formation is critical in the upstream Jinsha River basin.
Field surveys are exceedingly difficult to perform in this region because the landslide disaster site is in a remote alpine canyon area with a harsh environment and limited access. Thus, high-precision ground observation technologies, including remote sensing, interferometric synthetic aperture radar (InSAR), and light laser detection and ranging (LiDAR), are used to identify landslide hazards (Lu et al., 2019). Moreover, Landsat, ALOS, Quick Bird, and other satellites with high-resolution images have been widely used for landslide identification; however, they only identify landslide hazards with clear deformation (McDonald and Grubbs, 1975; Sato and Harp, 2009; Youssef et al., 2009; García-Davalillo et al., 2014). InSAR with centimeter-high precision and all-weather surface observation technology can perform large-scale landslide identification and monitoring to build a landslide hazard inventory (Woods et al., 2020; Urgilez Vinueza et al., 2022; Zhang et al., 2022). Because of the satellite lateral imaging mode, the terrain may cause geometric distortion of SAR images, including perspective shortening, overlap, and shadow (Jie et al., 2018). LiDAR can not only directly obtain three-dimensional terrain coordinates to provide high-accuracy topographic images but also remove the effective influence of vegetation to obtain true ground elevation data (Gorsevski et al., 2016; Abdulwahid and Pradhan, 2017; Xu et al., 2019). However, LiDAR is not suitable for large-scale disaster identification due to its harsh operating conditions and high costs (Lu et al., 2019). Thus, while high-accuracy remote sensing technology has become an important means to obtain landslide hazard information, the reliability of remote sensing data interpretation and the accessibility and costs of high-precision image data remain issues in landslide risk assessment. In addition to satellite sensing technology, scholars have proposed statistical models for landslide susceptibility assessment, with remarkable results (Song et al., 2012; Xu et al., 2013; Khan et al., 2019; Liu D et al., 2021; Yong et al., 2022). Models such as the information quantity model (Yang et al., 2018), the weight-of-evidence model (Wang et al., 2016), the logistic regression model (Xing et al., 2021), the analytical hierarchic process (Yoshimatsu and Abe, 2006), and the principal component analysis (Chang et al., 2014) have demonstrated excellent accuracy. Based on the rich results in the selection of evaluation factors, the weight of the factor determination, and the construction of the evaluation model, the present study applied mathematical statistics to identify the key target areas of landslide hazards to not only objectively analyze the assessment of regional landslide disaster susceptibility but also the relationships and impact degrees of slope failure factors.
Many numerical simulation tools for the simulation of landslide dynamic processes are effective for the analysis of landslide hazards. Pastor et al. (2021) and Ouyang et al. (2019) used the depth-integrated continuum method for the dynamic simulation of debris and landslides. Based on the discrete element method An et al. (2021) established an adapted Hertz–Mindlin contact model between particles and the ground surface to accurately simulate the landslide dynamic process. Zhang et al. (2012) simulated the entire process of failure and instability of the Jiweishan high-speed remote landslide in Chongqing via PFC 3D software. Smoothed particle hydrodynamics (SPH) based on Lagrangian particle-based meshless methods have been widely employed in applications in geotechnical engineering (Peng et al., 2019; Zhu et al., 2020). The depth-integrated continuum and discrete element methods consider the landslide body as a fluid and can efficiently simulate the landslide motion and accumulation processes. However, they cannot easily simulate the initial failure mechanism and triggering factors such as the erosion and volume expansion processes due to the disaggregation and fragmentation of the rock mass (Wen-Jie et al., 2021). The landslide movement process is affected by many factors, including mass composition, trigger mechanism, and vegetation environment. The above numerical simulation methods do not consider the interaction between the material source and the environment during the movement process. Aiming to precisely assess the landslide dynamic process, the present study used OpenLISEM to perform the numerical simulations. OpenLISEM divides the research area into several grids of equal size; inputs corresponding terrain, vegetation, and material source parameters into different grids; couples the distributed basin hydrological and two-phase flow models; compares the slope, ground roughness, and other parameters of adjacent grids; and simulates disaster processes such as landslides, debris, and flash floods (OpenLISEM manual 2017, https://lisemmodel.com).
The complete geohazard chain includes potential hazards, primary hazards, secondary hazards (series), and hazard-bearing bodies (Peng and Jian, 2021). This study identified potential geatators by hazard susceptibility assessment and researched the dynamic process of the primary hazard by numerical simulation. Based on remote sensing and field investigation data, the weights of the landslide factors were determined via principal component analysis and the grey correlation degree method. A landslide susceptibility evaluation model was then constructed to identify high-susceptibility landslide areas. Based on the vulnerability assessment, the key target areas of landslide hazards were numerically simulated in OpenLISEM to obtain the movement process and accumulation form of landslides, and to provide a reference for a landslide–dam breach–flood disaster chain prevention in the upstream area of the Jinsha River.
2 Study area
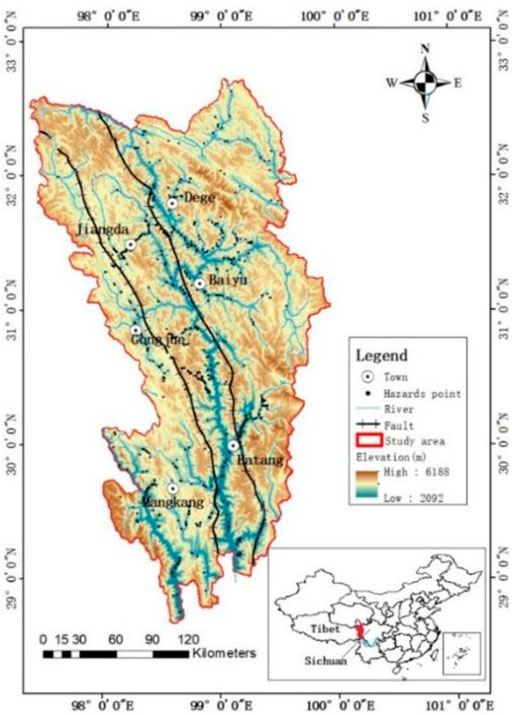
The study area is situated in the upper Jinsha River valley, at the intersection of Tibet and Sichuan, and covers an area of 60,352
The study area has highland climates with an average temperature of -4.9°C–7.8°C. Furthermore, due to the high terrain and strong solar radiation, the area is cold and dry with 53–67% relative humidity, an annual average rainfall of 387.0–657.6 m, and an average of 100.3–169.8 days of precipitation. The rainy season is from May to October, accounting for more than 90% of the annual rainfall. Snow is the main form of precipitation in the region, and the daily rainfall in most areas is 50 mm. Additionally, the vegetation is mainly grassland and swamp meadows (Wu, 2007).
3 Database and method
3.1 Susceptibility assessment
3.1.1 Factor sources
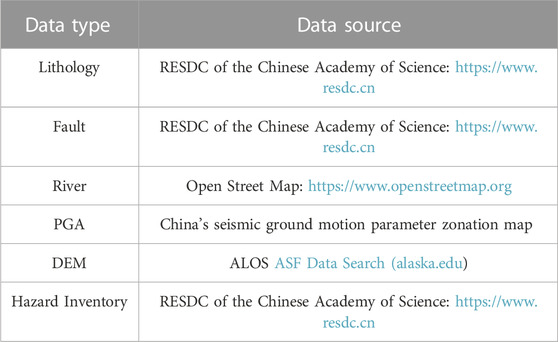
Landslide susceptibility mapping is essential for identifying areas with high landslide risk. In this study, the landslide inventory with a total of 635 hazard points was extracted from the Resource and Environment Science and Data Center (RESDC) of the Chinese Academy of Science. Based on previous research, the specific characteristics of the study region, including lithology, distance to the fault, distance to the river, and peak ground acceleration (PGA), were selected to assess the landslide susceptibility (Table 1). The lithology and fault were obtained from the RESDC of the Chinese Academy of Science, while the river data were obtained from the Open Street Map. The fault and river buffer distances were calculated using the surface analysis tools in ArcGIS. The slope data were extracted from the digital elevation model (DEM) downloaded from the advanced land observation satellite (ALOS) with a resolution of 12.5 m × 12.5 m. The influence degree of seismic intensity was reflected by PGA extracted using the seismic ground motion parameter zonation map of China (GB18306 2015).
3.1.2 Factor classification
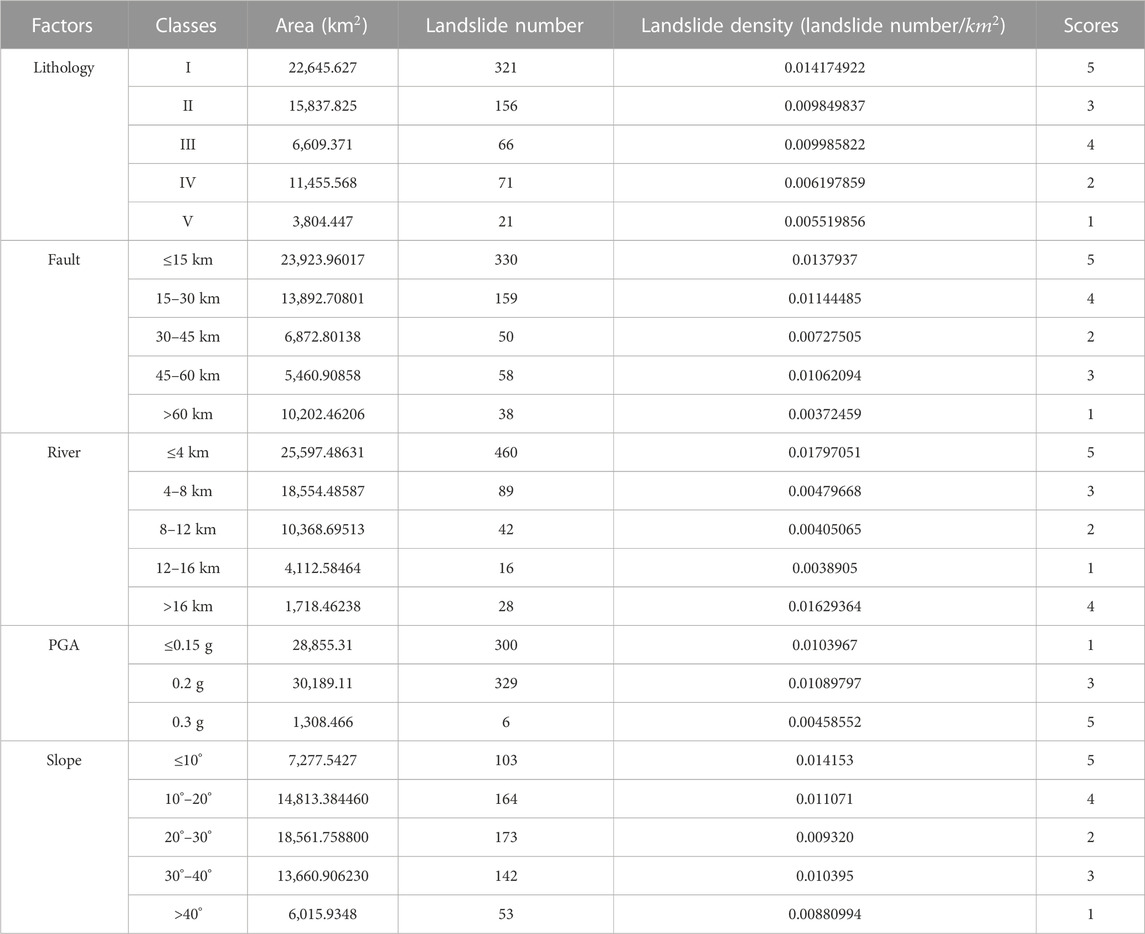
The geographic information system (GIS) was used to show the terrain features of the lithology and other factors. The hazard inventory, combined with the five evaluation factors, was digitized and stored in the GIS. The classification of the five factors in this study is shown in Figure 2. The lithology composition in the study area is sophisticated. Herein, it is divided into five categories: soft rock (I), half-soft rock (II), half-hard rock (III), hard rock (IV), and others (V), which include loose deposits, complex structural surfaces, and unknown rock. Landslides are mainly located in soft rock composed of siltstone, sandstone, etc. because these rocks are vulnerable to external forces (Figure 2A). The faults are densely distributed in the study area. This study selected the Jinsha-Honghe fault as the main research target. The rock near the fault zone is relatively broken and has poor stability. The landslide activity intensity decreases with increasing distance from the fault (Figure 2B). The surface stream deepens in the valley in the study area through erosion and transportation, producing favorable conditions for hazards. More than 50% of the hazards are located within 4 km of the river (Figure 2C). PGA was used to represent the magnitude of the earthquake intensity and was divided into <0.15, 0.2, and 0.3 g. According to the seismic intensity map in the spatial distribution, most landslides are mainly concentrated in areas of high earthquake intensity (Figure 2D). The slope gradient was obtained using the 3D-analysis slope tool in ArcGIS. The landslides are concentrated in regions ranging from 10° to 40° (Figure 2E).
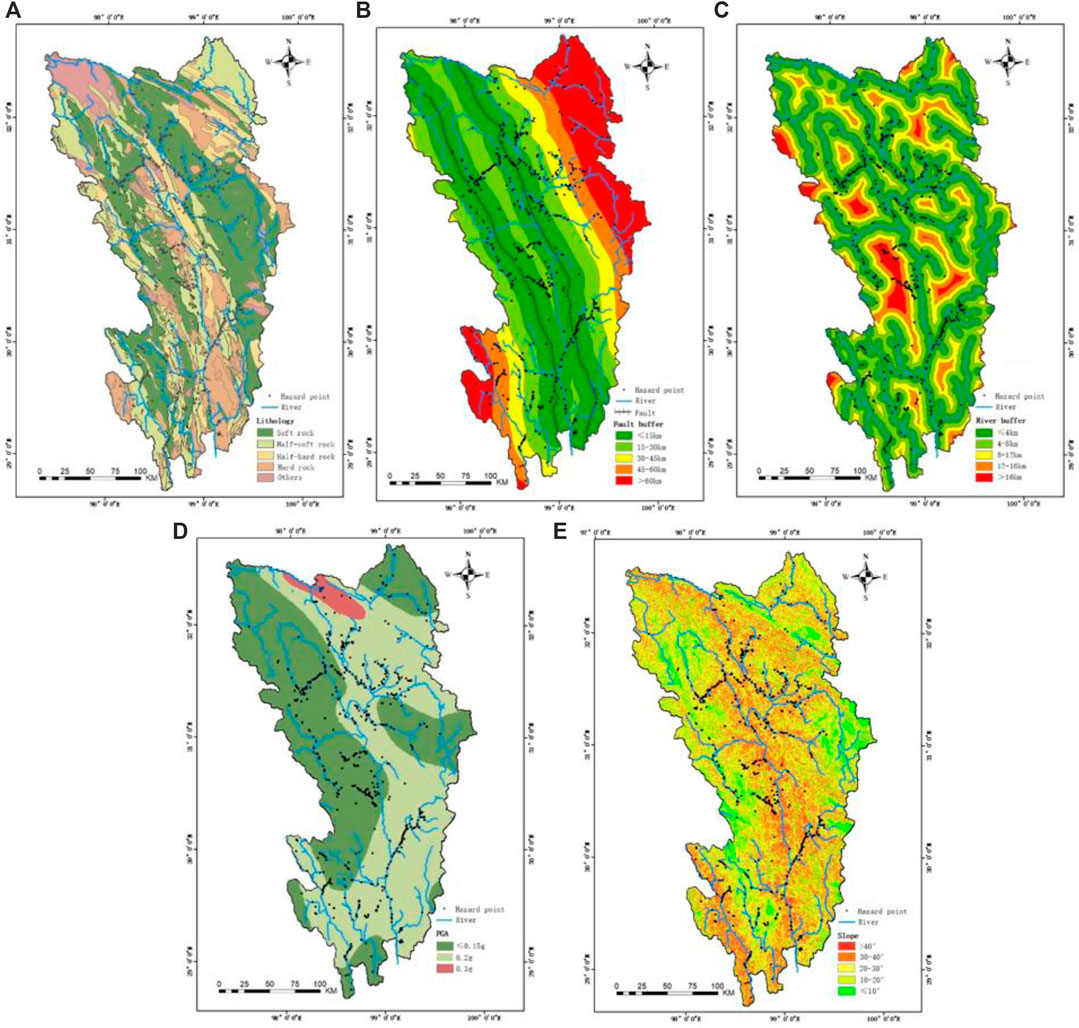
FIGURE 2. Factor distribution in the study area: (A) lithology, (B) fault, (C) river, (D) PGA, and (E) slope.
3.1.3 Factor weight calculations
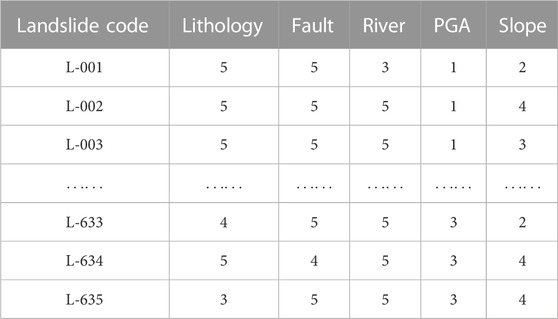
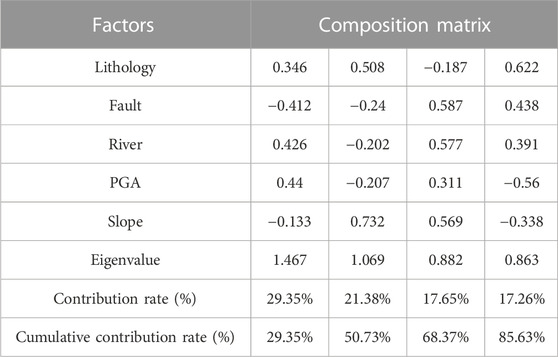
According to the landslide intensities for the selected factors, a score was given to the different intervals of each evaluation factor (Table 2). The discriminant coefficient matrix of the landslide inventory in the study area and factors is shown in Table 3.
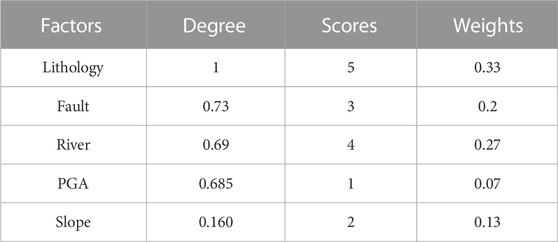
The contribution degrees of the five factors were obtained via principal component analysis (Chang and Tang et al., 2014). The discriminant coefficient matrix (Table 3) was imported into SPSS software for principal component analysis to obtain the contributions of the factors. The first four factors, i.e., lithology, faults, rivers, and PGA, contributed to >80%. Lithology was the most influential factor and was, therefore, selected to determine the contribution of the other factors (Table 4).
The grey correlation analysis (Wei et al., 1998) mainly determines the correlation between the dominant factor and the other four factors. When the variable was transformed into dimensionless data, the outcome was a coefficient matrix of factors and initialized data. From this, the absolute D-value Eq. 1was calculated:
where i=1,2… …m; k=1,2,… …n;
The correlation coefficient of the evaluation factors was calculated using Eq. 3:
where
3.1.4 Model generation
Five-factor raster maps with 12.5 m resolution were constructed using GIS. The values of the factor raster were calculated using the Raster Computing Tool. The final model was established using these factors.
where i = 1, 2……5, R is the value of landslide susceptibility evaluation,
According to the value of R, the susceptibility degree of the study area can be divided into three categories: very low (R ≤ 2), low (2<R ≤ 2.5), moderate (2.5 < R ≤ 3.5), high = (3.5 < R ≤ 4), and very high (R >4) susceptibility.
3.2 Landslide numerical simulation
3.2.1 Theory
To better simulate the dynamic process of critical landslide hazards, a discrete numerical modeling method was applied using the open-source software OpenLISEM, which requires the subdivision of both space and time into a discrete set of locations (https://lisemmodel.com). Originally, OpenLISEM was a physically based numerical model designed to simulate event-based runoff, flooding, and erosion on a catchment scale. By combining solid and water runout flow equations, OpenLISEM includes a series of dynamic hydrological processes, such as precipitation, interception, surface flow, splash detachment, erosion, and sediment transportation. Many revisions and additions have subsequently been incorporated into the OpenLISEM application. OpenLISEM was further developed as a multi-hazard model, including groundwater flow, slope stability, slope failure, mass movements, deposition, entrainment, and earthquake effects (Pudasaini, 2012; Bout et al., 2018; Scaringi et al., 2018). Furthermore, the model incorporates the iterative slope failure method based on a modified infinite slope mode. The conventional infinite slope model predefines the bottom of the soil layer as the potential slip surface, while the iterative method iteratively searches the potential slip surface. The equation for determining the factor of safety (FOS) is
where
The two-phase runout flow within OpenLISEM is a combination of water and solid dynamics (Pudasaini, 2012). Using it, landslides, water flow, and debris flow can be simulated, including their interactions. The full momentum source terms for both the fluid and solid phases are as follows:
where
3.2.2 Data input and calibration
This study ignores the interception model. Therefore, the input data of the OpenLISEM model can be divided into three categories: landcover, mass, and topography parameters.
The landcover parameters include land-use type, vegetation cover (vegc), vegetation height (ch; m), and leaf area index of the plant cover in a grid cell (lai;
Topography parameters such as the slope, sine of slope gradient in the direction of the flow (Gradient), random roughness (RR), local surface drainage direction network (LDD), and main catchment outlet corresponding to LDD (Outlet) can be derived from the DEM using the PCRaster program. Manning’s index, another topography parameter, was obtained using the OpenLISEM Manual (2017), according to land use (Wang, 2018).
The mass parameters numerically used in the simulation include mass depth (mm), initial moisture (-), cohesion (kpa), internal friction angle (radians), porosity (-), density (
where T is the average soil depth (m) and
It is difficult to directly obtain accurate values for the other mass parameters due to the limitations of field testing technology. On October 10 and November 3, 2018, two large landslides near Baige village occurred in the same location on the right bank of the Jinsha River (Figure 5). Many scholars performed field investigations, and research on the slope failure mechanisms and parameters showed inversion in the Baige landslide, which provided a valuable opportunity to adjust parameters (Ouyang et al., 2019; Chen et al., 2021; Xu et al., 2021; Zhou et al., 2020; Zhao et al., 2020; Zhang et al., 2020; Zhou et al., 2022; Liu X et al., 2021; Sun, 2021; Wang et al., 2019). The first Baige landslide was successfully simulated using the OpenLISEM program. The results were consistent with the modeling performed by Ouyang et al., 2019 (Figure 3). The appropriate parameters were obtained by numerically simulating the first Baige landslide event, as shown in Table 6.
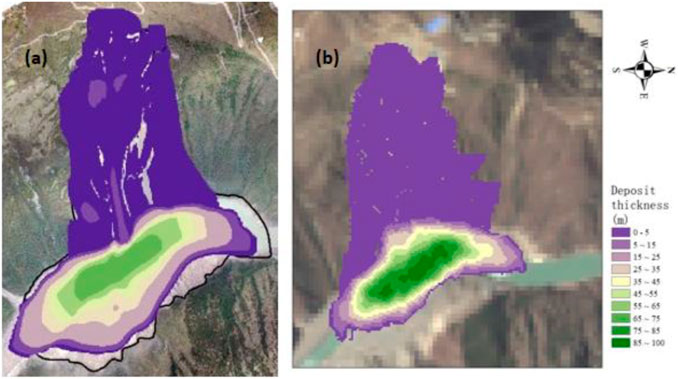
FIGURE 3. Deposit thickness of the first Baige landslide: (A) actual result and (B) numerical simulation.
4 Results
4.1 Critical landslide identification
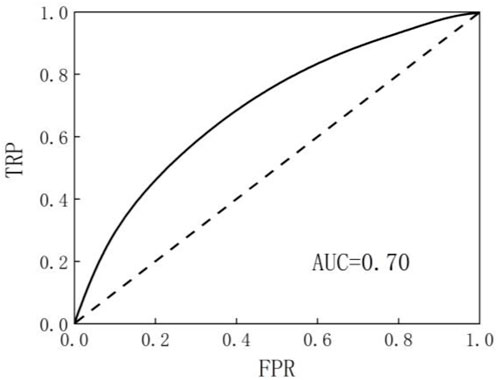
To identify the critical areas for landslide hazard chains, factors such as lithology, fault, river, PGA, and slope were selected for the landslide susceptibility analyses. The five landslide factors were weighed via principal component and grey correlation analyses. Table 5 shows that lithology has the greatest impact on the landslide hazard chain, with a weight value of 0.33, while PGA has the least impact, with a weight value of 0.07. Fault, river, and slope have weights of 0.2, 0.27, and 0.13, respectively. Consequently, the R-value reflecting the landslide susceptibility ranges from 1.33 to 5, which is classified into five groups (Table 7). Very high and high susceptibility areas account for 45.42% of the total area. However, the area accounts for 75.28% of the landslides. To verify the reliability and applicability of the model for the vulnerability evaluation of landslide hazard points in the study area, ROC (receiver operating characteristic) curve and AUC (area under the curve) values were selected for testing. The ROC curve is an effective method to evaluate the performance of the classification algorithm; that is, the relationship between the simulated and sampled values. The horizontal axis is the cumulative value of the false positive rate (FPR), which indicates the proportion of susceptible areas, and the vertical axis is the true positive rate (TPR), which indicates the cumulative value of the proportion of disaster points. The AUC value represents the area between the ROC curve and the abscissa axis and, with values in the range of [0.5,1], it indicates the good fitting effect of the model on the processed data. Figure 4 shows that the AUC value of this model is 0.70.
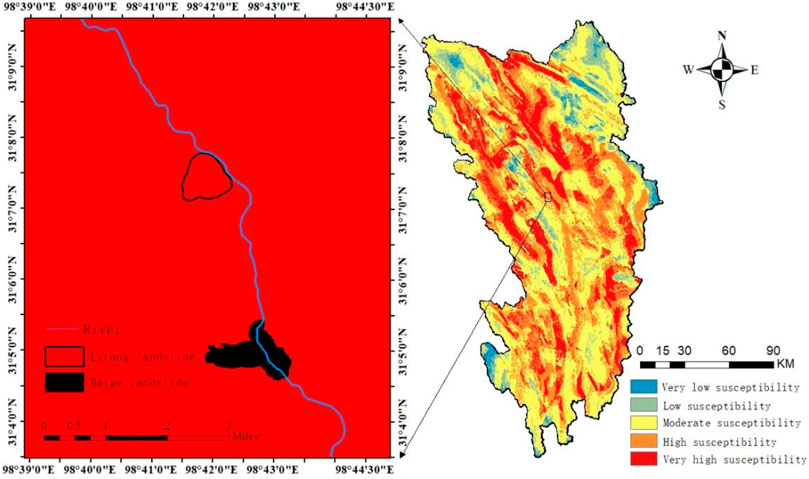
These results demonstrated the high evaluation accuracy of the susceptibility assessment model. The landslide susceptibility distribution map in the Jinsha river upstream is shown in Figure 5. The very low and low susceptibility areas are mainly located in the northeast and southwest of the study area, mainly covering the Dege and Mangkang counties. The moderate susceptibility area is very dispersed and primarily located in central Batang county and the western area of Dege county. The very high and high susceptibility areas with the largest floor areas are located near the main stream and tributaries of the Jinsha River.
Based on the susceptibility assessment results, the Litang landslide area with very high susceptibility was selected as a critical hazard for the numerical prediction simulation (Figure 6). The landslide shape was obtained from Cui et al. (2020).
4.2 Dynamic numerical simulation
The Litang landslide, with an area of 1.32
According to the simulation results, Figure 7, which is plotted at 20s intervals, displays the entire dynamic process of the landslide from startup to relative stability, which occurs in approximately 100 s. At the initial stage of the landslide dynamic process, the rock mass encounters stability failure and begins to slide along the bedrock surface. From time t = 0–20 s, the landslide body slides downstream in the northwest direction with an average velocity of about 12 m/s (Figure 7A). From t = 20–40 s, the landslide movement is uniform with an average velocity of 15 m/s (Figure 7B). The mass at the front edge of the landslide reaches the Jinsha River at t = 40 s. The main acceleration stage refers to the period from t = 40–80 s, and the peak value of the velocity reaches approximately 59 m/s (Figure 7C). During this period, the rock mass is divided into two parts,i.e., upstream and downstream, due to the influence of the watershed in the central section of the landslide. The deceleration stage refers to the period between t = 80–100 s Figure 7D). During this stage, the average velocity of the rock mass near the upstream part approaches zero, while the average velocity of the rock mass near the downstream part is <10 m/s. Simultaneously, some of the mass materials reach the Jinsha River, and the upstream part of the mass begins to form a barrier dam. When t = 100 s, the accumulation stage is complete, and the landslide nearly stops. A large volume of the mass is deposited in the valley within this period (Figure 7E).
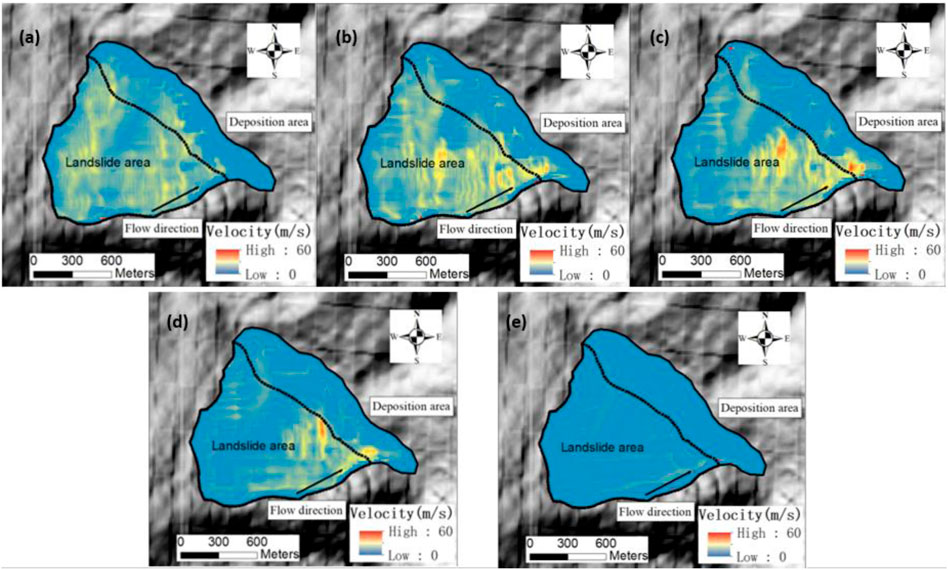
FIGURE 7. Velocity of the landslide movement: (A) t = 20 s, (B) t = 40 s, (C) t = 60 s, (D) t = 80 s, and (E) t = 100 s.
As shown in Figure 8, the entire landslide dam covers an area of 0.45
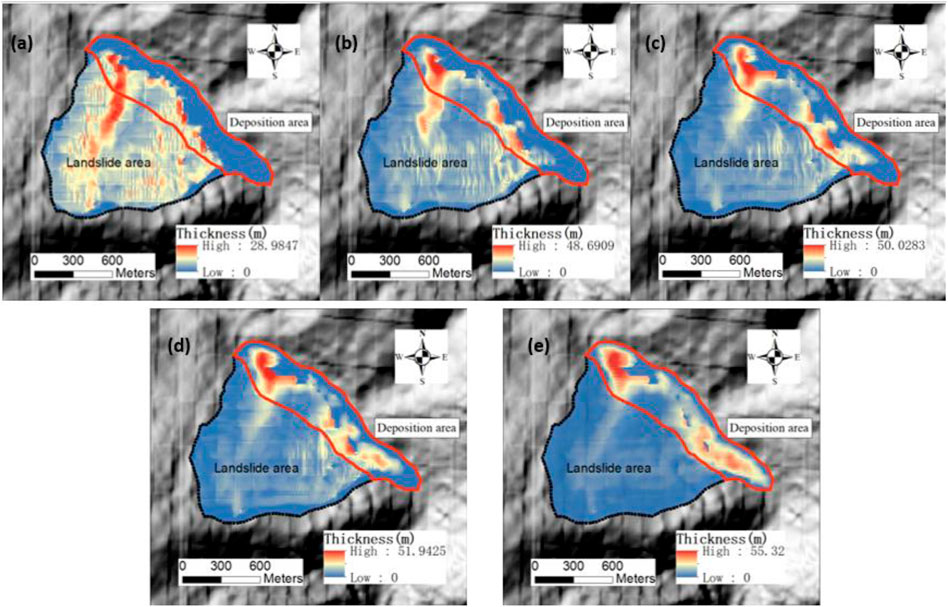
FIGURE 8. Thickness of the landslide movement: (A) t = 20 s, (B) t = 40 s, (C) t = 60 s, (D) t = 80 s, and (E) t = 100 s.
5 Discussion and conclusion
This study used susceptibility assessment to identify an area with high susceptibility for a landslide, which was numerically simulated using an OpenLISEM model, to provide a reference for geological hazard prevention in the upper reaches of the Jinsha River.
For susceptibility assessment, the landslide inventory and five hazard factors, including lithology, fault, river, PGA, and slope data, were digitalized and categorized in the ArcGIS model. Based on the landslide intensity in the classification of the five factors, the discriminant coefficient matrix of landslides in the study area was constructed. Principal component and grey correlation analyses were performed to calculate the weights of the factors, which indicated that lithology had the largest impact on landslides. Furthermore, an assessment model was established. The susceptibility results indicated that the high-susceptibility zone accounts for 45.42% of the total area but comprises 75.28% of the landslide numbers, which are located near the main stream and tributaries of the Jinsha River. Therefore, the susceptibility map not only can be used as a basic tool for critical landslide identification but also helps in land use planning. A lack of accurate factor measurements may affect the precision of the factor data. Despite the limitations mentioned above, the ROC curve results showed that the proposed method has the potential for risk reduction in the study area. Moreover, we performed susceptibility analysis for one model. Quantitative and qualitative models are increasingly applied to research on landslide susceptibility, with continued improvements. Landslide hazard data provide important information for susceptibility assessment. However, due to technical limitations, additional research is needed on hazard risk evaluation in areas lacking landslide hazard data.
According to the susceptibility assessment results, the Litang landslide from the high-susceptibility area was selected as a typical hazard for simulation by OpenLISEM. Using the landslide that occurred in Baige on October 10, 2018, as an example, the mass parameters were calibrated to be inconsistent with the movement of the Baige landslide. Then, the mass, topography, and landcover parameters were input into OpenLISEM. The landslide dynamic process simulation was completed in approximately 100 s and comprised four stages: initial start-up, acceleration, deceleration, and accumulation. In the acceleration period, the landslide body was divided into two parts due to the terrain. The entire deposition covered an area of 0.45
Data availability statement
The original contributions presented in the study are included in the article/supplementary material. Further inquiries can be directed to the corresponding author.
Author contributions
YS performed the landslide identification and landslide numerical simulation, analyzed the results, and wrote the manuscript. HD designed the research study and acquired funding. CT provided and updated the data used in this study. BL guided the landslide parameter calibration. All authors contributed to the article and approved the submitted version.
Funding
This research was supported by the Second Tibetan Plateau Scientific Expedition and Research Program (STEP) (grant no. 2019QZKK0906).
Conflict of interest
The authors declare that the research was conducted in the absence of any commercial or financial relationships that could be construed as a potential conflict of interest.
The reviewer KH declared a shared affiliation with authors YS, HD, and BL to the handling editor at the time of review.
Publisher’s note
All claims expressed in this article are solely those of the authors and do not necessarily represent those of their affiliated organizations, or those of the publisher, the editors, and the reviewers. Any product that may be evaluated in this article, or claim that may be made by its manufacturer, is not guaranteed or endorsed by the publisher.
References
Abdulwahid, W. M., and Pradhan, B. (2017). Landslide vulnerability and risk assessment for multi-hazard scenarios using airborne laser scanning data (LiDAR). Landslides 14, 1057–1076. doi:10.1007/s10346-016-0744-0
An, H., Ouyang, C., and Zhou, S. (2021). Dynamic process analysis of the Baige landslide by the combination of DEM and long-period seismic waves. Landslides 18, 1625–1639. doi:10.1007/s10346-020-01595-0
Bai, Y.-J., Li, M.-H., Wang, D.-H., and Gao, Y.-C. (2014). Characteristics and disastrous rule research of geohazards in batang county, the middle reaches of Jinsha river. Chin. J. Geol. Hazard Control 25 (2), 103–109. doi:10.16031/j.cnki.issn.1003-8035.2014.02.018
Bout, B., Lombardo, L., van Westen, C. J., and Jetten, V. G. (2018). Integration of two-phase solid fluid equations in a catchment model for flashfloods, debris flows and shallow slope failures. Environ. Model. Softw. 105, 1–16. doi:10.1016/j.envsoft.2018.03.017
Chang, M., Tang, C., Zhang, D. D., and Ma, G. c. (2014). Debris flow susceptibility assessment using a probabilistic approach: Acase study in the longchi area, sichuan province, China. J. Mt. Sci. 11, 1001–1014. doi:10.1007/s11629-013-2747-9
Chen, J., Cui, Z., Chen, R., and Zheng, X. (2021). The origin and evolution the Temi paleolandslide-dammed lake in the upper Jinsha River. Earth Sci. Front. 28 (2), 85–93.
Chen, Z., Zhou, H., Ye, F., Liu, B., and Fu, W. (2021). The characteristics, induced factors, and formation mechanism of the 2018 Baige landslide in Jinsha River, Southwest China. Catena 203, 105337. doi:10.1016/j.catena.2021.105337
Choudhury, B. J., Ahmed, N. U., Idso, S. B., Reginato, R. J., and Daughtry, C. S. (1994). Relations between evaporation coefficients and vegetation indices studied by model simulations. Remote Sens. Environ. 50 (1), 1–17. doi:10.1016/0034-4257(94)90090-6
Choudhury, B. J. (1987). Relationships between vegetation indices, radiation absorption, and net photosynthesis evaluated by a sensitivity analysis. Remote Sens. Environ. 22 (2), 209–233. doi:10.1016/0034-4257(87)90059-9
Cui, Y., Bao, P., Xu, C., Fu, G., Jiao, Q., Luo, Y., et al. (2020). A big landslide on the Jinsha River, Tibet, China: Geometric characteristics, causes, and future stability. Nat. Hazards 104, 2051–2070. doi:10.1007/s11069-020-04261-9
Cui, P., and Guo, J. (2021). Evolution models, risk prevention and control countermeasures of the valley disaster chain. Adv. Eng. Sci. 53 (3), 5–18.
Fan, X., Yang, F., Siva Subramanian, S., Xu, Q., Feng, Z., Mavrouli, O., et al. (2020). Prediction of a multi-hazard chain by an integrated numerical simulation approach: The baige landslide, Jinsha River, China. Landslides 17, 147–164. doi:10.1007/s10346-019-01313-5
García-Davalillo, J. C., Herrera, G., Notti, D., Strozzi, T., and Alvarez-Fernandez, I. (2014). DInSAR analysis of ALOS PALSAR images for the assessment of very slow landslides: The tena valley case study. Landslides 11, 225–246. doi:10.1007/s10346-012-0379-8
Gorsevski, P. V., Brown, M. K., Panter, K., Onasch, C. M., Simic, A., and Snyder, J. (2016). Landslide detection and susceptibility mapping using LiDAR and an artificial neural network approach: A case study in the cuyahoga valley national park, Ohio. Landslides 13, 467–484. doi:10.1007/s10346-015-0587-0
Jie, D., Liao, M., Qiang, X., Zhang, L., Tang, M., and Gong, J. (2018). Detection and displacement characterization of landslides using multi-temporal satellite SAR interferometry: A case study of danba county in the dadu River basin. Eng. Geol. 240 (5), 94–109.
Jin, J,J. (2021). Study on the development characteristics and stability of the Xiongba giant ancient landslide in the Jinshajiang Fault Zone. A dissertation for maser degree. Beijing: Chinese academy of geological sciences.
Khan, H., Shafique, M., Khan, M. A., Bacha, M. A., Shah, S. U., and Calligaris, C. (2019). Landslide susceptibility assessment using Frequency Ratio, a case study of northern Pakistan. Egypt. J. Remote Sens. Space Sci. 22 (1), 11–24. doi:10.1016/j.ejrs.2018.03.004
Li, X., Guo, C., Yang, Z., Wei, L., Ruian, W., Jijun, J., et al. (2021). Development characteristics and formation mechanism of the xiongba giant ancient landslide in the jinshajiang tectonic zone. Geoscience 35 (01), 47.
Liu, D., Cui, Y., Wang, H., Jin, W., Wu, C., Bazai, N. A., et al. (2021). Assessment of local outburst flood risk from successive landslides: Case study of Baige landslide-dammed lake, upper Jinsha river, eastern Tibet. J. Hydrology 599, 126294. doi:10.1016/j.jhydrol.2021.126294
Liu, X., Su, P., Li, Y., Zhang, J., and Yang, T. (2021). Susceptibility assessment of small, shallow and clustered landslide. Earth Sci. Inf. 14, 2347–2356. doi:10.1007/s12145-021-00687-2
Lu, H., Li, W., Xu, Q., Dong, X., Dai, C., and Wang, D. (2019). Early detection of landslides in the upstream and downstream areas of the baige landslide, the Jinsha River based on optical remote sensing and InSAR technologies. Geomatics Inf. Sci. Wuhan Univ. 44 (09), 1342–1354. doi:10.13203/j.whugis20190086
McDonald, H. C., and Grubbs, R. S. (1975). Landsat imagery analysis: An aid for predicting landslide prone areas for highway construction. Houston, Texas, USA: NASA Earth Resource Symposium.
Ouyang, C., An, H., Zhou, S., Wang, Z., Su, P., Wang, D., et al. (2019). Insights from the failure and dynamic characteristics of two sequential landslides at Baige village along the Jinsha River, China. Landslides 16, 1397–1414. doi:10.1007/s10346-019-01177-9
Pastor, M., Tayyebi, S. M., Stickle, M. M., Yague, A., Molinos, M., Navas, P., et al. (2021). A depth integrated, coupled, two-phase model for debris flow propagation. Acta Geotech. 16, 2409–2433. doi:10.1007/s11440-020-01114-4
Peng, C., Wang, S., Wu, W., Yu, H. s., and Chen, J. (2019). Loquat: An open-source GPU-accelerated SPH solver for geotechnical modeling. Acta Geotech. 14, 1269–1287. doi:10.1007/s11440-019-00839-1
Pudasaini, S. (2012). A general two-phase debris flow model. J. Geophys. Research-Solid Earth 117 (3). doi:10.1029/2011JF002186
Sato, H. P., and Harp, E. L. (2009). Interpretation of earthquake-induced landslides triggered by the 12 May 2008, M7.9 Wenchuan earthquake in the Beichuan area, Sichuan Province, China using satellite imagery and Google Earth. Landslides 6, 153–159. doi:10.1007/s10346-009-0147-6
Scaringi, G., Fan, X., Xu, Q., Liu, C., Ouyang, C., Domenech, G., et al. (2018). Some considerations on the use of numerical methods to simulate past landslides and possible new failures: The case of the recent xinmo landslide (sichuan, China). Landslides 15, 1359–1375. doi:10.1007/s10346-018-0953-9
Song, Y., Gong, J., Gao, S., Wang, D., Cui, T., Li, Y., et al. (2012). Susceptibility assessment of earthquake-induced landslides using bayesian network: A case study in beichuan, China. Comput. Geosciences 42, 189–199. doi:10.1016/j.cageo.2011.09.011
Sun, L. (2021). “Rapid information perception and calculation method of landslide barrier body in alpine and gorge region,” in 2021 2nd International Conference on Artificial Intelligence and Information Systems, 1–7.
Tang, C., Zhu, J., Chang, M., Ding, J., and Qi, X. (2012). An empirical–statistical model for predicting debris-flow runout zones in the Wenchuan earthquake area. Quat. Int. 250, 63–73. doi:10.1016/j.quaint.2010.11.020
Urgilez Vinueza, A., Handwerger, A. L., Bakker, M., and Bogaard, T. (2022). A new method to detect changes in displacement rates of slow-moving landslides using InSAR time series. Landslides 19, 2233–2247. doi:10.1007/s10346-022-01913-8
Wang, F. (2018). The research of numerical simulation on the initiation and run-out scale of post-earthquake debris flow based on OpenLISEM. Chengdu: Chengdu University of Technology.
Wang, G., Han, L., Tang, X., and Jin, Z. (2012). Temporal and spatial variation of vegetation in the jinsha river basin. Resour. Environ. Yangtze Basin 21 (10), 1191–1196.
Wang, K., Guo, C., Ma, S., Liu, X., and Niu, R. (2016). Landslide susceptibility evaluation based on weight-of-evidence modeling in the xianshuihe fault zone, east Tibetan plateau. Geoscience 30 (03), 705–715.
Wang, L., Wen, M., Feng, Z., Sun, W., Wei, Y., Li, J., et al. (2019). Researches on the baige landslide at jinshajiang river, Tibet, China. Chin. J. Geol. Hazard Control 30 (01), 1–9. doi:10.16031/j.cnki.issn.1003-8035.2019.01.01
Wei, L. I. U., and Siming, H. E. (2020). Numerical simulation of the evolution process of disaster chain induced by potential landslide in Woda of Jinsha River basin[J]. Adv. Eng. Sci. 52 (2), 38–46.
Wei, Y., Xie, Y., and Wu, Y. (1998). Applications of relativity analysis method and fuzzy synthetical assessment method in classification of dangerous degree of debris flow. J. Nat. Disasters 7 (2), 112–120.
Woods, A., Hendry, M. T., Macciotta, R., Stewart, T., and Marsh, J. (2020). GB-InSAR monitoring of vegetated and snow-covered slopes in remote mountainous environments. Landslides 17, 1713–1726. doi:10.1007/s10346-020-01408-4
Wu, L. (2007). Research and detect on geological disasters the upriver of Jin sha jiang by remote sensing and GIS. Hongshan: China University of Geosciences.
Xing, X., Wu, C., Li, J., Li, X., Zhang, L., and He, R. (2021). Susceptibility assessment for rainfall-induced landslides using a revised logistic regression method. Nat. Hazards 106, 97–117. doi:10.1007/s11069-020-04452-4
Xu, L., Chang, M., Wu, B., Liu, P., and Zhou, C. (2022). Development characteristics and movement process of Guili landslide in Jinsha River. J. Disaster Prev. Mitig. Eng. 2022, 1–9. doi:10.13409/j.cnki.jdpme.20210816001
Xu, Q., Dong, X., and Li, W. (2019). Integrated space-air-ground early detection, monitoring and warning system for potential catastrophic geohazards. Geomatics Inf. Sci. Wuhan Univ. 44 (7), 957–966.
Xu, Q., Zheng, G., Li, W., He, C., Dong, X., Guo, C., et al. (2018). Study on successive landslide damming events of Jinsha River in baige village on october 11 and november 3. J. Eng. Geol. 26 (6), 1534–1551. doi:10.13544/j.cnki.jeg.2018-406
Xu, W., Yu, W., Jing, S., Zhang, G., and Huang, J. (2013). Debris flow susceptibility assessment by GIS and information value model in a large-scale region, Sichuan Province (China). Nat. Hazards 65 (3), 1379–1392. doi:10.1007/s11069-012-0414-z
Xu, W. J., Xu, Q., Liu, G. Y., and Xu, H. Y (2021). A novel parameter inversion method for an improved DEM simulation of a river damming process by a large-scale landslide. Eng. Geol. 293, 106282. doi:10.1016/j.enggeo.2021.106282
Yang, G. Y., Zhou, W., and Fang, J. Y. (2018). Assessment of landslide susceptibility based on information quantity model and data normalization. J. Geoinformation Sci. 20 (5), 674–683. doi:10.12082/dqxxkx.2018.170535
Yong, C., Jinlong, D., Fei, G., Bin, T., Tao, Z., Hao, F., et al. (2022). Review of landslide susceptibility assessment based on knowledge mapping. Stoch. Environ. Res. Risk Assess. 36, 2399–2417. doi:10.1007/s00477-021-02165-z
Yoshimatsu, H., and Abe, S. (2006). A review of landslide hazards in Japan and assessment of their susceptibility using an analytical hierarchic process (AHP) method. Landslides 3, 149–158. doi:10.1007/s10346-005-0031-y
Youssef, A. M., Maerz, N. H., and Hassan, A. M. (2009). Remote sensing applications to geological problems in Egypt: Case study, slope instability investigation, sharm el-sheikh/ras-nasrani area, southern sinai. Landslides 6, 353–360. doi:10.1007/s10346-009-0158-3
Zhang, C., Li, Z., Yu, C., Chen, B., Ding, M., Zhu, W., et al. (2022). An integrated framework for wide-area active landslide detection with InSAR observations and SAR pixel offsets. Landslides 19, 2905–2923. doi:10.1007/s10346-022-01954-z
Zhang, L., Tang, H., and Xiong, C., (2012). Movement process simulation of high-speed long-distance Jiweishan landslide with PFC3D. Chin. J. Rock Mech. Eng. 31 (1), 2601–2611. (in Chinese).
Zhang, Y., Ba, R., Ren, S., and Li, Z. (2020). An analysis of geo-mechanism of the baige landslide in Jinsha River, Tibet. Geol. China 47 (6), 1637–1645. (in Chinese).
Zhao, C., Fan, X., Yang, F., Zhou, L., and Guo, C. (2020). Movement of baige landslide in Jinsha river and prediction of potential unstable rock mass. Sci. Technol. Eng. 20 (10), 3860–3867.
Zhou, S., Ouyang, C., and Huang, Y. (2022). An InSAR and depth-integrated coupled model for potential landslide hazard assessment. Acta Geotech. 17, 3613–3632. doi:10.1007/s11440-021-01429-w
Zhou, Y., Qi, S., Wang, L., Chen, M., Xie, C., and Zhou, J. (2020). Instability analysis of a quaternary deposition slope after two sudden events of river water fluctuations. Eur. J. Environ. Civ. Eng. 2020, 1–19. doi:10.1080/19648189.2020.1763849
Zhu, L., Liang, H., He, S. M., Liu, W., Zhang, Q., and Li, G. (2020). Failure mechanism and dynamic processes of rock avalanche occurrence in Chengkun railway, China, on August 14, 2019. Landslides 17, 943–957. doi:10.1007/s10346-019-01343-z
Keywords: landslide, susceptibility assessment, OpenLISEM, numerical simulation, Jinsha River
Citation: Song Y, Deng H, Tang C and Li B (2023) Critical area identification and dynamic process simulation for landslide hazard chain formation in the upstream Jinsha River. Front. Earth Sci. 11:1051913. doi: 10.3389/feart.2023.1051913
Received: 23 September 2022; Accepted: 01 March 2023;
Published: 22 March 2023.
Edited by:
Wen Nie, Jiangxi University of Science and Technology, ChinaReviewed by:
Chaoying Zhao, Chang’an University, ChinaKun He, Southwest Jiaotong University, China
Bouhadad Youcef, National Earthquake Engineering Center (CGS), Algeria
Copyright © 2023 Song, Deng, Tang and Li. This is an open-access article distributed under the terms of the Creative Commons Attribution License (CC BY). The use, distribution or reproduction in other forums is permitted, provided the original author(s) and the copyright owner(s) are credited and that the original publication in this journal is cited, in accordance with accepted academic practice. No use, distribution or reproduction is permitted which does not comply with these terms.
*Correspondence: Hongyan Deng, YW5uZWRlbmdAc3dqdHUuZWR1LmNu
 Yixian Song
 Hongyan Deng
 Chenxiao Tang2
 Bokai Li